introduction - philippine commission on womenlibrary.pcw.gov.ph/sites/default/files/poverty...
TRANSCRIPT

1

2
Introduction
It has been said that “poverty has a woman’s face.” The National Statistics Office (NSO) has revealed three years ago that the women’s sector is the most impoverished sector. Impoverished means that individuals and families cannot afford to provide in a sustained manner for their minimum basic needs for food, health, education, housing and other social amenities. With the blitz of the global financial crisis, the women’s economic condition issue needs to be documented more. As one of the poorest sectors in society, there is a need to look into the plight of the marginalized women since they are the most affected by the crisis. They are the ones who do not have a social security to fall back on. They are the ones who have to work doubly hard, accepting any work available regardless of the work conditions. So while the government has downplayed the effect of the crisis to the country, and focus instead on other matters like pushing for charter change, the Center for Women’s Resources (CWR) deemed it necessary to have a picture of women’s poverty status at the community level and to have a detailed information on household economics – household income and expenditure, coping mechanisms of households or families and to know how the Filipino women are faring in these dire times. The survey instrument composed of indicators of living standards for the households and household members such as income and expenditure for food, fuel for cooking, rent, housing tenure, access to electricity and water and other expenditure of women from urban and rural poor communities.
3
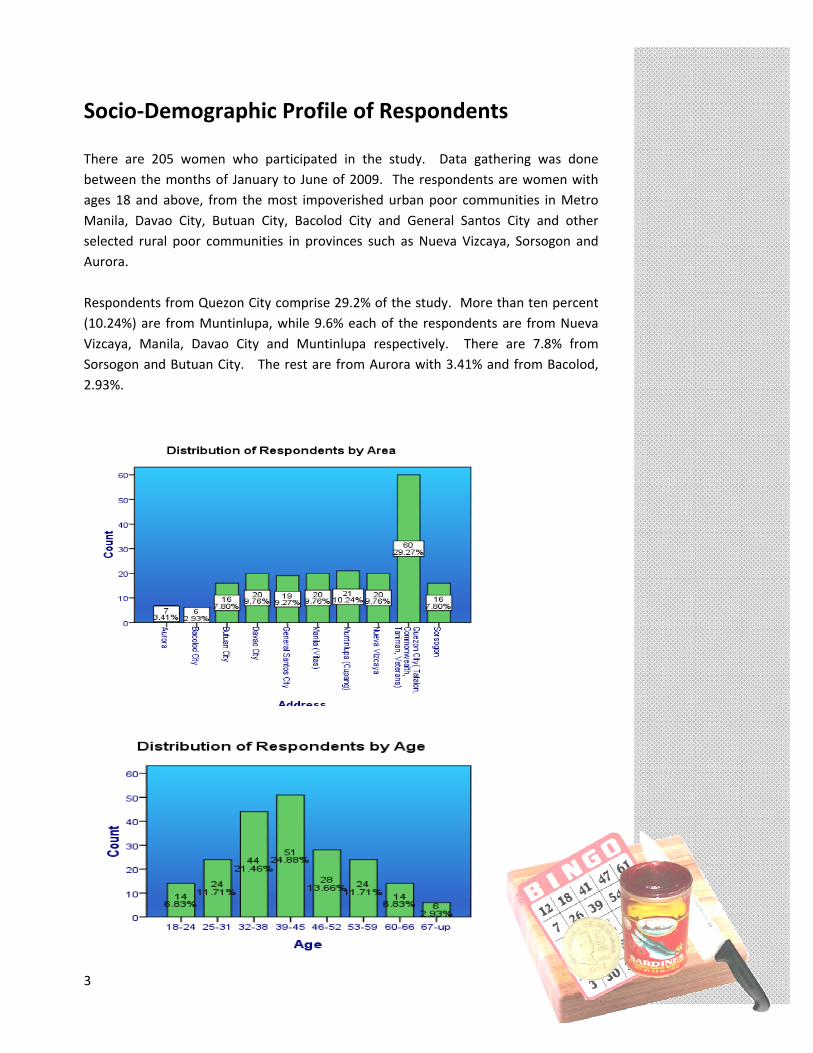
Socio‐Demographic Profile of Respondents There are 205 women who participated in the study. Data gathering was done between the months of January to June of 2009. The respondents are women with ages 18 and above, from the most impoverished urban poor communities in Metro Manila, Davao City, Butuan City, Bacolod City and General Santos City and other selected rural poor communities in provinces such as Nueva Vizcaya, Sorsogon and Aurora. Respondents from Quezon City comprise 29.2% of the study. More than ten percent (10.24%) are from Muntinlupa, while 9.6% each of the respondents are from Nueva Vizcaya, Manila, Davao City and Muntinlupa respectively. There are 7.8% from Sorsogon and Butuan City. The rest are from Aurora with 3.41% and from Bacolod, 2.93%.

4
Most of the respondents are between the ages 39‐45 and they comprise 24.8% of the population of the study, followed by women between the ages 32‐38 with 21.46% and those with ages 46‐52 with 13.6%. Seventy‐eight percent (78%) of the women respondents are married, while 10.24% are widowed and 4.39% are separated. Most of the respondents reported that they have three or less children in the family. Nineteen percent (19%) of the respondents have three children while 17.07% have two and 13.7% of the respondents have one child.

5
Employment of Household
Most of the women are housewives, comprising 45.85% of the total respondents. Almost 12% engaged in service work like street sweeping, doing laundry or ironing clothes or work as a massage attendant or as a waitress. Some 11.2% of the respondents have micro business or enterprise like sari‐sari stores, laundry shop, billiard place and other micro enterprise. There are 10.73% who are vendors of different merchandise like food, fruits and vegetables, fish, pranela or face towel, cigarettes and hats. The others are distributed to other employment sectors. But majority can be classified under the informal sector such as own‐account workers (scavengers, vendors, hosting bingo games or nagpapabinggo, bet collector or nagpapataya ng “ending,” high‐speed sewers) and non‐regular domestic workers or pa‐extra‐extra (as laundrywomen or cleaners) and unpaid family labor (housekeepers). Others are employed by the government like street sweepers, community workers and teachers.
6
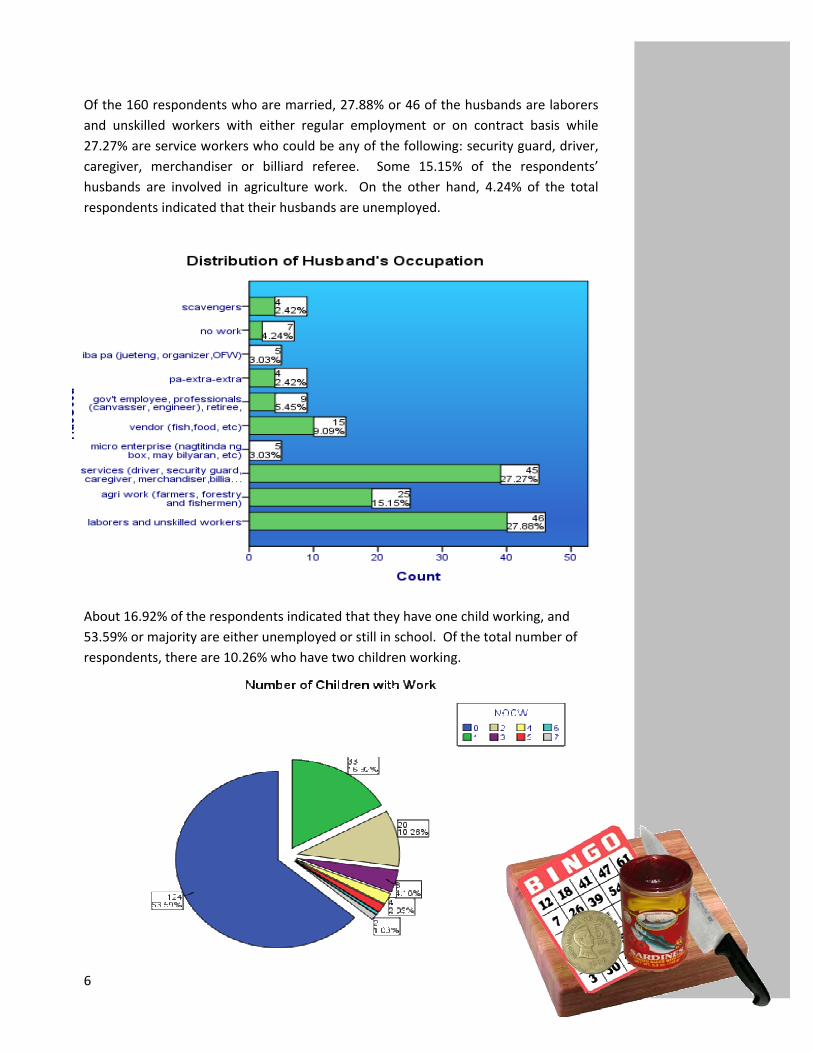
Of the 160 respondents who are married, 27.88% or 46 of the husbands are laborers and unskilled workers with either regular employment or on contract basis while 27.27% are service workers who could be any of the following: security guard, driver, caregiver, merchandiser or billiard referee. Some 15.15% of the respondents’ husbands are involved in agriculture work. On the other hand, 4.24% of the total respondents indicated that their husbands are unemployed.
About 16.92% of the respondents indicated that they have one child working, and 53.59% or majority are either unemployed or still in school. Of the total number of respondents, there are 10.26% who have two children working.

7
Income
Majority or 48.73% of the women respondents do not have an income while 15.23% earned PhP50‐PhP100 a day and 11.66% earned PhP50‐below daily. There are 7.61% of the respondents who earned PhP101‐PhP150 and PhP151‐PhP200 respectively. The others are distributed thinly across higher income brackets from PhP201 up to PhP500‐above.
On the other hand 15.24% of the husbands of the respondents earned PhP101‐PhP150 daily and 14.02% have a daily income of PhP151‐PhP200. However, 12.8% of the spouses of married respondents are currently not earning. Since there are only 4.24% unemployed, the rest can be attributed to husbands employed on a contract basis who presently have no employment. Only 6.71% of the respondents indicated that their husbands earned close to the minimum daily wage (PhP350‐PhP400).
8
Survey Results
Spending Habits: Back to Basics
Food Expenditure
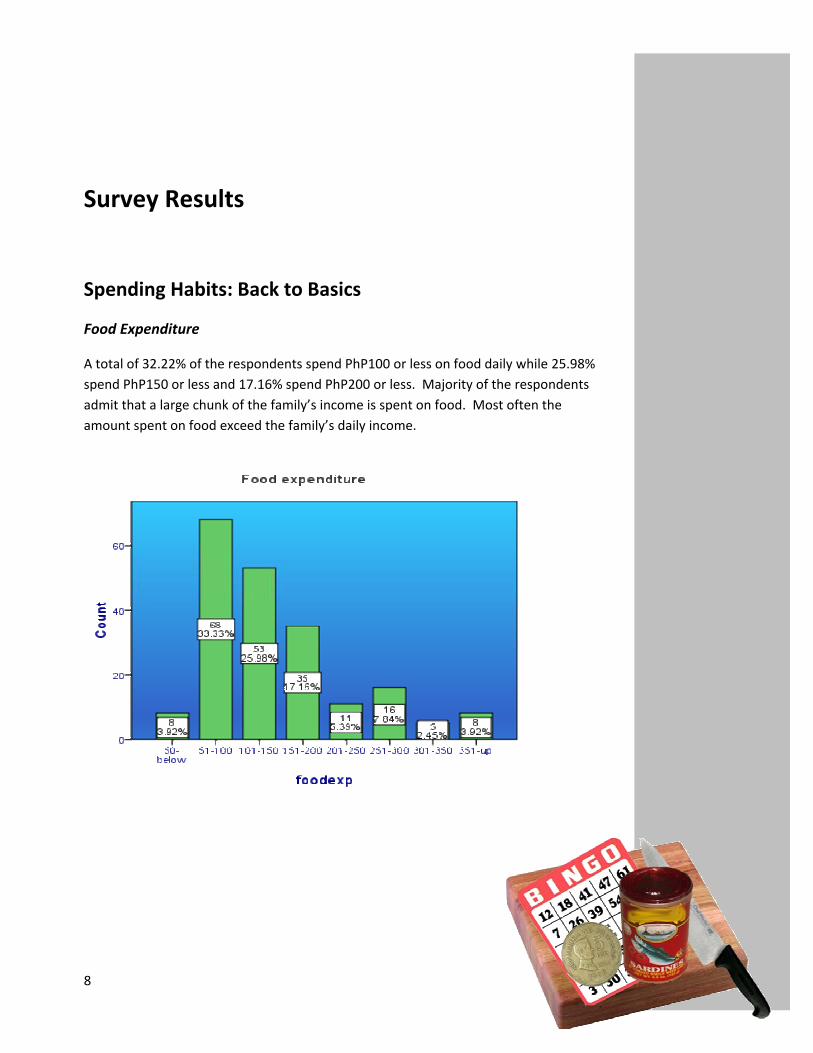
A total of 32.22% of the respondents spend PhP100 or less on food daily while 25.98% spend PhP150 or less and 17.16% spend PhP200 or less. Majority of the respondents admit that a large chunk of the family’s income is spent on food. Most often the amount spent on food exceed the family’s daily income.

9
Some of the respondents or 16.6% specified that they no longer felt the need to cut the budget for food because there is nothing more to slash. There were three (3) respondents, on the other hand, who felt the need to take care of their health by getting proper nourishment. Still, most of the respondents or 21.72% cope by skipping meals, most frequently breakfast and merienda. Around 19.19% of the respondents buy food that would fit their budget like noodles, tuyo, vegetables and fish. Nine percent (9%) of the respondents take extra care in not wasting food while 8.08% resort to eating porridge.

10
Fuel for Cooking
Thirty‐three percent (33%) of the respondents use wood for cooking, while 32.51% use charcoal. There are 12.32% of the respondents who indicated that they mix the use of either both charcoal and wood or charcoal and LPG. Only 12.32% used LPG solely and the remaining percentage is distributed among those who use kerosene, electric stove, rice cooker and superkalan.
Majority of the respondents or 30.57% do not spend anything on fuel for cooking. This may be attributed to households that used wood for cooking. There are 17.10% of the respondents who spend PhP150‐below monthly for fuel. On the other hand 12.95% spend PhP351‐PhP550 on fuel for cooking. The respondents who indicated such monthly expenditure on fuel are using LPG for cooking, given that this price range is close to the current price of LPG in the market. Another 17.10% spend PhP551‐PhP750; majority of the respondents who spent higher than PhP550 a month use charcoal for cooking and buy tingi (per piece basis) or per supot (per plastic/small pack) on a daily basis disbursing PhP15‐PhP28 daily.

11
Electricity Consumption
While more and more households in urban poor communities are finding it cheaper to use wood for cooking, a staggering 16.67% also live with no electricity. Majority of those who have no electricity were not able to pay up the monthly bills and at some point between three months to three years ago got their electricity lines disconnected. Most of the respondents who have no electricity expressed a feeling of reprieve for not having another bill to worry about every month.
For those who have electricity lines, 18.63% spend PhP200‐PhP300 monthly on electricity bills while 13.24% allot PhP101‐PhP200 monthly. Around 11.23% on the other hand disbursed PhP100‐below monthly.

12
Water Expenditure
While most have access to water, the facility to getting water varies among areas. In Vitas, Manila where access to water is a perennial problem, the cost of water is relatively higher than in all the other areas surveyed. The lowest water consumption in the said area is PhP300 and could reach as high as PhP1,350 monthly. But majority of the respondents of the survey or 33.17% spend nothing on water since most of them have deep wells or access to it. Around one‐third or 30.24% of the respondents spend PhP150‐below on water monthly and 16.10% pay out PhP151‐PhP300. There are those who said that they pay more than PhP600 on water and usually pay extra for drinking water sold at water stations aside from the monthly water bills.
There are also areas wherein water for bathing and washing are easily available because of deep wells. But most of the respondents shell out PhP20‐PhP50 a week for safe drinking water.

13
Housing
Majority or 70.73% indicated that they “own” the houses they live in. The respondents are not “renting” since most of the areas covered are areas of informal settlers. One limitation of the research instrument is that the survey question pertaining to “house ownership” does not specifically ask if the respondents own the land itself or only the “rights.”
Some of the areas covered by the survey have housing issues, i.e. there are ongoing negotiations, or impending demolitions or eviction. There are 13.9% of the respondents are renting and 9.76% live in medium‐rise government socialized housing and pay for the rights to live in the building for as low as PhP300 or as high as PhP1,200 monthly depending on the age of the listed tenant and on which floor the tenants reside. There were 3.41% who live with their parents or in‐laws and 2.93% live in houses of relatives/friends as katiwala or overseers of the property/house.

14
Among the respondents who are renting, majority or 10.84% pay P500 or less monthly while 6.90% allot P501‐P1000 a month on rent.
Education Expenses
Most of the respondents’ children who are studying go to public elementary and high schools, and so the expenses mentioned in this research translate to daily allowances for transportation or snacks.
Majority of the respondents or 32.32% do not have any children in school while 19.9% have one child in school. Eighteen point forty‐one percent have at least two children studying and 16.92% have three children in school.
The average education expenses for most respondents ranged from PhP400 to PhP600 monthly. Around 15.27% specified a monthly expenditure of PhP301‐PhP450 while a surprising 16.26 % spend PhP1,051 or more a month on transport and snacks allowance.
There are 36.45% of the respondents who do not have education expenses. Most of those who indicated such may have children who are too young to go to school or may have stopped or drop‐out of school, or have already graduated.

15
Other Expenditure (for Metro Manila only)
Majority of the respondents admitted to having no savings. This is hardly surprising when almost all of the families’ income go to food and utilities. Very little consideration is given to other needs like medical care, rest and recreation, clothing, and other “luxuries.” Of the respondents, 41.6% indicated that they do not have any other expenses aside from the basic needs. On the other hand, 19.8% save for daily or monthly dues or payment for loans, debts and the like. There are 11.9% who spend on other grocery needs like soap, detergent, shampoo, coffee, sugar and other things bought from grocery stores while 10.9% save for medicine or medical care whenever the need arises.

16
Coping Strategies: Making Ends Meet
Finding Other Sources of Income
The search for other means to augment the households’ budget is common among the respondents. Although 22.39% specified that they do not have other means to support the families’/households’ income, a greater percentage of 77.61 have other sources of income. The other means of support ranged from “extra” employment or sub‐contract work (18.91%) to selling different kinds of merchandise or food (28.36%). Some join competitions/contests on television while others sublet their living spaces (3.98%). Others stick to more conventional means like doing laundry or setting up a sari‐sari store. Still, others approach relatives or families who fare better in life (4.48%).

17
Bare Necessities
Does your income suffice? (Nakakasapat ba?) The answer to this question is a resounding “no” to 78.43% of the respondents surveyed. There are 3.43% who answered sometimes while 8 % try hard to stretch the budget. Ten point twenty‐nine percent said yes and admitted that their income is enough for the family’s needs.
Struggling to Make Ends Meet
“Tipid na tipid na, wala ka nang titipirin.” (“You can only save as much, there is nothing more to save.”)
‐ Respondent The budget for food of most respondents is flexible and highly‐dependent on the income for the day. Since most of the respondents are in the informal sector, their income is on a daily basis. Mostly, their earnings for the day do not make up for the budget for food. A big number or 59.71% of the respondents indicate that they make up for it by borrowing food from sari‐sari stores, carinderia or from neighbors and some by getting cash loans from lending institutions, micro financing and 5‐6 or Bumbay (Indian lender). Some 7.19% cope by tightening their budget for everything—meaning they do all means of slashing the budget for food, utilities, education, and other expenditure.

18
Slashing of budgets to the extreme is a direct impact of the dwindling purchasing power of the peso. Higher prices of commodities and steady income mean lesser commodities to buy. There are 46.92% of the respondents who said that they cope by living frugally like cutting the budget for food, reducing the use of electricity and water, using cost‐efficient fuel for cooking, cutting on “luxuries” or luho or doing away with it altogether. There are 19.23% who buy cheap food. The respondents expressed that most often they buy eggs, noodles, and tuyo (smoked fish). On the other hand, 10.77% buy whatever their budget allows them to. Still another 10.77% do anything to survive like taking on odd jobs, scavenging, eating rice with soy sauce, salt or bagoong (fish paste) and others.

19
Lower Living Standards
Based on the interviews conducted among 205 women from the poor communities, basic need means basic food. When the families’ stomachs are rumbling, there is not much choice. When their survival is at stake, the only thing to do is to lower the standards of living by doing away with expenses that are not immediately necessary for them like medical care and education. While before, parents struggle to pay for their children’s college education, nowadays, the struggle begins as early as the intermediate level. Some of the respondents expressed their dreams of getting their children finished high school with not much thought for college. Some of the respondents’ children have already dropped out of elementary school because they could not provide the support they need in school.
The standard for food has also declined considerably. We have heard of “pagpag,” “batchoy,” and “ukay‐ukay” food in the past, in urban poor communities particularly in Veterans near Payatas, some residents had taken to scavenging for “SM food” on the dumpsite. The target prized truck collects frozen meat, fish and vegetables that have expired from supermarket stores like SM and chucks the goods in the dumpsite. One of the respondents said that the meat products still have their price tags attached to them.
And if by chance, they were not able to avail of the meat products, most of the respondents have to ensure that they have rice and viand‐substitute like condiments — soy sauce, salt, fish paste, etc.
One thing is clear from the results of the survey though, the so‐called “economic growth” of the country from previous years did not have an impact on poverty alleviation.

20
Conclusion
Poverty has been a long‐standing issue in the Philippines. The programs of the government for poverty alleviation have only short‐term results because they are just palliative measures that do not address what women want – jobs, social services, food.
With the absence of a genuine program for women, they themselves should think of crucial steps to uplift and eventually change their impoverished condition. Women should consider their situation as a challenge and as an opportunity to reach out to other women and bring themselves into organizations.