introduction - ohio state university · comparative analysis 1 by brent l. smith graduate research...
TRANSCRIPT

..
'
.. .. )
CRIMINAL VICTIMIZATION IN RURAL AND URBAN AREAS:
COMPARATIVE ANALYSIS 1
by
Brent L. Smith Graduate Research Fellow
Department of Sociology and Anthropolor,y Purdue University
West Lafayette, Indiana
and
Joseph F. Donnermeyer Assistant Professor
National Rural Crime Prevention Center The Ohio State University
Columbus, Ohio
ABSTRACT
This paper reports on the results of a criminal victimization survey in Benton County, a predominantly agricultural community in North Central Indiana. The paper examines the distribution of crime by type committed against ~enton County residents. It also compares the personal and household victimization rates with the results from
ESO 693
a National Crime Panel victimization study. The paper concludes that (1) a greater proportion of crime experienced by rural residents is of a less serial.ls nature than offenses experienced by residents of urban areas; (2) the volume of crime occurring within rural areas is generally equivalent to that of non-metropolitan areas of 50,000 or less, but not as high as for metropolitan areas of 50,000 or greater; and (3) the proportion of victimizations experienced by rural residents in urban areas, or outside the county is higher than the proportion of victimizations experienced by urban residents when outside of the urban area.
1The material in this project was prepared in part under Grant No. 78-NI-AX-0032 from the Law Enforcement Assistance Administration, U.S. Department of Justice, and in part from Hatch Project 45068-36-11455, Agricultural Experiment Station, Department of Agricultural Economics, Purdue University. Researchers undertaking such projects under Government sponsorship are encouraged to express freely their professional judgment. Therefore, points of view or opinions stated in this document do not necessarily represent the official position or policy of the U.S. Department of Justice .
l

..
'
'
'
CRIMINAL VICTIMIZATION IN RURAL AND URBAN AREAS:
A COMPARATIVE ANALYSIS
INTRODUCTION
The purpose of this research is to examine what may be called
an "emergent social problem": th<> volume of crime in rural America.
The study of rural crime has heretofore been a largely neglected
subject matter area for two interrelated reasons. First, official
data, such as the FBI crime rate index of major offense categories,
as well as the arrest records of law enforcement agencies, usually
have revealed that urban areas exhibit rates of crime disproportio
nately higher than the rates for rural areas. For example, Table 1
reveals that the FBI total crime index rate (per 100,000 persons)
of offenses known to the police is substantially different for urban
and rural areas. On a national basis, the rate of crime reported
to law enforcement agencies within SMSA's is nearly three times
higher than the crime rate for rural areas. The urban crime rate
is substantially higher than the rural crime rate for all seven
offense categories contained within the FBI crime index. Consequently,
the city (or the environment thereof) has been long considered by
law enforcement officials, criminal justice planners~ and criminolo-
gists, to be "criminogenic": a "breeding ground" for crime. Second,
because official statistics in the past have revealed a greater crime
problem in urban areas, criminological theory has, throughout its
development, concentrated on urban crime to the exclusion of the
analysis of rural crime.
3
[Table 1 about here]
Recent events, however, have caused a reassessment of the
predominately urban orientation to the study of crime. For instance,
since 1973, FBI statistics reveal that the total crime index for
SMSA's has increased approximately 2.5%. During this same period,
the total crime index rate for rural areas has risen nearly 40%.
Since 1970, arrest rates for serious crimes have been increasing in
non-urban areas, with the most dramatic increase occurring in the
violent crime categories. Between 1970 and 1974, the average annual
increase in arrest rates for violent crimes by juveniles was 7.6%
for urban areas, and 19.2% for non-urban areas (Behavior Today, 1977:
2). Rural residents,particularly farmers, are also reporting substan-
tial increases in property theft. California Farm Bureau officials
estimated that the state's farmers would suffer losses of at least
$30 million in 1977 (Footlick, 1977:101).'
A series of national public opinion polls by the Gallup organi-
zation illustrates the increased concern of rural residents regarding
the crime problem. In 1972, the 1500 respondents to a national sample
were asked: "Is there more crime in your area now than a year ago,
or less?" Forty percent of the respondents residing in cities of
500,000 or more aaid that crime had inereased in the past year, com-
pared to only 27% of the respondents from rural areas and towns of
less than 2,500. In 1977, this same question was repeated among
another representative sample of persons in the United States. The
percent of respondents from major metropolitan areas who perceived
an increase in crime had declined slightly to 38%. In contrast, the
~
.... r........'
..
I !
I
I j

..
4
' percentage of rural respondents who indicated an increase in crime
in their area had climbed dramatically to over 46%.
Suburbanization, better transportation systems, consolidation
of rural schools, the increased price of farm machinery and other
production inputs, the relative isolation of many rural residents,
inadequate law enforcement resources, as well as other factors, may
all be hypothesized as contributing to an increase in rural crime.
However, an explanatory model of rural crime is premature because
there is so little data available on rural crime. Notable exceptions
include Clinard (1942, 1944, 1960), Eastman (1954), Dinitz (1973),
Gibbons (1972), Phillips (1975, 1976), and Beran and Allen (1975).
DEVELOPMENT OF VICTIMIZATION SURVEYS
A recent development in the field of criminology is the utili-
zation of the victimization survey to measure the volume of crime. I
Historic~lly, criminologi~ts relied almost exclusively on crime rate
data made available by law enforcement agencies to examine trends
and to delineate differences between specific geographic areas. How-
ever, there are several major drawbacks to exclusive use of this kind
of data, two of which are most pertinent to the focus of this paper.
First, official statistics (e.g., court cases, crimes known to the
police, arrest records) are incapable of measuring the total volume of
crime. For example, the FBI crime rate index consists only to crimes
"known to the police," over 80 percent of which are reported to law
enforcement by the private citizen as victim (Black and Reiss, 1967).
' However, a sizeable proportion of crimes are never reported to law
enforcement by the victim. For instance, in only about 25% of all
personal and household larcenies, will the victim notify law
,.,,

5
enforcement pPn~nnnel. Although a greater proportion of serious
crimes tend to be reported, one-half of all rapes and non-commercial
robberies (theft by force) are never reported. Consequently, police
statistics do not reflect the total volume of crime within a given
geographic area, and it may be difficult to determine whether or
not a change in the "official" crime rate is due to an actual change
in the volume of crime, or instead due to a change in the proportion
of incidents reported to law enforcement.
A second drawback of police statistics is that there is a paucity
of information on situational events surrounding the criminal
incident. For instance, there are only limited data on the demogra-
phic characteristics of the victim, the extent to which the victim
may have co:1tributed or increased his vulnerability, and the victim-
offender relationship.
The victimization survey is an alternative data collection I
tool which estimates the extent of crime trrough statistically repre-
sentative sampling within a specified geographic area, and in which
information on specific criminal incidents within a predefined time
frame are recorded directly from the sample respondents. It has
the capability to record criminal incidents which have not been
reported to law enforcement, and to determine the reasons why types
of 1nc1oente remain unreported. Ule victimi~ation survey may aleo
be used to collect information on the situation surrounding the
criminal event from the perspective of the victim, as well as
elicit post-event effects on the victim.
. . ~ . ...._,•
'
'
6
PURPOSE
The paper examines the extent of crime in a rural area, and
compares the volume and rate of rural and urban criminal victimiza
tion. The research was conducted in Benton County, Indiana, an
agricultural community in the northwest quadrant of the state. Major
foci include: (1) the type of criminal activity most likely to occur,
(2) the total volume of crime, and (3) the proportion of criminal
incidents occurring to residents inside or outside the county of
residence. Second, the study compares the rate of criminal victimi
zation in this rural area with national averages, and with the rates
of various metropolitan areas, as derived from the National Crime
Panel surveys conducted under the auspices of the Law Enforcement
Assistance Administration (U.S. Department of Justice, 1976). In
the final section, an outline for a research agenda on crime in rural
areas is proposed.
RESEARCH METHOD
A stratified proportionate sample of residents in the county was
obtained using an area probability sampling technique. Based upon
the political and legal mechanisms by which crimes are reported, a·
county was perceived to have the most distinct governmental boundaries
through which law enforcement and the processing of crime occurs.
Three defining characteristics of a rural county were used in the
selection process: (1) a total county population of no more than
30,000 persons; (2) an average density of fewer than 50 persons per
square mile; (3) no greater than one-third of the county population
meeting the United States Census Bureau's definition of "urban"
.. 7
(i.e., an incorporated area of 2,500 or more). Conjointly, the first
and third criteria eliminate counties with cities of 10,000 or more.
Benton County, Indiana meets each of these criteria. It is
located in northwest Indiana, and is roughly equidistant from Chicago
and Indianapolis (100 miles). Lafayette, Indiana, 25 miles southeast,
is the nearest metropolitan area. Benton County itself had an esti-
mated 1975 population of 10,828 persons. Fowler, the County seat,
has a population of 2,643. There are several smaller towns in the
county, all with populations of less than 500.
The victimization study was modeled after previous National Crime
Panel research which employed a tripartite analysis of household
victimizations, personal victimizations, and business victimizations.
This paper will discuss only the results of the first two.
Data for the household and personal victimization survey were
collected through an area probability sample. The County was divided I
into three strata: (1) town, (2) village, and (3) open-country.
The town stratum included the County seat of Fowler. The village
stratum included all other unincorporated and incorporated places
of 50 or more persons. The open country stratum consisted of all
other households outside the first two strata,
The location of the households in the open country stratum was
obta!ne~ from the B~ntoP County Atla$ anQ Dire~tory (1976), and was
checked for accuracy against United States Geological Survey maps.
This· procedure was supplemented by a visual inspection along county
roads. Households in the town and village strata were counted by
visual inspection of dwelling units. Each unit was marked on street
'•
'
'
8
maps. This procedure proved economical given the relatively small
size of the towns and villages in Benton County.
Sampling blocks of approximately 20 dwelling units were drawn
up. There were 3,608 dwelling units in Benton County at the time
of the survey. These units were divided into 181 sampling blocks.
There were 41 blocks within the town stratum, 79 village blocks,
and 61 open country blocks.
A stratified proportionate sample of blocks was identified to
reflect the proportion of the population residing in each stratum.
Forty sampling blocks were randomly selected. A random starting
point was selected for each block, after which every fourth dwelling
unit was included in the sample.
Household victimization questions could be answered by any adult
in that household (over age 18). Personal victimization questions
were asked individually to each.member of the household age 12 and
over.
Both the household and personal victimization sections consist
of a series of specific "screen" questions which determine whether
a crime has occurred. For each incident indicated by the respondent,
a follow-up Crime Incident Report was administered in order to obtain
indepth information about events surrounding the incident.
Four hundred eighty-one respondents from 222 households were
interviewed for the household and personal victimization sections
of the study. Seventy-eight extra dwelling units were substituted
in the survey because the originally selected units could not be
interviewed. Approxim~tely one-half of the substitutions were
refusals; the other half were due to irregular working hours of the
9
respondents, vacations, scheduling conflicts between the respondent
and interviewer, or for medical reasons.
The survey instrument for the household and personal victimiza-
tion study was divided into five parts: (1) household information,
(2) personal information, (3) household screen questions, (4) per-
sonal screen questions, and (5) the crime incident report.
The household screen questions consisted of a set of eight
questions on whether property had been stolen from the home or yard,
and whether the home had been burglarized, vandalized, or an auto-
mobile stolen. The personal screen items were asked to each person
in the household age 12 and over and included questions about rape,
robbery, assault, and personal larceny. The respondents were queried
only about crimes that had occurred in a one year period: from June 1,
1977 to May 31, 1978.
Every attempt was made to maintain conceptual similarity between
I
the Benton County rural crime study and t~e National Crime Panel victi-
mization surveys. The same screen questions were employed for the
Benton County study, as well as the identical definitions of crime
types.
The classification scheme of criminal incidents utilized for
the national victimization surveys is not identical, but remains
similar to the FBI crime index classification. Personal crimes in
the victimization survey included violent crimes: (1) rape; (2) rob-
bery or theft by force; (3) aggravated assault with injury; (4) attem-
pted aggravated assault with a weapon; (5) simple assault with
injury; and (6) attempted simple assault without a weapon. Two non-
violent crimes are also included under the personal crime grouping:
·:
I
I I '
I " I
I

'
10
(1) personal larceny with contact (such as purse snatching or pocket
picking); and (2) personal larceny without contact. Larceny without
contact involves the theft of personal property from a place other
than the respondent's house or yard and does not include automobile
theft.
Household victimizations are of three types: (1) burglary or
unlawful breaking and entering; (2) household larceny or the theft
of property from the yard or from the inside of the home if there
was no forcible entry; and (3) motor vehicle theft. Household
burglary was further subdivided into: (a) forcible entry; (b) unlaw
ful entry without force; (c) attempted forcible entry.
Victimization rates are measures of the probable occurrence of
specific criminal incidents among population groups. For crimes in
the personal sector, (i.e., against the person) the rate is the number
of victimizations per 1,000 res,idents age 12 and over. For crimes in
the household sector, the victimization rate was derived from the
number of incidents per 1,000 households. There is a difference bet
ween the two rates because the personal sector rate reflects the
number of victimizations while the household sector is based on the
number of victimization incidents. A single criminal incident may
involve multiple victims or persons and would therefore be considered
as more than one victimization.
RESULTS
Distribution Of Offenses. Table 2 shows the distribution of
reported victimizations. An additional question on vandalism was
also included in the Henton County study based on the results of a
nine county study by Phillips (1975) in rural Ohio which found that

11
vandalism represented 38% of all criminal victimizations. The results
here indicate that 30 incidents of vandalism were reported. This is
20.3% of all total incidents, which is below the proportion from the
Ohio findings. However, it does indicate that vandalism is one of
the primary types of criminal offenses to which the rural population
is vulnerable. Since vandalism has not been included in other victi-
mization surveys, it is impossible todeterminewhether this pattern
is similar to the volume of vandalism in urban areas.
[Table 2 about here]
There were 73 personal victimizations experienced by respondents
in the sample. This is nearly half of all crimes reported by the
survey respondents. Over 70 percent of these offenses involved per-
sonal larceny without contact, which was the most frequently mentioned
type of crime. Included in this category would be theft of personal
property while at work (or at school among school-age respondents),
as well as the theft of item from a motor vehicle when away from the
place of residence. Personal larceny without contact would exclude
the theft of personal property away from the home and yard, and as
well, would exclude automobile theft.
There were 20 violent crime victimizations reported by th~
sample respondents, 15 of which were classified as simple assault.
Simple assault may be distinguished from aggravated assault by the
degree of injury. An aggravated assault involves an attack or
attempted attack with a weapon, or an attack without a weapon that
resulted in serious injury such as broken bones, loss of teeth,
·:
... '----
' '
. f
I

'.•
'
' • I
12
internal injuries, loss of consciousness or any injury requiring at
least two days of hospitalization. In contrast, simple assault is
limited to an attempted attack without a weapon or to an attack
resulting in minor injury such as bruises, a black eye, cuts,
scratches, swelling or undetermined injury requiring less than 2
days of hospitalization. The vast majority of simple assaults were of
the attempted variety. There were also four reported cases of aggra
vated assault two of which resulted in serious bodily injury.
Household victimizations accounted for 30.4% of all reported
victimizations. Burglary was the most frequently mentioned incident
in the household sector. Burglary includes forcible entry, unlawful
entry without force, and attempted forcible entry. Although intent to
commit theft is, in most states, required in the legal definition of
burglary, victimization research must make certain assumptions regar
ding the intent of offenders. The classification of burglaries reported
among the Benton County re~pondents reveals a fairly even distribution
among forcible entry, entry without force, and attempted entry.
Household larceny involves theft or attempted theft from the
yard or property of a household member, but does not include attempted,
forcible, or unlawful entry. There were 17 reported cases of house
hold larceny, or 11.5% of all reported incidents.
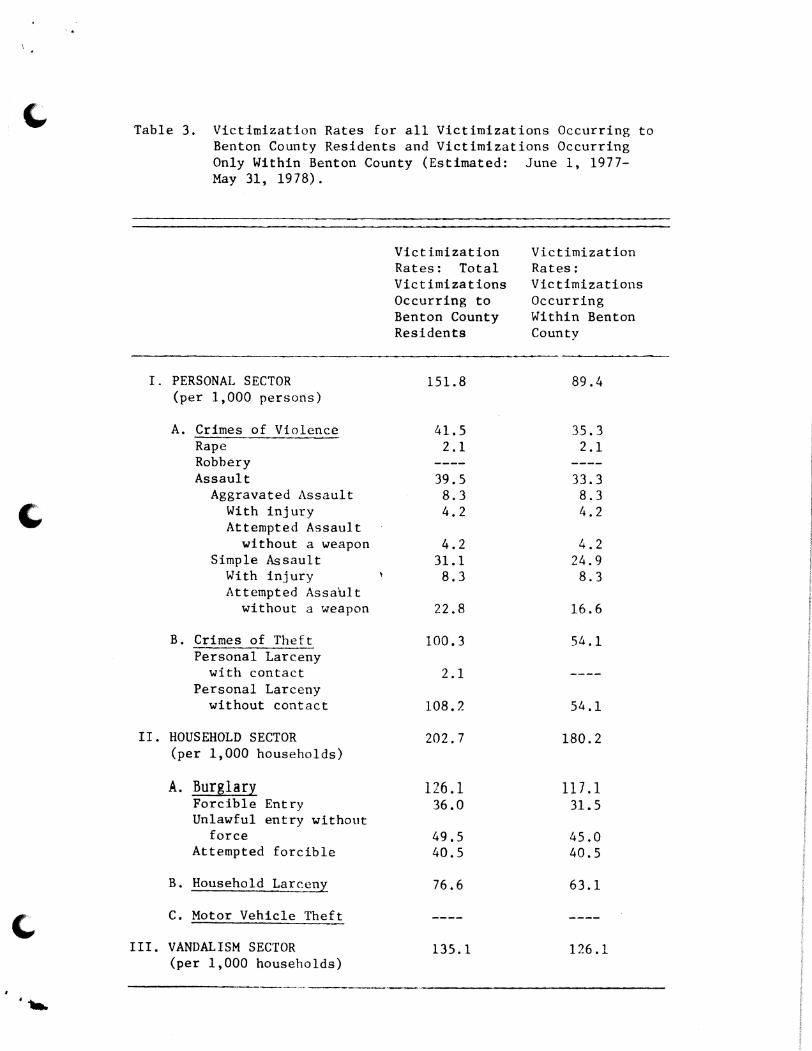
Location And Rate Of Victimization. Table 3 presents two methods
of calculating victimization rates for the Benton County study. The
first column shows the victimization rates for each of the three
crime sectors: personal, household, and vandalism. These rates are
based upon all offenses occurring to the sampled residents. The
second column refers only to victimizations that occurred within
Benton County to the sampled residents.
[Table 3 about here]
13
Within the personal sector, there is a considerable difference
in the two sets of figures. The total personal sector rate for all
victimizations occurring to Benton County residents is 151.8 per
1,000 persons. In contrast, the victimization rate for incidents
which have occurred ~!:_!:bin Benton County is 89.4 per 1,000 persons.
This latter rate is only 58.8% of the former and demonstrates that a
substantial proportion of personal victimizations experienced by
Benton County residents take place outside the County. An examina
tion of specific rates within the personal sector reveals that most
of the differential is due to personal larceny without contact. The
total victimization rate for personal larceny without contact, irre
gardless of where the incident took place was 108.2. Adjusting the
personal larceny without contact rate for incidents occurring within
Benton County cuts this rate in half (54.1 per 1,000 persons).
Most of the personal larcencies without contact experienced
outside of Benton County occurred in Tippecanoe County. Tippecanoe
County is an adjaeent rn12tropolitan county with a population of approxi
mately 110,000. It functions as a service and trade center for a
seven county area including Benton County. A second research project
of the adult population (N=300) of Benton County (independent of the
crime study), which was administered soon after completion of the
victimization survey, focused on the retail shopping patterns and
...
'
'
c . ' '
.._)II
',•
14
over-all satisfaction with local recreational, medical, educational,
and social facilities and services. The data indicated that most
household-related retail items, including groceries, furniture,
clothing, and sundries, purchased by rural residents were bought
outside Benton County. For instance, 90% of the respondents did
most of their Christmas shopping-related purchases in Tippecanoe
County at one or another of its shopping malls (Donnermeyer, 1979).
In other words, Benton Countians are a highly mobile group who travel
frequently outside the county for many services, especially those in
the retail sector.
The authors suggest, although there is no direct data to support
this hypothesis, that the Benton County residents maintain some of
their "rural" norms and expectations when traveling to urban areas.
The Lafayette area is not comparable in size with an Indianapolis
or Chicago, and so it may not be perceived by Benton County residents \
I as being particularly "crime-ridden." For instance, they may not
change their habits with respect to keeping car doors unlocked while
parked at one of the shopping malls.
The victimization rates for household sector offenses reveal
little difference by location. The victimization rate for all house-
hold sector victimizations was slightly more than 200 per 1,000 house-
holds. When only offenses occurring within Benton County are utilized,
the adjusted victimization rate is 180.2 per 1,000 households. Those
victimizations within the household sector which did not take place
within Benton County were associated with vacations or temporary
places of residence (i.e., hotels, motels, homes of relatives or
friends) •
i I
I I I I I I I I ' t I t I <
i I
! i ' 1
I
I

15
National Crime Panel surveys have found that among urban popula-
tions, fewer victimizations take place outside of the metropolitan
area in which they reside. Generally, the percentage of victimiza-
tions of this nature has been less than 10% (U.S. Department of
Justice, 1975). The Benton County survey results indicate that a
substantially higher proportion of crimes occur to the population
while outside the County. Approximately one-fourth of the victimi-
zations experienced by the County residents occurred in cities of
10,000 or greater.
Rural-Urban Victimization Rates. How does the rate of victimi-
zation in Benton County compare to the rates found in urban areas?
Tables 4 and 5 include the results of the National Crime Panel study
for personal and household sector crimes respectively for 1976. The
tables provide a national victimization total, as well as the rates
of metropolitan areas of SO, 000 to prlaces of one million residents
or greater. Also included are the victimization rates for "Nonmetro-
politan Areas" which include all unincorporated areas of 50,000 or
less.
Among the personal sector crimes, the victimization rates for
Benton County are approximately equivalent to the United States aver-
age. The violent crime victimization rate for Benton County residents
was 41.5 (all victimizations occurring to Benton County residents)
compared to the United States rate of 32.6. The Benton County violent
crime victimization rate when adjusted for those crimes occurring
within Benton County remains slightly below the rates for the three
•
'
' ,, __ ~ .
16
larger groupings of metropolitan areas, but is substantially higher
than the rate for nonmetropolitan areas.
[Table 4 about here]
However, the types of violent crime occurring to Benton County
residents are generally less serious than those reported in the natio-
nal survey. Three-fourths of all violent crime victimizations in the
rural survey involved simple assault compared to 46.7% in the National
survey.
The personal theft victimization rate for Benton County residents
is proximate to the 1976 National Average. However, the personal
theft victimization rate for offenses occurring within Benton County
is well below the rate for nonmetropolitan areas.
The overwhelming proportion of personal crimes of theft in Benton
County involved personal larcenies without contact. This same pattern
may be found in the National Crime Panel study where personal larceny
without contact accounted for nearly 96% of all personal crimes of
theft in 1976.
A comparison of the household sector victimization rates in Benton
County with the National Crime Panel results shows that there is a
higher rate of burglary, but a l~uer rate of household larceny and
motor vehicle theft in Benton County than the National average (Table
5). The Benton County burglary rate for all incidents occurring to
residents was 126.1 per 1,000 households. This compares to a United
States average of 88.9. The Benton County burglary rate is higher than I rate of 64.6 per 1,000 households for nonmetropolitan areas • I the rate for all sizes of metropolitan areas, and is nearly double the
I
17
[Table 5 about here]
A breakdown of the burglary rate into its three sub-types
reveals that the largest differential between Benton County and the
United States averages resides in the attempted forcible entry cate-
gory. The Benton County rate was 40.5 per 1,000 households, compared
to a National average of only 20.8. The actual volume of forcible
entry in Benton County was nearly identical to the National average
and there was a much smaller differential with respect to unlawful
entry without force, than with forcible entry.
We suggest three possible explanations for the higher burglary
rate in Benton County. First, the large discrepancy between Benton
County and the National average with respect to attempted forcible
entry may be due in part to a differential level of community tole-
ranee toward crime, (i.e., a tendency to increase the seriousness of I
an offense by rural residents). Second, rural farm residents present
a greater opportunity for burglary because of the presence of barns,
tool sheds and other structures related to the farm operation. A thirrl
set of factors which may explain the burglary rate is the low population
density of Benton County (i.e., relative isolation of open country
households), and the previously mentioned fact of the high volume of
commuting to urban areas for retail shopping. Low density and a high
absenteeism from the residence would combine to create a situation of
high vulnerability for many residence in the county.
The household larceny rate among the Benton County sample was
76.6 per 1,000 households. This is considerably less than the National
average and is even lower than the rate of 91.S for nonmetropolitan
••
I l
l I I ! . I
l
-,.
'
'
' . ,
18
areas. There were no reported incidents of motor vehicle theft by the
respondents in the Benton County study. This is significant because
motor vehicle theft is usually committed by a professional thief or
theft ring. The rate of motor vehicle theft according to the National
Crime Panel study shows a steady decrease with population size from
25.8 per 1,000 households for metropolitan areas of 1,000,000 or more,
to only 6.7 per 1,000 households for nonmetropolitan areas.
The total victimization rate for all household sector crimes
for Benton County is lower than the National average, and for each
category of metrooolitan area. However, the Benton County total
household sector victimization rate is slightly higher than the
nonmetropolitan rate.
THE PATTERN OF RURAL CRIME
This paper suggested earlier th3t crime in rural areas may
represent an "emergent" so.cial problem. The purpose of this paper
was to compare the volume of crime for one rural area, Benton County,
Indiana with previous National Crime Panel research and determine the
comparability in the level and type of crime between urban and rural
areas of the United States.
The results from the Benton County victimization study lead to
several tentative generalizations about the level and type of crime
in rural areas.
1. A GREATER PROPORTION OF CRIME EXPERIENCED BY RURAL RESIDENTS IS OF A LESS SERIOUS NATURE THAN OFFENSES EXPERIENCED BY RESIDENTS OF URBAN AREAS.

19
The robbery and ~r,gravated assault rates were lower in Benton
County than the rates for metropolitan areas of all sizes. In addi-
tion, motor vehicle theft, generally associated with the professional
thief or gang, was not reported by any respondents in the Benton
County sample. The rate of simple assault and personal larceny with-
out contact were significantly higher for the Benton County sample
than the National figures.
In this respect, the results of the Benton County study are
similar to the general conclusions of both Gibbons (1972) and Phillips
(1977), i.e., that crime in rural areas is of a less serious nature
than in urban areas. Gibbons (1972) went so far as to characterize
the type of crime in rural Oregon as "folk crime" (i.e., petty theft,
fish and game violations, public drunkenness). The data from both
Ohio (Phillips, 1977) and Benton County clearly do not lend support
to the strength of Gibbon's typification, but do suggest the generally
less serious nature of the rural crime pattern.
2. THE VOLUME OF CRIME OCCURRING WITHIN RURAL AREAS IS GENERALLY EQUIVALENT TO THAT OF NONMETROPOLITAN AREAS OF 50,000 OR LESS, BUT NOT AS HIGH AS FOR NETROPOLITAL AREAS OF ABOVE 50,000 PERSONS.
The victimization rate for crimes occurring within Benton County
were generally equivalent to the nonmetropolitan category from the
National Crime Panel study. One major difference was the burglary
rate, and in particular, the attempted forcible entry rate. Factors
associated with the tolerance level, mobility patterns, low population
density and presence of farm-related structures may account for this
difference.
..,.
'
'
' ,, .
3. THE PROPORTION OF VICTIMIZATIONS EXPERIENCED BY RURAL RESIDENTS IN URBAN AREAS, OR OUTSIDE OF THE COUNTY OF RESIDENCE, IS HIGHER THAN THE PROPORTION OF VICTIMIZATIONS EXPERIENCED BY URBAN RESIDENTS WHEN OUTSIDE OF THE URBAN AREA IN WHICH THEY RESIDE.
20
The personal larceny without contact victimization rate for the
rural survey suggests that rural residents who travel to service
centers located in urban areas for basic or "routine" retail pur-
chases, greatly enhance their chances of being criminally victimized.
RESEARCH AGENDA
In conclusion, our research suggest that rural areas no longer
fit the stereotype of a social system characterized by little or no
crime. The Benton County victimization study is a case study, and
as such the generalizations derived from it are limited by unique or
situational factors associated with the study area. However, this
research, as well as other preliminary studies by Beran and Allen
(1974), Dinitz (1973), and Phillips (1975), illustrates the need
for expansion of the data base on rural crime.
Rural criminal justice officials have had little evidence on
which to formulate policy and the administration of rural criminal
justice. Future reserach on rural crime should be focused upon
several key problem areas.
1. The Pattern Of Victimization In Rural Areas. In addition
to continued measurement of the total rate of criminal victimization,
and by type of victimization, there is a need for information on
the pattern of crime in rural areas. Newman (1973) and Phillips
(1976) suggest the importance of ecological factors to the probability
21
of victimization. Such factors would include distance from a metro
plitan area, proximity to a public road, visibility of the house
to neighbors, and the arrangement of farm buildings on the farm
operation. Another important line of inquiry in this respect is
the examination of demographic, economic, and social class differen
tials between victims and non-victims. A third area of research
on the pattern of crime would include the effect of opportunity
reduction techniques on victimization. For example, is there a
difference between victim and non-victim households (or persons) by
the proportion with a security guard light, burglar alarm system,
type of door and window locks, presence of a watchdog, possession
of a gun, and other security devices and practices? A final line
of inquiry on the pattern of rural victimization should focus on
victim response. For instance, was the incident reported to law
enforcement, and if not, for what reason(s) were the police not
notified? What is the relationship of the victim to the of fender
(i.e., is the offender an employee, friend, neighbor, or even
relative?). What are the psychological and behavioral consequences
of victimization to all household members?
2. The Development Of Theoretical Perspectives Regarding Rural
Urban Differentials. Warren (1978:53-54) has outlined seven "great
changes" that have occurred in American communities, the gist of
which is that there has been "an increasing orientation of local
community units toward extracommunity systems of which they are a
part, with a corresponding decline in community cohesion and autonomy."
These changes have cut across both rural and urban communities.
\·
'
'
22
Future research particularly must be concerned with the construc
tion of sampling designs for comparative analyses of the volume and
type of crime occurring to persons and households from different
types of rural areas, nnd of course, with metropolitan areas. Fac
tors which may be operative in explaining rural and urban differen
tials include many of the "great changes" outlined by Warren (1978).
Illustratively, such variables as urbanization, proximity to metro
politan areas, the type and size of farm operations, the travel
patterns of local residents, etc. may be important explanatory fac
tors. A second line of inquiry would include analysis of changing
norms and attitudes in rural areas. For instance, assuming vandalism
is largely a youth crime committed by local persons, what has been
the effect of mass media channels of communication, and the increased
influence of the peer group as the result of rural school consolida
tion, on normative definitions of property destruction, illegal
drug use, etc.
3. Evaluative Research Examining The Effect Of Increasing
Urbanization On Rural Criminal Justice Agencies. The rising crime
rate in rural America will affect law enforcement and the court
system alike. How will the law enforcement departments of small
towns and rural counties react to an increased volume of crime?
How will rural of fenders be processed through the local court
system? In this respect, one important research question is the
examination of the social and economic cost effectiveness of expan
ding law enforcement and criminal justice systems to meet a rising
crime problem? In 2ontrast to a more punitive, formal system of
response, are there viable non-punitive, and informal solutions?
For instance, would "Neighborhood Watch", "CB Patrols" and other
response programs which directly involve the private citizen, be
an effective response for reducing crime in rural areas? If so,
should rural law enforcement officials be sensitized more to the
principles of community structure and organization in their
training programs?
23
Crime increasingly will become a "public issue" of concern to
persons in small towns and the open-country. A greater understanding
of the social forces underlying this trend, and how rural areas will
adjust to it, is necessary.
Table 1. FBI Part 1 Offense Rates for Rural and Urban Areas of the United States, 1976 (Per 100,000 Persons)l
3 Offense Category
Crime Index Total
Total Property Crime Burglary Larceny-Theft Motor Vehicle Theft
Total Violent Crime Murder and Non-Negligent
Manslaughter Forcible Rape Robbery Aggravated Assault
SMSA
6,037.4
5,523.1 1,645.9 3,322.8
554.4
550.3
9.5 31. 3
254.9 254.7
2 Area
Other Cities
4,374.0
4,108.1 1,013.8 2,888.5
205.8
265.0
5.3 13.4 51.0
196.2
Rural
2,047.5
1,877.7 768.1
1,002.3 107. 3
169.8
7.8 13.0 21.2
127.9
1source: Table 1-Index of Crime-United States, 1976, pp. 36-37, in Crime in the United States, 1976. Uniform Crime Report, issued by the Federal Bureau of Investigation, Department of Justice, Washington, D.C.
2sMSA area represents all law enforcement agencies within Standard Metropolitan Statistical Areas as defined by the Bureau of Census. Other cities are all urban places outside an SMSA. An urban place may be less than the Census definition of 2,500 persons if it is incorporated or is a suburb contiguous to a larger urban place. Rural areas include all parts of all counties lying outside of an SMSA not within the jurisdiction of the law enforcement agencv of an incorporated place.
3 Burglary is the breaking or unlawful entry of a structure with
the intent to commit a felony or theft, and includes attempted forcible entry. Larceny-theft is the tn1lawful taking or leading away of property from the possession of another which is not taken by force, violence, the threat thereof, or fraud. It does not include motor vehicle theft. Motor vehicle theft is the unlawful taking of a selfpropelled vehicle, but does not include boats, construction equipment, or farm equipment. Criminal homicide is willful homicide and does not include death resulting from negligence. Forcible rape is carnal knowledge of a female, forcibly and against her will. Robbery is theft by force or threat thereof. Aggravated assault is assault with intent to kill or for the purpose of inflicting severe bodily injury.
Table 2. Number and Percent of Victimizations Occurring to Residents of Benton County by Sector and Crime Type (Estimated: June 1, 1977-May 31, 1978).
Number of Percent of Sector and Type of Crime Victimizations All Crimes
I. PERSONAL SECTOR 73 49.3
A. Crimes of Violence 20 13.5 Rape 1 . 7 Robbery 0 Assault 19 12.8
Aggravated Assault 4 2.7 With injury 2 1. 3 Attempted assault
with a "'1eapon 2 1.3 Simple Assault 15 10.1
With injury 4 2.7 Attempted assault
without a weapon 11 7.4
B. Crimes of Theft 53 35.8 Personal larceny
with contact 1 .7 Personal larceny
without contact 52 35.1
II. HOUSEHOLD SECTOR
A. Burglary 28 18.9 Forcible entry 8 5.4 Unlawful entry wi.thout
force 11 7.4 Attempted forcible entry 9 6.1
B. Household Larceny 17 11.5
c. Motor Vehicle Theft 0
III. VANDALISM SECTOR 30 20.3
TOTAL 148 100.0
-1111111 •
'
' ·--.
Table 3. Victimization Rates for all Victimizations Occurring to Benton County Residents and Victimizations Occurring Only Within Benton County (Estimated: June 1, 1977-May 31, 1978).
Victimization Victimization Rates: Total Rates: Victimizations Victimizations Occurring to Occurring Benton County Within Benton Residents County
I. PERSONAL SECTOR 151.8 89.4 (per 1,000 persons)
A. Crimes of Violence 41.5 35.3 Rape 2.1 2.1 Robbery Assault 39. 5 33.3
Aggravated Assault 8.3 8.3 With injury 4.2 4.2 Attempted Assault
without a weapon 4.2 4.2 Simple Assault 31.1 24.9
With injury 8.3 8.3 Attempted Assa~lt
without a weapon 22.8 16.6
B. Crimes of Theft 100.3 54.1 Personal Larceny
with contact 2.1 Personal Larceny
without contact 108.?. 54.1
II. HOUSEHOLD SECTOR 202.7 180.2 (per 1,000 households)
A. Burglary 126.1 117 .1 Forcible Entry 36.0 31.5 Unlawful entry without
force 49.5 45.0 Attempted forcible 40.5 40.5
B. Household Larce..!!Y. 76.6 63.1
c. Motor Vehicle Theft
III. VANDALISM SECTOR 135. l 126.1 (per 1,000 households)
-···-~--------·--·

Table 4. Personal Crimes: Victimization Rates for Persons Age 12 and Over, by Place of Residence, Type of Crime, 1976 (Per 1,000 persons). United States*.
Type of Victimization
Assault Total
Total Violent Total Personal Larceni Personal Place of Crime Victi- Theft With Without Victimization Residence mization Rate Rape Robbery Total Aggravated Simµ le Rate Contact Contact Rate
United States 32.6 0.8 6.5 25.3 9.9 15.4 96.1 2.9 93.2 128.7
Metropolitan Areas of 1,000,000 or More 42.9 0.6 13.1 8.8 29.1 11. 7 103.8 6.4 97.4 146.7
Metropolitan Areas of 500,000 to -999,999 39.2 1.8 8.5 29.4 11. 7 17.7 118.5 3.9 114.6 157.7
-Metropolitan Areas of 250,000 to 499,999 38.2 1. 3 6.4 30. 2 12.0 18.3 109 ·"' 3.1 106.2 147.6
Metropolitan Areas of 50,000 to 249,999 33.1 0.8 4.9 27.3 9.4 17.9 104.4 1.9 102.4 137.5
Non-metropolitan Areas 20.6 0.5 2.6 17.5 7.2 10.3 69.6 0.9 68.6 90.2
*Source: Table 7, Personal Crime: Change in Victimization Rates for Persons Age 12 and Over, by Place of Residence and Type of Crime, 1975 and 1976. Pp. 35-36 in Criminal Victimization in the United States: A Comparison of 1975 and 1976 Findings. Law Enforcement Assistance Administration, U.S. Department of Justice.

f Table 5. Household Crimes: Victimization Rates by Place of Residence and Type of Crim~, 1976
(Per 1,000 households), United States*.
Type of Victimization ----...----
Burglary
Total Total Attempted Motor Household
Place of Burglary Forcible Unlawful Forcible Household Vehicle Victimization Residence Rate Entry Entrv Entrv Larceny Theft Rate
United States 88.9 30.4 37.7 20.8 124.1 16.S 229.5
Metropolitan -AReas of 1,000,000 or More 91.4 35.7 32-. 6 23.8 114. 2 25.8 231."'
Metropolitan Areas of 500,000 to 999,999 104.7 39.3 38.6 27.0 144.4 25.4 274.5
Metropolitan Areas of 250,000 to 499,999 105.2 36.8 42.5 26.8 166.6 20.1 291.9
Metropolitan Areas of 50,000 to 249,999 101.6 33.9 45.0 21. 8 128.0 14.2 243.8
Non-metropolitan Areas 64.6 18.4 33.4 12.8 91. 5 6.7 162.8
*Source: Table 12, Household Crimes in Victimization Rates, By Place of Residence and Type of Crime, 1975 and 1976. Pp. 43-44 in Criminal Victimization in the United States: A Comparison of 1975 and 1976 Findings. Law Enforcement Assistance Administration, U.S. Department of Justice.
c REFERENCES
Behavior Today
1977 "The very bad news on juvenile violence." 8(33):1-4.
Benton County Atlas and Directory
1972 Rockford, Illinois: Rockford Map Publishers.
Beran, N. J., and H. E. Allen
1974 "Criminal victimization in small town, U.S.A." International
Journal of Criminology and Penology. 2:391-397.
Black, D. and S. Reiss, Jr.
1967 "Patterns of behavior in police and citizen transactions."
Studies of Crime and Law Enforcement in Major Metropolitan
Areas, Volume II. Washington, D.C.: U.S. Government
Printing Office'.
Clinard, Marshall
1942 "The process of urbanization and criminal behavior: A study
of culture conflict." American Journal of Sociology.
48:202-213.
Diniu, Simon
1973 "Progress, crime, and the folk ethic: portrait of a small
town." Criminology. 11(1):3-21.
Donnermeyer, Joseph F.
' 1979 Benton County Examines Itself: The Results of a Recent
County-Wide Survey. West Lafayette: Purdue University,
• . ..._., Cooperative Extension Service, CES Paper #54.
I
Eastman, Harold
1954 ''The process of urbanization and criminal behavior: A
restudy of culture conflict." Iowa City: University of
Iowa, unpublished Ph.D. thesis.
Footlick, .Terome K.
1979 "Crime on tlic Farm." Newsweek. October 3, 1977.
Gibbons, Don C.
1972 "Crime in the Hinterland." Criminology. 10(2):177-191.
Phillips, G. Howard
1975 Crime in Rural Ohio. Final Report to the Ohio Farm Bureau
Federation. Columbus: The Ohio State University, AERS
(mimeographed).
Phillips, G. Howard, George Kreps, and Cat~y Moody
1976 Environmental Factors in Rural Crime. Wooster: Ohio
Agricultural Research anJ Development Center, Research
Circular 224.
U.S. Department of Justice
1975 Criminal Victimization Surveys in the Nation's Five
Largest Cities. Washington, D.C.: U.S. Government
Printing Office.
U.S. Department of Justice
1976 Criminal Victimization in the United States: A Comparison
of 1975 and 1976 Findings. Washington, D.C.: U.S. Govern
ment Printing Office.
"""'.

.... ' . ~
/
Warren, Roland
1978 The Community in America (3rd edition). Chicago:
Rand McNally, Inc.
'