introduction of peroxo groups into titania: preparing ... fileintroduction of peroxo groups into...
TRANSCRIPT

Seediscussions,stats,andauthorprofilesforthispublicationat:http://www.researchgate.net/publication/280538609
Introductionofperoxogroupsintotitania:Preparing,characterizationandpropertiesofthenewperoxo-containingphase
ARTICLEinCRYSTENGCOMM·JULY2015
ImpactFactor:4.03·DOI:10.1039/C5CE01090J
READS
8
8AUTHORS,INCLUDING:
E.V.Savinkina
MoscowStateUniversityofFineChemicalT…
44PUBLICATIONS78CITATIONS
SEEPROFILE
ENKabachkov
RussianAcademyofSciences
59PUBLICATIONS18CITATIONS
SEEPROFILE
Availablefrom:ENKabachkov
Retrievedon:29October2015
This is an Accepted Manuscript, which has been through the Royal Society of Chemistry peer review process and has been accepted for publication.
Accepted Manuscripts are published online shortly after acceptance, before technical editing, formatting and proof reading. Using this free service, authors can make their results available to the community, in citable form, before we publish the edited article. We will replace this Accepted Manuscript with the edited and formatted Advance Article as soon as it is available.
You can find more information about Accepted Manuscripts in the Information for Authors.
Please note that technical editing may introduce minor changes to the text and/or graphics, which may alter content. The journal’s standard Terms & Conditions and the Ethical guidelines still apply. In no event shall the Royal Society of Chemistry be held responsible for any errors or omissions in this Accepted Manuscript or any consequences arising from the use of any information it contains.
Accepted Manuscript
www.rsc.org/crystengcomm
CrystEngComm
View Article OnlineView Journal
This article can be cited before page numbers have been issued, to do this please use: E. Savinkina, L.
Obolenskaya, G. Kuzmicheva, E. kabachkov, A. Gainanova, Y. V. Zubavichus, V. Murzin and N. Sadovskaya,
CrystEngComm, 2015, DOI: 10.1039/C5CE01090J.

Journal Name RSCPublishing
ARTICLE
This journal is © The Royal Society of Chemistry 2013 J. Name., 2013, 00, 1-3 | 1
Cite this: DOI: 10.1039/x0xx00000x
Received 00th January 2012,
Accepted 00th January 2012
DOI: 10.1039/x0xx00000x
www.rsc.org/
Introduction of peroxo groups into titania: Preparing,
characterization and properties of the new peroxo-
containing phase
E. V. Savinkina,a L. N. Obolenskaya,a G. M. Kuzmicheva,a E. N. Kabachkov,b,c A. A. Gainanova,a Y. V. Zubavichus,d V. Y. Murzind and N. V. Sadovskayae
The new phase, where peroxo groups are incorporated into titania particles, along with anatase and hydrated η-TiO2 with peroxo groups on the surface of titania nanoparticles, were prepared by introduction of H2O2 into reaction mixtures while synthesizing TiO2 from TiOSO4 or by cold impregnation of pre-synthesized TiO2. The samples were studied by a complex of methods (classical and synchrotron-radiation X-ray powder diffraction, small-angle X-ray scattering, high-resolution scanning electron microscopy with energy-dispersive X-ray spectroscopy, X-ray absorption spectroscopy, IR and Raman spectroscopy, X-ray photoelectron spectroscopy, UV-vis diffuse reflectance and absorption spectroscopy, DSC). The [TiOx(O2)2–x(H2O)m] phase was first structurally characterized and compared to η-TiO2. Most samples of H2O2-sensitized TiO2 discolor methyl orange under visible light irradiation faster than commercial Hombikat UV100 treated with H2O2. The activity of the samples strongly relating to their phase composition was associated with existence of large amount of titanium peroxo complexes along with formation of mixed-phase samples.
Introduction
Titanium dioxide is a wide band-gap semiconductor that can be excited to produce electron–hole pairs when irradiated with light. Such photo-induced electron–hole pairs have been used to generate electricity in solar cells, to split water into hydrogen and oxygen, to oxidize and degrade inorganic/organic/biological compounds in environments as well as to create superhydrophilicity.1 Among many candidates for photocatalysis, TiO2 is almost the only material suitable for industrial use.2-5 The most well-known TiO2 crystal structures, rutile, brookite and anatase, are commonly used as photocatalysts, with anatase showing greater photocatalytic activity for most reactions.6-8 The differences in lattice structures of anatase and rutile cause different densities and electronic band structures, leading to different band gaps (3.20 and 3.02 eV for bulk anatase and rutile, respectively).9 Recently obtained nanosize “η-TiO2”, which small crystals when contacted with electrolyte solutions and vapors, water for example, generate plethora of surface hydroxyl groups, highly reactive towards adsorption reactions with contaminant
molecules and ions, is a promising material for sorption and (photo)catalysis.10
Visible-light activated TiO2 can be prepared by doping or sensitizing with dyes.11,12 However, dye sensitization is usually accompanied by such problems as dye desorption and decomposition.13 Titanium(IV) is known to form colored peroxo compounds, their color and stability depending on pH.14,15 Therefore, peroxide can be used for sensitizing titania. Hydrogen peroxide was often applied to disperse titania particles. Thus, it was used as a coordination agent to leach Ti from the hydrolyzed titania residue prepared from natural titanium minerals; the peroxo-titania powder prepared by boiling the aqueous titanium peroxide solution was crystalline anatase phase; a well-crystallized anatase and rutile could be obtained through calcining at the temperature of 800 and 1000°C, respectively.16 Hydrogen peroxide is widely used in catalyst and photocatalysis fields to obtain nanosized TiO2 thin film.17-19 Anatase nanocrystals were obtained by hydrothermal treatment of water-soluble titanium complexes prepared by addition of a complexing agent such as glycolic acid or citric acid to the yellow transparent solution containing the titanium-peroxo complex.20 Formation of spindle-type, monodispersed
Page 1 of 12 CrystEngComm
Cry
stE
ngC
omm
Acc
epte
dM
anus
crip
t
Publ
ishe
d on
24
July
201
5. D
ownl
oade
d by
KU
NG
L T
EK
NIS
KA
HO
GSK
OL
AN
on
25/0
7/20
15 1
4:31
:16.
View Article OnlineDOI: 10.1039/C5CE01090J
ARTICLE Journal Name
2 | J. Name., 2012, 00, 1-3 This journal is © The Royal Society of Chemistry 2012
anatase nanorods from a peroxotitanate solution without the use of organics is reported; the initial amorphous gel was converted to anatase titania rods using ammonia as a shape controller.21 For preparing titania powders or films, some authors used peroxo titanic acid pre-synthesized from titanium tetrachloride, titanyl sulfate or tetrabutoxytitanium(IV).22-26 Annealing of the products destroyed peroxo complexes, therefore the resulting samples showed no photocatalytic activity under visible light. However, annealing of thin films prepared from peroxotitanic acid produced anatase, which was active under visible light in the reaction of decolouration of methyl orange (MO).27 Recently, we have found decolouration of methyl orange for the samples prepared by cold impregnation and by introduction of H2O2 solutions into reaction mixtures while preparing TiO2 from solvated TiOSO4.
28 The purpose of the work was to prepare titania containing peroxo groups both on the surface and in the bulk of titania nanoparticles and to find correlations between conditions of preparing samples of nano-titania modified with H2O2, their characteristics and properties. Experimental
Chemicals
Titanyl sulfate (TiO)SO4⋅2H2O (technical grade) and (TiO)SO4⋅хH2SO4⋅yH2O (for synthesis) was purchased from Sigma Aldrich. Other reagents were analytical grade. All commercial reagents were used without further purification. Concentration of H2O2 solutions was monitored by titration with KMnO4.
Synthetic procedures
Sample 1 was prepared by suspending self-made anatase (0.25 g) in 50 mL H2O2 (10 M). The reaction mixture was stirred at room temperature for 40 min. The resulting powder was filtered off, washed with water and acetone and dried at room temperature. Nanosized anatase for sample 1 was prepared by the earlier reported procedure.29 Sample 2 was prepared by heating the mixture of 5.00 g TiOSO4·2H2O and 50 mL H2O up to 90°C followed by stirring at 90–95°C for 40 min and at 79–81°C for 220 min, addition of 10 mL H2O2 (10 M) and stirring at 79–81°C for 40 min. In several days, the solid was filtered off, washed with water and acetone and dried at 90°C for 1 h. Sample 3 was prepared similarly, but 3 mL NaOH (0.1 M) were added along with H2O2. Sample 4 was prepared by heating the mixture of 4.32 g TiOSO4·2H2O, 40 mL H2O and 2 mL conc. H2SO4 up to 90°C and stirring at 88–93°C for 28 min followed by addition of 25 mL Cs2SO4 (0.4 M) and 3 mL H2O2 (1 M). In several days, the resulting powder was filtered off, washed with water and acetone and dried at 90°C for 1 h. Sample 5 was prepared by re-dispersion of sample 4 in 25 mL NaOH (0.1 M). Sample 6 was prepared by heating the mixture of 7.35 g TiOSO4
.xH2SO4.yH2O and 40 mL H2O up to 87°C and stirring
at 86–90°C for 15 min followed by addition of 54 mL conc.
HCl and 2 mL H2O2 (9 M). In several days, the resulting powder was filtered off, washed with water and acetone and dried at 90°C for 1 h. Sample 7 was prepared similarly, but 30 mL KCl (4.5 M) and 10 mL EDTA (5·10−4 M) were added along with H2O2. Sample 8 was prepared by grinding the mixture of TiOSO4·2H2O (5 g) and 10 mL of H2O2 (8.5 M), which was pre-cooled down to –21°C, followed by treatment with 50 mL H2O, heating up to 90°C and stirring at 90–95°C for 40 min and 79–81°C for 260 min. In several days, the solid was filtered off, washed with water and acetone and dried at room temperature. Samples 9 and 10 were prepared similarly, but with the use of 10 M and 21 M H2O2, respectively. Sample 11 was prepared by stirring the mixture of TiOSO4·2H2O (2.16 g) and 100 mL of H2O2 (10 M) for 90−105 min with self-heating up to 100°C. In several days, the solid was filtered off, washed with water and acetone and dried at room temperature.
Characterization
X-ray diffraction (XRD) patterns were recorded with sample rotation on an HZG-4 (planar graphite monochromator) diffractometer: CuKα radiation in the diffracted beam, stepwise mode (counting time 10 s, a step of 0.02°, 2θ = 2–50°). The intensity data set was reduced using the PROFILE FITTING V 4.0 software package.30 The crystallite sizes were calculated using the Warren formula:31 D = Kλ/βcosθ; where λ = 1.54051 Å, 2θ ~ 25° (d ~ 3.5 Å; anatase, reflection 101) and ~ 27.5° (d ~ 3.25 Å; rutile, reflection 110), β is the widening of the reflection about instrumental width (β = [(FWHM)exp
2 –
(FWHM)R2]1/2, where (FWHM)exp and (FWHM)R are the measured
diffraction peak widths at half height for TiO2 and the α-Al2O3 standard, respectively), K (the Scherrer coefficient characterizing crystallite shape) was set to 0.9. Standard deviation was ±5%. The anatase content in the rutile-containing samples was calculated using the equation: xR (%) = [1 + 0.65(IA / IR)]–1, xA (%) = 100 – xR, were IA and IR are integral intensities of anatase reflection 101 and rutile reflection 110. We also used synchrotron radiated X-ray powder diffraction (SR-XRPD) and X-ray absorption spectroscopy at the K edge of titanium. The measurements were carried out at the “Structural Materials Science” end-station installed at the Kurchatov synchrotron radiation source.32,33 The X-ray diffraction patterns were measured in a transmission geometry (Debye-Scherrer) using Fujifilm phosphor imaging plates coated with a storage layer as an area detector. The X-ray beam size was 200×200 µm2, the wavelength λ = 0.68886 Å, the sample-to-detector distance was 150 mm, and the exposure time was 15 min. The imaging plates were digitized using a Fuji BAS-5000 scanner with a step of 100 µm. Two-dimensional diffraction patterns were integrated into standard I(2θ) patterns with the Fit2D software package.34 The integration was carried out applying corrections for the deviation of the phosphor imaging plate from the perpendicular orientation with respect to the X-ray beam, the precise shape of
Page 2 of 12CrystEngComm
Cry
stE
ngC
omm
Acc
epte
dM
anus
crip
t
Publ
ishe
d on
24
July
201
5. D
ownl
oade
d by
KU
NG
L T
EK
NIS
KA
HO
GSK
OL
AN
on
25/0
7/20
15 1
4:31
:16.
View Article OnlineDOI: 10.1039/C5CE01090J
Journal Name ARTICLE
This journal is © The Royal Society of Chemistry 2012 J. Name., 2012, 00, 1-3 | 3
the integration region, and the linear polarization of synchrotron radiation. The angular scale of the diffraction patterns was calibrated using the polycrystalline NIST SRM640c standard Si. Small angle X-ray scattering data were recorded on a special SAXSess instrument (Anton Paar, Austria; CuKα radiation, λ = 1.5418 Ǻ, linear collimation, collection time 3 min, and measurement in transmission geometry in the range 2θ angles 0°–40°). Powders were prepared as a homogeneous layer less than 0.2 mm thick placed between two thin strips of X-ray amorphous film. The size distribution functions of particles were calculated from SAXS curves in the range of 2θ angles 0°–7° using the GNOM program;35 the particles were assumed to be spherical. The XAFS (EXAFS and XANES) spectra at the K edge of titanium (E0 ~ 4966 eV) were measured in a transmission geometry using two ionization chambers positioned before and after the sample. To optimize the efficiency of performance of the chambers, they were filled with mixtures of nitrogen and argon to absorb 20% of the incident beam in the first chamber and 80% in the second one. To improve the statistical signal-to-noise ratio in the measured spectra, six independent scans were obtained and averaged for each sample. The total acquisition time was 25–30 min per scan. In addition to samples of nanocrystalline titanium dioxide, the reference spectra of anatase and rutile were measured under the same conditions. IR spectra were recorded with an Infralum FT-02 spectrometer (4000–400 cm–1) in nujol. Raman spectra were analyzed on an RFS 100/S FT Raman spectrometer (Bruker) using a 1060-nm Nd laser (the power density on the sample surface did not exceed 50 W/cm2) with a spectral resolution 2 cm–1. Differential scanning calorimetry (DSC) was performed with the use of a DSC204F1 Phoenix (NETZSCH-Geratebau GmbH) instrument with the scanning rate of 10°C per minute in the Ar atmosphere; accuracy ±0.1°C. The microstructure of powdered nanoparticles was studied using a 7500F high-resolution scanning electron microscope. Images were obtained in the low-energy secondary electron mode, because this mode provided the highest resolution (at the 20 and 2 keV energy of the primary beam, the resolution was 1.0 and 1.5 nm, respectively). To exclude the charging effects, a platinum film was deposited on the particle surface by magnetron sputtering (the electrical current was 30 µA, the sputtering time was 20 s, the target to sample distance was 40 cm, and the pressure was 5 Pa). Under these conditions, a platinum film of 5–10 nm thickness was obtained. To exclude artifacts inherited from the deposition of a platinum layer on the particle surface, we performed preliminary experiments on the deposition of platinum onto silicon single crystals under the same conditions. The platinum particle size on single-crystal faces obtained under the specified sputtering conditions was 4–5 nm. We also used GENTLE BEAM mode, intended to ensure high resolution at a low accelerating voltage. Local measurements of the elemental composition were carried out by EDX spectroscopy using an INCA Penta FETx 3 energy-dispersive X-ray microanalysis system (OXFORD, UK)
coupled with a scanning electron microscope. The calibration (6 iterations) was performed with 2 bands of the СоK radiation using cobalt metal as a reference. The quantitative analysis was carried out using the INCA Penta FET program. The standard deviation was ±0.5%. UV-vis diffuse reflectance spectra were recorded with a THERMO SPECTRONIC ~ VISION32 spectrometer in the 350–849 nm range with a 0.49 nm step with the use of thin films (1.0–1.2 mm) of freshly prepared sample. X-ray photoelectron spectra were obtained with a PHOIBOS 150 MCD spectrometer, monochromatic MgKα radiation (hν = 1253.6 eV). The powder was put onto the In surface. The pressure in the sample chamber did not exceed 3·10–9 Torr, the power of the source was 225 W. X-ray source was placed at 45° with respect to the sample surface. The spectra were recorded with constant transmission energy (30 eV, step 1eV for a survey spectrum and 10 eV, step 0.1 eV for peaks), 10 atomic layers depth, 1 cm2 surface area. The C1s peak (284.8 eV) was used for calibration. The sorption capacity of the samples with respect to nitrogen at –196°C was measured by the static volumetric method (ASAP 2020, Micromeritics); the measurement results were presented in the form of sorption (adsorption and desorption) isotherms. The specific surface of the samples was determined by the Brunauer–Emmett–Teller (BET) method and the comparative method (CM) from the adsorption branch of the isotherm in the ranges of equilibrium relative nitrogen pressures: 0.05–0.35 and 0.4–0.8, respectively. The standard isotherm was obtained for nonporous standard sample ASKh-1-4 (BET specific surface 4.18 m2 g–1), GSO (State Standard Sample) 9735-2010 (set of standard samples of nanostructured aluminum oxide ASKh-1). The average size (NCM, nm) for spherical particles was calculated with the equation NCM = 6·103/ρSCM,36 where ρ = 3.91 g/m3 is the X-ray density of anatase.37 The volumes of nanopores (Vnp) and ultrananopores (Vunp) (in this study, nanopores were considered to be pores less than 300 nm in diameter, while the term “ultrananopore” was used for pores less than 2 nm in diameter, filled according to the bulk mechanism in the range of low nitrogen pressures) were calculated from the earlier reported equations.38,39
Methyl orange (MO) decolouration
A powdered sample (the weight content was 0.4 g/L) was added to an aqueous solution of the dye (the initial concentration was 0.05 mmol/L); pH ~ 5 for samples 1–9 and 11, pH < 3 for sample 10. The resulting suspension (the volume was 50 mL) was irradiated under visible light (halogen lamp, wavelength range > 450 nm, power of the radiation source 250 W) in an open vessel (the irradiated surface area was 0.07 m2) with continuous stirring using a magnetic stirrer. The changes in the МО concentration during the reaction (с/с0) were monitored at λ = 455–470 and 500–515 nm for samples 1–9, 11 and 10, respectively. The model reaction is pseudo-first-order; the rate constant (k) is calculated as the slope of the linear semilogarithmic plot of с/с0 vs the irradiation time τ; in all
Page 3 of 12 CrystEngComm
Cry
stE
ngC
omm
Acc
epte
dM
anus
crip
t
Publ
ishe
d on
24
July
201
5. D
ownl
oade
d by
KU
NG
L T
EK
NIS
KA
HO
GSK
OL
AN
on
25/0
7/20
15 1
4:31
:16.
View Article OnlineDOI: 10.1039/C5CE01090J
ARTICLE Journal Name
4 | J. Name., 2012, 00, 1-3 This journal is © The Royal Society of Chemistry 2012
cases, the validity of the linear approximation of the kinetic curves characterized by the R factor was not lower than 0.95; the error of the determination of the reaction rate constant 10%. Results and discussion
Composition, morphology and structure of H2O2-modified TiO2
The traditional technique of sensitizing titania is its cold impregnation with various dyes. Sample 1 was prepared similarly by treatment of pre-synthesized and dried anatase with H2O2. More effective method is based on introduction of a sensitizer into the reaction mixture while synthesizing titania, e.g. by hydrolysis of titanyl sulfate.28 Samples 2 and 3 were prepared by prolonged hydrolysis of TiOSO4
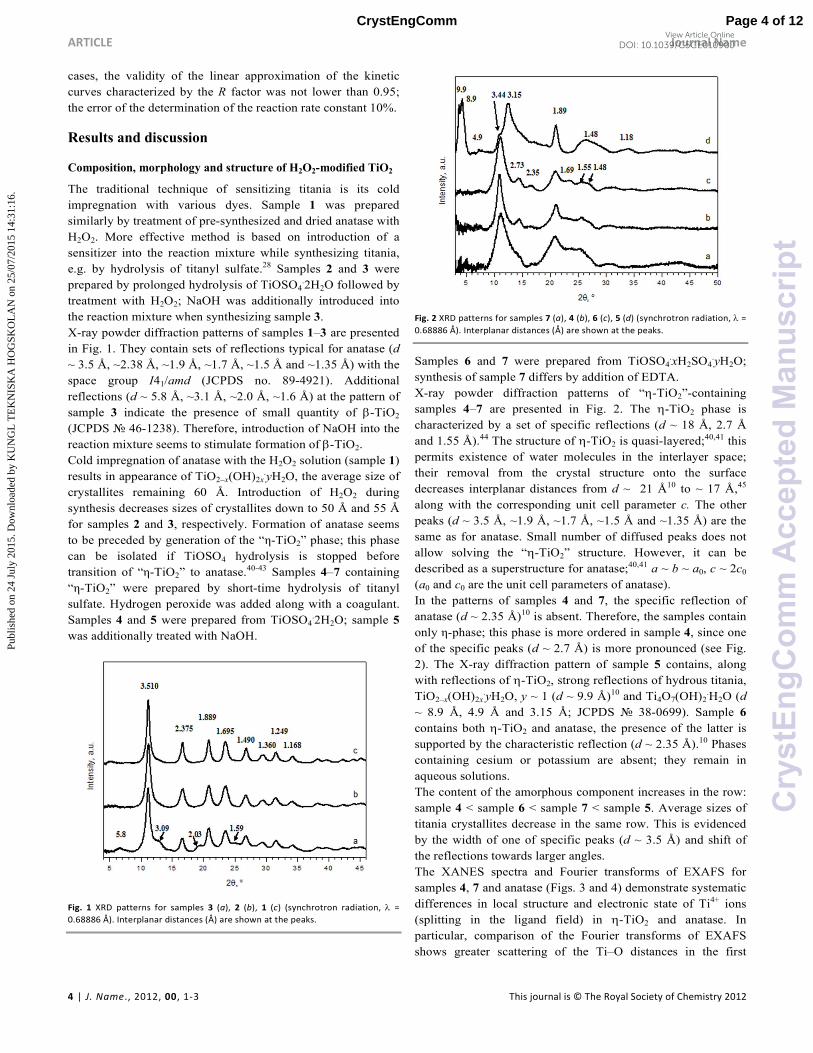
.2H2O followed by treatment with H2O2; NaOH was additionally introduced into the reaction mixture when synthesizing sample 3. X-ray powder diffraction patterns of samples 1–3 are presented in Fig. 1. They contain sets of reflections typical for anatase (d ~ 3.5 Å, ~2.38 Å, ~1.9 Å, ~1.7 Å, ~1.5 Å and ~1.35 Å) with the space group I41/amd (JCPDS no. 89-4921). Additional reflections (d ~ 5.8 Å, ~3.1 Å, ~2.0 Å, ~1.6 Å) at the pattern of sample 3 indicate the presence of small quantity of β-TiO2
(JCPDS № 46-1238). Therefore, introduction of NaOH into the reaction mixture seems to stimulate formation of β-TiO2. Cold impregnation of anatase with the H2O2 solution (sample 1) results in appearance of TiO2–x(OH)2x
.yH2O, the average size of crystallites remaining 60 Å. Introduction of H2O2 during synthesis decreases sizes of crystallites down to 50 Å and 55 Å for samples 2 and 3, respectively. Formation of anatase seems to be preceded by generation of the “η-TiO2” phase; this phase can be isolated if TiOSO4 hydrolysis is stopped before transition of “η-TiO2” to anatase.40-43 Samples 4–7 containing “η-TiO2” were prepared by short-time hydrolysis of titanyl sulfate. Hydrogen peroxide was added along with a coagulant. Samples 4 and 5 were prepared from TiOSO4
.2H2O; sample 5 was additionally treated with NaOH.
Fig. 1 XRD patterns for samples 3 (a), 2 (b), 1 (c) (synchrotron radiation, λ =
0.68886 Å). Interplanar distances (Å) are shown at the peaks.
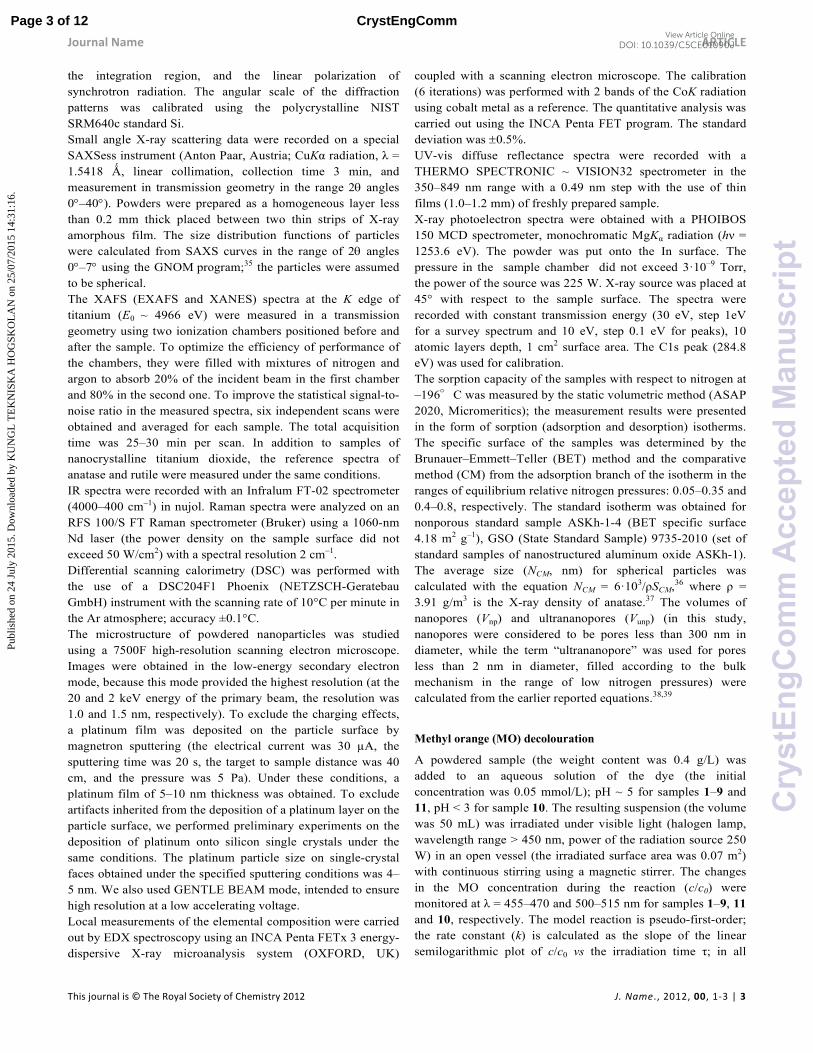
Fig. 2 XRD patterns for samples 7 (a), 4 (b), 6 (c), 5 (d) (synchrotron radiation, λ =
0.68886 Å). Interplanar distances (Å) are shown at the peaks.
Samples 6 and 7 were prepared from TiOSO4.xH2SO4
.yH2O; synthesis of sample 7 differs by addition of EDTA. X-ray powder diffraction patterns of “η-TiO2”-containing samples 4–7 are presented in Fig. 2. The η-TiO2 phase is characterized by a set of specific reflections (d ~ 18 Å, 2.7 Å
and 1.55 Å).44 The structure of η-TiO2 is quasi-layered;40,41 this permits existence of water molecules in the interlayer space; their removal from the crystal structure onto the surface decreases interplanar distances from d ~ 21 Å10 to ~ 17 Å,45 along with the corresponding unit cell parameter с. The other peaks (d ~ 3.5 Å, ~1.9 Å, ~1.7 Å, ~1.5 Å and ~1.35 Å) are the same as for anatase. Small number of diffused peaks does not allow solving the “η-TiO2” structure. However, it can be described as a superstructure for anatase;40,41 a ~ b ~ a0, c ~ 2c0
(a0 and c0 are the unit cell parameters of anatase). In the patterns of samples 4 and 7, the specific reflection of anatase (d ~ 2.35 Å)10 is absent. Therefore, the samples contain only η-phase; this phase is more ordered in sample 4, since one of the specific peaks (d ~ 2.7 Å) is more pronounced (see Fig. 2). The X-ray diffraction pattern of sample 5 contains, along with reflections of η-TiO2, strong reflections of hydrous titania, TiO2–x(OH)2x
.yH2O, y ~ 1 (d ~ 9.9 Å)10 and Ti4O7(OH)2.H2O (d
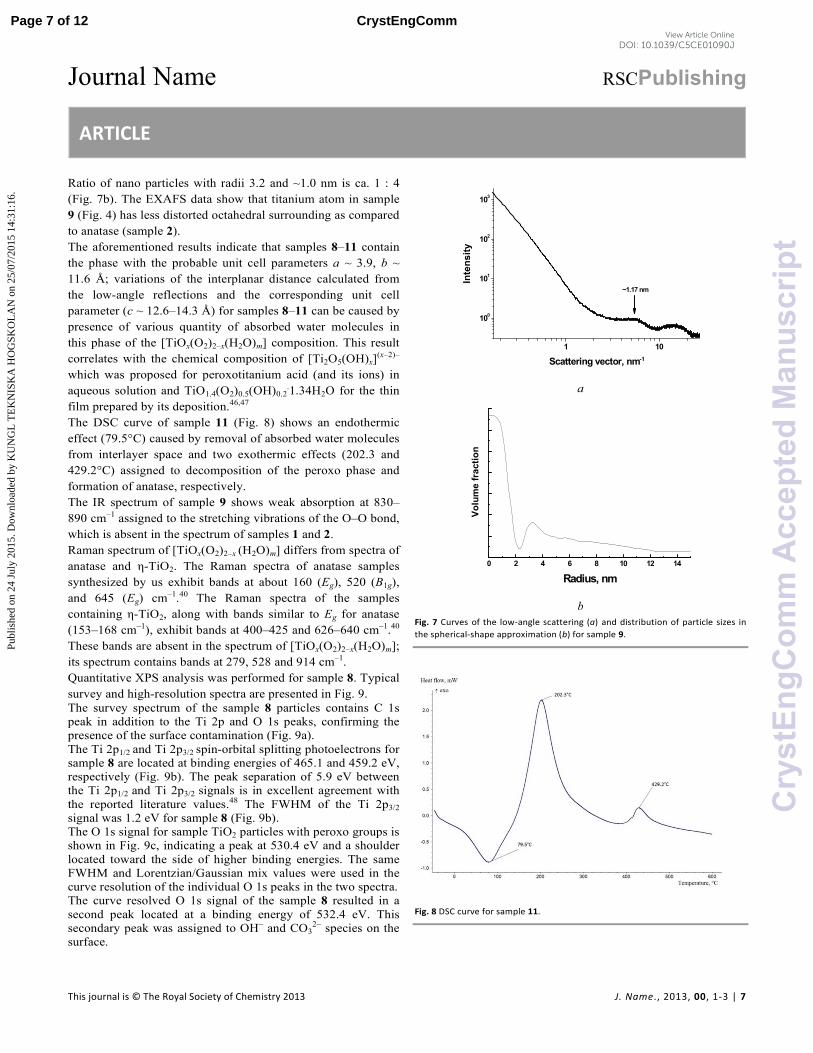
~ 8.9 Å, 4.9 Å and 3.15 Å; JCPDS № 38-0699). Sample 6 contains both η-TiO2 and anatase, the presence of the latter is supported by the characteristic reflection (d ~ 2.35 Å).10 Phases containing cesium or potassium are absent; they remain in aqueous solutions. The content of the amorphous component increases in the row: sample 4 < sample 6 < sample 7 < sample 5. Average sizes of titania crystallites decrease in the same row. This is evidenced by the width of one of specific peaks (d ~ 3.5 Å) and shift of the reflections towards larger angles. The XANES spectra and Fourier transforms of EXAFS for samples 4, 7 and anatase (Figs. 3 and 4) demonstrate systematic differences in local structure and electronic state of Ti4+ ions (splitting in the ligand field) in η-TiO2 and anatase. In particular, comparison of the Fourier transforms of EXAFS shows greater scattering of the Ti–O distances in the first
Page 4 of 12CrystEngComm
Cry
stE
ngC
omm
Acc
epte
dM
anus
crip
t
Publ
ishe
d on
24
July
201
5. D
ownl
oade
d by
KU
NG
L T
EK
NIS
KA
HO
GSK
OL
AN
on
25/0
7/20
15 1
4:31
:16.
View Article OnlineDOI: 10.1039/C5CE01090J
Journal Name ARTICLE
This journal is © The Royal Society of Chemistry 2012 J. Name., 2012, 00, 1-3 | 5
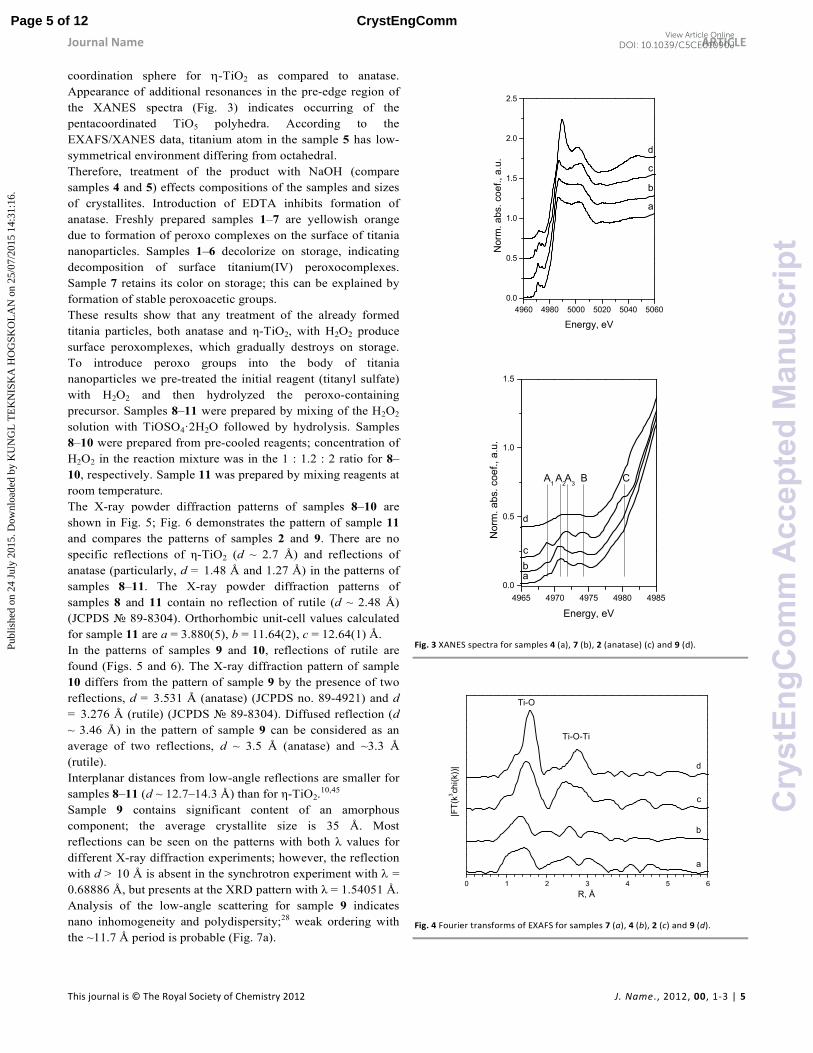
coordination sphere for η-TiO2 as compared to anatase. Appearance of additional resonances in the pre-edge region of the XANES spectra (Fig. 3) indicates occurring of the pentacoordinated TiO5 polyhedra. According to the EXAFS/XANES data, titanium atom in the sample 5 has low-symmetrical environment differing from octahedral. Therefore, treatment of the product with NaOH (compare samples 4 and 5) effects compositions of the samples and sizes of crystallites. Introduction of EDTA inhibits formation of anatase. Freshly prepared samples 1–7 are yellowish orange due to formation of peroxo complexes on the surface of titania nanoparticles. Samples 1–6 decolorize on storage, indicating decomposition of surface titanium(IV) peroxocomplexes. Sample 7 retains its color on storage; this can be explained by formation of stable peroxoacetic groups. These results show that any treatment of the already formed titania particles, both anatase and η-TiO2, with H2O2 produce surface peroxomplexes, which gradually destroys on storage. To introduce peroxo groups into the body of titania nanoparticles we pre-treated the initial reagent (titanyl sulfate) with H2O2 and then hydrolyzed the peroxo-containing precursor. Samples 8–11 were prepared by mixing of the H2O2 solution with TiOSO4·2H2O followed by hydrolysis. Samples 8–10 were prepared from pre-cooled reagents; concentration of H2O2 in the reaction mixture was in the 1 : 1.2 : 2 ratio for 8–10, respectively. Sample 11 was prepared by mixing reagents at room temperature. The X-ray powder diffraction patterns of samples 8–10 are shown in Fig. 5; Fig. 6 demonstrates the pattern of sample 11 and compares the patterns of samples 2 and 9. There are no specific reflections of η-TiO2 (d ~ 2.7 Å) and reflections of anatase (particularly, d = 1.48 Å and 1.27 Å) in the patterns of samples 8–11. The X-ray powder diffraction patterns of samples 8 and 11 contain no reflection of rutile (d ~ 2.48 Å) (JCPDS № 89-8304). Orthorhombic unit-cell values calculated for sample 11 are a = 3.880(5), b = 11.64(2), c = 12.64(1) Å. In the patterns of samples 9 and 10, reflections of rutile are found (Figs. 5 and 6). The X-ray diffraction pattern of sample 10 differs from the pattern of sample 9 by the presence of two reflections, d = 3.531 Å (anatase) (JCPDS no. 89-4921) and d
= 3.276 Å (rutile) (JCPDS № 89-8304). Diffused reflection (d
~ 3.46 Å) in the pattern of sample 9 can be considered as an average of two reflections, d ~ 3.5 Å (anatase) and ~3.3 Å (rutile). Interplanar distances from low-angle reflections are smaller for samples 8–11 (d ~ 12.7–14.3 Å) than for η-TiO2.
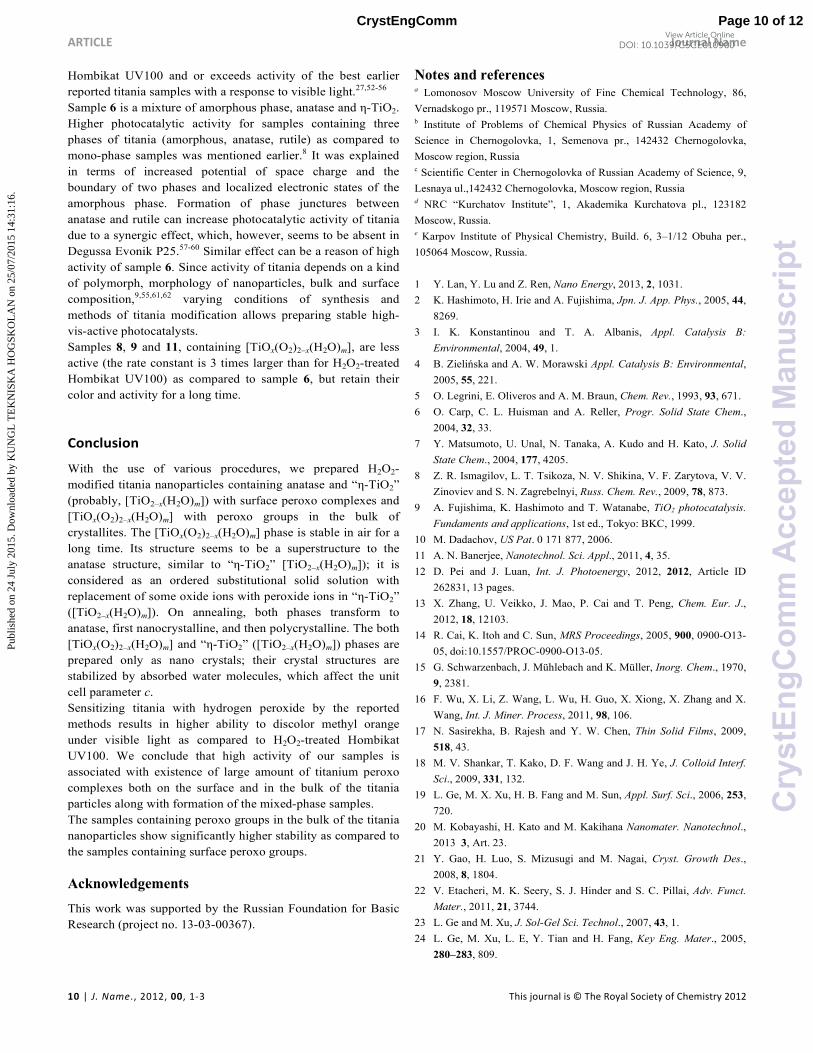
10,45 Sample 9 contains significant content of an amorphous component; the average crystallite size is 35 Å. Most reflections can be seen on the patterns with both λ values for different X-ray diffraction experiments; however, the reflection with d > 10 Å is absent in the synchrotron experiment with λ = 0.68886 Å, but presents at the XRD pattern with λ = 1.54051 Å. Analysis of the low-angle scattering for sample 9 indicates nano inhomogeneity and polydispersity;28 weak ordering with the ~11.7 Å period is probable (Fig. 7a).
4960 4980 5000 5020 5040 5060
0.0
0.5
1.0
1.5
2.0
2.5
Norm
. abs. coef., a.u.
Energy, eV
d
c
b
a
4965 4970 4975 4980 4985
0.0
0.5
1.0
1.5
CA3BA
1
Norm
. abs. coef., a.u.
Energy, eV
A2
d
c
ba
Fig. 3 XANES spectra for samples 4 (a), 7 (b), 2 (anatase) (c) and 9 (d).
0 1 2 3 4 5 6
d
c
b
Ti-O-Ti
|FT(k
3chi(k))|
R, Å
Ti-O
a
Fig. 4 Fourier transforms of EXAFS for samples 7 (a), 4 (b), 2 (c) and 9 (d).
Page 5 of 12 CrystEngComm
Cry
stE
ngC
omm
Acc
epte
dM
anus
crip
t
Publ
ishe
d on
24
July
201
5. D
ownl
oade
d by
KU
NG
L T
EK
NIS
KA
HO
GSK
OL
AN
on
25/0
7/20
15 1
4:31
:16.
View Article OnlineDOI: 10.1039/C5CE01090J

ARTICLE Journal Name
6 | J. Name., 2012, 00, 1-3 This journal is © The Royal Society of Chemistry 2012
Fig. 5 XRD patterns for samples 8 (a), 9 (b), 10 (c) without annealing; samples 8 (d), 9 (e), 10 (f), annealed at 400°C for 24 h; samples 8 (g), 9 (h), 10 (i), annealed at
800°C for 30 min (λ = 1.54051 Å). Interplanar distances (Å) are shown at the peaks.
a
b
Fig. 6 XRD patterns for a) sample 11 (λ = 1.54051 Å) and b) samples 2 (1) and 9 (2) (synchrotron radiation, λ = 0.68886 Å). Interplanar distances (Å) are shown at the
peaks.
Page 6 of 12CrystEngComm
Cry
stE
ngC
omm
Acc
epte
dM
anus
crip
t
Publ
ishe
d on
24
July
201
5. D
ownl
oade
d by
KU
NG
L T
EK
NIS
KA
HO
GSK
OL
AN
on
25/0
7/20
15 1
4:31
:16.
View Article OnlineDOI: 10.1039/C5CE01090J
Journal Name RSCPublishing
ARTICLE
This journal is © The Royal Society of Chemistry 2013 J. Name., 2013, 00, 1-3 | 7
Ratio of nano particles with radii 3.2 and ~1.0 nm is ca. 1 : 4 (Fig. 7b). The EXAFS data show that titanium atom in sample 9 (Fig. 4) has less distorted octahedral surrounding as compared to anatase (sample 2). The aforementioned results indicate that samples 8–11 contain the phase with the probable unit cell parameters a ~ 3.9, b ~ 11.6 Å; variations of the interplanar distance calculated from the low-angle reflections and the corresponding unit cell parameter (с ~ 12.6–14.3 Å) for samples 8–11 can be caused by presence of various quantity of absorbed water molecules in this phase of the [TiOx(O2)2–x(H2O)m] composition. This result correlates with the chemical composition of [Ti2O5(OH)x]
(x–2)– which was proposed for peroxotitanium acid (and its ions) in aqueous solution and TiO1.4(O2)0.5(OH)0.2
.1.34H2O for the thin film prepared by its deposition.46,47
The DSC curve of sample 11 (Fig. 8) shows an endothermic effect (79.5°C) caused by removal of absorbed water molecules from interlayer space and two exothermic effects (202.3 and 429.2°C) assigned to decomposition of the peroxo phase and formation of anatase, respectively. The IR spectrum of sample 9 shows weak absorption at 830–890 cm–1 assigned to the stretching vibrations of the O–O bond, which is absent in the spectrum of samples 1 and 2. Raman spectrum of [TiOx(O2)2–x (H2O)m] differs from spectra of anatase and η-TiO2. The Raman spectra of anatase samples synthesized by us exhibit bands at about 160 (Eg), 520 (B1g), and 645 (Eg) cm–1.40 The Raman spectra of the samples containing η-TiO2, along with bands similar to Eg for anatase (153–168 cm–1), exhibit bands at 400–425 and 626–640 cm–1.40 These bands are absent in the spectrum of [TiOx(O2)2–x(H2O)m]; its spectrum contains bands at 279, 528 and 914 cm–1.
Quantitative XPS analysis was performed for sample 8. Typical survey and high-resolution spectra are presented in Fig. 9. The survey spectrum of the sample 8 particles contains C 1s peak in addition to the Ti 2p and O 1s peaks, confirming the presence of the surface contamination (Fig. 9a). The Ti 2p1/2 and Ti 2p3/2 spin-orbital splitting photoelectrons for sample 8 are located at binding energies of 465.1 and 459.2 eV, respectively (Fig. 9b). The peak separation of 5.9 eV between the Ti 2p1/2 and Ti 2p3/2 signals is in excellent agreement with the reported literature values.48 The FWHM of the Ti 2p3/2 signal was 1.2 eV for sample 8 (Fig. 9b). The O 1s signal for sample TiO2 particles with peroxo groups is shown in Fig. 9c, indicating a peak at 530.4 eV and a shoulder located toward the side of higher binding energies. The same FWHM and Lorentzian/Gaussian mix values were used in the curve resolution of the individual O 1s peaks in the two spectra. The curve resolved O 1s signal of the sample 8 resulted in a second peak located at a binding energy of 532.4 eV. This secondary peak was assigned to OH– and CO3
2– species on the surface.
1 10
100
101
102
103
Intensity
Scattering vector, nm-1
~1.17 nm
a
0 2 4 6 8 10 12 14
Radius, nm
Volume fraction
b
Fig. 7 Curves of the low-angle scattering (a) and distribution of particle sizes in
the spherical-shape approximation (b) for sample 9.
Fig. 8 DSC curve for sample 11.
Page 7 of 12 CrystEngComm
Cry
stE
ngC
omm
Acc
epte
dM
anus
crip
t
Publ
ishe
d on
24
July
201
5. D
ownl
oade
d by
KU
NG
L T
EK
NIS
KA
HO
GSK
OL
AN
on
25/0
7/20
15 1
4:31
:16.
View Article OnlineDOI: 10.1039/C5CE01090J

ARTICLE Journal Name
8 | J. Name., 2012, 00, 1-3 This journal is © The Royal Society of Chemistry 2012
a
b
c
Fig. 9 X-ray photoelectron spectra of sample 8: a) survey Mg Kα photoelectron
spectra; b) high-resolution XPS spectra of the Ti 2p (no indication for formation
of a Ti3+ sub-oxide can be detected); c) high-resolution XPS spectra of the O 1s
peaks.
The values of the FWHM of the lower and higher binding energy peaks were 1.12 and 1.14 eV, respectively. The binding energy difference of 71.2 eV between the observed peak positions of Ti 2p1/2 and O 1s (oxide) is also in excellent agreement with reported literature values of 72.9–71.2 eV.49
X-ray photoelectron spectrum of sample 8 shows that its surface contain Ti (11%, as TiO2), O (35%, including 42% as Ti–O and 57% as adsorbed OH– and CO3
2– ions) and C (54%, including 6% as CO3
2– and 93% as C–C) (Fig. 8). We can conclude that there are numerous OH–, CO3
2– ions and adsorbed water molecules on the surface of nanoparticles. According to the EDX analysis, the oxygen content decreases in the row sample 10 (O, ~54.8 wt.%; Ti, ~44.3 wt. %; S, ~0.9 wt.%) > sample 9 (O, ~43.5 wt.%; Ti, ~56.2 wt.%; S, ~0.3 wt.%) > sample 2 (O, ~40.1 wt.%; Ti, ~56.4 wt.%; S, ~3.5 wt.%). Extremely high oxygen content in sample 10 can be caused by the presence of large quantity of OH groups on its surface. In contrast to samples 2 and 9, pH of its water suspension is lower 3. Nanoparticles in sample 9 and 10 are oval (< 50 nm) and spherical (< 100 nm), respectively (Fig. 10). Introduction of H2O2 at the first stage of the synthesis results in formation of titanium peroxide; samples 8–11 can be considered as titanium oxide modified with peroxo groups which are included into its crystal structure (and probably present onto its surface). The O2
2– groups make titanium coordination octahedron more symmetrical and promote formation of the superstructure based on the anatase structure with the unit cell parameters a ~ a0, b ~ 3a0 and variable c depending on water content (m in [TiOx(O2)2–x(H2O)m]). The presence of the O2
2– groups predictably increases the anatase subunit parameter along the y axis. Parameters of samples 8–10 are listed in table 1. For sample 11, sizes of crystallites are 3.5–5.5 Å; sizes of nanoparticles measured by BET and CM are ~65 and 50 nm, respectively; specific surface determined by BET and CM is 51 and 33 m2/g, respectively; specific volumes of ultra- and nanopores are 0.008 and 0.035 cm3/g, respectively; band gap 3.07 eV. Intensity of the yellow color of samples 8–11 does not reduce on storage for 15 months. They change color on annealing (table 1). The samples decolorize after annealing at 400°C for 24 h or at 800°C for 30 min. The reflection at small angles (d ~ 12.7–14.3 Å) assigned to the [TiOx(O2)2–x(H2O)m] phase widens and shifts towards larger angles (d ~ 10 Å) on heating to 150°C and disappears on annealing at 400°C indicating decomposition of the phase (Fig. 5). The samples annealed at 400°C and 800°C contain anatase as a main phase (table 1). X-ray powder diffraction patterns of samples 9 and 10 annealed at 400°C contain reflections (diffuse and sharp, respectively) of the rutile admixture; they become stronger and narrower on annealing at 800°C (Fig. 5). Small quantity of rutile (about 2%) is also found in sample 8 annealed at 800°C. These results agree with the presence of broad exothermic peaks on DSC patterns in the ~200–600°C and ~700–1000°C ranges indicating transitions amorphous hydrous TiO2 → nano-anatase and nano-anatase → nano-rutile.50 Increase of the H2O2 concentration favors formation of rutile even at 90–95°C; similar situation was observed earlier.51
Page 8 of 12CrystEngComm
Cry
stE
ngC
omm
Acc
epte
dM
anus
crip
t
Publ
ishe
d on
24
July
201
5. D
ownl
oade
d by
KU
NG
L T
EK
NIS
KA
HO
GSK
OL
AN
on
25/0
7/20
15 1
4:31
:16.
View Article OnlineDOI: 10.1039/C5CE01090J

Journal Name ARTICLE
This journal is © The Royal Society of Chemistry 2012 J. Name., 2012, 00, 1-3 | 9
Table 1. Phase composition, sizes of crystallites (D), color and rate constant of MO decolouration under visible light (k) for samples 8–10
Parameter Sample 8 Sample 9 Sample 10 Without annealing
Phase composition
Peroxo-phase Peroxo-phase + rutile
Peroxo-phase + rutile
D, Å 38 (2θ ~ 25°) 35 (2θ ~ 26°) 40 (2θ ~ 25°) Color Yellow
k, min–1 0.0109 0.0100 0.0037
Annealing at 150°C for 1 h Phase
composition Peroxo-phase Peroxo-phase
+ rutile Peroxo-phase
+ rutile
Color Pale yellow k, min–1 0.0014 0.0041 0.00049
Annealing at 400°C for 24 h
Phase composition
Anatase Anatase (86%) + rutile (14%)
Anatase (68%) + rutile (32%)
D, Å 145 180 (anatase) 90 (anatase), 60 (rutile)
Color White k, min–1 0.00072 0.0014 0.0034
Annealing at 800°C for 0.5 h
Phase composition
Anatase (98%) + rutile (2%) +
amorphous phase
Anatase (83%) + rutile (17%)
Anatase (67%) + rutile (33%)
D, Å 260 (anatase) 275 (anatase), 210 (rutile)
215 (anatase), 205 (rutile)
Color White k, min–1 0.00062 0.00066 0.0013
a
b
Fig. 10 Microphotographs of samples 9 (a) and 10 (b).
Decolouration of methyl orange
In order to explore the potential application of the H2O2-modified TiO2 in the removal of organic contaminants from wastewater, decolouration of MO upon visible light irradiation in the presence of the as-prepared samples was studied. A control experiment was also carried out under identical conditions in the presence of commercial nano-anatase Hombikat UV100 treated with H2O2 in the manner, similar to preparing sample 1. This model reaction can be used for evaluating activity of various samples, although the lowering of the dye concentration observed in the spectrometer might have been to dye-sensitising effects and/or photocatalysis. Activity of fresh-prepared samples 1–3 in the reaction of MO decolouration under visible light is higher than of commercial nano-anatase Hombikat UV100 treated with H2O2; rate constants are 0.0047, 0.0088, 0.0049 and 0.0035 min–1, respectively. Maximal activity was found for sample 2. Therefore, treatment of the reaction mixture with H2O2 while preparing anatase from TiOSO4 (sample 2) is more effective than cold impregnation of anatase, both commercial and self-made. The use of NaOH lowers activity of anatase (sample 3). Samples 1–3 and H2O2-treated Hombikat UV100 decolorized under storage for 3–4 months at room temperature (due to decomposition of peroxo compounds) and lose their ability to discolor methyl orange under visible light. Samples 5–7 containing η-TiO2 also discolor MO; rate constants are 0.017, 0.047 and 0.0049 min–1, respectively. Maximal activity was found for freshly-prepared sample 6; treatment with NaOH lowers activity of H2O2-modified titania. In contrast to samples 4–6 decolorizing under storage for 3–4 months and losing their activity under visible light, color and properties towards MO of sample 7 do not change on storage, but its activity was low initially. Activity of samples 8, 9 and 11 under visible light is better than of H2O2-treated commercial Hombikat UV100, activity of sample 10 under visible light being close to activity of the latter; rate constants for samples 8–11 are 0.0100, 0.0109, 0.0037 and 0.0099 min–1, respectively (the latter value was obtained with the halogen lamp of lower power, 60 W). Relatively low activity of sample 10 can be caused by large quantity of OH groups on its surface, which are able to interact with anionic SO3 groups of MO. High activity of samples 8 and 9 does not decrease on storage under light for 15 months. Therefore, these samples are the most promising for MO decolouration under visible light. On annealing, samples 8 and 9 bleach and lower their activity (table 1). Annealing of sample 10 up to 400°C increases its activity; it becomes close to the activity of H2O2-treated Hombikat UV100. However, further annealing lowers its activity. As a result, sensitization with H2O2 under various conditions allowed to prepare highly active titania nanoparticles containing anatase, η-TiO2 and [TiOx(O2)2–x(H2O)m]. The best activity was found for the freshly-prepared sample 6, containing η-TiO2; it is 13-fold higher than for H2O2-treated
Page 9 of 12 CrystEngComm
Cry
stE
ngC
omm
Acc
epte
dM
anus
crip
t
Publ
ishe
d on
24
July
201
5. D
ownl
oade
d by
KU
NG
L T
EK
NIS
KA
HO
GSK
OL
AN
on
25/0
7/20
15 1
4:31
:16.
View Article OnlineDOI: 10.1039/C5CE01090J
ARTICLE Journal Name
10 | J. Name., 2012, 00, 1-3 This journal is © The Royal Society of Chemistry 2012
Hombikat UV100 and or exceeds activity of the best earlier reported titania samples with a response to visible light.27,52-56 Sample 6 is a mixture of amorphous phase, anatase and η-TiO2. Higher photocatalytic activity for samples containing three phases of titania (amorphous, anatase, rutile) as compared to mono-phase samples was mentioned earlier.8 It was explained in terms of increased potential of space charge and the boundary of two phases and localized electronic states of the amorphous phase. Formation of phase junctures between anatase and rutile can increase photocatalytic activity of titania due to a synergic effect, which, however, seems to be absent in Degussa Evonik P25.57-60 Similar effect can be a reason of high activity of sample 6. Since activity of titania depends on a kind of polymorph, morphology of nanoparticles, bulk and surface composition,9,55,61,62 varying conditions of synthesis and methods of titania modification allows preparing stable high-vis-active photocatalysts. Samples 8, 9 and 11, containing [TiOx(O2)2–x(H2O)m], are less active (the rate constant is 3 times larger than for H2O2-treated Hombikat UV100) as compared to sample 6, but retain their color and activity for a long time.
Conclusion
With the use of various procedures, we prepared H2O2-modified titania nanoparticles containing anatase and “η-TiO2” (probably, [TiO2–x(H2O)m]) with surface peroxo complexes and [TiOx(O2)2–x(H2O)m] with peroxo groups in the bulk of crystallites. The [TiOx(O2)2–x(H2O)m] phase is stable in air for a long time. Its structure seems to be a superstructure to the anatase structure, similar to “η-TiO2” [TiO2–x(H2O)m]); it is considered as an ordered substitutional solid solution with replacement of some oxide ions with peroxide ions in “η-TiO2” ([TiO2–x(H2O)m]). On annealing, both phases transform to anatase, first nanocrystalline, and then polycrystalline. The both [TiOx(O2)2–x(H2O)m] and “η-TiO2” ([TiO2–x(H2O)m]) phases are prepared only as nano crystals; their crystal structures are stabilized by absorbed water molecules, which affect the unit cell parameter c. Sensitizing titania with hydrogen peroxide by the reported methods results in higher ability to discolor methyl orange under visible light as compared to H2O2-treated Hombikat UV100. We conclude that high activity of our samples is associated with existence of large amount of titanium peroxo complexes both on the surface and in the bulk of the titania particles along with formation of the mixed-phase samples. The samples containing peroxo groups in the bulk of the titania nanoparticles show significantly higher stability as compared to the samples containing surface peroxo groups.
Acknowledgements
This work was supported by the Russian Foundation for Basic Research (project no. 13-03-00367).
Notes and references a Lomonosov Moscow University of Fine Chemical Technology, 86, Vernadskogo pr., 119571 Moscow, Russia. b Institute of Problems of Chemical Physics of Russian Academy of Science in Chernogolovka, 1, Semenova pr., 142432 Chernogolovka, Moscow region, Russia c Scientific Center in Chernogolovka of Russian Academy of Science, 9, Lesnaya ul.,142432 Chernogolovka, Moscow region, Russia d NRC “Kurchatov Institute”, 1, Akademika Kurchatova pl., 123182 Moscow, Russia. e Karpov Institute of Physical Chemistry, Build. 6, 3–1/12 Obuha per., 105064 Moscow, Russia. 1 Y. Lan, Y. Lu and Z. Ren, Nano Energy, 2013, 2, 1031. 2 K. Hashimoto, H. Irie and A. Fujishima, Jpn. J. App. Phys., 2005, 44,
8269. 3 I. K. Konstantinou and T. A. Albanis, Appl. Catalysis B:
Environmental, 2004, 49, 1. 4 B. Zielińska and A. W. Morawski Appl. Catalysis B: Environmental,
2005, 55, 221. 5 O. Legrini, E. Oliveros and A. M. Braun, Chem. Rev., 1993, 93, 671. 6 O. Carp, C. L. Huisman and A. Reller, Progr. Solid State Chem.,
2004, 32, 33. 7 Y. Matsumoto, U. Unal, N. Tanaka, A. Kudo and H. Kato, J. Solid
State Chem., 2004, 177, 4205. 8 Z. R. Ismagilov, L. T. Tsikoza, N. V. Shikina, V. F. Zarytova, V. V.
Zinoviev and S. N. Zagrebelnyi, Russ. Chem. Rev., 2009, 78, 873. 9 A. Fujishima, K. Hashimoto and T. Watanabe, TiO2 photocatalysis.
Fundaments and applications, 1st ed., Tokyo: BKC, 1999. 10 M. Dadachov, US Pat. 0 171 877, 2006. 11 A. N. Banerjee, Nanotechnol. Sci. Appl., 2011, 4, 35. 12 D. Pei and J. Luan, Int. J. Photoenergy, 2012, 2012, Article ID
262831, 13 pages. 13 X. Zhang, U. Veikko, J. Mao, P. Cai and T. Peng, Chem. Eur. J.,
2012, 18, 12103. 14 R. Cai, K. Itoh and C. Sun, MRS Proceedings, 2005, 900, 0900-O13-
05, doi:10.1557/PROC-0900-O13-05. 15 G. Schwarzenbach, J. Mühlebach and K. Müller, Inorg. Chem., 1970,
9, 2381. 16 F. Wu, X. Li, Z. Wang, L. Wu, H. Guo, X. Xiong, X. Zhang and X.
Wang, Int. J. Miner. Process, 2011, 98, 106. 17 N. Sasirekha, B. Rajesh and Y. W. Chen, Thin Solid Films, 2009,
518, 43. 18 M. V. Shankar, T. Kako, D. F. Wang and J. H. Ye, J. Colloid Interf.
Sci., 2009, 331, 132. 19 L. Ge, M. X. Xu, H. B. Fang and M. Sun, Appl. Surf. Sci., 2006, 253,
720. 20 M. Kobayashi, H. Kato and M. Kakihana Nanomater. Nanotechnol.,
2013 3, Art. 23. 21 Y. Gao, H. Luo, S. Mizusugi and M. Nagai, Cryst. Growth Des.,
2008, 8, 1804. 22 V. Etacheri, M. K. Seery, S. J. Hinder and S. C. Pillai, Adv. Funct.
Mater., 2011, 21, 3744. 23 L. Ge and M. Xu, J. Sol-Gel Sci. Technol., 2007, 43, 1. 24 L. Ge, M. Xu, L. E, Y. Tian and H. Fang, Key Eng. Mater., 2005,
280–283, 809.
Page 10 of 12CrystEngComm
Cry
stE
ngC
omm
Acc
epte
dM
anus
crip
t
Publ
ishe
d on
24
July
201
5. D
ownl
oade
d by
KU
NG
L T
EK
NIS
KA
HO
GSK
OL
AN
on
25/0
7/20
15 1
4:31
:16.
View Article OnlineDOI: 10.1039/C5CE01090J

Journal Name ARTICLE
This journal is © The Royal Society of Chemistry 2012 J. Name., 2012, 00, 1-3 | 11
25 S. Karuppuchamy and J. M. Jeong, J. Oleo Sci., 2006, 55, 263. 26 R. S. Sonawane, S. G. Hegde and M. K. Dongare, Mater. Chem.
Phys., 2003, 77, 744. 27 J. Zou, J. Gao and Y. Wang, J. Photochem. Photobiol. A: Chemistry,
2009, 202, 128. 28 E. Savinkina, L. Obolenskaya and G. Kuzmicheva, Appl. Nanosci.,
2015, 5, 125. 29 L. N. Obolenskaya, G. M. Kuz’micheva, E. V. Savinkina, N. V.
Sadovskaya, A. V. Zhilkina, N. A. Prokudina and V. V. Chernyshev, Rus. Chem. Bull., 2012, 61, 2049.
30 V. V. Zhurov and S. A. Ivanov, Crystallogr. Rep., 1997, 42, 202. 31 B. E. Warren X-Ray Diffraction, New York: Dower Publications,
1990. 32 A. A. Chernyshov, A. A. Veligzhanin and Y. V. Zubavichus, Nucl.
Instr. Meth. Phys. Res. A, 2009, 603, 95. 33 N. N. Trofimova, A. A. Veligzhanin, V. Y. Murzin, A. A.
Chernyshov, E. V. Khramov, V. N. Zabluda, I. S. Edelman, Y. L. Slovokhotov and Y. V. Zubavichus, Rus. Nanotechnology, 2013, 8, 108.
34 A. P. Hammersley, S. O. Svensson, M. Hanfland, A. N. Fitch and D. Häusermann, High Press. Res., 1996, 14, 235.
35 D. I. Svergun J. Appl. Crystallogr., 1992, 25, 495. 36 V. A. Dzis’ko, A. P. Karnaukhov and D. V. Tarasova,
Physicochemical fundamentals for the synthesis of oxide catalysts, Nauka, Novosibirsk, 1978.
37 P. Villars, Material Phases Data System (MPDS), CH-6354 Vitznau, Switzerland; SpringerMaterials; sd_1627926 (Springer-Verlag GmbH, Heidelberg), 2014.
38 ISO 15901–2:2006 (E). Pore Size Distribution and Porosity of Solid
Materials by Mercury Porosimetry and Gas Adsorption. Part 2: Analysis of Mesopores and Macropores by Gas Adsorption
39 ISO 15901-3:2007. Pore Size Distribution and Porosity of Solid
Materials by Mercury Porosimetry and Gas Adsorption. Part 3: Analysis of Micropores by Gas Adsorption
40 G. M. Kuz’micheva, E. V. Savinkina, L. N. Obolenskaya, L. I. Belogorokhova, B. N. Mavrin, M. G. Chernobrovkin and A. I. Belogorokhov, Crystallogr. Rep., 2010, 55, 866.
41 G. M. Kuz’micheva, E. V. Savinkina, L. I. Belogorokhova, B. N. Mavrin, V. R. Flid, A. G. Yakovenko and A. I. Belogorokhov, Rus. J.
Phys. Chem. A, 2011, 85, 1037. 42 L. N. Obolenskaya, G. M. Kuz’micheva, E. V. Savinkina, N. A.
Prokudina, V. V. Chernyshov and N. V. Sadovskaya, Rus. J. Inorg.
Chem., 2012, 57, 1177. 43 E. V. Savinkina, G. M. Kuz’micheva, L. N. Obolenskaya and E. N.
Domoroshchina, RU Pat. 2 469 954, 2011. 44 G. Kuzmicheva, E. Savinkina, L. Obolenskaya, Y. Zubavichus, V.
Murzin and V. Podbelskiy, Proc. of the 8th European Meeting on Solar Chemistry and Photocatalysis: Environmental Applications – SPEA8 (Thessaloniki, Greece) p. 61, 2014.
45 G. M. Kuz’micheva, A. A. Gainanova, A. S. Orekhov, V. V. Klechkovskaya, N. V. Sadovskaya and V. V. Chernyshev, Cryst.
Rep., 2014, 59, 916. 46 J. Mühlebach, K. Müller and G. Schwarzenbach, Inorg. Chem., 1970,
9, 2381. 47 Y. Gao, Y. Masuda, Z. Peng, T. Yonezawa and K. Koumoto, J.
Mater. Chem., 2003, 13, 608.
48 E. McCafferty and J. P. Wightman, Surf. Interface Anal., 1998, 26, 549.
49 J. Chastian, Ed., Handbook of X-ray Photoelectron Spectroscopy;
Physical Electronics, MN ; Eden Prairie, 1992. 50 A. Gainanova, G. Kuz’micheva, E. Kopylova and A. Dorokhov.
Proc. of the 14th European Conference of Solid State Chemistry (ECSSC14) (Bordeaux, France) p. 127, 2013
51 L. N. Obolenskaya, E. N. Domoroschina, E. V. Savinkina and G. M. Kuzmicheva, Fund. Res., 2013, 1, 796.
52 N. Guiettai and H. A. Amar, Desalination, 2005, 185, 427. 53 X.-T. Zhou, H.-B. Ji and X.-J. Huang, Molecules, 2012, 17, 1149. 54 F. Chen, W. Zou, W. Qu and J. Zhang, Catal. Comm., 2009, 10,
1510. 55 R. S. Varma, B. Baruwati and J. Virkutyte, US Pat. 0 266 136, 2011. 56 E. V. Savinkina, L. N. Obolenskaya and G. M. Kuz’micheva. RU
Pat. 2 520 100, 2014. 57 F. Yu, Y. Wang, H. Tang, Y. Zhang, C. Jin, X. Liu, M. Li and J.
Wang, Catal. Comm., 2014, 51, 46. 58 J. Zhang, Q. Xu, Z. C. Feng, M. J. Li and C. Li, Angew. Chem. Int.
Ed., 2008, 47, 1766. 59 D. O. Scanlon, C. W. Dunnill, J. Buckeridge, S. A. Shevlin, A. J.
Logsdail, S. M. Woodley, C. R. A. Catlow, M. J. Powell, R. G. Palgrave, I. P. Parkin, G. W. Watson, T. W. Keal, P. Sherwood, A. Walsh and A. A. Sokol, Nature Mater., 2013, 12, 798.
60 Y. K. Kho, A. Iwase, W. Y. Teoh, L. Madler, A. Kudo and R. Amal, J. Phys. Chem. C, 2010, 114, 2821.
61 C. Kormann, D. W. Bahnemann and M. R. Hoffmann, J. Phys.
Chem., 1988, 92, 5196. 62 H. Lin, C. P. Huang, W. Li, C. Ni, S. I. Shah and Y.-H. Tseng, Appl.
Catal. B: Environmental, 2006, 68, 1.
Page 11 of 12 CrystEngComm
Cry
stE
ngC
omm
Acc
epte
dM
anus
crip
t
Publ
ishe
d on
24
July
201
5. D
ownl
oade
d by
KU
NG
L T
EK
NIS
KA
HO
GSK
OL
AN
on
25/0
7/20
15 1
4:31
:16.
View Article OnlineDOI: 10.1039/C5CE01090J

TiOSO4 + H2O2
H2O2-sensitized
anatase
H2O2-sensitized
η-TiO2[TiO
x(O2)2–x]
H2O
2-t
rea
ted
Ho
mb
ika
t U
V1
00
Page 12 of 12CrystEngComm
Cry
stE
ngC
omm
Acc
epte
dM
anus
crip
t
Publ
ishe
d on
24
July
201
5. D
ownl
oade
d by
KU
NG
L T
EK
NIS
KA
HO
GSK
OL
AN
on
25/0
7/20
15 1
4:31
:16.
View Article OnlineDOI: 10.1039/C5CE01090J