introduction inspection requirements secondary school information and data disc (ssid) other school...
TRANSCRIPT
INTRODUCTION
• Inspection requirements
• Secondary School Information and Data Disc (SSID)
• Other school information
INSPECTION REQUIREMENTS
• The Red Book
• Self-Evaluation
• Secondary School Information and Data Disc (SSID)
SSID
• Produced in consultation with serving principals
• Uses data from school census returns
• Can be edited by school
• Uses other data from C2k, eg Nova T

SSID
• Statistical Information
• Examination Analysis
• Curriculum
• Other Documents
STATISTICAL INFORMATION
•Enrolment trends
•Year group PTR
•Examination analysis summaries
•Publish
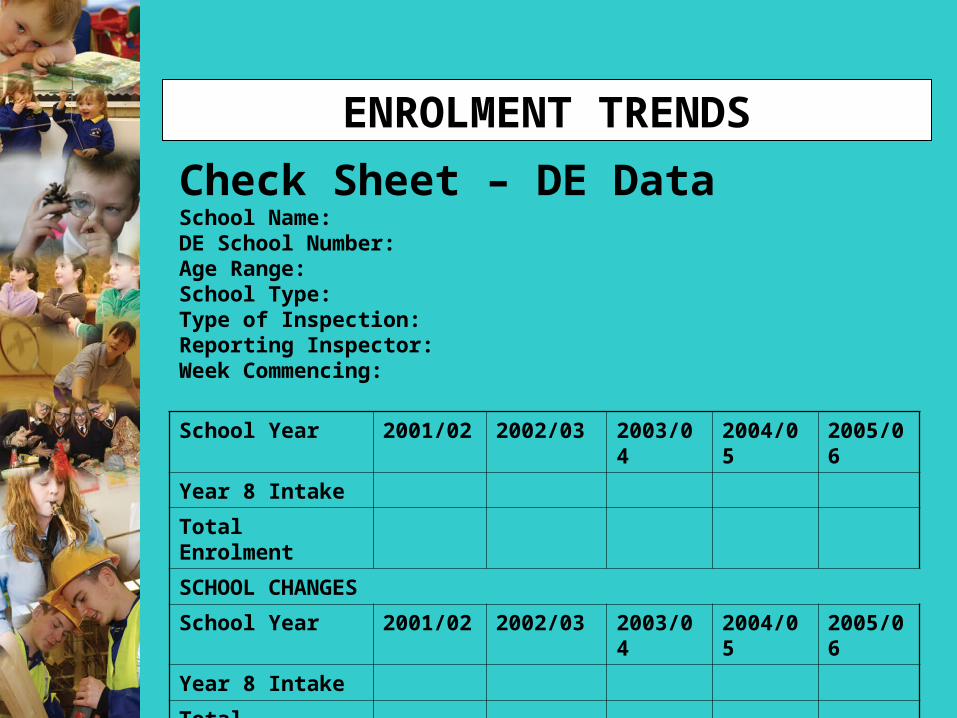
Check Sheet – DE DataSchool Name:DE School Number:Age Range:School Type:Type of Inspection:Reporting Inspector:Week Commencing:
ENROLMENT TRENDS
School Year 2001/02 2002/03 2003/04 2004/05 2005/06
Year 8 Intake
Total Enrolment
SCHOOL CHANGES
School Year 2001/02 2002/03 2003/04 2004/05 2005/06
Year 8 Intake
Total Enrolment
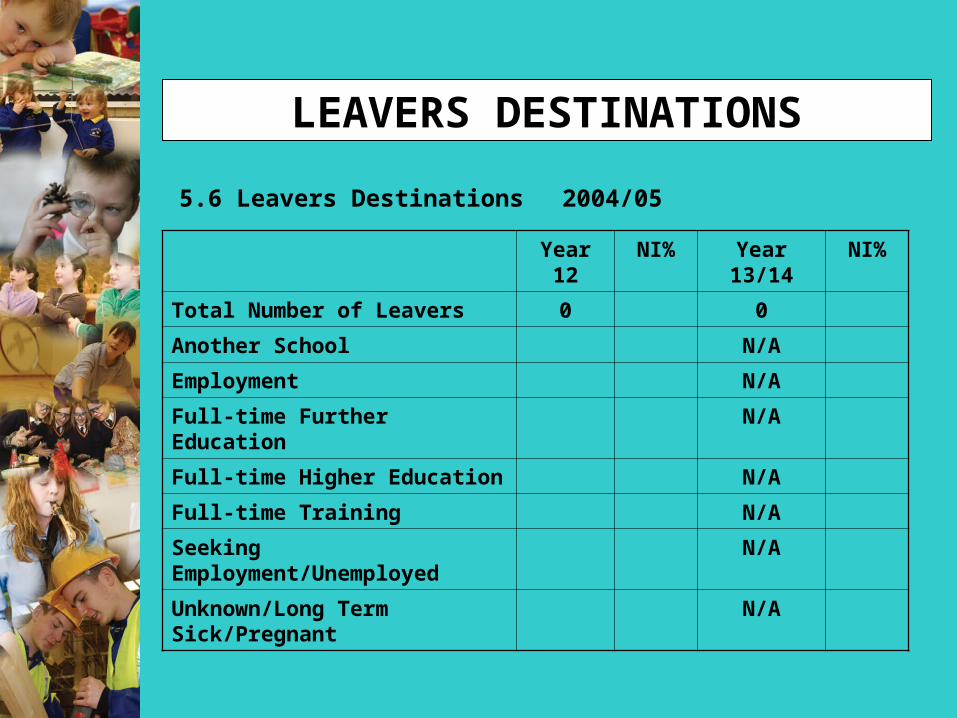
5.6 Leavers Destinations 2004/05
LEAVERS DESTINATIONS
Year 12 NI% Year 13/14 NI%
Total Number of Leavers 0 0
Another School N/A
Employment N/A
Full-time Further Education N/A
Full-time Higher Education N/A
Full-time Training N/A
Seeking Employment/Unemployed N/A
Unknown/Long Term Sick/Pregnant N/A
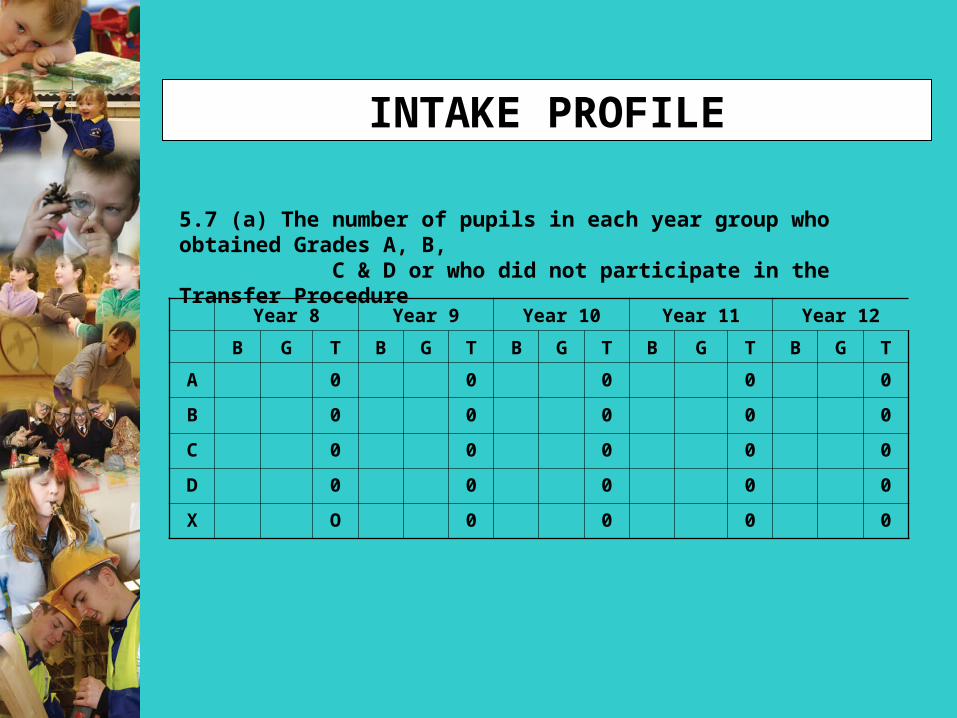
5.7 (a) The number of pupils in each year group who obtained Grades A, B, C & D or who did not participate in the Transfer Procedure
INTAKE PROFILE
Year 8 Year 9 Year 10 Year 11 Year 12
B G T B G T B G T B G T B G T
A 0 0 0 0 0
B 0 0 0 0 0
C 0 0 0 0 0
D 0 0 0 0 0
X O 0 0 0 0
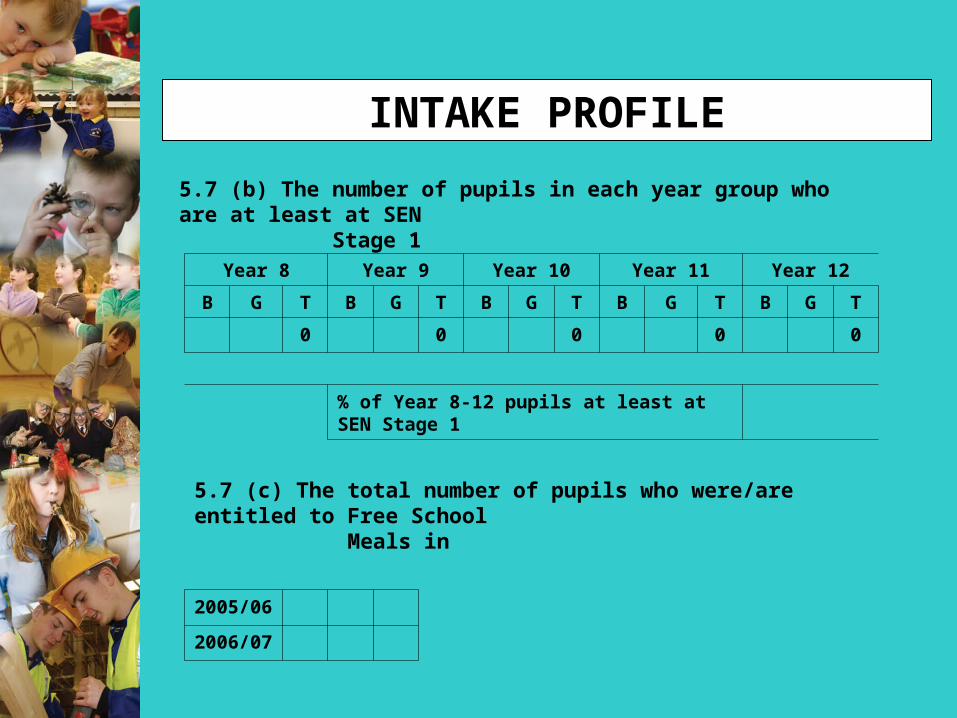
5.7 (b) The number of pupils in each year group who are at least at SEN Stage 1
INTAKE PROFILE
Year 8 Year 9 Year 10 Year 11 Year 12
B G T B G T B G T B G T B G T
0 0 0 0 0
% of Year 8-12 pupils at least at SEN Stage 1
5.7 (c) The total number of pupils who were/are entitled to Free School Meals in
2005/06
2006/07
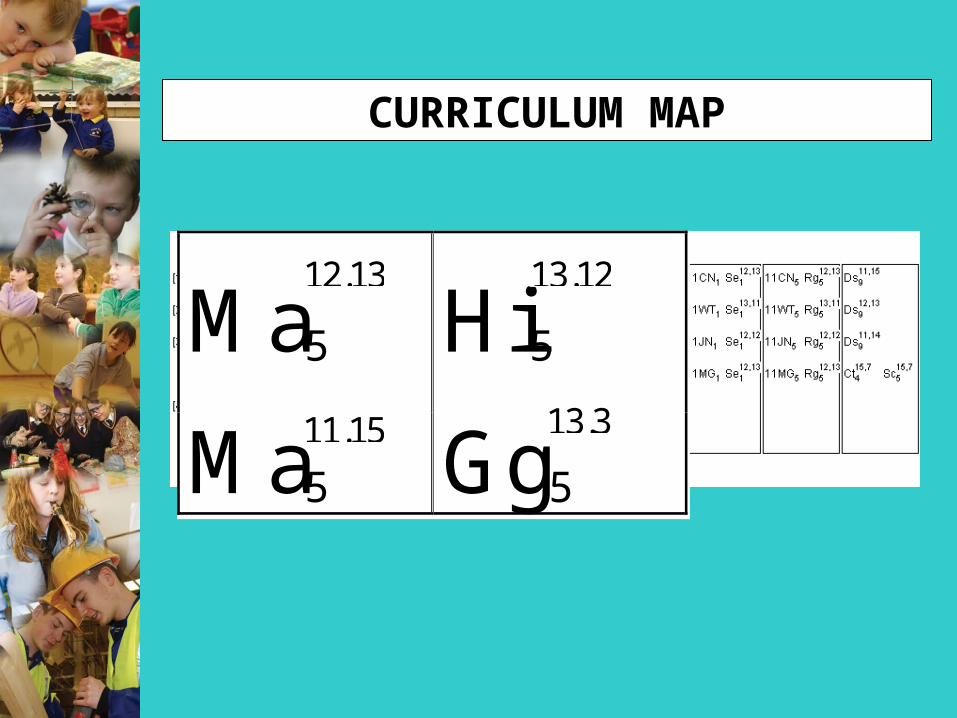
CURRICULUM MAP
Ma5
Hi5
Ma5 Gg5
11.15
12.13 13.12
13.3
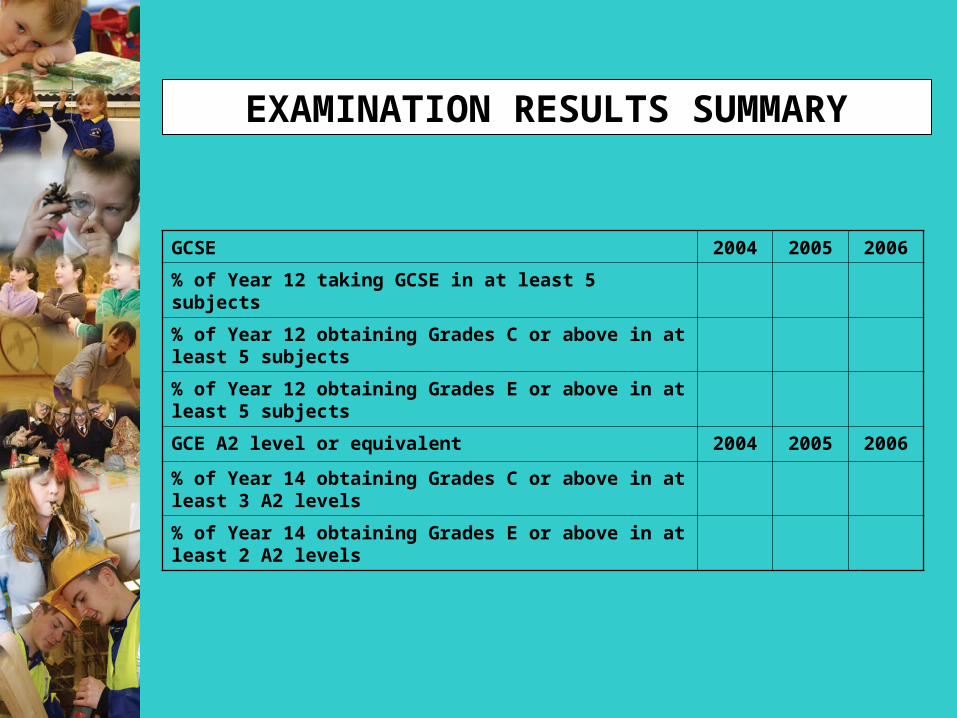
EXAMINATION RESULTS SUMMARY
GCSE 2004 2005 2006
% of Year 12 taking GCSE in at least 5 subjects
% of Year 12 obtaining Grades C or above in at least 5 subjects
% of Year 12 obtaining Grades E or above in at least 5 subjects
GCE A2 level or equivalent 2004 2005 2006
% of Year 14 obtaining Grades C or above in at least 3 A2 levels
% of Year 14 obtaining Grades E or above in at least 2 A2 levels

EXAMINATION RESULTSTable 1 showing GCSE subject results, over the three years ending in June 2006, in comparison with the respective Northern Ireland (NI) averages
More than 10 percentage points above
Between 5 and 10 percentage points above
Within 5 percentage points
Between 5 and 10 percentage points below
More than 10 percentage points below
Design and Technology: Resistance Materials
Design and Technology English Literature German Art & Design
English Language French History Home Economics Food Drama
Mathematics
Geography
Science Double Award 1st Subject
GNVQ Health and Social Science
Religious Studies Music
Statistics Science Single Award
Systems
Between 5 and 10 percentage points above
Design and Technology
French
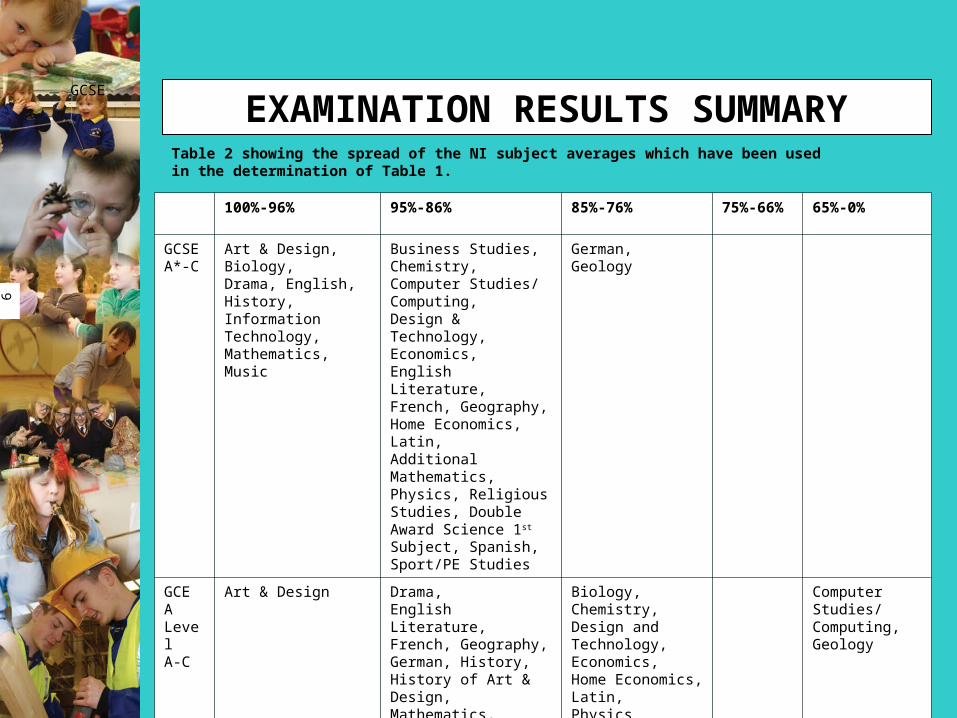
EXAMINATION RESULTS SUMMARYTable 2 showing the spread of the NI subject averages which have been used in the determination of Table 1.
GCSE
9
100%-96% 95%-86% 85%-76% 75%-66% 65%-0%
GCSEA*-C
Art & Design,Biology,Drama, English, History, Information Technology,Mathematics, Music
Business Studies,Chemistry,Computer Studies/Computing,Design & Technology, Economics, English Literature, French, Geography, Home Economics,Latin,Additional Mathematics, Physics, Religious Studies, Double Award Science 1st Subject, Spanish, Sport/PE Studies
German,Geology
GCE A LevelA-C
Art & Design Drama,English Literature, French, Geography, German, History, History of Art & Design, Mathematics, Further Mathematics, Music, Politics, Religious Studies, Spanish
Biology, Chemistry, Design and Technology,Economics, Home Economics,Latin,Physics
Computer Studies/ Computing,Geology
Subject SCAA Entry A* - C % % Entry A* - C % % Entry A* - C % % Entry A* - C A* - C Entry A* - C A* - C NICCEA
Code 2004 2005 2006 difference
Total School Niccea 3 Year School Niccea
Art & Design 351 32 18 56.3 72.9 49 22 44.9 75.7 47 20 42.6 71.9 128 46.9 73.5 x 128 46.9 73.5 -26.6Design and Technology: Resistance Materials904 14 12 85.7 0.0 0.0 64.7 14 85.7 64.7 x 14 85.7 64.7 21.0
Drama 521 29 20 69.0 69.2 40 18 45.0 70.3 23 11 47.8 77.8 92 53.3 72.5 x 92 53.3 72.5 -19.2
English Language 503 121 94 77.7 164 104 63.4 160 96 60.0 52.0 445 66.1 52.0 x 445 66.1 52.0 14.1English Literature 511 111 85 76.6 77.6 143 107 74.8 72.6 147 94 63.9 72.6 401 71.3 74.3 x 401 71.3 74.3 -2.9
French 565 66 50 75.8 45.2 117 63 53.8 48.4 116 58 50.0 48.7 299 57.2 47.4 x 299 57.2 47.4 9.8
Geography 391 57 29 50.9 45.9 67 40 59.7 47.4 66 33 50.0 48.3 190 53.7 47.2 x 190 53.7 47.2 6.5
German 567 81 57 70.4 88.0 109 82 75.2 96.0 106 84 79.2 70.4 296 75.3 84.8 x 296 75.3 84.8 -9.5
GNVQ Health and Social Science 803 0.0 0.0 27 0.0 44.0 27 0.0 44.0 x 27 0.0 44.0 -44.0
History 401 80 40 50.0 58.5 110 67 60.9 60.1 27 18 66.7 57.6 217 57.6 58.7 x 217 57.6 58.7 -1.1
Home Economics Food 335 41 23 56.1 55 23 41.8 27 18 66.7 57.4 123 52.0 57.4 x 123 52.0 57.4 -5.4
Mathematics 221 126 64 50.8 35.3 171 95 55.6 36.3 169 87 51.5 38.9 466 52.8 36.8 x 466 52.8 36.8 15.9
Music 701 16 8 50.0 79.3 24 10 41.7 85.1 23 11 47.8 84.5 63 46.0 83.0 x 63 46.0 83.0 -36.9
Religious Studies 461 0.0 45.2 0.0 42.4 20 13 65.0 50.2 20 65.0 46.0 x 20 65.0 46.0 19.0
Science Double Award 1st Subject 137 176 132 75.0 76.4 218 150 68.8 75.9 268 184 68.7 69.7 662 70.4 74.0 x 662 70.4 74.0 -3.6
Science Single Award 131 33 8 24.2 39.9 54 5 9.3 42.4 25 2 8.0 26.0 112 13.4 36.1 x 112 13.4 36.1 -22.7
Statistics 251 40 38 95.0 57 49 86.0 29 27 93.1 54.2 126 90.5 54.2 x 126 90.5 54.2 36.2
Systems 906 40 17 42.5 54 19 35.2 49 23 46.9 59.1 143 41.3 59.1 x 143 41.3 59.1 -17.9
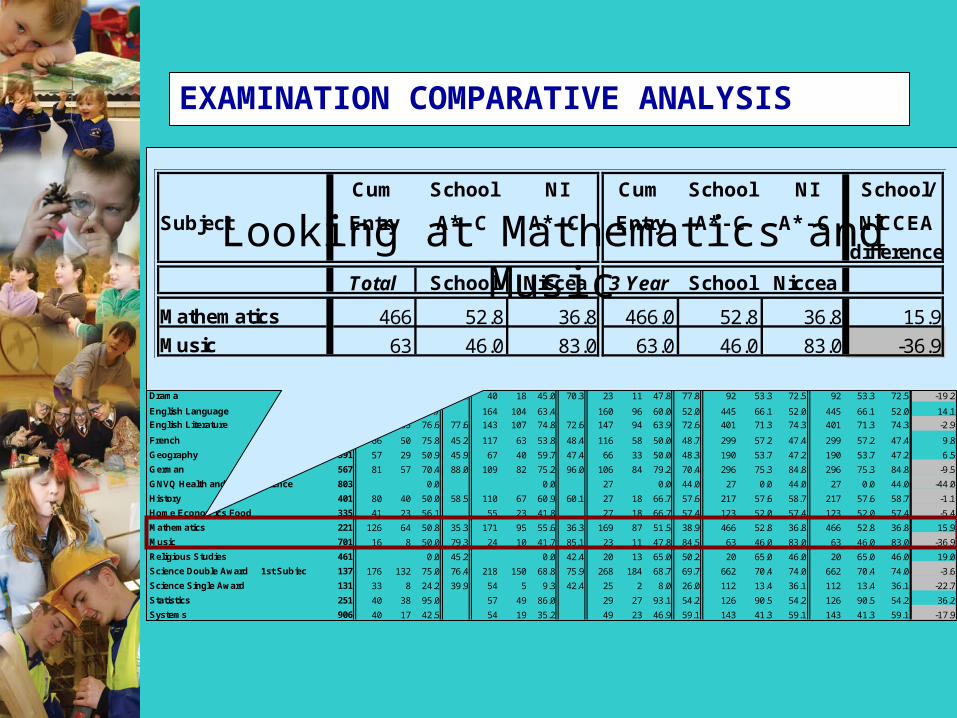
Looking at Mathematics and MusicCum School NI Cum School NI School/
Subject Entry A* - C A* - C Entry A* - C A* - C NICCEA
difference
Total School Niccea 3 Year School Niccea
Mathematics 466 52.8 36.8 466.0 52.8 36.8 15.9Music 63 46.0 83.0 63.0 46.0 83.0 -36.9
EXAMINATION COMPARATIVE ANALYSIS

• Benchmarking
• Use of Bath Data Set
• Follow-up Inspections

WHAT NEXT?
• AS levels
• Value added
• GCSE English and mathematics
• Vocational Subjects
CONCLUSION
• ETI data requirements
• Self-evaluation
• Judgements based on ‘hard’ as well as ‘soft’ evidence
• C2k co-operation