introduction - front page | u.s. department of the treasury · 4 the par yield curve one set of...
TRANSCRIPT

1
2
Introduction
● This presentation discusses three yield curves that provide
discount rates for calculating present values of future cash flows:
● The first curve is the Treasury Nominal Coupon-Issue (TNC)
Yield Curve, which pertains to Treasury nominal coupon issues.
● The second is the Treasury Real Coupon-Issue (TRC) Yield Curve
for Treasury Inflation-Protected Securities (also known as TIPS).
● And the third is the High Quality Market (HQM) Corporate Bond
Yield Curve, which pertains to U.S. high quality corporate bonds.
● The presentation summarizes information about the three yield
curves with emphasis on the Treasury curves. More information
can be found in the references in the last slide.
3
Yield Curve Definition
● A yield curve provides information about a sector of the
bond market at a point in time. The information includes
yields on different types of bonds in this sector at various
maturities.
● For the TNC and TRC curves, the sectors are Treasury
nominal coupon issues and TIPS, respectively. For the
HQM curve, the sector is U.S. high quality corporate bonds.
4
The Par Yield Curve
● One set of information provided by yield curve analysis is
the par yield curve.
● The par yield curve shows for each maturity the yield on a
security of that maturity that is selling at par (price
excluding accrued interest equals 100).
● The par yield curve provides a picture of the respective
market sector for securities with coupons and is used for
market analysis. Time series of par yields show market
movements over time.
5
The Spot Yield Curve
● However, for the purpose of discounting future cash flows,
another set of information provided by yield curve analysis
is more useful, and that is the spot yield curve.
● The spot yield curve shows for each maturity the yield on a
security without coupons that provides a single payment at
that maturity. Such a security can be called a zero coupon
bond. The yields are called spot rates.
● All the yield curves discussed here are estimated from
coupon securities; there are no actual zero coupon
securities in the estimation. Therefore, the spot rates are
calculated so that they are consistent with the yields on the
coupon securities, and they can be obtained approximately
in the market by a portfolio of coupon securities.
6
The Spot Yield Curve, continued
● The spot rates are the appropriate discount rates to be
used for discounting future cash flows.
● Each future cash flow is discounted by the spot rate whose
maturity is the same as the future point in time when the
cash flow occurs to get the present value of the cash flow.
The present values of a series of cash flows are then added
to get the total present value of the series.
● Sometimes par yields are used to discount cash flows. This
approach is flawed because par yields include the effects of
coupon payments and do not match the cash flows in time.
7 7
The HQM Yield Curve
● The HQM corporate bond yield curve is produced as mandated by
the Pension Protection Act of 2006 (PPA). This curve pertains to
high quality corporate bonds, that is, bonds in the top three
qualities AAA, AA, and A.
● The curve data are disseminated by IRS and by the Treasury
Office of Economic Policy, and include spot rates and segment
rates derived from the spot rates that are used by single-
employer pension plans to discount future liabilities.
● To meet the requirements of the PPA, it was necessary to invent
a new yield curve methodology at Treasury for the HQM curve.
The methodology is described below.
● The HQM yield curve is available back through 1984.
8 8
The TNC Yield Curve
● The HQM methodology was subsequently applied to produce the
TNC yield curve, which pertains to Treasury nominal coupon
issues, both notes and bonds.
● The TNC curve includes both on-the-run issues (securities most
recently issued of each maturity) and older off-the-run issues.
However, in this presentation the focus is on spot rates from off-
the-run issues, which can be derived for all maturities without
on-the-run distortions and are more suitable for discount rates.
● The initial application of the TNC yield curve was to discount
future liabilities of various federal agencies, such as pension and
other postemployment liabilities, for the agencies’ audited
financial statements and for the annual Financial Report of the
U.S. Government.
● The TNC curve is available back through 2003, and is being
extended back another 25 years to the mid 1970s.

9 9
The TRC Yield Curve
● The HQM and TNC methodology was subsequently used to
produce the TRC yield curve. The TRC yield curve is the real
yield curve derived from Treasury Inflation-Protected Securities
or TIPS, and includes both real notes and real bonds.
● The nominal TNC and real TRC yield curves can be combined to
derive the Treasury Breakeven Inflation (TBI) Curve, where the
breakeven inflation rate for any maturity is the inflation rate
that equates nominal and real Treasury spot rates at that
maturity in dollar terms. The TBI curve can be used to estimate
inflationary expectations.
● The TRC yield curve is available back through 2003.
10 10
Yield Curve Data
● These yield curves each provide several sets of data,
including spot rates, selected par yields, and forward rates.
The TNC curve provides off-the-run and on-the-run data.
● The curves are calculated late in the day on each business
day, and the results are disseminated each month. The
spot rate data include monthly averages of daily spot rates,
as well as end of month spot rates from the TNC and TRC
curves.
● Spot rates are available for each maturity at half-year
intervals starting at ½ year up through 100 years, for a
total of 200 maturities. Rates beyond 30 years maturity
are projected as described below.
11 11
Yield Curve Data, continued
● All spot rates are semiannually compounded, following
market convention. However, some applications for
discounting may choose to ignore the semiannual
compounding and apply the rates as if they were annual.
● Off-the-run TNC and TRC spot rates can be interpreted as
the risk-free social rates of time preference. This means
that social preference is indifferent between future cash
flows and their present values discounted by the TNC spot
rates in the case of nominal flows or TRC spot rates for
flows in real terms.
12
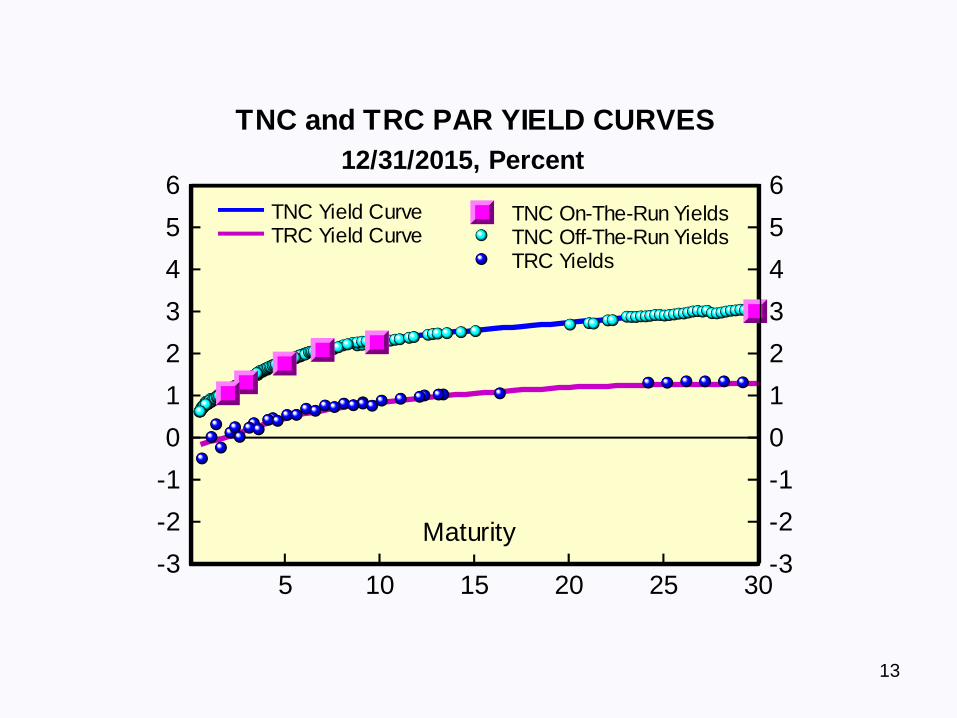
Yield Curves for December 31, 2015
● The next chart contains the par yield curve for this day.
● There are: 278 Treasury nominal coupon issues in the TNC
dataset for this day including 6 on-the-run issues; 37 TIPS in the
TRC dataset; and 1,600 AAA, AA, or A rated securities plus 9 AA
commercial paper rates in the HQM yield curve dataset.
● For this day, all yields are close to the respective curves.
● TIPS yields are negative at the earliest maturities.
13
5 10 15 20 25 30-3
-2
-1
0
1
2
3
4
5
6
-3
-2
-1
0
1
2
3
4
5
6TNC Yield CurveTRC Yield Curve
TNC and TRC PAR YIELD CURVES
12/31/2015, Percent
Maturity
TNC On-The-Run YieldsTNC Off-The-Run YieldsTRC Yields
14
Yield Curves for December 31, 2015, continued
● Slide 16 contains TNC, TRC, and HQM spot yield curves for this
day plus the TBI breakeven curve which is derived from the TNC
and TRC spot curves. All curves are projected out to 100 years
maturity.
● The HQM spot rate is 5.00 percent at 30 years maturity,
compared with 3.25 percent and 1.35 percent for the TNC and
TRC spot rates, respectively. The TBI rate is 1.89 percent at 30
years maturity.
● The HQM rate exceeds the TNC rate largely because of corporate
bond default risk, and the TNC rate exceeds the TRC rate with
positive inflation.
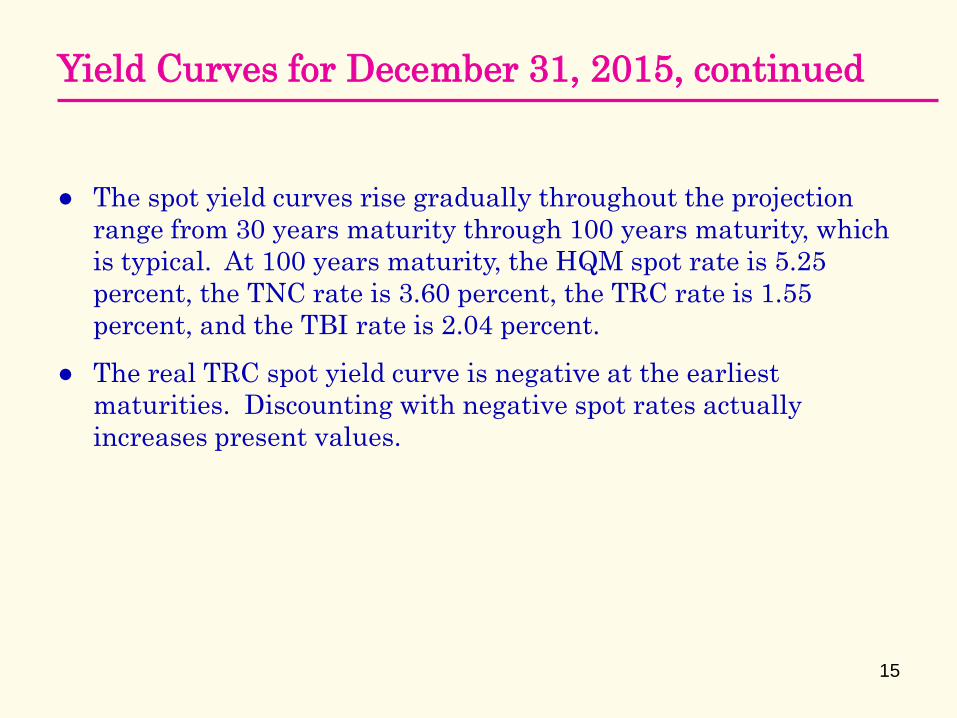
15
● The spot yield curves rise gradually throughout the projection
range from 30 years maturity through 100 years maturity, which
is typical. At 100 years maturity, the HQM spot rate is 5.25
percent, the TNC rate is 3.60 percent, the TRC rate is 1.55
percent, and the TBI rate is 2.04 percent.
● The real TRC spot yield curve is negative at the earliest
maturities. Discounting with negative spot rates actually
increases present values.
Yield Curves for December 31, 2015, continued
16
10 20 30 40 50 60 70 80 90 100-3
-2
-1
0
1
2
3
4
5
6
-3
-2
-1
0
1
2
3
4
5
6
SPOT YIELD CURVES
12/31/2015, Percent
Maturity
HQM
TNC
TRC
TBI
17
The methodology used for the yield curves contains features
and capabilities that do not appear in other yield curve
approaches:
Methodology Features
● The methodology makes use of established bond market
characteristics to generate a stable yield curve that
captures market movements.
● The methodology projects yields beyond 30 years.
● The methodology combines regression variables with the
yield curve.
The following slides discuss details of these features.
18
Methodology Features, continued
● The requirements of the PPA made necessary the invention
of this methodology, which is new and more extensive and
more powerful.
● Because different yield curve methodologies can produce
significantly different results which affect discounted cash
flows and everything else for which yield curves are used,
it was essential that Treasury develop and implement the
methodology that most accurately captures market
behavior.
19
● In particular, the mathematical form of the yield curve
must be selected in order to compute the curve.
● Other yield curve approaches typically use mathematical
forms that don’t have any foundation in bond market
characteristics. Consequently, differences among yield
curves given by other approaches with different
mathematics are arbitrary, in that there is no way to
choose among them.
● In contrast, the methodology used here is grounded in
established bond market characteristics, which generate
the mathematical form of the yield curve and ensure that
the form is not arbitrary.
Methodology Features, continued

20
The Forward Rate
● The concept of the forward rate is useful for constructing a
mathematical form for the yield curve that accords with
established market characteristics.
● The forward rate is easy to define: for each maturity, consider
entering into a contract to invest some money at the time of that
maturity for a small amount of time beyond that maturity. The
forward rate at that maturity is the future interest rate on this
investment.
● The forward rate is higher at a given maturity when investors
who are trading at that maturity are less eager to lend based on
their assessment of uncertainty and their expectations and
purposes, while borrowers are more eager to borrow based on
their perceptions. The forward rate summarizes market views
for each maturity in a single number.

21
Maturity Ranges
● Moreover, trading in securities tends to divide into maturity
ranges, such that the trading activity in each range on average
reflects similar purposes, similar views of risk, and similar
expectations about securities in that range.
● Because market views can be considered similar for securities in
the same range, the forward rates in each maturity range can be
assumed to be related to each other in a simple fashion.
● Consequently, this methodology models the forward rates in each
maturity range as a smooth (cubic) function, and joins the
functions together smoothly across ranges (as a cubic spline).
22
Maturity Ranges, continued
● This methodology at the present time uses five maturity ranges,
delineated by the maturity points 0, 1.5, 3, 7, 15, and 30 years
maturity. These points provide separate ranges for the critical
maturities of 2 years, 5 years, the benchmark 10 years, and 30
years.
● The choice of fixed maturity ranges increases significantly the
stability of the yield curve estimates over time.
● In addition, the methodology is statistically straightforward to
estimate. In contrast, certain other yield curve approaches
generate statistical models that are ill-conditioned and unstable.
23
The Long-Term Forward Rate
● The methodology must include the capability of projecting
forward rates beyond 30 years maturity so as to obtain yields out
through 100 years maturity. This is necessary because cash
flows to be discounted frequently extend beyond 30 years.
● First of all, the long-term forward rate at and beyond 30 years
maturity is set to a constant, because there are not enough data
to estimate accurately movements in the forward rate beyond 30
years maturity.
24
The Long-Term Forward Rate, continued
● Next, this methodology postulates that the long-term forward
rate is determined by the same factors that affect forward rates
in the farthest 15- to 30-year maturity range, since that range is
sufficiently distant in time to reveal underlying long-term
attitudes toward risk and return.
● Therefore, the constant long-term forward rate from 30 years
maturity up through 100 years maturity is taken to be the
average forward rate in the 15- to 30-year maturity range.
25
Methodology: Projections
● Using the long-term forward rate, spot rates can be projected
beyond 30 years maturity out to 100 years maturity. The
projected spot rates provide discount rates for long-dated cash
flows.
● Moreover, the method of construction of the long-term forward
rate ensures that yields around 30 years maturity are consistent
with yields before 30 years maturity and with long-term
investment returns available in the market.
● Other yield curve approaches generally stop at 30 years maturity
and contain no provision for projection and no mechanism to
ensure that yields around 30 years maturity are consistent with
earlier yields. Building the projection methodology into the yield
curve solves these problems.
26
Methodology: Regression Variables
● This methodology also has the special capability of combining
regression variables with the yield curve. This capability is not
available in other approaches. The regression variables adjust
for various features of the market and particular attributes of
individual securities.
● The TNC and TRC yield curves use regression to measure the
hump in yields that is sometimes seen around 20 years maturity.
● The TNC curve also uses regression to measure price effects of
on-the-run securities. As opposed to other approaches, the TNC
yield curve includes both on- and off-the-run securities in the
same yield curve and measures on-the-run effects.
27
Data
● The TNC yield curve represents all nominal coupon issues
and the TRC yield curve represents all TIPS. The dataset
for each business day is derived from securities that are
priced on that day. Bid prices are used.
● The HQM yield curve represents all high quality corporate
bonds that have similar features to Treasury coupon issues.
● The dataset for each day excludes securities with fewer
than two coupon payments remaining.

28
Estimation
● The forward rates in the maturity ranges are chosen to be
those rates that give the best statistical fit (by least
squares) to all the prices in the dataset for that day. The
par and spot yields are derived from the estimated forward
rates.
● Regression terms are simultaneously estimated with the
forward rates.
● Before estimation, the data are weighted by the (square
root of the) inverse of duration.
29
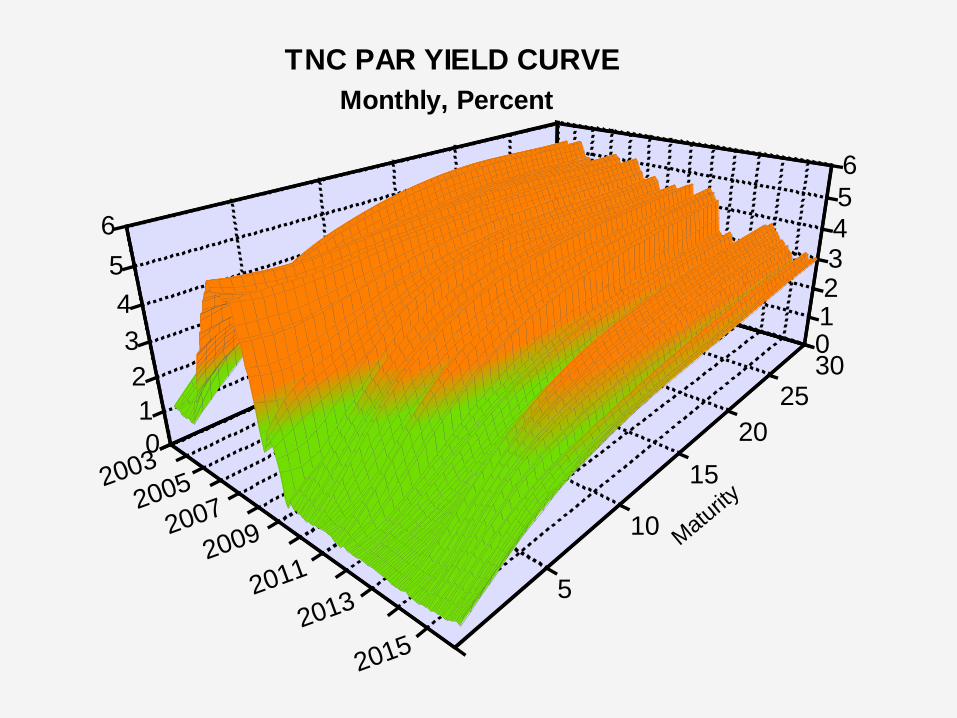
Results for the TNC Yield Curve
● The following charts show results for the TNC yield curve
over the period January 2003 through December 2015, for
a total of 3,247 business days and 156 months.
● The first chart in slide 30 shows the monthly average par
yield curve over the entire period.
● The chart shows that the par yield curve flattened out
before the 2007-2009 recession, and that yield spreads
were large in the financial crisis of 2009 forward. After
that, spreads decreased a bit.
30
5
10
15
20
253001234
5
6
0
1
2
3
4
5
6
Matu
rity
TNC PAR YIELD CURVE
Monthly, Percent
2003
2005
2007
2009
2011
20152013
31
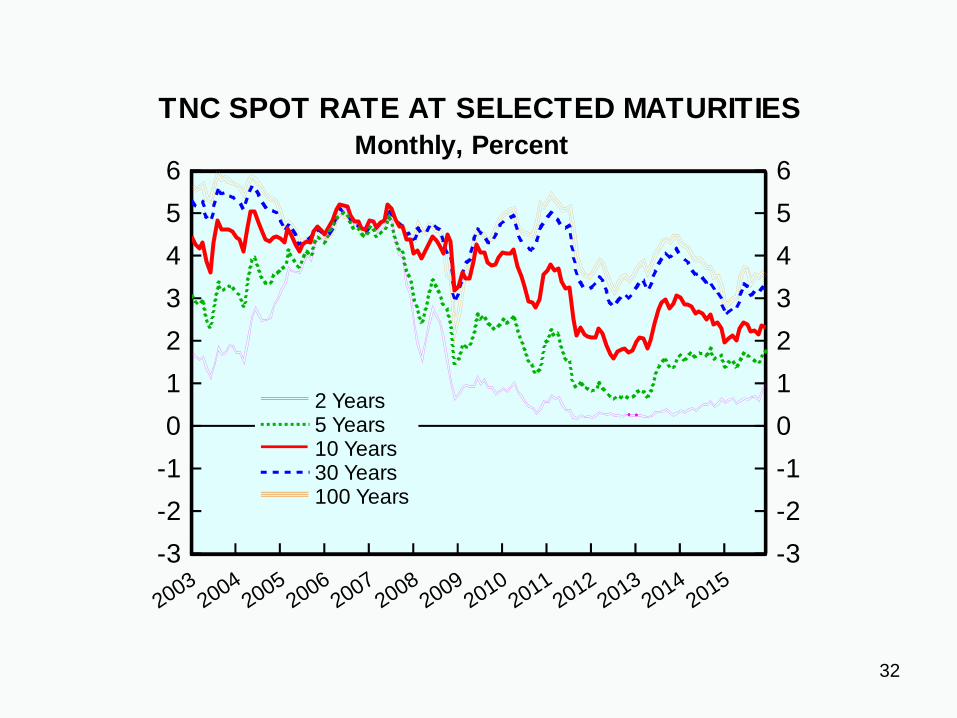
Results for the TNC Yield Curve, continued
● The second chart in slide 32 shows monthly average spot
rates over the period at maturities of 2 years, 5 years, 10
years, 30 years, and 100 years.
● Again there is a significant bunching of the spot rates
before the 2007-2009 recession.
32
20032004
20052006
20072008
20092010
20112012
20132014
2015
-3
-2
-1
0
1
2
3
4
5
6
-3
-2
-1
0
1
2
3
4
5
6
2 Years5 Years10 Years30 Years100 Years
TNC SPOT RATE AT SELECTED MATURITIES
Monthly, Percent
33
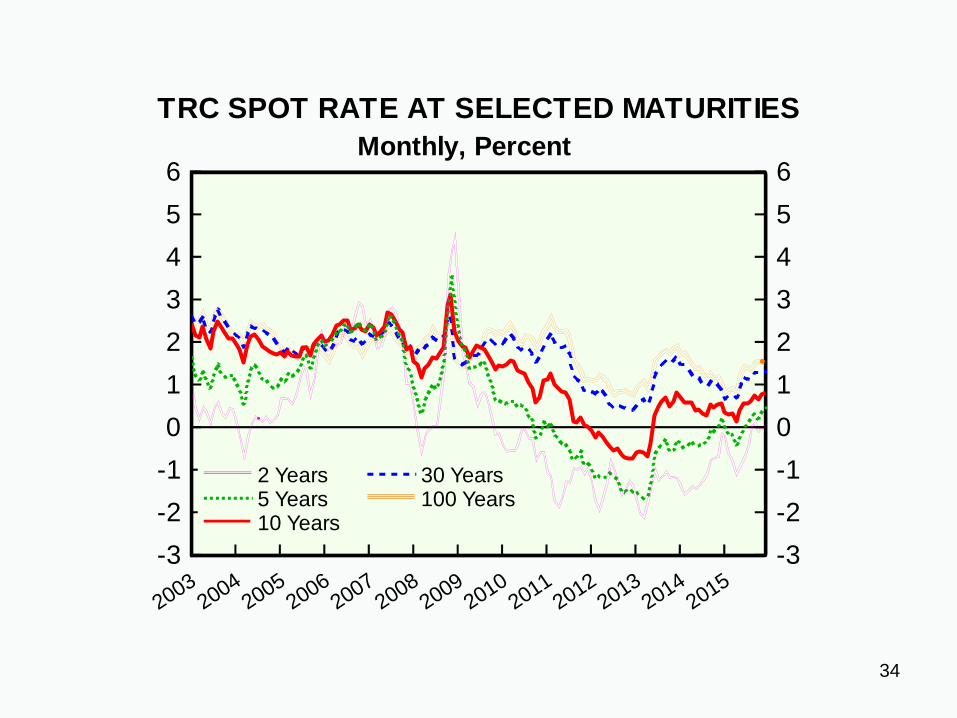
Results for the TRC Yield Curve
● The following chart in slide 34 shows the analogous spot
rates for the TRC yield curve over the same period January
2003 through December 2015.
● Real TRC spot rates spiked at the end of 2008, due in part
to reduced liquidity in the financial crisis.
● Similar to the nominal spot rates, the chart shows that the
real rates bunched together before the 2007-2009 recession.
● Over the last few years, there have been episodes of
negative spot rates at lower maturities.
34
20032004
20052006
20072008
20092010
20112012
20132014
2015
-3
-2
-1
0
1
2
3
4
5
6
-3
-2
-1
0
1
2
3
4
5
6
2 Years5 Years10 Years
30 Years100 Years
TRC SPOT RATE AT SELECTED MATURITIES
Monthly, Percent
35
For More Information
● Data and documentation for the TNC and TRC yield curves are
available on the Treasury Economic Policy website at:
https://www.treasury.gov/resource-center/economic-policy/corp-bond-
yield/Pages/TNC-YC.aspx
● The HQM corporate bond yield curve for the PPA is published by
the IRS each month. Data and documentation are also available
on the Treasury Office of Economic Policy website at:
https://www.treasury.gov/resource-center/economic-policy/corp-bond-
yield/Pages/Corp-Yield-Bond-Curve-Papers.aspx
● Previous applications of the methodology presented here to TIPS
yield curves can be found in papers 0601 and 0501 in the
Economic Policy Research Paper Series on the Office of Economic
Policy website.