introduction - emerging energy solutions - using … .....4 description of building and equipment...
TRANSCRIPT

Fred Meyer #135
Hawthorne
July 2012 Tests and report done by:
Joel Klobas
Emerging Energy Solutions
Technical Director
2 | P a g e
Fred Meyer #135 AC 1 & 2 July 2012
Contents Introduction .................................................................................................................................................................. 4
Testing ....................................................................................................................................................................... 4
Description of Building and Equipment ........................................................................................................................ 5
Flow Chart of the System and Readings ....................................................................................................................... 6
Dual Compressor Flow Chart ................................................................................................................................ 6
4 Circuit System with Hot Gas Bypass................................................................................................................... 6
Report Definitions ......................................................................................................................................................... 7
Report Definitions ......................................................................................................................................................... 8
AC 1 ............................................................................................................................................................................... 9
Refrigeration Process ................................................................................................................................................ 9
Circuits 1 and 3 ..................................................................................................................................................... 9
Circuits 2 and 4 ................................................................................................................................................... 10
Super Heat .............................................................................................................................................................. 11
Circuits 1 and 3 ................................................................................................................................................... 11
Circuits 2 and 4 ................................................................................................................................................... 12
Evaporator .............................................................................................................................................................. 13
Circuits 1 and 3 ................................................................................................................................................... 13
Circuits 2 and 4 ................................................................................................................................................... 14
Condenser ............................................................................................................................................................... 15
Circuits 1 and 3 ................................................................................................................................................... 15
Circuits 2 and 4 ................................................................................................................................................... 16
Conclusion ............................................................................................................................................................... 17
Hot Gas Bypass.................................................................................................................................................... 17
Super Heat .......................................................................................................................................................... 17
Evaporator .......................................................................................................................................................... 17
Condenser ........................................................................................................................................................... 17
Power Return Air ................................................................................................................................................ 17
AC 2 ............................................................................................................................................................................. 18
Refrigeration Process .............................................................................................................................................. 18
Super Heat .............................................................................................................................................................. 19

3 | P a g e
Fred Meyer #135 AC 1 & 2 July 2012
Sub Cool .................................................................................................................................................................. 20
Condenser ............................................................................................................................................................... 21
Evaporator .............................................................................................................................................................. 22
Carrier Charging Chart ............................................................................................................................................ 23
Conclusion AC 2 ...................................................................................................................................................... 24
Super Heat .......................................................................................................................................................... 24
Sub Cool .............................................................................................................................................................. 24
Condenser ........................................................................................................................................................... 24
Evaporator .......................................................................................................................................................... 24
Carrier Charging Chart ........................................................................................................................................ 24
Economizer ......................................................................................................................................................... 24
4 | P a g e
Fred Meyer #135 AC 1 & 2 July 2012
Introduction The purpose of the analysis of the unit was to check operation,
efficiency, and make recommendations on maintenance, service,
and optimization. These tests were done using the ClimaCheck PA
Pro.
The ClimaCheck PA Pro performance analyzer is a data logger that
uses a multitude of temperature sensors, pressure transducers, and electrical analyzing equipment which all take
simultaneous measurements that are then converted to data. This data is then collected and imported into a
software program. The software then uses thermodynamic equations to make calculations similar to the types of
calculations used in a research and development labs. All readings in this report
were taken with the ClimaCheck Pa Pro. All conclusions were made by
inspection and research of this data using some nominal data supplied by the
manufacturer.
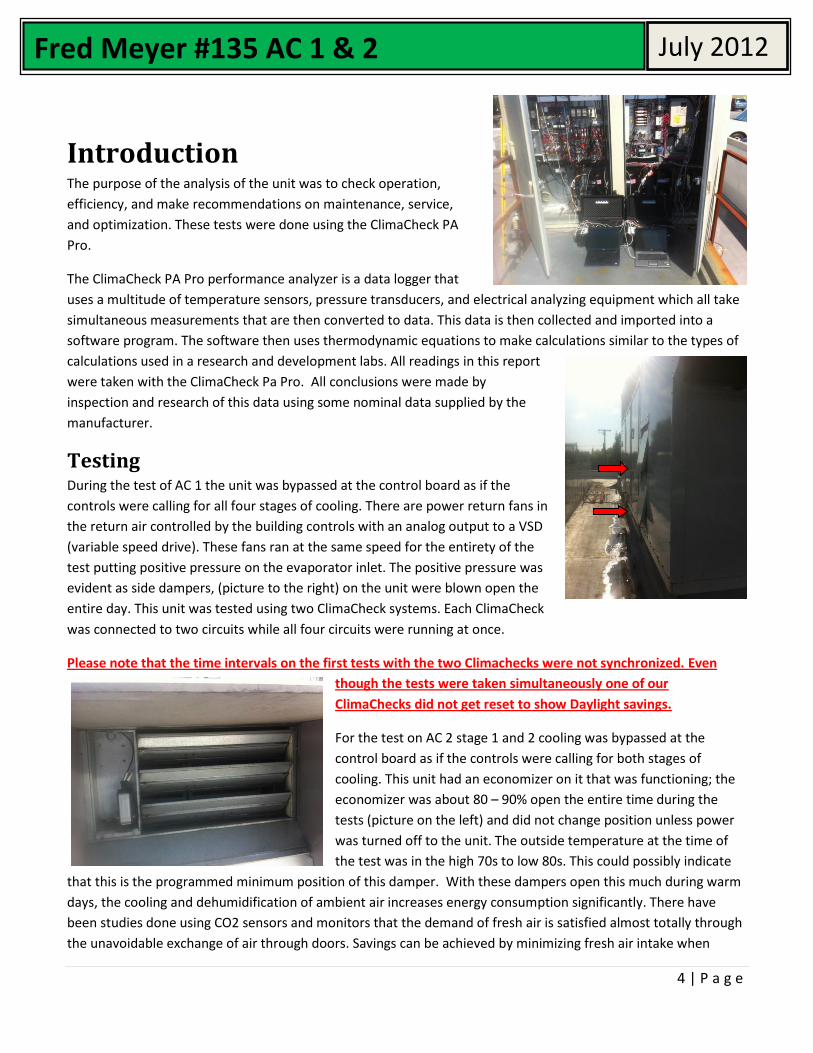
Testing During the test of AC 1 the unit was bypassed at the control board as if the
controls were calling for all four stages of cooling. There are power return fans in
the return air controlled by the building controls with an analog output to a VSD
(variable speed drive). These fans ran at the same speed for the entirety of the
test putting positive pressure on the evaporator inlet. The positive pressure was
evident as side dampers, (picture to the right) on the unit were blown open the
entire day. This unit was tested using two ClimaCheck systems. Each ClimaCheck
was connected to two circuits while all four circuits were running at once.
Please note that the time intervals on the first tests with the two Climachecks were not synchronized. Even
though the tests were taken simultaneously one of our
ClimaChecks did not get reset to show Daylight savings.
For the test on AC 2 stage 1 and 2 cooling was bypassed at the
control board as if the controls were calling for both stages of
cooling. This unit had an economizer on it that was functioning; the
economizer was about 80 – 90% open the entire time during the
tests (picture on the left) and did not change position unless power
was turned off to the unit. The outside temperature at the time of
the test was in the high 70s to low 80s. This could possibly indicate
that this is the programmed minimum position of this damper. With these dampers open this much during warm
days, the cooling and dehumidification of ambient air increases energy consumption significantly. There have
been studies done using CO2 sensors and monitors that the demand of fresh air is satisfied almost totally through
the unavoidable exchange of air through doors. Savings can be achieved by minimizing fresh air intake when
5 | P a g e
Fred Meyer #135 AC 1 & 2 July 2012
ambient conditions result in additional cooling and dehumidification. Installing CO2 sensors which open the
economizer is recommended.
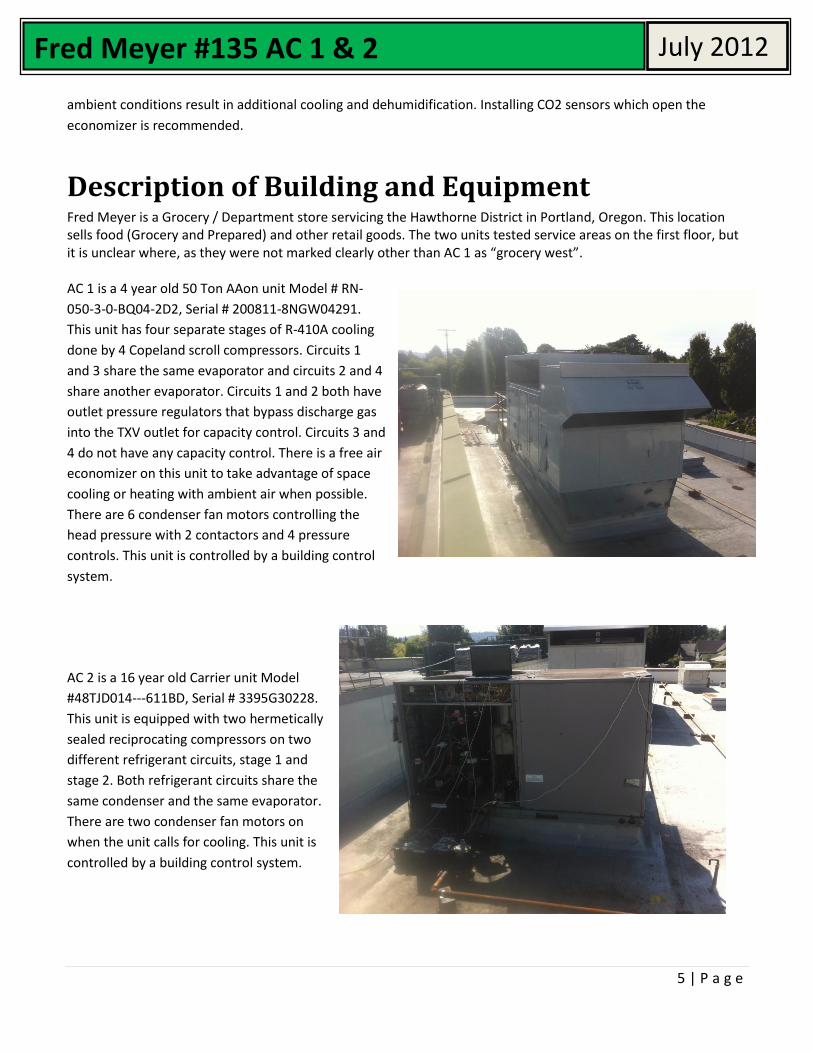
Description of Building and Equipment Fred Meyer is a Grocery / Department store servicing the Hawthorne District in Portland, Oregon. This location sells food (Grocery and Prepared) and other retail goods. The two units tested service areas on the first floor, but it is unclear where, as they were not marked clearly other than AC 1 as “grocery west”. AC 1 is a 4 year old 50 Ton AAon unit Model # RN-
050-3-0-BQ04-2D2, Serial # 200811-8NGW04291.
This unit has four separate stages of R-410A cooling
done by 4 Copeland scroll compressors. Circuits 1
and 3 share the same evaporator and circuits 2 and 4
share another evaporator. Circuits 1 and 2 both have
outlet pressure regulators that bypass discharge gas
into the TXV outlet for capacity control. Circuits 3 and
4 do not have any capacity control. There is a free air
economizer on this unit to take advantage of space
cooling or heating with ambient air when possible.
There are 6 condenser fan motors controlling the
head pressure with 2 contactors and 4 pressure
controls. This unit is controlled by a building control
system.
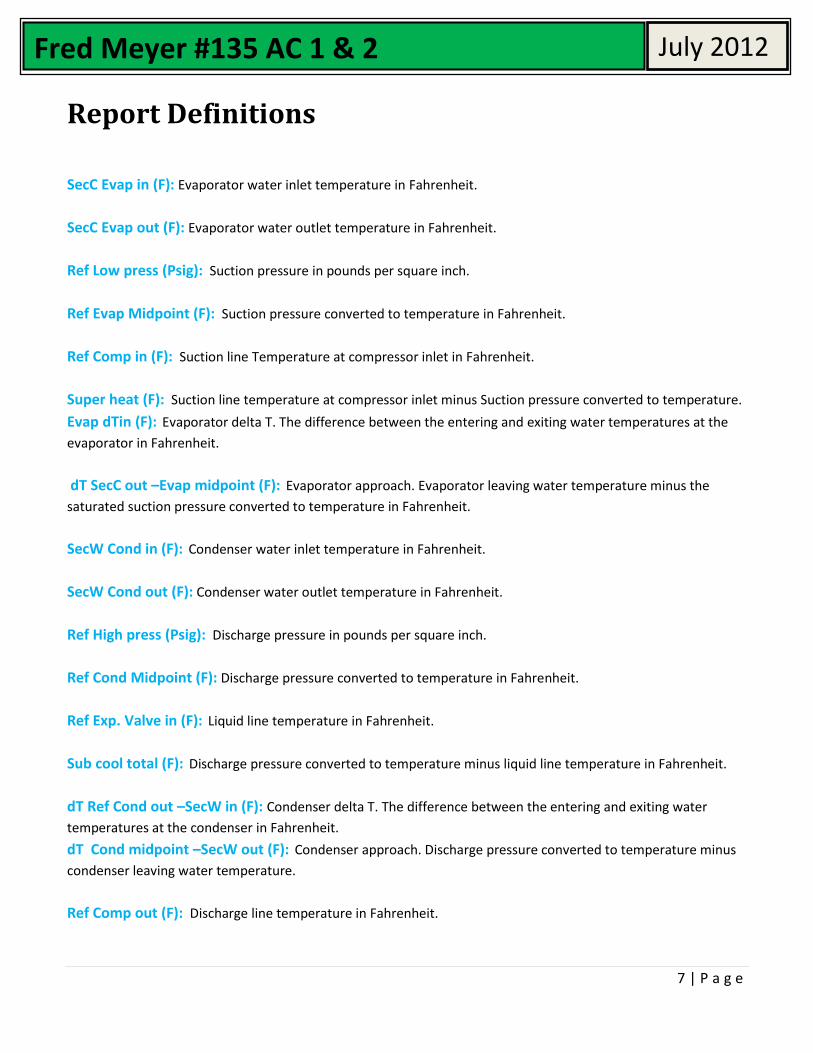
AC 2 is a 16 year old Carrier unit Model
#48TJD014---611BD, Serial # 3395G30228.
This unit is equipped with two hermetically
sealed reciprocating compressors on two
different refrigerant circuits, stage 1 and
stage 2. Both refrigerant circuits share the
same condenser and the same evaporator.
There are two condenser fan motors on
when the unit calls for cooling. This unit is
controlled by a building control system.

6 | P a g e
Fred Meyer #135 AC 1 & 2 July 2012
Flow Chart of the System and Readings
Dual Compressor Flow Chart
4 Circuit System with Hot Gas Bypass
7 | P a g e
Fred Meyer #135 AC 1 & 2 July 2012
Report Definitions
SecC Evap in (F): Evaporator water inlet temperature in Fahrenheit.
SecC Evap out (F): Evaporator water outlet temperature in Fahrenheit.
Ref Low press (Psig): Suction pressure in pounds per square inch.
Ref Evap Midpoint (F): Suction pressure converted to temperature in Fahrenheit.
Ref Comp in (F): Suction line Temperature at compressor inlet in Fahrenheit.
Super heat (F): Suction line temperature at compressor inlet minus Suction pressure converted to temperature.
Evap dTin (F): Evaporator delta T. The difference between the entering and exiting water temperatures at the
evaporator in Fahrenheit.
dT SecC out –Evap midpoint (F): Evaporator approach. Evaporator leaving water temperature minus the
saturated suction pressure converted to temperature in Fahrenheit.
SecW Cond in (F): Condenser water inlet temperature in Fahrenheit.
SecW Cond out (F): Condenser water outlet temperature in Fahrenheit.
Ref High press (Psig): Discharge pressure in pounds per square inch.
Ref Cond Midpoint (F): Discharge pressure converted to temperature in Fahrenheit.
Ref Exp. Valve in (F): Liquid line temperature in Fahrenheit.
Sub cool total (F): Discharge pressure converted to temperature minus liquid line temperature in Fahrenheit.
dT Ref Cond out –SecW in (F): Condenser delta T. The difference between the entering and exiting water
temperatures at the condenser in Fahrenheit.
dT Cond midpoint –SecW out (F): Condenser approach. Discharge pressure converted to temperature minus
condenser leaving water temperature.
Ref Comp out (F): Discharge line temperature in Fahrenheit.

8 | P a g e
Fred Meyer #135 AC 1 & 2 July 2012
Report Definitions
Power input Comp. (kw): Compressor power input in kilowatts.
Comp. Isen. Eff. Oilcool (%): The isentropic efficiency of the compressor after the losses of the mechanical oil
cooling. This is a comparison of the actual compression process efficiency vs the theoretical efficiency of a perfect
compression process.
EER Cool (BTU/WH): Energy Efficiency Ratio. The amount BTU’s used per hour for each watt of power drawn.
Cooling Load (kw/ton): The ratio of the rate of energy consumption in Kilowatts to the rate of heat removal in
tons.
Cap. Cool (tons): The capacity of heat removal of the refrigeration process in refrigerated tons. 1 ton is equal to
12,000 BTU’s or the amount of cooling that would be provided by melting 1 ton of ice.
Amps L1,L2,L3 (A): A measure of electrical current on each wire of the three phase power to the compressor,
Evap: Evaporator
Comp: Compressor
TXV: Thermostatic Expansion Valve
RTU: Roof Top Unit
Flooding: A term generally used to describe an evaporator that has too much liquid refrigerant in it.
Specs: Specifications
OEM: Original Equipment Manufacturer. OR Original Equipment from Manufacturer.

9 | P a g e
Fred Meyer #135 AC 1 & 2 July 2012
AC 1 4 year old 50 Ton AAon unit
Model # RN-050-3-0-BQ04-2D2,
Serial # 200811-8NGW04291
Refrigeration Process
Circuits 1 and 3
The graph shows Circuits 1 and 3 at work with both compressors running. The system is running very unstable.
The more stable a refrigeration process is the more efficient it can be. The more time a system spends adjusting
the less time it is in an optimum operating range. After 14:40 to the right of the graph, the compressor of circuit 3
was shut off. The data after this time becomes irrelevant. Both of these circuits share the same evaporator but
circuit 1 has hot gas bypass in operation keeping the evaporator temperature just below 40°F. Even though these
two circuits use the same evaporator, they are running quite differently due to the hot gas bypass on one of the
circuits.
Evap Temp Circuit 1
Evap Temp Circuit 2
10 | P a g e
Fred Meyer #135 AC 1 & 2 July 2012
Circuits 2 and 4
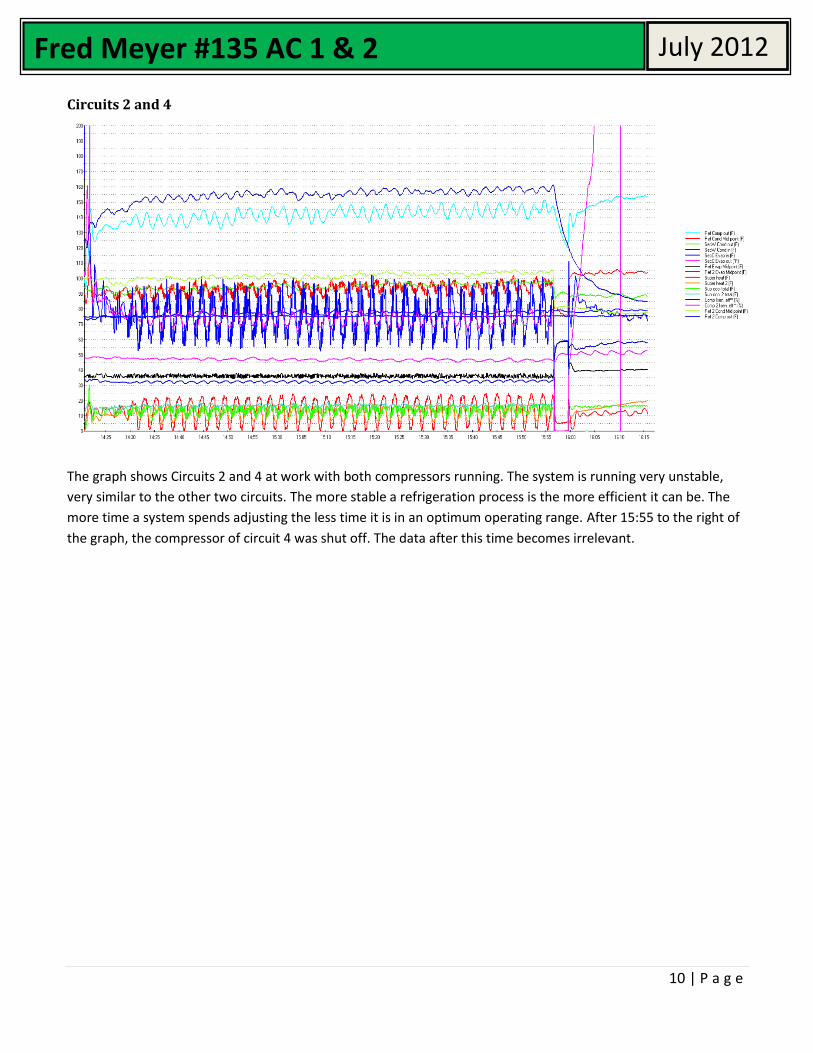
The graph shows Circuits 2 and 4 at work with both compressors running. The system is running very unstable,
very similar to the other two circuits. The more stable a refrigeration process is the more efficient it can be. The
more time a system spends adjusting the less time it is in an optimum operating range. After 15:55 to the right of
the graph, the compressor of circuit 4 was shut off. The data after this time becomes irrelevant.

11 | P a g e
Fred Meyer #135 AC 1 & 2 July 2012
Super Heat
Circuits 1 and 3
Both circuits have very unstable superheat. With circuit 1, (in blue) this can be explained by the hot discharge gas
being introduced into the TXV outlet. The superheat will be affected both by the change of pressure caused by the
injection of the high pressured gas and the time needed for the expansion valve to adapt to the new conditions.
The hot gas throttles down as it has reached its pressure setting. The TXV is now open too far and drops the super
heat too low by flooding the coil with refrigerant. When the non-superheated gas exits the coil it cools the TXV
element causing the TXV to close. When the TXV closes the suction pressure then drops; the drop in suction
pressure causes the hot gas valve to open and the process starts all over again. Constant operation in such a
manner is inefficient and causes more ware on equipment.
12 | P a g e
Fred Meyer #135 AC 1 & 2 July 2012
Circuits 2 and 4
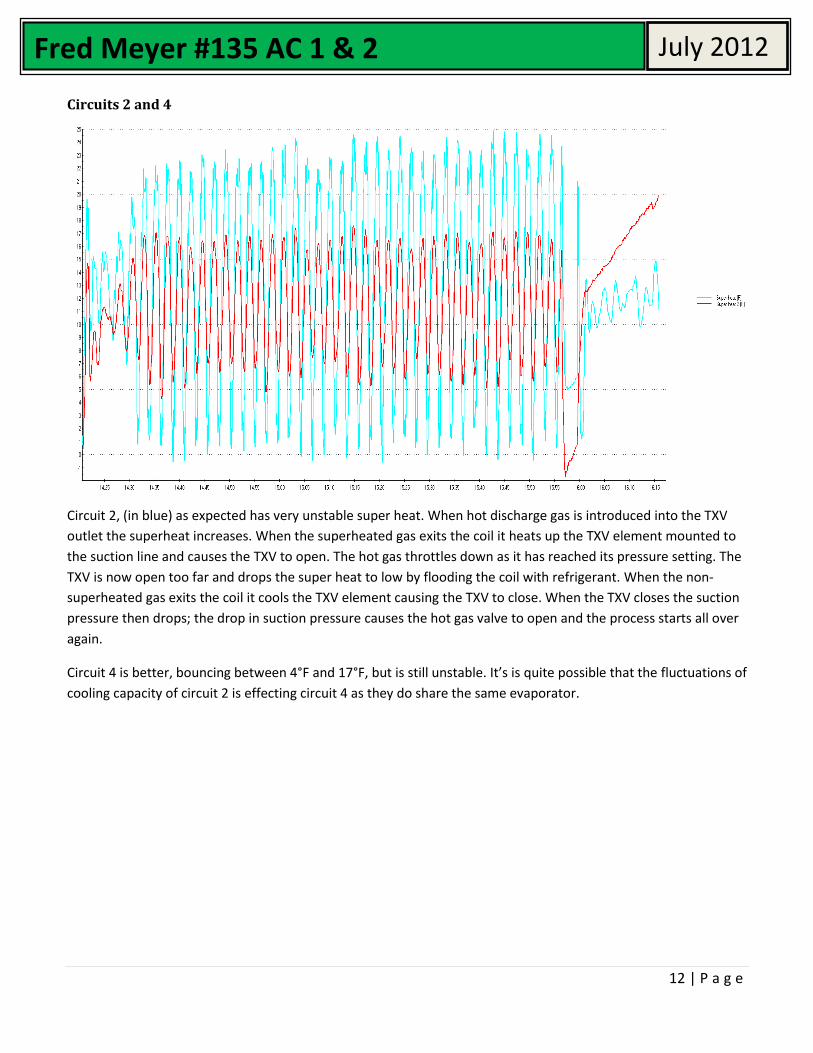
Circuit 2, (in blue) as expected has very unstable super heat. When hot discharge gas is introduced into the TXV
outlet the superheat increases. When the superheated gas exits the coil it heats up the TXV element mounted to
the suction line and causes the TXV to open. The hot gas throttles down as it has reached its pressure setting. The
TXV is now open too far and drops the super heat to low by flooding the coil with refrigerant. When the non-
superheated gas exits the coil it cools the TXV element causing the TXV to close. When the TXV closes the suction
pressure then drops; the drop in suction pressure causes the hot gas valve to open and the process starts all over
again.
Circuit 4 is better, bouncing between 4°F and 17°F, but is still unstable. It’s is quite possible that the fluctuations of
cooling capacity of circuit 2 is effecting circuit 4 as they do share the same evaporator.
13 | P a g e
Fred Meyer #135 AC 1 & 2 July 2012
Evaporator
Circuits 1 and 3
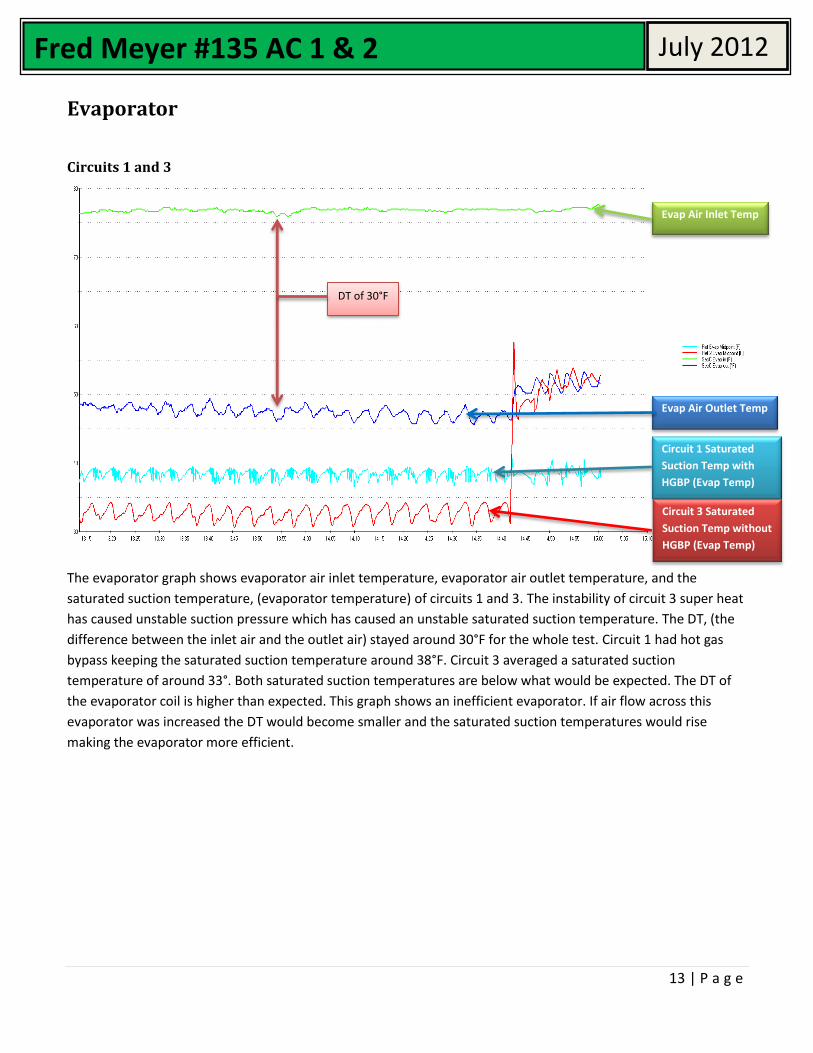
The evaporator graph shows evaporator air inlet temperature, evaporator air outlet temperature, and the
saturated suction temperature, (evaporator temperature) of circuits 1 and 3. The instability of circuit 3 super heat
has caused unstable suction pressure which has caused an unstable saturated suction temperature. The DT, (the
difference between the inlet air and the outlet air) stayed around 30°F for the whole test. Circuit 1 had hot gas
bypass keeping the saturated suction temperature around 38°F. Circuit 3 averaged a saturated suction
temperature of around 33°. Both saturated suction temperatures are below what would be expected. The DT of
the evaporator coil is higher than expected. This graph shows an inefficient evaporator. If air flow across this
evaporator was increased the DT would become smaller and the saturated suction temperatures would rise
making the evaporator more efficient.
Evap Air Inlet Temp
Evap Air Outlet Temp
Circuit 1 Saturated
Suction Temp with
HGBP (Evap Temp)
Circuit 3 Saturated
Suction Temp without
HGBP (Evap Temp)
DT of 30°F
14 | P a g e
Fred Meyer #135 AC 1 & 2 July 2012
Circuits 2 and 4
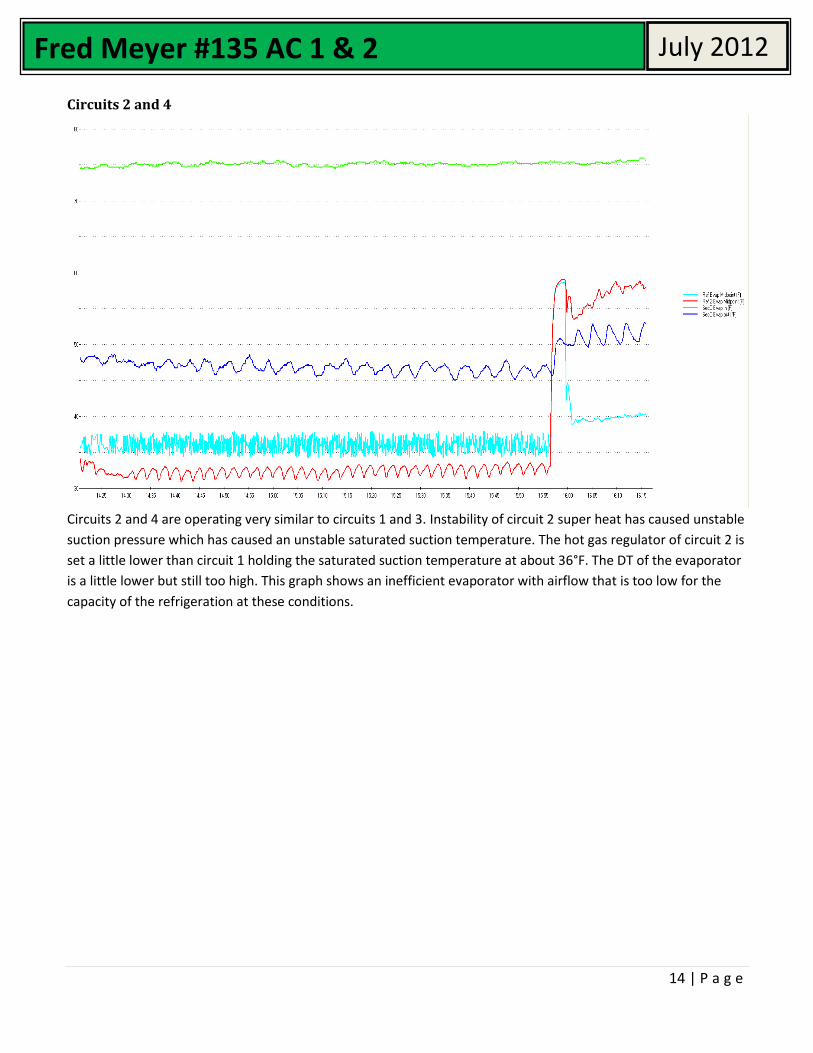
Circuits 2 and 4 are operating very similar to circuits 1 and 3. Instability of circuit 2 super heat has caused unstable
suction pressure which has caused an unstable saturated suction temperature. The hot gas regulator of circuit 2 is
set a little lower than circuit 1 holding the saturated suction temperature at about 36°F. The DT of the evaporator
is a little lower but still too high. This graph shows an inefficient evaporator with airflow that is too low for the
capacity of the refrigeration at these conditions.
15 | P a g e
Fred Meyer #135 AC 1 & 2 July 2012
Condenser
Circuits 1 and 3
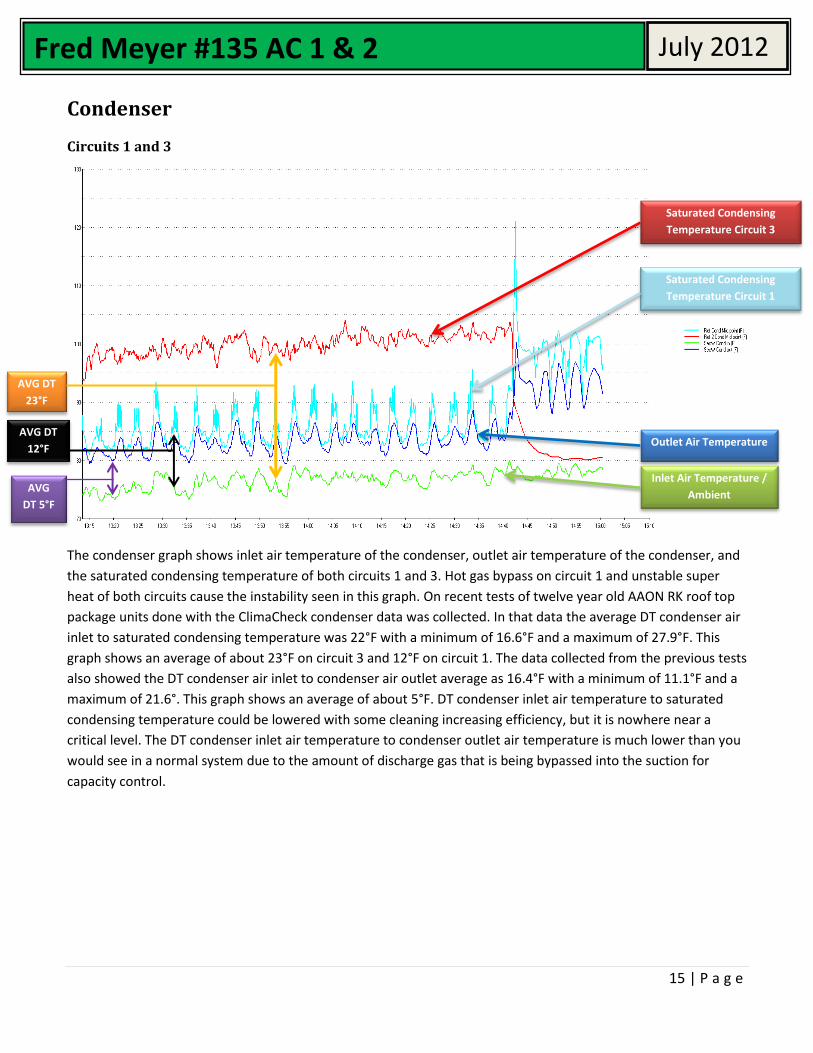
The condenser graph shows inlet air temperature of the condenser, outlet air temperature of the condenser, and
the saturated condensing temperature of both circuits 1 and 3. Hot gas bypass on circuit 1 and unstable super
heat of both circuits cause the instability seen in this graph. On recent tests of twelve year old AAON RK roof top
package units done with the ClimaCheck condenser data was collected. In that data the average DT condenser air
inlet to saturated condensing temperature was 22°F with a minimum of 16.6°F and a maximum of 27.9°F. This
graph shows an average of about 23°F on circuit 3 and 12°F on circuit 1. The data collected from the previous tests
also showed the DT condenser air inlet to condenser air outlet average as 16.4°F with a minimum of 11.1°F and a
maximum of 21.6°. This graph shows an average of about 5°F. DT condenser inlet air temperature to saturated
condensing temperature could be lowered with some cleaning increasing efficiency, but it is nowhere near a
critical level. The DT condenser inlet air temperature to condenser outlet air temperature is much lower than you
would see in a normal system due to the amount of discharge gas that is being bypassed into the suction for
capacity control.
Inlet Air Temperature /
Ambient
Outlet Air Temperature
Saturated Condensing
Temperature Circuit 3
Saturated Condensing
Temperature Circuit 1
AVG
DT 5°F
AVG DT
23°F
AVG DT
12°F

16 | P a g e
Fred Meyer #135 AC 1 & 2 July 2012
Circuits 2 and 4
The DT condenser inlet air to circuit 4 saturated condensing temperature is averaging about 24°F. This could be
lowered with some cleaning increasing efficiency, but is nowhere near a critical level. The DT condenser air inlet
temperature to condenser air outlet temperature is averaging about 16°F, which is normal for most package air
conditioners. This DT is far higher than the one shown on circuit 1 above, indicating less discharge hot gas is being
bypassed. More proof of this could be seen in the differences of circuit 1 and 2 at discharge temperature and
saturated suction temperatures, shown in graphs on pages 8, 9, 12, and 13.
Saturated Condensing
Temperature Circuit 4
Inlet Air Temperature /
Ambient
DT Average 24°F DT 16°F
17 | P a g e
Fred Meyer #135 AC 1 & 2 July 2012
Conclusion
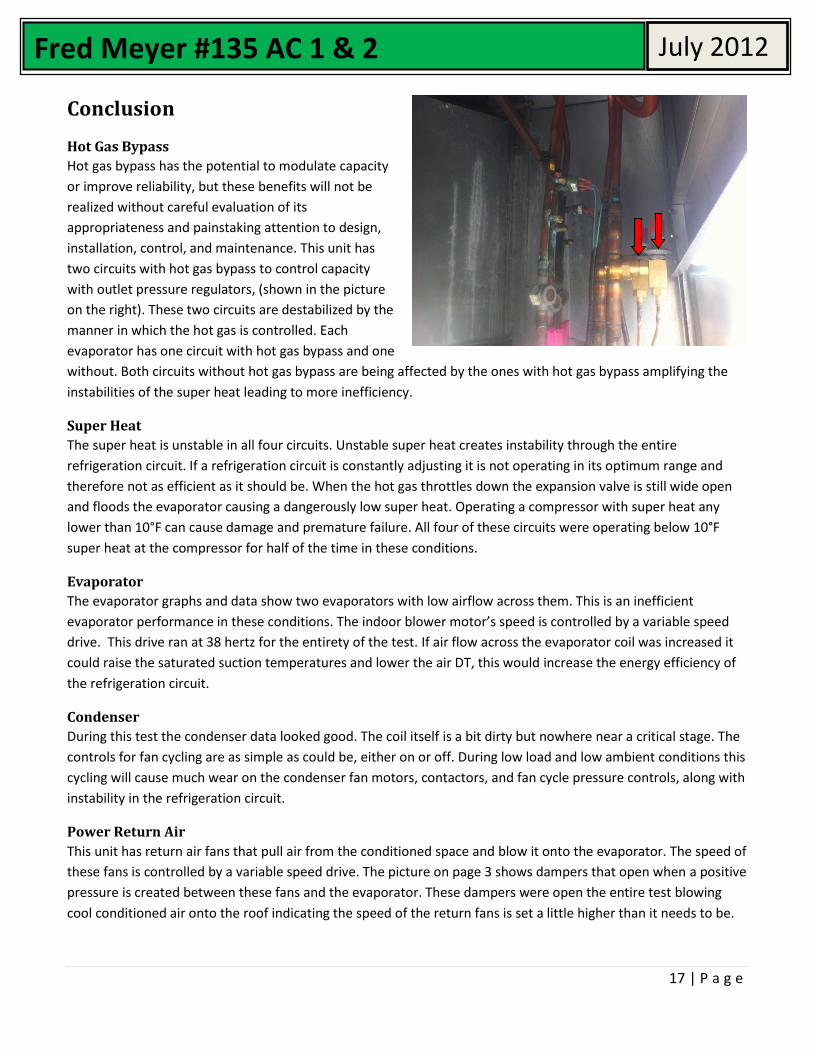
Hot Gas Bypass
Hot gas bypass has the potential to modulate capacity
or improve reliability, but these benefits will not be
realized without careful evaluation of its
appropriateness and painstaking attention to design,
installation, control, and maintenance. This unit has
two circuits with hot gas bypass to control capacity
with outlet pressure regulators, (shown in the picture
on the right). These two circuits are destabilized by the
manner in which the hot gas is controlled. Each
evaporator has one circuit with hot gas bypass and one
without. Both circuits without hot gas bypass are being affected by the ones with hot gas bypass amplifying the
instabilities of the super heat leading to more inefficiency.
Super Heat
The super heat is unstable in all four circuits. Unstable super heat creates instability through the entire
refrigeration circuit. If a refrigeration circuit is constantly adjusting it is not operating in its optimum range and
therefore not as efficient as it should be. When the hot gas throttles down the expansion valve is still wide open
and floods the evaporator causing a dangerously low super heat. Operating a compressor with super heat any
lower than 10°F can cause damage and premature failure. All four of these circuits were operating below 10°F
super heat at the compressor for half of the time in these conditions.
Evaporator
The evaporator graphs and data show two evaporators with low airflow across them. This is an inefficient
evaporator performance in these conditions. The indoor blower motor’s speed is controlled by a variable speed
drive. This drive ran at 38 hertz for the entirety of the test. If air flow across the evaporator coil was increased it
could raise the saturated suction temperatures and lower the air DT, this would increase the energy efficiency of
the refrigeration circuit.
Condenser
During this test the condenser data looked good. The coil itself is a bit dirty but nowhere near a critical stage. The
controls for fan cycling are as simple as could be, either on or off. During low load and low ambient conditions this
cycling will cause much wear on the condenser fan motors, contactors, and fan cycle pressure controls, along with
instability in the refrigeration circuit.
Power Return Air
This unit has return air fans that pull air from the conditioned space and blow it onto the evaporator. The speed of
these fans is controlled by a variable speed drive. The picture on page 3 shows dampers that open when a positive
pressure is created between these fans and the evaporator. These dampers were open the entire test blowing
cool conditioned air onto the roof indicating the speed of the return fans is set a little higher than it needs to be.

18 | P a g e
Fred Meyer #135 AC 1 & 2 July 2012
AC 2 AC 2 is a 16 year old Carrier unit
Model #48TJD014---611BD
Serial # 3395G30228
Refrigeration Process
This Graph shows both circuits of AC 2 running in stable operation. There are many things to point out in this
graph, low super heat, Low discharge temperature, high isentropic efficiency, high sub cool of circuit 2, and high
condenser air difference. This unit has two refrigeration circuits that should have the same refrigerant charge in
them. Both circuits use the same evaporator and condenser coils though they are separate circuits. The data of
both circuits should be very close to one another. That is not the case in the graph above.

19 | P a g e
Fred Meyer #135 AC 1 & 2 July 2012
Super Heat
The super heat of both circuits is much lower then recommended. With super heat this low there is danger of
liquid refrigerant returning to the compressor and causing damage to the compressor. Circuit 1 is averaging about
4.5°F super heat and circuit 2 is averaging about .5°F.
The picture to the right shows the compressor on circuit 2
sweating profusely on almost the entire compressor body
due to the very low super heat. In this picture there is also
evidence that each compressor has most likely been
replaced at least once. The replacement is evident in the
installation of the copper lines to the compressors, these
appear to be field welds and field used fittings.
20 | P a g e
Fred Meyer #135 AC 1 & 2 July 2012
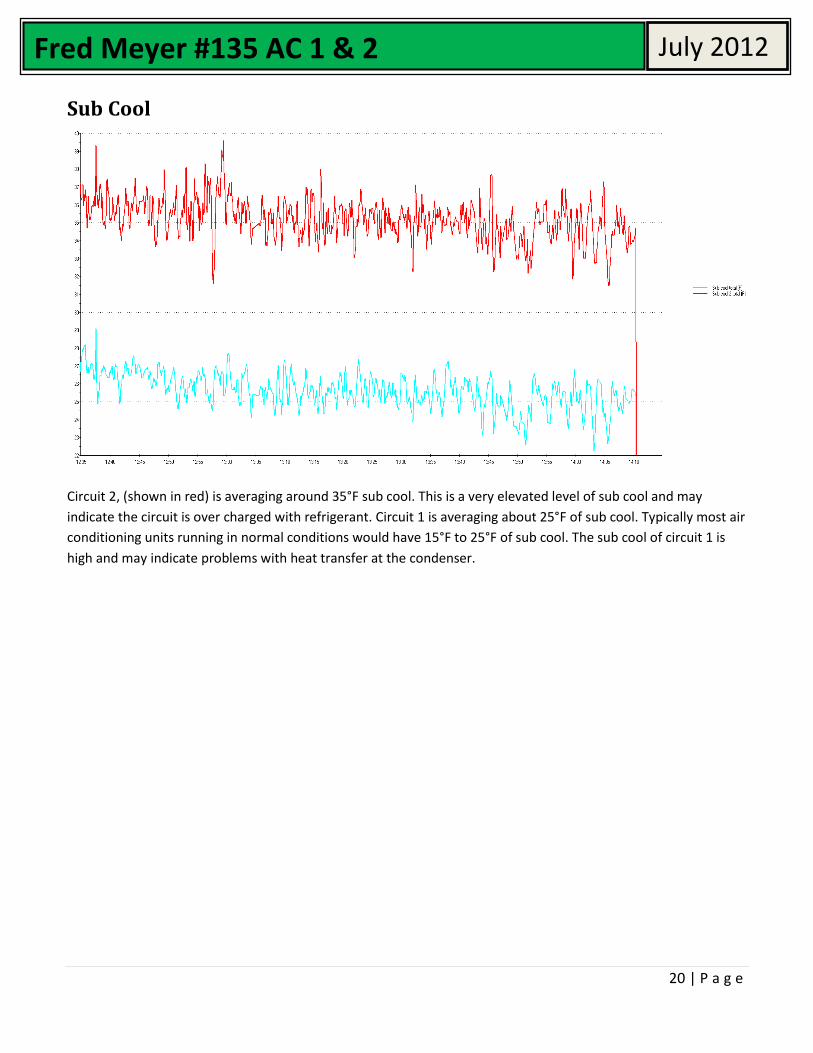
Sub Cool
Circuit 2, (shown in red) is averaging around 35°F sub cool. This is a very elevated level of sub cool and may
indicate the circuit is over charged with refrigerant. Circuit 1 is averaging about 25°F of sub cool. Typically most air
conditioning units running in normal conditions would have 15°F to 25°F of sub cool. The sub cool of circuit 1 is
high and may indicate problems with heat transfer at the condenser.
21 | P a g e
Fred Meyer #135 AC 1 & 2 July 2012
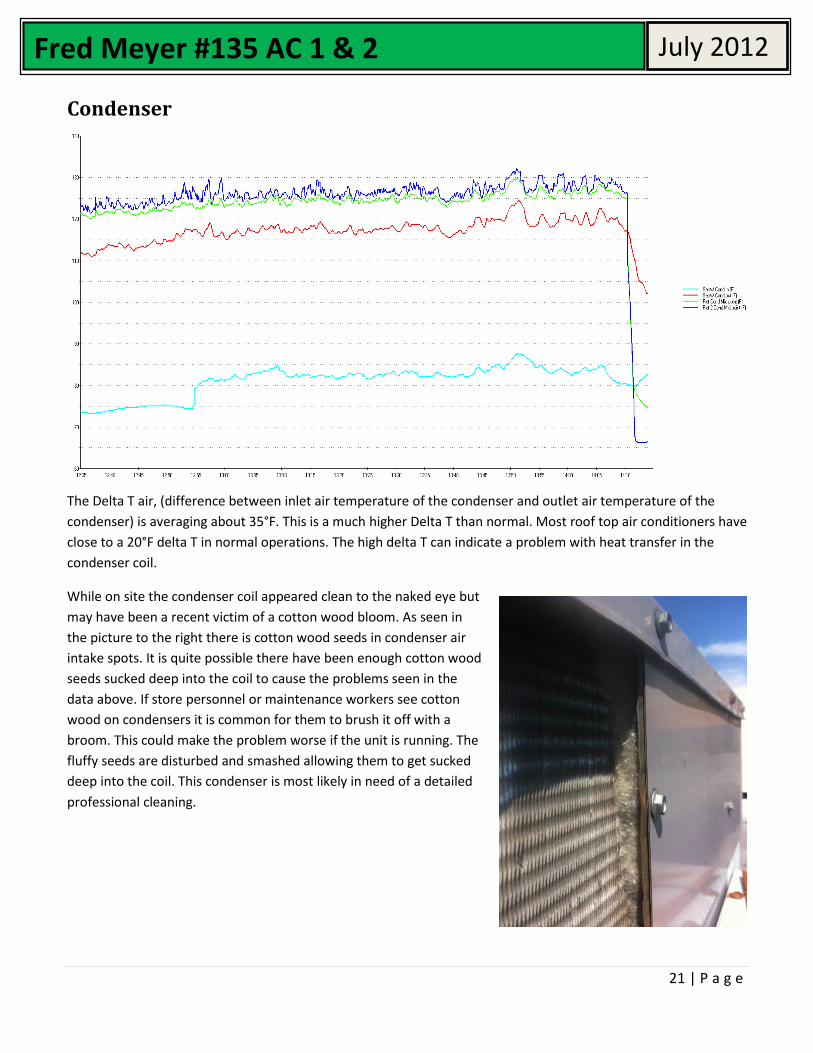
Condenser
The Delta T air, (difference between inlet air temperature of the condenser and outlet air temperature of the
condenser) is averaging about 35°F. This is a much higher Delta T than normal. Most roof top air conditioners have
close to a 20°F delta T in normal operations. The high delta T can indicate a problem with heat transfer in the
condenser coil.
While on site the condenser coil appeared clean to the naked eye but
may have been a recent victim of a cotton wood bloom. As seen in
the picture to the right there is cotton wood seeds in condenser air
intake spots. It is quite possible there have been enough cotton wood
seeds sucked deep into the coil to cause the problems seen in the
data above. If store personnel or maintenance workers see cotton
wood on condensers it is common for them to brush it off with a
broom. This could make the problem worse if the unit is running. The
fluffy seeds are disturbed and smashed allowing them to get sucked
deep into the coil. This condenser is most likely in need of a detailed
professional cleaning.
22 | P a g e
Fred Meyer #135 AC 1 & 2 July 2012
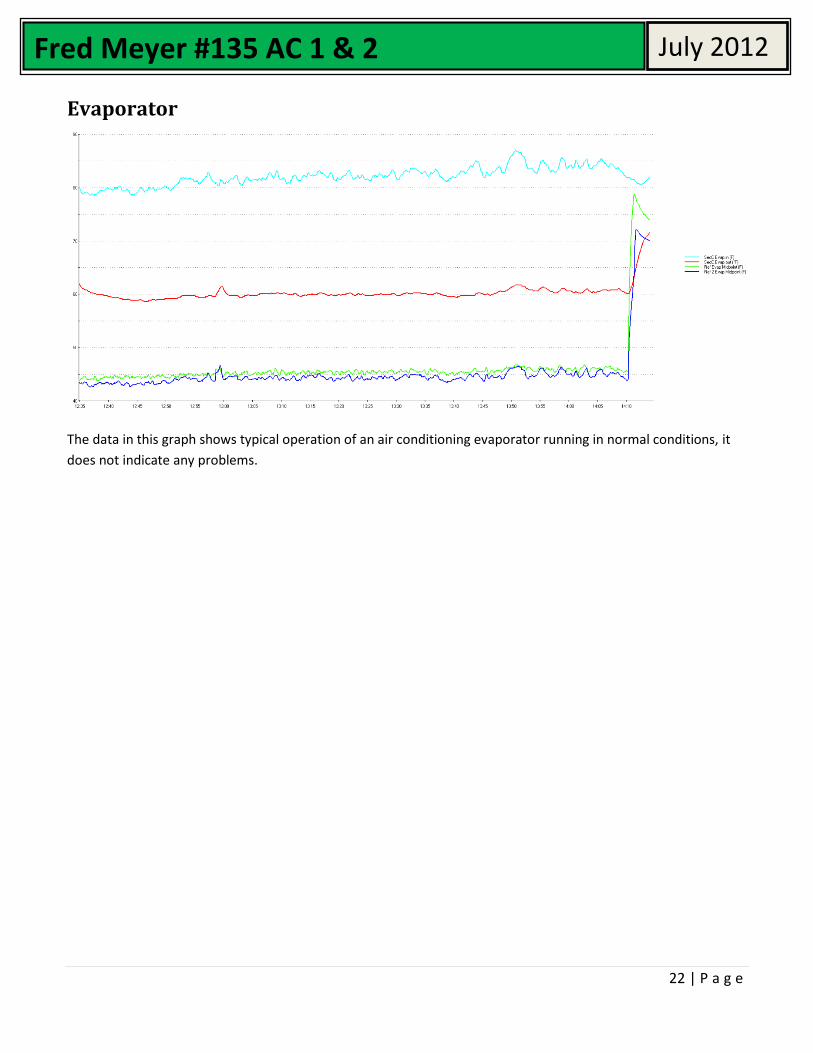
Evaporator
The data in this graph shows typical operation of an air conditioning evaporator running in normal conditions, it
does not indicate any problems.

23 | P a g e
Fred Meyer #135 AC 1 & 2 July 2012
Carrier Charging Chart
Plotted above on the Carrier charging chart you can
see circuit 1, (red dot) and circuit 2, (blue dot). If you
read the instructions to the right with an example you
can tell both circuits are too far to the left at 45°F and
50°F. They should be further to the right at around
70°F. The suction temperature is to low at this outdoor
ambient temperature and the charging chart indicates
that both circuits have too much refrigerant in them.
This chart should really only be used if the system is in
good working order with no problems. If we have low
air flow across the evaporator or condenser we would
get data that could indicate low or high charge here on this chart. Simply it is possible the charge may be fine and
the real problem elsewhere in the system.
24 | P a g e
Fred Meyer #135 AC 1 & 2 July 2012
Conclusion AC 2
Super Heat
Both circuits have low super heat. Carrier uses multiple fixed metering devices in the evaporator header that they
call Acutrol. It is very unlikely that these metering devices would fail open. If there is a problem with them it is
more likely that it would be the metering devices getting plugged from contaminants in the system and then
causing high super heat. It is a little difficult to pinpoint the cause of this superheat problem. The circuits may be
over charged. There could be low airflow across the evaporator. Problems with a dirty condenser could mimic an
overcharged system and cause high super heat. It could be all of these problems, one of these problems or a
mixture of all. The superheat issue should be corrected before another compressor replacement is needed.
Sub Cool
Both circuits have high sub cool, but circuit 2 has very high sub cool. A sub cool level this high can cause higher
pressures all over the circuit and low super heat. It is possible that a dirty condenser could contribute to high sub
cool, but it would have to be extremely dirty to reach the sub cool level of circuit 2. At the very least this is an
indication that two circuits that should have the same refrigerant charge in them do not.
Condenser
The condenser coil showed poor performance with a very high air DT. There were signs of cotton wood seeds
being sucked into the coil. This coil should be looked at and cleaned by a professional.
Evaporator
The data for the evaporator seemed to be normal. There are multiple problems on this unit that may be masking
problems with the evaporator. It is possible that when other problems are corrected this evaporator could show
low air flow. When work is done to correct the other issues correct airflow across the evaporator should be
verified.
Carrier Charging Chart
The Carrier charging chart indicates both circuits are over charged but this may be a result of other issues in the
system such as a dirty condenser.
Economizer
Operation of the economizer actuator was verified without issue. The economizer of this unit was open almost
completely for the entire time. Pulling in air over 80°F to the building to cool it is far from efficient. Some
investigation into why this economizer must be open this far is recommended.