introduction - · pdf file12/11/2014 · intersection counts will provide...
TRANSCRIPT

1 | Memphis Pedestrian Sidewalk Program
To: Kyle Wagenschutz, City of Memphis
CC:
From: Jean Crowther, Collin Chesston, John Cock, Alta Planning + Design
Date: November 11th, 2014
Re: Pedestrian Count Locations and Methodology (Task 2.3)
Introduction
Annual counts conducted in a systematic manner provide benchmarking information on walking activity and related
benefits. Count data adds to the understanding of existing pedestrian travel patterns, preferences, and needs. This allows
for more strategic planning of future walkway investments and provides a means of evaluating the impact of programs
and facilities. While count data will not provide comprehensive mode share data, it offers a snapshot of peak pedestrian
activity on a typical day. It can also provide important baseline data for before-after studies where new investments are
planned and provide insight into overall trends in the Memphis walking environment over time.
This memorandum outlines a proposed pedestrian count methodology and process for implementation. The approach
is based on the National Bicycle and Pedestrian Documentation project, an annual bicycle and pedestrian count and
survey effort (www.bikepeddocumentation.org). However, the count methodology and forms have been revised to meet
specific needs related to the current plan – to document pedestrian activity related to the use of marked pedestrian
crossings at signalized, unsignalized, and midblock locations. In particular, many pedestrians in Memphis can be
observed crossing near but not within marked pedestrian crossings. While this has likely become part of the culture in
Memphis, it is surmised that the availability of pedestrian infrastructure is likely influencing pedestrian habits. The count
methodology used in this plan establishes a baseline that can be used to track changes in the number and share of
pedestrians using provided crossings as new pedestrian enhancements are made.
Pedestrian Counts Program
A regular pedestrian count program is instrumental for measuring change over time. This empirical data can be used to
monitor implementation of the recommendations of the Memphis STP Pedestrian Project and its impact on Memphis
residents and visitors. The purpose of initiating a count program in Memphis is to gather important benchmarking
information about walking rates as well as behaviors, including the use of marked pedestrian crossings. This information
is useful to City staff and local and regional stakeholders for understanding whether there is an association between plan
implementation and walking activity and behaviors.
A manual count program, with annual data collection efforts, requires the partnership of community members. Counters
can be volunteers or agency staff, as long as proper training and support is provided. The initial counts following the
methodology outlined here were completed by students of University of Memphis’ professor Dr. Stephanie Ivey, with
training provided by Alta staff. The University of Memphis may continue to administer volunteer counters in the future.
Other potential partners in Memphis include:

Alta Planning + Design | 2
Other institutions of higher education such as Christian Brothers University (especially departments or
institutes related to public health, planning, transportation, and engineering)
Walking and/or transit advocates; running clubs
Safe Routes to School volunteers
Nonprofit organizations related to active transportation or outdoor recreation including Wolf River Greenway
and Livable Memphis
Advisory committees such as the Memphis MPO Active Transportation Advisory Committee
The following section identifies a recommended methodology for pedestrian counts that has been conducted in the fall
of 2014 as part of the Memphis STP Pedestrian Project.
Data Collection Methodology
This section provides a recommended count methodology, including count dates and times, pre-count preparation steps,
and resources that will help agency staff with the manual count effort. The end of this section identifies 20 proposed
locations to include in the manual count program, where initial counts were completed in the fall of 2014.
Count Type The National Bicycle and Pedestrian Documentation Project (NBPD) recommends ‘screenline’ counts, which provide
corridor-specific data and are relatively simple to conduct and analyze over time. However, for this plan, Alta proposed
that the City of Memphis conduct intersection counts, which record pedestrian activity on two streets as well
as turning movements between them. While this approach is slightly more complicated and requires two volunteers
at each location, it will be more useful data for documenting pedestrian crossing activity. Specifically, intersection counts
provide a means of documenting pedestrian behaviors in areas where there are potential conflicts with vehicles and how
frequently pedestrians are making use of marked pedestrian crossings.
Through the current planning process, Alta has observed that many pedestrians do not cross at intersections or marked
crossings. This behavior may be indicative of a need for additional pedestrian crossing opportunities or for additional
enhancements to improve conditions for pedestrians at existing signalized intersections or other marked crossings.
Intersection counts will provide information about location-specific pedestrian behaviors, while also
documenting general trends in pedestrian volumes (where pedestrian activity is occurring and where it is not),
and provide a basis for understanding how demographics, land use, and other factors influence pedestrian
travel. The count form developed for Memphis includes space for the volunteer counters to document activity at the
intersection, while also separately counting those pedestrians crossing near, but not at the marked crossing.
Count Dates and Times Alta recommends that Memphis complete counts on the national count dates, which in Fall 2014 were September 9-14.
The National Count Dates represent a peak period for walking and bicycling, in which weather conditions across the
country are generally conducive, schools and colleges have been underway for several weeks, and people have returned
from vacations and are back at work.
Counts are typically to be conducted on a weekday, when school is in session. NBPD recommends that counts be
conducted on a Tuesday, Wednesday or Thursday. Counts at the 20 locations in this study could have been conducted
on any of the above days.Counts were performed during the same week, but not all counts were conducted on the exact
same day. This provides agencies, organizations and volunteers with scheduling flexibility. The initial counts took place
during the NBPD recommended weekday afternoon peak period of 5-7 PM. Note that it is important that count data
reflect the same time periods for all future counts of this type in order to be consistently compared over time
3 | Memphis Pedestrian Sidewalk Program
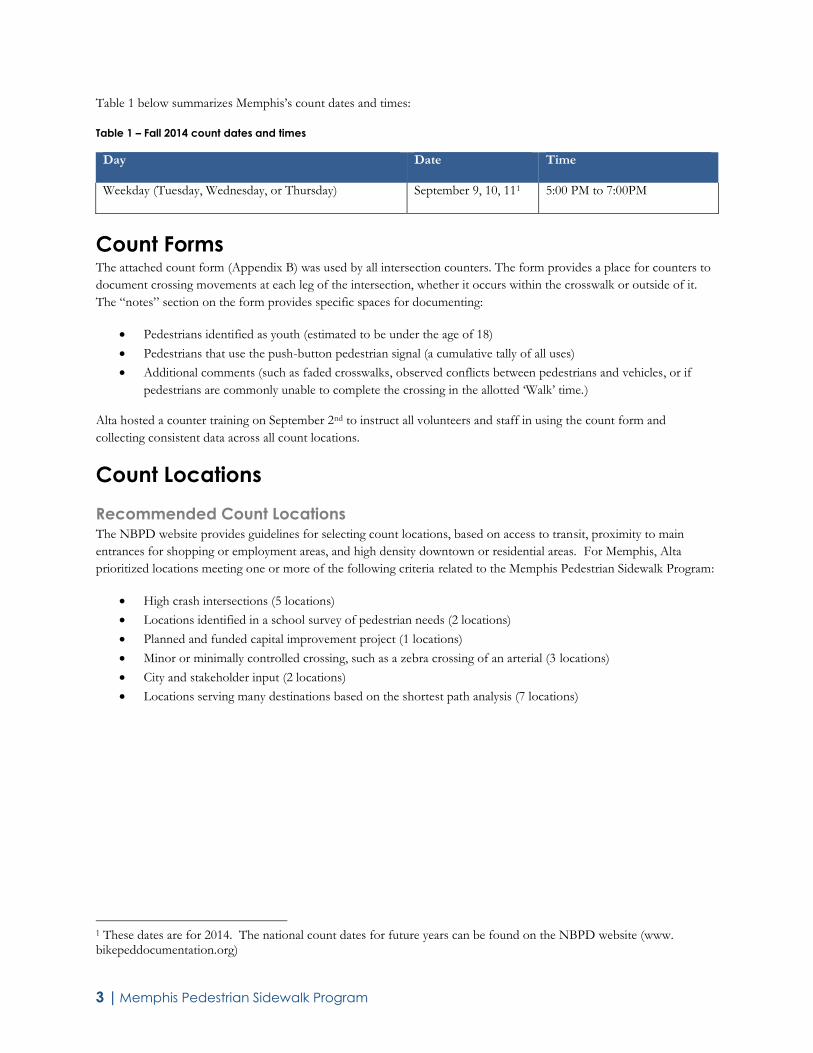
Table 1 below summarizes Memphis’s count dates and times:
Table 1 – Fall 2014 count dates and times
Day Date Time
Weekday (Tuesday, Wednesday, or Thursday) September 9, 10, 111 5:00 PM to 7:00PM
Count Forms The attached count form (Appendix B) was used by all intersection counters. The form provides a place for counters to
document crossing movements at each leg of the intersection, whether it occurs within the crosswalk or outside of it.
The “notes” section on the form provides specific spaces for documenting:
Pedestrians identified as youth (estimated to be under the age of 18)
Pedestrians that use the push-button pedestrian signal (a cumulative tally of all uses)
Additional comments (such as faded crosswalks, observed conflicts between pedestrians and vehicles, or if
pedestrians are commonly unable to complete the crossing in the allotted ‘Walk’ time.)
Alta hosted a counter training on September 2nd to instruct all volunteers and staff in using the count form and
collecting consistent data across all count locations.
Count Locations
Recommended Count Locations The NBPD website provides guidelines for selecting count locations, based on access to transit, proximity to main
entrances for shopping or employment areas, and high density downtown or residential areas. For Memphis, Alta
prioritized locations meeting one or more of the following criteria related to the Memphis Pedestrian Sidewalk Program:
High crash intersections (5 locations)
Locations identified in a school survey of pedestrian needs (2 locations)
Planned and funded capital improvement project (1 locations)
Minor or minimally controlled crossing, such as a zebra crossing of an arterial (3 locations)
City and stakeholder input (2 locations)
Locations serving many destinations based on the shortest path analysis (7 locations)
1 These dates are for 2014. The national count dates for future years can be found on the NBPD website (www. bikepeddocumentation.org)
Alta Planning + Design | 4
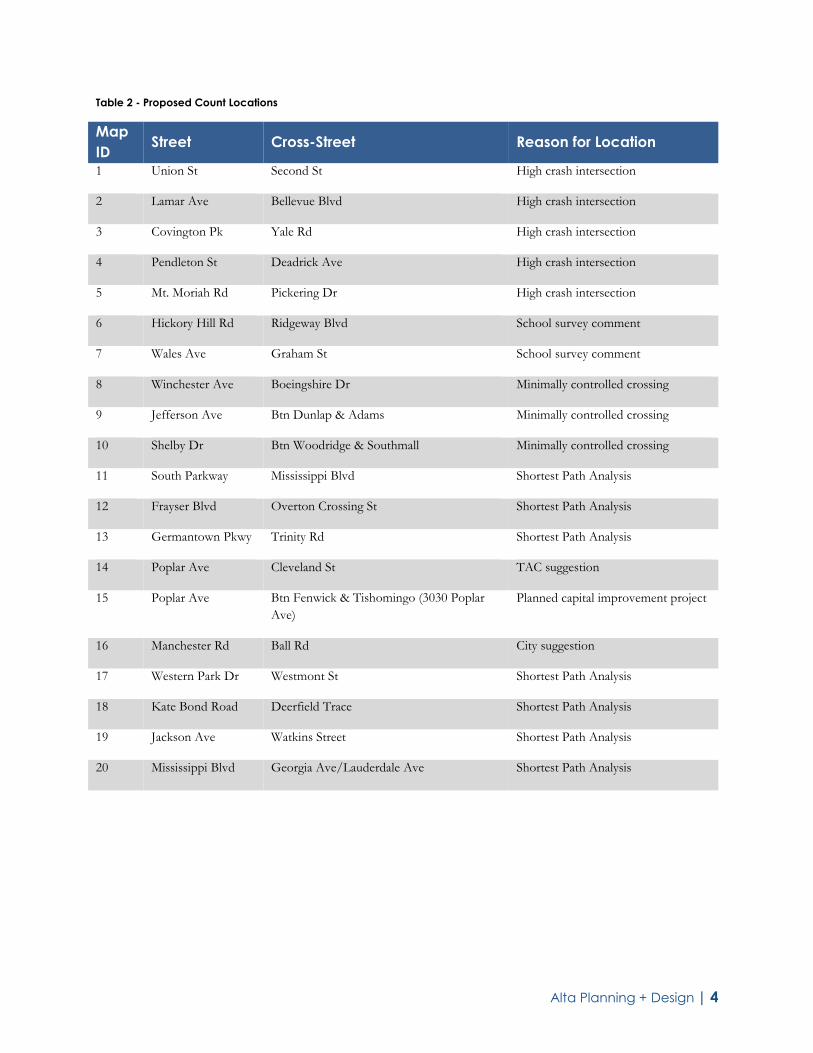
Table 2 - Proposed Count Locations
Map
ID Street Cross-Street Reason for Location
1 Union St Second St High crash intersection
2 Lamar Ave Bellevue Blvd High crash intersection
3 Covington Pk Yale Rd High crash intersection
4 Pendleton St Deadrick Ave High crash intersection
5 Mt. Moriah Rd Pickering Dr High crash intersection
6 Hickory Hill Rd Ridgeway Blvd School survey comment
7 Wales Ave Graham St School survey comment
8 Winchester Ave Boeingshire Dr Minimally controlled crossing
9 Jefferson Ave Btn Dunlap & Adams Minimally controlled crossing
10 Shelby Dr Btn Woodridge & Southmall Minimally controlled crossing
11 South Parkway Mississippi Blvd Shortest Path Analysis
12 Frayser Blvd Overton Crossing St Shortest Path Analysis
13 Germantown Pkwy Trinity Rd Shortest Path Analysis
14 Poplar Ave Cleveland St TAC suggestion
15 Poplar Ave Btn Fenwick & Tishomingo (3030 Poplar
Ave)
Planned capital improvement project
16 Manchester Rd Ball Rd City suggestion
17 Western Park Dr Westmont St Shortest Path Analysis
18 Kate Bond Road Deerfield Trace Shortest Path Analysis
19 Jackson Ave Watkins Street Shortest Path Analysis
20 Mississippi Blvd Georgia Ave/Lauderdale Ave Shortest Path Analysis

5 | Memphis Pedestrian Sidewalk Program
Figure 1: Proposed Count Locations

Alta Planning + Design | 6
Summary of Count Results
Table 3 through Table 6 below identify the top locations in terms of a) overall pedestrian volumes, b) share of youth pedestrians c) locations where pedestrians were
most likely to cross near but away from the designated crossing, and d) locations where pedestrians were most likely to cross at the designated crossing. Note that
locations with less than 10 pedestrians are excluded from these tables due to small sample size.
The highest pedestrian crossing volumes were observed downtown, along major commercial corridors, at a location near several schools, and in the medical
district.
Table 3 - Count locations with the highest pedestrian crossing volumes (including both at and near the crossing)
Location ID Total
Pedestrians
% Crossing Away from Designated
Crossing % of Youth Pedestrians Notes
Union Ave. and Second Street 1 1,066 27% 1% Signalized intersection downtown with crosswalks on all legs
Poplar Ave. and Cleveland 14 233 52% 3% Signalized intersection on commercial corridor with crosswalks on all legs (faded, barely visible)
Jackson and Watkins 19 227 60% 5% Signalized intersection in commercial area with crosswalks across Jackson Ave (2)
Georgia Ave and Lauderdale Ave 20 209 68% 31% Signalized intersection near 3 schools (Booker T Washington High School, Larose Elementary School, and Martin Luther King Headstart) with crosswalks across Georgia Ave (2), Mississippi Blvd (N side), S Lauderdale St (N Side)
Jefferson Midblock at Hospital 9 152 66% 1% Midblock crossing in medical district with high visibility crosswalk across Jefferson Ave

7 | Memphis Pedestrian Sidewalk Program
Figure 2: Count Results by Number of Pedestrians Observed

Alta Planning + Design | 8
The highest percentage of youth pedestrians were all found at count locations located near schools.
Table 4 - Count locations with the highest percentage of youth pedestrians
Location ID Total
Pedestrians
% Crossing Away from Designated
Crossing % of Youth Pedestrians Notes
Western Park and Westmont 17 39 NA 100% Near Westwood Park entrance, Westwood Elementary School, Chickasaw Middle School
S. Parkway and Mississippi 11 35 29% 53% Near Circles of Success Learning Academy (Public Charter School), South Memphis Farmer's Market
Winchester and Boeingshire 8 26 39% 46% Near Winchester Elementary School
Kate Bond and Deerfield Trace 18 84 26% 42% Near Kate Bond Elementary School, Kate Bond Middle School
Frayser & Overton 12 92 78% 36% Near Memphis Business Academy (Public Charter School) Denver Elementary School, commercial
Many pedestrians in Memphis can be observed choosing to cross near, but not at designated crossing facilities. Table 5, Table 6, and Figure 3 illustrate the count
locations where pedestrians were the least and most likely to cross at the designated crossing.
The locations with the highest percentage of pedestrians crossing near but not at the designated crossing are all locations with higher pedestrian count
volumes. These include four signalized intersections (all involve two roadways of 4 lanes or greater) and a high visibility crosswalk across a four lane road.
The intersections of two major streets can be intimidating for pedestrians who may face conflicts with right and left turning vehicles. Additional treatments
such as a protected left turn phase, leading pedestrian intervals, a longer pedestrian walk phase, and more frequent crosswalk maintenance could increase the
share of pedestrians choosing to cross these roads at the signalized intersection. Enhancing the crosswalk on Jefferson Avenue with a median refuge island or
a flashing beacon could increase the percentage of pedestrians making use of this crossing facility.
The locations with the highest percentage of pedestrians using the designated crossing tend to have lower crossing volumes, so there is an element of
uncertainty regarding how well these percentages reflect the true averages.

9 | Memphis Pedestrian Sidewalk Program
Table 5 – Count locations with the highest percentage of pedestrians crossing at locations near but not at the designated crossing
Location ID Total
Pedestrians
% Crossing Away from Designated
Crossing % of Youth Pedestrians Notes
Frayser & Overton 12 96 78% 36% Signalized intersection of two 5 lane roads, with crosswalks on all legs
Georgia Ave and Lauderdale Ave 20 209 68% 31% Signalized intersection of a 4 lane and 2 lane road, with crosswalks across Georgia Ave (2), Mississippi Blvd (N side), S Lauderdale St (N Side)
Jefferson Midblock at Hospital 9 152 66% 1% High visibility crosswalk across a 4 lane road (Jefferson Ave)
Jackson and Watkins 19 227 60% 5% Signalized intersection of a 4 lane and 6 lane road, with crosswalks across Jackson Ave (2)
Poplar Ave. and Cleveland 14 233 52% 3% Signalized intersection of a 7 lane and 4 lane road, with crosswalks on all legs (faded, barely visible)
Table 6 - Count locations with the lowest percentage of pedestrians crossing away from intersections include:
Location ID Total
Pedestrians
% Crossing Away from Designated
Crossing % of Youth Pedestrians Notes
Kate Bond and Deerfield Trace 18 84 26% 42% High visibility crosswalk across two 2 lane roads, with crosswalks across Kate Bond Rd (N side, Continental), Deerfield Trace (2)
Union Ave. and Second Street 1 1,066 27% 1% Signalized intersection of a 5 lane and 3 lane road downtown with crosswalks on all legs
S. Parkway and Mississippi 11 35 29% 53% Signalized intersection of 5 lane and 3 lane road with crosswalks on all legs (faded)
Winchester and Boeingshire 8 26 39% 46% Unsignalized crossing of a 7 lane and a 2 lane road, with crosswalks across Winchester Rd (W side) and Boeingshire Dr (S side)
Wales and Graham 7 13 39% 10% Unsignalized crossing of a 2 lane road with crosswalk across Graham St (S side, faded)

Alta Planning + Design | 10
Figure 3: Count Results by Percentage of Youth Pedestrians and Percentage of Pedestrians Crossing outside a Designated Crossing

11 | Memphis Pedestrian Sidewalk Program
Appendix A – Considerations for Future Counts
The Memphis Urban Area Metropolitan Planning Organization (Memphis MPO) has recently initiated a bicycle and pedestrian count program which is conducted
annually at 40 locations each April, a good weather month in Memphis. The selected count locations are sites where the MPO has either recently funded projects or
has projects under design.
The 20 locations identified in this memo for the City of Memphis should also be counted annually to track changes in activity and pedestrian behaviors (e.g., use of
marked crossing facilities). These weekday counts should continue to be performed during the annual NPBD count period in September for consistency.
The citywide count program established here is intended to tally the number of pedestrians at key locations around the city (while the current plan focuses on schools,
other locations may include downtown, employment centers, and on trails); the same locations should be counted in the same manner annually.
Considerations for future count locations:
If resources allow, the program could be expanded to include both a weekday and weekend2 count at each location during the national count week. The
program could also be expanded to count up to four times per year to track seasonal and other variations (optional quarterly count dates are provided on the
NBPD website).
If major on-street or off-street infrastructure projects are planned, baseline and post-construction user counts can be performed through this
coordinated annual count process for maximum efficiency.
Similarly, if land use developments are occurring that impact a specific user group, pre- and post-construction counts can be performed to track more
refined information about the growth of walking activity. Examples could be new student housing within walking distance of campus or new multi-family
housing near transit stops.
Future iterations of the annual count program could include user surveys. Surveys allow an agency to learn more detailed user information such as
demographics, trip origin/destinations, trip purpose, and perceived benefits of bicycling and walking. The NBPD website includes survey instructions, forms,
and participant training materials: http://bikepeddocumentation.org. It is not necessary to survey pedestrians every year. To optimize resources, surveys can
be performed every 3-5 years to track changes in pedestrian perceptions and trip types over time.
Over time, the city and partners could invest in permanent and mobile automated counters and integrate pedestrian counts into regularly scheduled
and on-going traffic count programs and required traffic impact analysis studies so that data on pedestrian usage are a regular part of transportation data
collection for the City. Even as automated counters are used in the future at select locations, manual counts can continue to provide data at a wider number
of locations.
2 The recommended national weekend count period is a Saturday from 12-2PM.

Alta Planning + Design | 12
Appendix B – 2014 Pedestrian Count Results
Table 7: Summary of Pedestrian Count Results
Location ID Total
Pedestrians
% Crossing Away from Designated
Crossing % of Youth Pedestrians
Crossing Type
Crossing Context Pedestrian Infrastructure
Union Ave. and Second Street 1 1066 26.6% 0.6% Signalized
Intersection Downtown Crosswalks on all legs
Bellevue and Lamar 2 90 50.0% 10.6% Signalized
Intersection Commercial Corridor Crosswalks on all legs (faded)
Covington Pike and Yale 3 22 40.9% 22.5% Signalized
Intersection Near
school/commercial
Crosswalks on all legs (faded), median on Yale St on W side of
intersection (no refuge)
Deadrick and Pendelton 4 129 73.6% 32.1% Unsignalized Intersection
Near school/neighborhood
Crosswalk across Pendleton St (N side) and Deadrick Ave (E
side, faded)
Mt. Moriah and Pickening 5 124 87.9% 16.8% Unsignalized Intersection Residential/Industrial No infrastructure
Ridgeway Blvd and Hickory Hill Rd 6 6 66.7% 0.0%
Signalized Intersection Near School
Crosswalk across Hickory Hill Rd (N side)
Wales and Graham 7 13 38.5% 9.5% Unsignalized Intersection Near School
Crosswalk across Graham St (S side, faded)
Winchester and Boeingshire 8 26 38.5% 46.2% Unsignalized Intersection Near School
Crosswalk across Winchester Rd (W side) and Boeingshire Dr (S
side)
Jefferson Midblock at Hospital 9 152 65.8% 1.1% Midblock Medical District High visibility crosswalk across
Jefferson Ave
Woodbridge and Southland 10 2 100.0% 0.0% Midblock Near private school
and mall
High visibility crosswalk across Shelby Dr (ladder) with median
refuge
S. Parkway and Mississippi 11 35 28.6% 52.8% Signalized
Intersection Near school, farmer's
market Crosswalks on all legs (faded)
Frayser & Overton 12 96 78.1% 36.3% Signalized
Intersection Near schools, commercial Crosswalks on all legs
Germantown Pky and Trinity 13 8 25.0% 0.0% Signalized
Intersection Commercial Corridor
Crosswalks on all legs, slip lane with pedestrian refuge on
southwest corner, medians on all

13 | Memphis Pedestrian Sidewalk Program
approaches (no other refuges)
Poplar Ave. and Cleveland 14 233 52.4% 3.4% Signalized
Intersection Commercial Corridor Crosswalks on all legs (faded,
barely visible)
Poplar Ave. and Library Entrance 15 26 34.6% 20.5% Midblock
Library (Counter to stand in front of library entrance) No infrastructure
Ball St. and Manchester Rd. 16 7 100.0% 85.7% Unsignalized Intersection No infrastructure
Western Park and Westmont 17 39 82.1% 100.0% Unsignalized Intersection
Near park entrance, schools No infrastructure
Kate Bond and Deerfield Trace 18 84 26.2% 42.0% Unsignalized Intersection Near school
High visibility crosswalk across Kate Bond Rd (N side,
Continental), Crosswalks across Deerfield Trace (2)
Jackson and Watkins 19 227 59.5% 4.6% Signalized
Intersection Commercial area Crosswalks across Jackson Ave
(2)
Georgia Ave and Lauderdale Ave 20 209 67.9% 30.6%
Signalized Intersection Near 3 schools
Crosswalks across Georgia Ave (2), Mississippi Blvd (N side), S
Lauderdale St (N Side)

Alta Planning + Design | 14
Table 8: Count Location Dates, Times, and Weather Notes
Location ID Date Time Weather Notes (°F)
Union Ave. and Second Street 1 9/17/2014 5-7PM 74° Overcast
Bellevue and Lamar 2 9/23/2014 5-7PM 80° Sunny
Covington Pike and Yale 3 9/17/2014 5-7PM 74° Overcast
Deadrick and Pendelton 4 9/9/2014 5-7PM 92° Sunny
Mt. Moriah and Pickening 5 9/18/2014 5-7PM 79° Partly Cloudy
Ridgeway Blvd and Hickory Hill Rd 6 9/9/2014 5-7PM 92° Sunny
Wales and Graham 7 9/16/2014 5-7PM 76° Partly Cloudy
Winchester and Boeingshire 8 9/9/2014 5-7PM 93° Partly Cloudy
Jefferson Midblock at Hospital 9 9/18/2014 5-7PM 80° Partly Cloudy
Woodbridge and Southland 10 9/9/2014 5-7PM 92° Sunny
S. Parkway and Mississippi 11 9/16/2014 5-7PM 76° Partly Cloudy
Frayser & Overton 12 9/10/2014 5-7PM 93° Partly Cloudy
Germantown Pky and Trinity 13 9/9/2014 5-7PM 92° Sunny
Poplar Ave. and Cleveland 14 9/18/2014 5-7PM 79° Partly Cloudy
Poplar Ave. and Library Entrance 15 9/9/2014 5-7PM 92° Sunny
Ball St. and Manchester Rd. 16 9/18/2014 5-7PM 77° Partly Cloudy
Western Park and Westmont 17 9/10/2014 5-7PM 93° Partly Cloudy
Kate Bond and Deerfield Trace 18 9/18/2014 5-7PM 79° Partly Cloudy
Jackson and Watkins 19 9/18/2014 5-7PM 80° Partly Cloudy
Georgia Ave and Lauderdale Ave 20 9/9/2014 5-7PM 95° Sunny

15 | Memphis Pedestrian Sidewalk Program
Appendix C – Pedestrian Count Form