introductionaf1p/teaching/or2/projects/p26... · web viewproject objective in this project, we are...
TRANSCRIPT
Student Walking Patterns on Carnegie Mellon Campus
Operations Research IIFall 2008
Will KimJosh JelinJay Kim
So Young Park
Introduction
Executive SummaryOn Carnegie Mellon University campus, we often see a group of desks lying outside of
Doherty hall near “The Fence” with people trying to advertise themselves to Carnegie Mellon
students. But those people chose that location just because it is the highest traffic area on
campus and without any consideration about walking patterns of Carnegie Mellon students and
their objectives. This paper discusses our efforts to provide solutions for various groups of
people on campus to locate places to inform or communicate with Carnegie Mellon community.
MotivationCarnegie Mellon University is not a huge school where it does not take a person to walk
across the campus more than 20 minutes. There are few paths which students usually take to
move from a class room to another class room or from a building to another building. We do
know where the heaviest traffic spot on campus is; the path from Doherty to University Center
which cuts across “The Cut”. Because of its high traffic, there are desks just outside of the
campus on usual nice sunny and warm days. Those desks are usually from student
organizations, such as fraternities, sororities, campus clubs, and etc, which try to inform their
events, gather some survey data, sell sweets for fund raising, or etc. Those student
organizations usually have just one desk to deploy on campus and their best choice would be
the highest traffic spot on campus, in front of Doherty. However, companies often visit
Carnegie Mellon University and try to recruit people on campus, and they also do set up info
desks around the campus, usually more than just one. Then we came to this question that, are
they at the places where they can maximize the utility according to their objectives? This
question is raised because each group has different objectives and certainly the highest traffic
spot may not be the best spot to set up their ads desk. So in order to find out how to maximize
utility for each group constraint by number of ads desks, we tried to research the walking
patterns of Carnegie Mellon students on campus.
Project ObjectiveIn this project, we are trying to solve different problems that each group faced according
to their objectives based on the walking patterns of people on Carnegie Mellon University
campus. One main analysis we conducted in our research was how to reach maximum number
of people on campus with given n number of tables. The other analysis was about how to
choose the best locations based on the assignment of different profit values for given
conditions with n number of tables.
Survey
To collect data, we went to high-traffic areas and conducted surveys of walkers. Our
survey asked walkers to identify themselves using several demographics such as gender and
year of enrollment. Then it asked walkers to identify the route they used when walking to class
(Appendix A). We received over 130 surveys, 122 of which were complete and used in our
analysis.
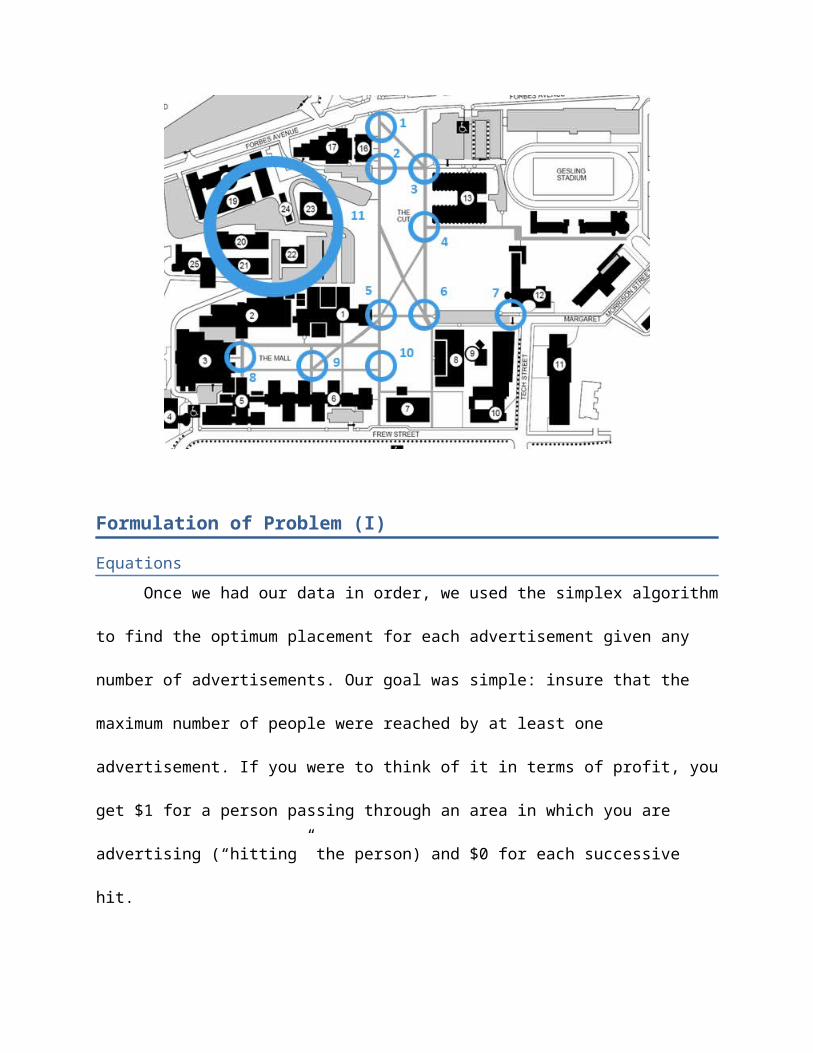
We entered the data into Excel. For the most part this was simple, but converting 122
highlighted routes into a form the simplex algorithm could understand was more difficult. From
the surveys, we identified 11 high traffic areas as seen in figure A. If an individual indicated that
they walked through a given area on their survey, we entered a 1 in for the column
corresponding to that area. Otherwise that column would be 0. As you can see in Appendix B,
the walker entered into row #4 walks through points 1, 5, 9, and 10, whereas the walker in row
#5 only passes through point 1.
Figure A: High Traffic Areas

Formulation of Problem (I)
Equations
Once we had our data in order, we used the simplex algorithm to find the optimum
placement for each advertisement given any number of advertisements. Our goal was simple:
insure that the maximum number of people were reached by at least one advertisement. If you
were to think of it in terms of profit, you get $1 for a person passing through an area in which
you are advertising (“hitting” the person) and $0 for each successive hit.
We calculated the optimum placement ten times, one for each nontrivial number of
advertisements. Calculating the optimal placement of advertisements is trivial if we have 11
advertisements to distribute to 11 points. Set of equations is following.
Maximize Z=∑k=1
122
∑i=1
11
X k ,i∗Y i
Subject to
∑i=1
11
Y i≤n
and
Y iis binary, X k ,iis binary for i = 1, 2, …, 11, k = 1, 2, …, 122.
Y iis 1 if table exists at the ith spot; 0 otherwise
X k ,iis 1 if kth person passes the ith spot; 0 otherwise
The exact formulation within Excel can be seen in Appendix B.
Results
If we run the simplex algorithm as described in the formulation section, we get the
following results at each level of advertisement:
One Advertisement
Obviously, with one point we choose the point of highest traffic, which is 5 with 99 hits.
Note that with point 5 alone we already have 80% of our people covered.
Two Advertisements
When we input 2, the simplex algorithm chooses points 5 and 11 for 110 hits. Sadly,
point 11 is a very difficult place to advertise because of the environment. From here on, I will
not consider point 11. If we rerun the simplex algorithm without point 11, we see we can hit
106 people by choosing points 5 and 8.
Three Advertisements
With 3 points, we get 112 observations by choosing points 1, 5, and 8.
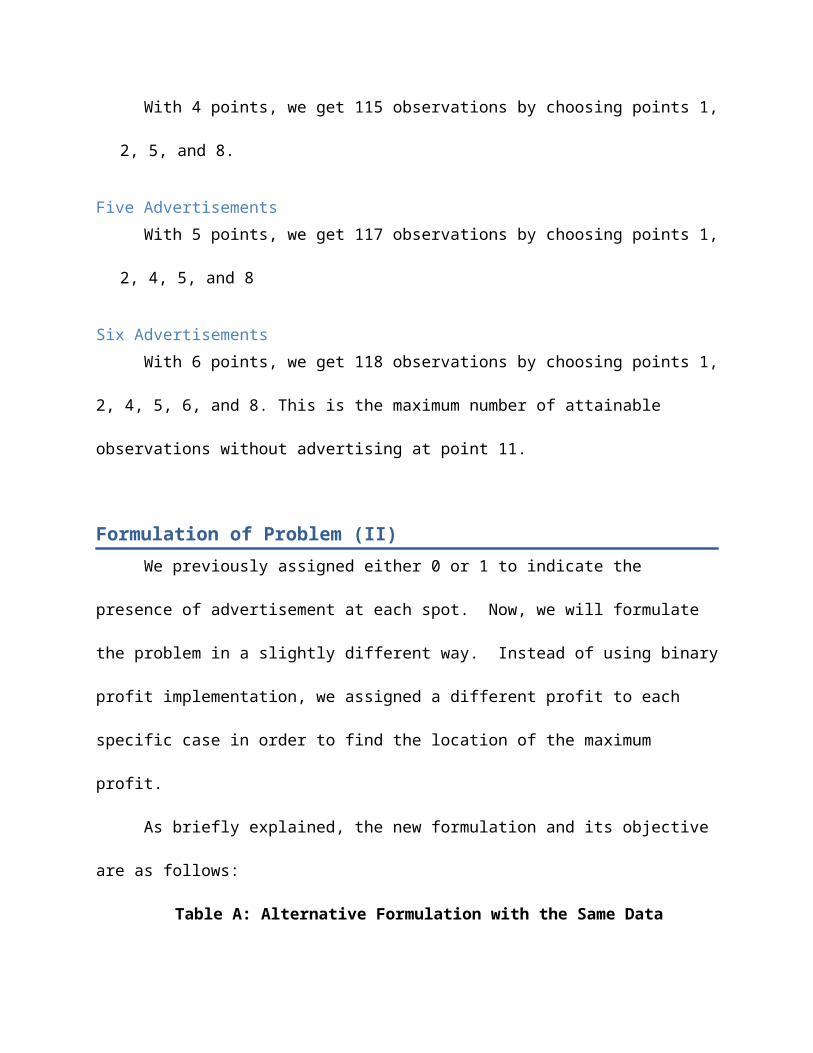
Four Advertisements
With 4 points, we get 115 observations by choosing points 1, 2, 5, and 8.
Five Advertisements
With 5 points, we get 117 observations by choosing points 1, 2, 4, 5, and 8
Six Advertisements
With 6 points, we get 118 observations by choosing points 1, 2, 4, 5, 6, and 8. This is the
maximum number of attainable observations without advertising at point 11.
Formulation of Problem (II)We previously assigned either 0 or 1 to indicate the presence of advertisement at each
spot. Now, we will formulate the problem in a slightly different way. Instead of using binary

profit implementation, we assigned a different profit to each specific case in order to find the
location of the maximum profit.
As briefly explained, the new formulation and its objective are as follows:
Table A: Alternative Formulation with the Same Data
Objective To Maximize ProfitFormulation Assign $1 for encountering a person at the first desk
Assign $1 for encountering a person at the second deskAssign additional $2 for encountering a person at the first desk and the second desk
Maximize Z=∑k=1
122
∑i=1
11
∑j=1
11
( X k ,i∗X k , j∗(Y i+Y j)2 )
Subject to
∑i=1
11
Y i≤2
and
Y iis binary, X k ,iis binary for i = 1, 2, …, 11, k = 1, 2, …, 122.
Y iis 1 if table exists at the ith spot; 0 otherwise
X k ,iis 1 if kth person passes the ith spot; 0 otherwise
Formulating the problem in this way allows us to answer another set of questions
relating to the advertisement spots on campus. For example, we can obtain a numerical
answer for the following question: “How do I hit maximum number of people twice with only
two spots of advertisement?”

Similar to the data analysis for the previous formulation, this particular optimization
problem can also be solved with integer programming method. We added additional columns
of X k ,i∗Xk , j to indicate whether or not a person passes both the ith spot and jth spot.
In spite of using a different method, the result came out to be the same as that with our
previous formulation. The result indicates the same spots are the most profitable locations for
advertisements with newly assigned profit values. With two desks to set up on the campus, the
combination of 2 locations 5 and 1 is the most profitable combination of 2 locations with the
maximum profit $269.
As the result with the alternative formulation gives the same optimal answers, it seems
to be insignificant. Nonetheless, if an advertiser has information about the specific profits for
each successive advertisement spot, the alternative formulation is a more effective way to find
the optimal location for attaining maximum profits.
Other Possible ProblemsThere are some other questions, in which an advertiser would be interested. If an
advertisement is designed for specific groups such as gender, department or status, we could
use the same data and the data analysis process to attain the optimal locations for
advertisements. The data that collected through the survey includes the information of
participants’ backgrounds. In order to find the most profitable locations for targeting the
specific group, we can first sort the data by group, and apply the Excel solver with the same
formulation and its objective.
Although the effective spots for advertisement on campus are obtained with the
previously explained method, other variables must be considered in order to conduct more
sophisticated analysis. The participant’s available time, environment or circumstance at each
spot can significantly alter the result. These potential problems will be more explicitly discussed
in the later section. Besides these potential problems, the formulation and methods for this
optimization problem can be applied to plan for future advertisements on campus.
ConclusionBased on the two analyses and formulation of problems, we were able to figure out
where are the best locations on campus to set up n number of desks with/without given an
assignment table of profit. As expected, the highest traffic spot on campus, in front of Doherty,
was chosen as the first place. However the second place was in front of Hamershlag, instead of
the spot behind the University Center near tennis court, the second most preferred place on
campus for setting up the desk. So based on our research, it would be a better idea to set up a
desk in front of Hamershlag if the spot in front of Doherty is too crowded or another desk is
already set. Based on the research and analysis, we can change our problems according to the
objectives/preferences of different groups by changing the maximization formula and its
constraints, and those different groups can gain a benefit of optimizing their own utility of
setting up a table/tables.
Discussion of Future Work

Our object of this project was to find the most effective spot for advertisements on
campus. But our definition of ‘effective spot’ is somewhat vague. We conducted a survey to
locate the highest traffic spot on campus and concluded that the spot would be the best place
to advertise. But this may not be true. In other words ‘highest traffic spot’ may not be the most
‘effective spot’ to advertise. For example, our result clearly shows that spot 5 (in front of
Doherty) has the highest traffic. This is a spot where lots of students pass by, but there is really
no spot to advertise. Students are either going to class or getting out of class. Surely they can
look at it, but it may not interest them so much when they have class within 10 minutes. Also it
is especially hard to have students pay attention when they are with other friends, talking on
the phone, or listening to music. On the other hand, places like tables outside of University
Center or library could be better spots, where students are actually sitting down and could pay
more attention to. In other words, we may have figured out the spot where lots of students
pass by, but that may not be the best spot for advertisements. In fact, stopping a student in
front of Doherty to take the survey was one of the hardest parts of the survey. Figuring out the
most effective way of advertising (instead of the best spot) could possibly improve our model in
the future study.
Amount of data is another possible problem. An approximate of 150 students
participated in our survey, and clearly this is not even 10% of the entire campus. More students
could definitely change the results. Even though highly unlikely, it is still possible that rest of
the campus never passes by Doherty at all. Our data also shows that most of data are from
undergraduate students. Taking graduate students and faculties and even visitors into account

could give us more accurate results. Collecting more data is another possible future
improvement
Our entire approach itself could be another problem. Our survey asked students to
highlight the routes they take to walk to classes. Then we picked 10 spots where students pass
by the most. This approach may not have been the best, because it could result in overlapping
paths. For example, our data shows that spot 5(in front of Doherty) is the most trafficked, and
spot 1(in front of HUB) is the second most trafficked. But it is very likely that students who pass
by spot 1 will also pass spot 5. In other words, advertising at spot 1 and 5 will only attract same
people twice. It would have been better and more accurate if we asked students to pick a
single spot they walk by the most (instead of the entire routes they take) and base our model
on it. This will give us best spots to advertise to different people with no overlapping at all.
Other than those addressed issues, everything else was fine. Our data consists of
students from all departments and survey was taken at 6 different spots to ensure randomness
(Doherty, Library, Wean Hall, Baker Hall, Porter Hall, UC). Male to female ration was 74:49. Our
data consists 8% of Tepper, 19.50% of H&SS, 26.80% of MCS, 28.50% of CIT, 5.70% of CFA,
6.50% of SCS and 5% of others. About 50% of the data are from MCS and CIT students, who
have lots of classes in Doherty. Surveying more students from other departments could
improve our data in future.

Appendix A: Survey
What is your name? __________________________________________________
What is your gender? __________________________________________________
What is your status at Carnegie Mellon? Undergraduate Graduate Student Other
Which year is this for you at Carnegie Mellon? 1st 2nd 3rd 4th 5th 6th+
Which school are you enrolled in? __________________________________________
Please highlight the route you take while walking to class:
Thank you!
Appendix B: Simplex Implementation in Excel
Formulation with six points of advertisement: