introducingexpectedreturnsinto riskparityportfolios...
TRANSCRIPT

Introducing Expected Returns intoRisk Parity Portfolios: A New Framework
for Asset Allocation∗
Thierry RoncalliResearch & Development
Lyxor Asset Management, [email protected]
First Version: July 2013This Version: April 2014
Abstract
Risk parity is an allocation method used to build diversified portfolios that does notrely on any assumptions of expected returns, thus placing risk management at the heartof the strategy. This explains why risk parity became a popular investment model afterthe global financial crisis in 2008. However, risk parity has also been criticized becauseit focuses on managing risk concentration rather than portfolio performance, and istherefore seen as being closer to passive management than active management. Inthis article, we show how to introduce assumptions of expected returns into risk parityportfolios. To do this, we consider a generalized risk measure that takes into accountboth the portfolio return and volatility. However, the trade-off between performanceand volatility contributions creates some difficulty, while the risk budgeting problemmust be clearly defined. After deriving the theoretical properties of such risk budgetingportfolios, we apply this new model to asset allocation. First, we consider long-terminvestment policy and the determination of strategic asset allocation. We then considerdynamic allocation and show how to build risk parity funds that depend on expectedreturns.
Keywords: Risk parity, risk budgeting, expected returns, ERC portfolio, value-at-risk,expected shortfall, active management, tactical asset allocation, strategic asset allocation.
JEL classification: G11.
1 IntroductionAlthough portfolio management did not change much in the 40 years following the seminalworks of Markowitz and Sharpe, the development of risk budgeting techniques marked animportant milestone in the deepening of the relationship between risk and asset management.Risk parity subsequently became a popular financial model for investment after the globalfinancial crisis in 2008. Today, pension funds and institutional investors are using this
∗I would like to thank Andrew Butler, Lionel Martellini, Vincent Milhau and Guillaume Weisang fortheir helpful comments.
1

Introducing Expected Returns into Risk Parity Portfolios
approach in the development of smart beta and the redefinition of long-term investmentpolicies (Roncalli, 2013).
In a risk budgeting (RB) portfolio, ex-ante risk contributions are equal to some givenrisk budgets. Generally, allocation is carried out by taking a volatility risk measure into ac-count. It simplifies the computation, especially when a large number of assets are involved.However, the volatility risk measure has been criticized because it assumes that asset re-turns are normally distributed (Boudt et al., 2013). There are now different approaches toextending the risk budgeting method by considering non-normal asset returns. However, inour view, these extensions do not generally produce better results and present a number ofcomputational problems when implemented for large asset universes.
A more interesting extension is the introduction of expected returns into the risk bud-geting approach. Risk parity is generally presented as an allocation method unrelated tothe Markowitz approach. Most of the time, these are opposed, because risk parity doesnot depend on expected returns. This is the strength of such an approach. In particular,with an equal risk contribution (ERC) portfolio, the risk budgets are the same for all as-sets (Maillard et al., 2010). This may be interpreted as a neutral portfolio applied whenthe portfolio manager has no convictions. However, the risk parity approach has also beenstrongly criticized, because some investment professionals consider this aspect a weakness,with some active managers having subsequently reintroduced expected returns in an ad hocmanner. For instance, they modify the weights of the risk parity portfolio in a second stepby applying the Black-Litterman model or optimizing the tracking error. A second solutionconsists in linking risk budgets to expected returns. In this paper, we propose a third routeconsidering a generalized standard deviation-based risk measure, which encompasses theGaussian value-at-risk and expected shortfall risk measures. It is often forgotten that theserisk measures depend on the vector of expected returns. In this case, the risk contribution ofan asset has two components: a performance contribution and a volatility contribution. Apositive view on one asset will reduce its risk contribution and increase its allocation. How-ever, unlike in the mean-variance framework, the RB portfolio obtained remains relativelydiversified.
The introduction of expected returns into risk parity portfolios is particularly relevant instrategic asset allocation (SAA). SAA is the central component of a long-term investmentpolicy. It relates to the portfolio of equities, bonds and alternative assets that the investorwishes to hold over a long period (typically 10 to 30 years). Risk parity portfolios based onthe volatility risk measure define well-diversified strategic portfolios. The use of a standarddeviation-based risk measure allows the risk premiums of the different asset classes to betaken into account. Risk parity may also be relevant in tactical asset allocation (TAA), whereit may be viewed as an alternative method to the Black-Litterman model. Active managersmay then naturally incorporate their bets into the RB portfolio and continue to benefitfrom the diversification. This framework has already been used by Martellini et al. (2014)to understand the behavior of risk parity funds with respect to economic environments. Inparticular, they show how to improve a risk parity strategy against a backdrop of interestrate rises.
This article is organized as follows. In section two, we introduce the theoretical frame-work, showing in particular how the objective function of mean-variance optimization asa risk measure can be interpreted. We then move on to define the risk contribution anddescribe how it relates to performance and volatility contributions. In section three, weexplain the specification of the risk budgeting portfolio, demonstrating that the problem ismore complex than for the volatility risk measure and has a unique solution under some re-strictions. Examples are provided in the fourth section, in which we apply the RB approach
2

Introducing Expected Returns into Risk Parity Portfolios
to strategic asset allocation. We also compare RB portfolios with optimized portfolios inthe case of tactical asset allocation. Section five offers some concluding remarks.
2 The framework2.1 Combining performance allocation and risk allocationWe consider a universe of n risky assets. Let µ and Σ be the vector of expected returnsand the covariance matrix of asset returns. We have Σi,j = ρi,jσiσj where σi is the volatil-ity of asset i and ρi,j is the correlation between asset i and asset j. The mean-varianceoptimization (MVO) model is the traditional method for optimizing performance and risk(Markowitz, 1952). This is generally achived by considering the following quadratic pro-gramming problem:
x? (γ) = arg min 12x>Σx− γx> (µ− r1)
where x is the vector of portfolio weights, γ is a parameter to control the investor’s riskaversion and r is the return of the risk-free asset. Sometimes restrictions are imposed toreflect the constraints of the investor, for instance, we could impose 1>x = 1 and x ≥ 0 for along-only portfolio. This framework is particularly appealing because the objective functionhas a concrete financial interpretation in terms of utility functions, with the investor facinga trade-off between risk and performance. To obtain a better expected return, the investormust then choose a riskier portfolio.
However, the mean-variance framework has been hotly debated for some time (Michaud,1989) and the stability of the MVO allocation is an open issue, even if some methods canregularize the optimized portfolio (Ledoit and Wolf, 2004; DeMiguel et al., 2009). Theproblem is that the Markowitz optimization is a very aggressive model of active manage-ment, detecting arbitrage opportunities that are sometimes false and may result from noisedata. The model then transforms these arbitrage opportunities into investment bets in anoptimistic way without considering adverse scenarios. This problem is particularly relevantwhen the input parameters are historical estimates. In this case, the Markowitz optimizationis equivalent to optimizing the in-the-sample backtest.
Despite the above drawback, the Markowitz model remains an excellent tool for combin-ing performance allocation and risk allocation. Moreover, as noted by Roncalli (2013), “thereare no other serious and powerful models to take into account return forecasts”. The onlyother model that is extensively used in active management is the Black-Litterman model,but this may in fact be viewed as an extension of the Markowitz model. In both cases, thetrade-off between return and risk is highlighted. Let µ (x) = x>µ and σ (x) =
√x>Σx be
the expected return and the volatility of portfolio x. We also note π (x) = µ (x)− r its riskpremium. It is obvious that the optimization problem can also be formulated as follows1:
x? (c) = arg min−π (x) + c · σ (x)
Remark 1 The Markowitz optimization problem can be interpreted as a risk minimizationproblem:
x? (c) = arg minR (x)where R (x) is the risk measure defined as follows:
R (x) = −π (x) + c · σ (x)1The mapping between the solutions x? (γ) and x? (c) is given by the relationship: c = γ−1σ (x? (γ)).
3

Introducing Expected Returns into Risk Parity Portfolios
Notably, the Markowitz model is therefore equivalent to minimizing a risk measure thatencompasses both the performance dimension and the risk dimension.
2.2 Interpretation of the Markowitz risk measureThe above analysis suggests that we can use the Markowitz risk measure in a risk paritymodel taking expected returns into account. Let L (x) be the portfolio excess loss. We haveL (x) = −x> (R− r) where R is the random vector of returns. We consider the generalizedstandard deviation-based risk measure:
R (x) = E [L (x)] + c · σ (L (x))= − (µ (x)− r) + c · σ (x)
Assuming that asset returns are normally distributed: R ∼ N (µ,Σ), we have µ (x) = x>µ
and σ (x) =√x>Σx. Let π be the vector of risk premiums2. It follows that:
R (x) = −x>π + c ·√x>Σx
The result is the Markowitz risk measure. This formulation encompasses two well-knownrisk measures:
• Gaussian value-at-risk:
VaRα (x) = −x>π + Φ−1 (α)√x>Σx
In this case, the scaling factor c is equal to Φ−1 (α).
• Gaussian expected shortfall:
ESα (x) = −x>π +√x>Σx
(1− α) φ(Φ−1 (α)
)Like the value-at-risk measure, this is a standard deviation-based risk measure wherethe scaling factor c is equal to φ
(Φ−1 (α)
)/ (1− α).
We can deduce that the expression of the marginal risk is:
MRi = −πi + c(Σx)i√x>Σx
This means that:
RCi = xi ·(−πi + c
(Σx)i√x>Σx
)= −xiπi + c
xi · (Σx)i√x>Σx
This confirms that the standard deviation-based risk measure satisfies the Euler decompo-sition:
R (x) =n∑i=1RCi
This implies that it is a good option for a risk budgeting approach.2We have πi = µi − r.
4
Introducing Expected Returns into Risk Parity Portfolios
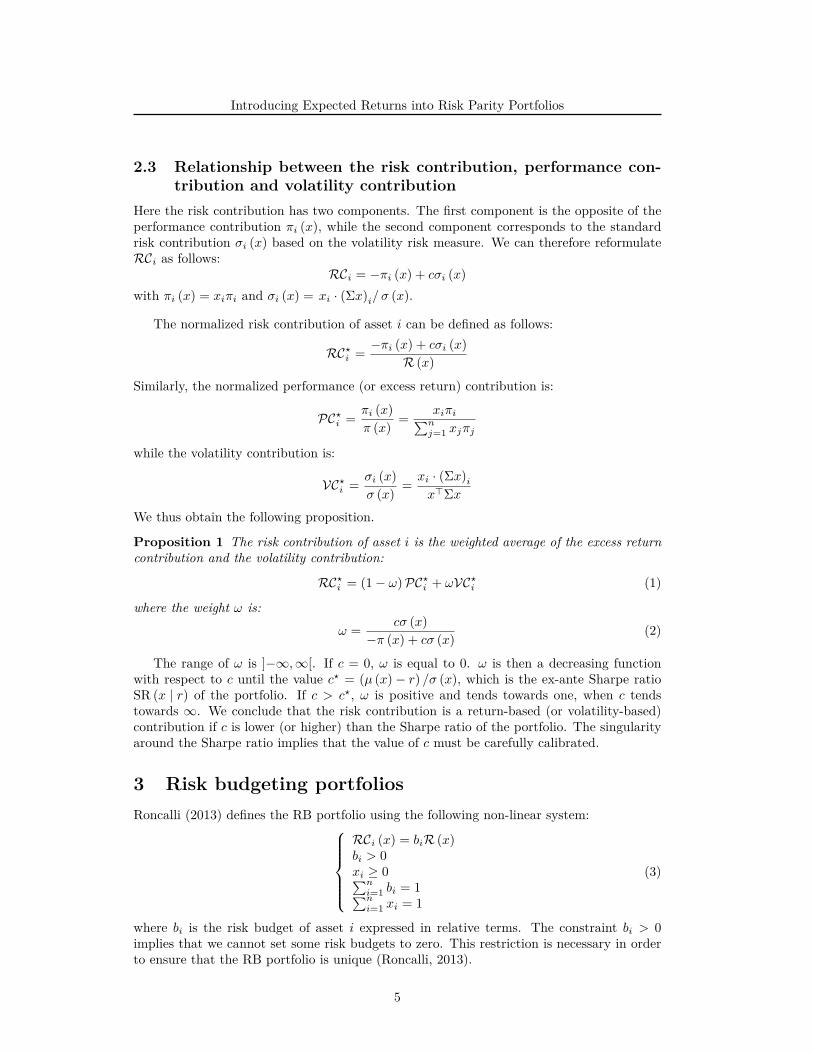
2.3 Relationship between the risk contribution, performance con-tribution and volatility contribution
Here the risk contribution has two components. The first component is the opposite of theperformance contribution πi (x), while the second component corresponds to the standardrisk contribution σi (x) based on the volatility risk measure. We can therefore reformulateRCi as follows:
RCi = −πi (x) + cσi (x)with πi (x) = xiπi and σi (x) = xi · (Σx)i/σ (x).
The normalized risk contribution of asset i can be defined as follows:
RC?i = −πi (x) + cσi (x)R (x)
Similarly, the normalized performance (or excess return) contribution is:
PC?i = πi (x)π (x) = xiπi∑n
j=1 xjπj
while the volatility contribution is:
VC?i = σi (x)σ (x) =
xi · (Σx)ix>Σx
We thus obtain the following proposition.
Proposition 1 The risk contribution of asset i is the weighted average of the excess returncontribution and the volatility contribution:
RC?i = (1− ω)PC?i + ωVC?i (1)
where the weight ω is:ω = cσ (x)
−π (x) + cσ (x) (2)
The range of ω is ]−∞,∞[. If c = 0, ω is equal to 0. ω is then a decreasing functionwith respect to c until the value c? = (µ (x)− r) /σ (x), which is the ex-ante Sharpe ratioSR (x | r) of the portfolio. If c > c?, ω is positive and tends towards one, when c tendstowards ∞. We conclude that the risk contribution is a return-based (or volatility-based)contribution if c is lower (or higher) than the Sharpe ratio of the portfolio. The singularityaround the Sharpe ratio implies that the value of c must be carefully calibrated.
3 Risk budgeting portfoliosRoncalli (2013) defines the RB portfolio using the following non-linear system:
RCi (x) = biR (x)bi > 0xi ≥ 0∑ni=1 bi = 1∑ni=1 xi = 1
(3)
where bi is the risk budget of asset i expressed in relative terms. The constraint bi > 0implies that we cannot set some risk budgets to zero. This restriction is necessary in orderto ensure that the RB portfolio is unique (Roncalli, 2013).
5

Introducing Expected Returns into Risk Parity Portfolios
3.1 Existence and uniqueness of the RB portfolioWhen using a standard deviation-based risk measure, we have to impose a second restrictionin order to ensure the existence of the RB portfolio:
R (x) ≥ 0 (4)
If {0} ∈ ImR (x), it implies that the risk measure can take both positive and negativevalues. We then face a singularity problem, meaning that there may be no solution to thesystem (3). The restriction (4) is equivalent to requiring the scaling factor c to be largerthan the bound c? defined as follows:
c? = SR+
= max(
supx∈[0,1]n
SR (x | r) , 0)
3.1.1 The case c > SR+
Theorem 1 If c > SR+, the RB portfolio exists and is unique. It is the solution of thefollowing optimization program:
x? (κ) = arg minR (x) (5)
u.c.
∑ni=1 bi ln xi ≥ κ
1>x = 1x ≥ 0
where κ is a constant to be determined.
We will now consider a slight modification to the optimization program (5):
y? = arg minR (y) (6)
u.c.{ ∑n
i=1 bi ln yi ≥ κy ≥ 0
with κ as an arbitrary constant. Following Roncalli (2013), the optimal solution satisfiesthe first-order conditions:
yi∂R (y)∂ yi
= λbi
where λ is the Lagrange coefficient associated with the constraint∑ni=1 bi ln yi ≥ κ. As we
have a standard optimization problem (minimization of a convex function subject to convexbounds), it can be deduced that:
(i) The solution to the problem (6) exists and is unique if the objective function R (y) isbounded from below.
(ii) The solution to the problem (6) may not exist if the objective function R (y) is notbounded from below.
For the volatility risk measure, we have R (y) ≥ 0, meaning that the solution always ex-ists (case i). The existence of a solution is more complex when we consider the standarddeviation-based risk measure. Indeed, we may have:
limy→∞
R (y) = −∞
6

Introducing Expected Returns into Risk Parity Portfolios
because the expected return component may be negative and may not be offset by thevolatility component. In this instance, the solution may not exist (case ii). However, if werequire that c > SR+, we obtain case i becauseR (y) ≥ 0. More generally, the solution existsif there is a constant R− such that R (y) > R−. In this case, the RB portfolio correspondsto the normalized optimal portfolio y?. We can therefore deduce that there is a constant κsuch that the RB portfolio is the only solution to the problem (5).
We now understand why restriction R (x) ≥ 0 is important for defining the RB portfolio.Indeed, a coherent convex risk measure satisfies the homogeneity property:
R (λx) = λR (x)
where λ is a positive scalar. Suppose that there is a portfolio x ∈ [0, 1]n such that R (x) < 0.We can then leverage the portfolio by a scaling factor λ > 1, and we obtainR (λx) < R (x) <0. It follows that:
limλ→∞
R (λx) = −∞
This is why it is necessary for the risk measure to always be positive.
There is an issue with Theorem 1, however, as we have to calculate the upper boundSR+. To do this, we can explore all the portfolios in set [0, 1]n and calculate the supremumof the Sharpe ratios. This approach may be time-consuming, in particular when the assetuniverse is large. It is better to use the following result:
Theorem 2 Let xmr be the minimum risk long-only portfolio defined as follows:
xmr = arg minR (x)
u.c.{
1>x = 1x ≥ 0
The RB portfolio exists and is unique if R (xmr) > 0.
3.1.2 The case c ≤ SR+
This case is not relevant from a financial point of view, because the risk measure of someportfolios may be negative. By leveraging these portfolios, the risk measure may be infinitelynegative. From a mathematical point of view, we can however show these results:
• Make SR− equal to max(infx∈[0,1]n SR (x | r) , 0
). If c < SR−, the RB portfolio exists
and is unique.
• If c ∈[SR−,SR+], the RB portfolio may not exist.
Example 1 We consider four assets. Their volatilities are equal to 15%, 20%, 25% and30% while the correlation matrix of asset returns is provided by the following matrix:
C =
1.000.10 1.000.40 0.70 1.000.50 0.40 0.80 1.00
7

Introducing Expected Returns into Risk Parity Portfolios
We will calculate the ERC portfolio by considering different values for the scaling factor.The results are reported in Table 1. If the risk premium of each asset is set to 7%, themaximum Sharpe ratio is equal to 0.56. In this case, the ERC portfolio does not exist if c isequal to 0.40. However, there is a solution if c is equal to 1.00, 1.65 or 2.33. If we considerhigher risk premiums (πi = 25%), the bounds become SR− = 0.83 and SR+ = 1.99. Wecan confirm that there is a solution if c is equal to 0.40 or 2.33. Curiously, there is also asolution if c is equal to 1.00, but not if c is equal to 1.65.
Table 1: ERC portfolios for different values of c
πi = 7% πi = 25%c 0.40 1.00 Φ−1 (0.95) Φ−1 (0.99) 0.40 1.00 Φ−1 (0.95) Φ−1 (0.99)
SR− = 0.23 / SR+ = 0.56 SR− = 0.83 / SR+ = 1.991 47.71 43.54 42.06 19.78 0.09 56.822 28.40 28.18 28.11 21.89 0.16 29.753 12.83 15.05 15.82 27.63 94.41 7.344 11.06 13.23 14.01 30.70 5.34 6.08
3.2 Comparing WB and RB portfoliosLet {b1, . . . , bb} be a vector of budgets. In a weight budgeting portfolio, the weight of asseti is equal to its budget bi. In a risk budgeting portfolio, it is the risk contribution of asset ithat is equal to its budget bi. Roncalli (2013) shows that the following inequalities hold:
R (xmr) ≤ R (xrb) ≤ R (xwb)
where xmr is the (long-only) minimum risk portfolio, xrb is the risk budgeting portfolio andxwb is the weight budgeting portfolio.
This result is important because it implies that the RB portfolio is located between thesetwo portfolios. It has a lower risk than the WB portfolio and remains more diversified thanthe MR portfolio.
3.3 Comparing MVO and RB portfoliosBy using the generalized risk measure instead of volatility, RB portfolios can be interpretedas MVO portfolios subject to a diversification constraint (see Figure 1). It is thereforetempting to view a risk parity portfolio as a diversified mean-variance portfolio, whichimplicitly corresponds to a shrinkage approach of the covariance matrix (Jagannathan andMa, 2003). The issue is then whether these RB portfolios are simply a reformulation of MVOportfolio with regularization? This is in fact not the case, as the expected returns do nothave a return dimension, but rather a risk dimension in the risk budgeting framework. Theytherefore constitute directional risks, which have to be managed. This is very different tothe mean-variance approach, which considers expected returns as one of the two dimensionsof the risk/return trade-off. This difference can be demonstrated by considering the stabilityissue of these two approaches.
Example 2 We consider a universe of three assets. The risk premiums are π1 = π2 = 8%and π3 = 5% respectively. The volatilities are σ1 = 20%, σ2 = 21% and σ3 = 10%.Moreover, we assume that the cross-correlations are the same: ρi,j = ρ = 80%.
8

Introducing Expected Returns into Risk Parity Portfolios
Figure 1: Comparing MVO and RB portfolios
Volatility risk measure
x? (κ) = arg min 12x>Σx
u.c.
∑ni=1 bi ln xi ≥ κ
1>x = 1x ≥ 0
The RB portfolio is a minimum varianceportfolio subject to a constraint of weightdiversification.
Generalized risk measure
x? (κ) = arg min−x>µ+ c ·√x>Σx
u.c.
∑ni=1 bi ln xi ≥ κ
1>x = 1x ≥ 0
The RB portfolio is a mean-variance port-folio subject to a constraint of weight di-versification.
Portfolio managers using the risk budgeting approach are motivated to obtain a diver-sified portfolio that changes in line with market conditions, but remains relatively stableover time. In Example 2, we calculate the long-only MVO portfolio by targeting a volatilityof 15%. The solution is (38.3%, 20.2%, 41.5%). We will now change the input parametersslightly, and provide the results in Table 2. For instance, if the volatility of the second assetis 18% instead of 21%, the solution becomes (13.7%, 56.1%, 30.2%) and we can then see asubstantial decrease in the weight of the first asset. This confirms that the MVO portfolio ishighly sensitive to input parameters. We shall then consider the RB portfolios by targetingthe risk budgets (50.0%, 26.4%, 23.6%), which correspond to the risk contributions of theinitial MVO portfolio. Of course, the RB and MVO portfolios coincide if we use the originalvalues of the parameters. If the volatility of the second asset is 18% instead of 21%, theRB solution becomes (36.7%, 23.5%, 39.7%). In this case, the RB portfolio is very differentto the MVO portfolio. In fact, we observe that RB portfolios are more stable, even if wechange the expected returns. This stability is important and explains why risk budgetingproduces lower turnover than mean-variance optimization.
Table 2: Sensitivity of MVO and RB portfolios to input parameters
ρ 70% 90% 90%σ2 18% 18%π1 20% −10%
x1 38.3% 38.3% 44.6% 13.7% 0.0% 56.4% 0.0%MVO x2 20.2% 25.9% 8.9% 56.1% 65.8% 0.0% 51.7%
x3 41.5% 35.8% 46.5% 30.2% 34.2% 43.6% 48.3%x1 38.3% 37.5% 39.2% 36.7% 37.5% 49.1% 28.8%
RB x2 20.2% 20.4% 20.0% 23.5% 23.3% 16.6% 23.3%x3 41.5% 42.1% 40.8% 39.7% 39.1% 34.2% 47.9%
3.4 Numerical algorithm to find the RB portfolioThere have been a number of studies into the most efficient way to numerically solve theRB portfolio (Chaves et al., 2012; Spinu, 2013; Griveau-Billion et al., 2014). In this article,we propose using the cyclical coordinate descent (or CCD) algorithm developed by Tseng
9
Introducing Expected Returns into Risk Parity Portfolios
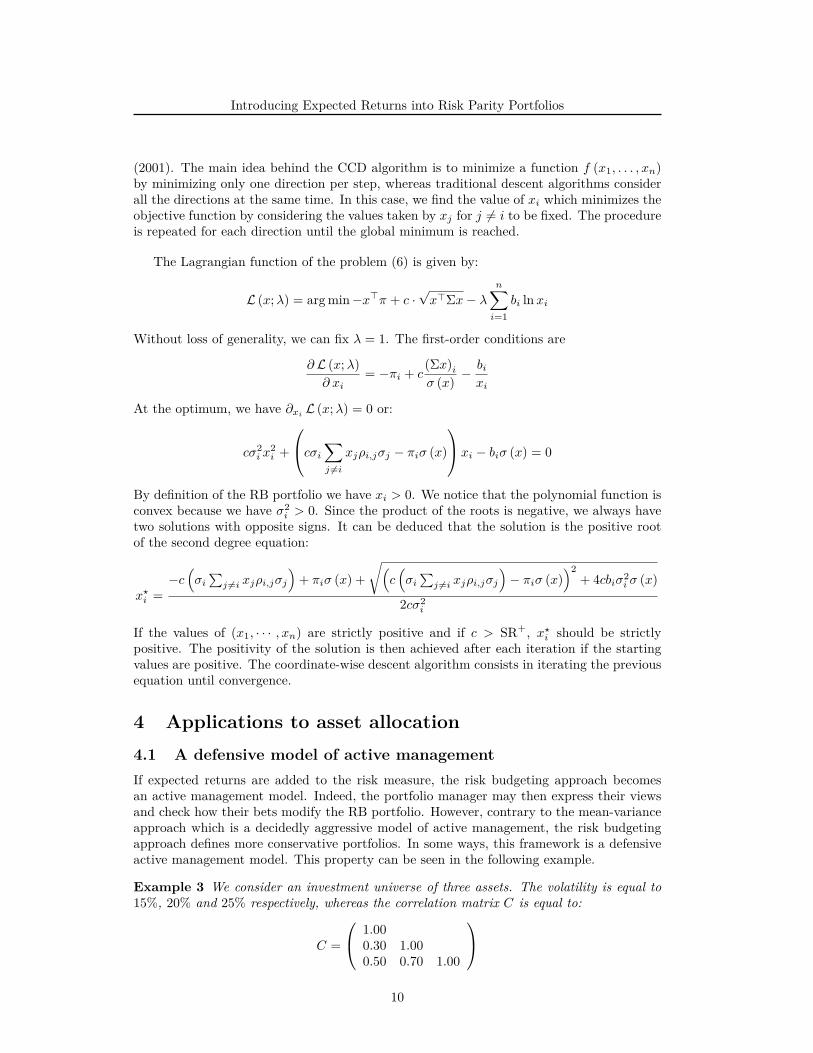
(2001). The main idea behind the CCD algorithm is to minimize a function f (x1, . . . , xn)by minimizing only one direction per step, whereas traditional descent algorithms considerall the directions at the same time. In this case, we find the value of xi which minimizes theobjective function by considering the values taken by xj for j 6= i to be fixed. The procedureis repeated for each direction until the global minimum is reached.
The Lagrangian function of the problem (6) is given by:
L (x;λ) = arg min−x>π + c ·√x>Σx− λ
n∑i=1
bi ln xi
Without loss of generality, we can fix λ = 1. The first-order conditions are
∂ L (x;λ)∂ xi
= −πi + c(Σx)iσ (x) −
bixi
At the optimum, we have ∂xiL (x;λ) = 0 or:
cσ2i x
2i +
cσi∑j 6=i
xjρi,jσj − πiσ (x)
xi − biσ (x) = 0
By definition of the RB portfolio we have xi > 0. We notice that the polynomial function isconvex because we have σ2
i > 0. Since the product of the roots is negative, we always havetwo solutions with opposite signs. It can be deduced that the solution is the positive rootof the second degree equation:
x?i =−c(σi∑j 6=i xjρi,jσj
)+ πiσ (x) +
√(c(σi∑j 6=i xjρi,jσj
)− πiσ (x)
)2+ 4cbiσ2
i σ (x)
2cσ2i
If the values of (x1, · · · , xn) are strictly positive and if c > SR+, x?i should be strictlypositive. The positivity of the solution is then achieved after each iteration if the startingvalues are positive. The coordinate-wise descent algorithm consists in iterating the previousequation until convergence.
4 Applications to asset allocation4.1 A defensive model of active managementIf expected returns are added to the risk measure, the risk budgeting approach becomesan active management model. Indeed, the portfolio manager may then express their viewsand check how their bets modify the RB portfolio. However, contrary to the mean-varianceapproach which is a decidedly aggressive model of active management, the risk budgetingapproach defines more conservative portfolios. In some ways, this framework is a defensiveactive management model. This property can be seen in the following example.
Example 3 We consider an investment universe of three assets. The volatility is equal to15%, 20% and 25% respectively, whereas the correlation matrix C is equal to:
C =
1.000.30 1.000.50 0.70 1.00
10

Introducing Expected Returns into Risk Parity Portfolios
We also define six parameter sets of risk premia:
Set #1 #2 #3 #4 #5 #6π1 0% 0% 20% 0% 0% 25%π2 0% 10% 10% −20% 30% 25%π3 0% 20% 0% −20% −30% −30%
Table 3 shows the optimized portfolios if we use the standard deviation-based risk mea-sure and a scaling factor c of 2. For the risk budgeting portfolio, it is assumed that the riskbudgets are the same for all three assets, meaning that we actually obtain an ERC portfo-lio. We then move on to consider two optimized mean-variance portfolios: the long/shortportfolio (or L-S MVO) and the long-only portfolio (or L-O MVO). Detailed results arepresented in Tables 6, 7 and 8 in Appendix B. For the MVO portfolios, risk aversion γ iscalibrated in order to obtain the volatility of the corresponding ERC portfolio. For instance,the volatility of the three optimized portfolios (ERC, L-S MVO and L-O MVO) is the samefor the parameter set #2 and is equal to 16.22%.
Table 3: Optimized portfolios
Set #1 #2 #3 #4 #5 #6x1 45.25 37.03 64.58 53.30 29.66 66.50
ERC x2 31.65 33.11 24.43 26.01 63.11 31.91x3 23.10 29.86 10.98 20.69 7.24 1.59x1 76.00 36.98 96.69 111.53 74.00 82.95
L-S MVO x2 43.11 33.20 48.36 23.70 94.41 57.13x3 −19.11 29.81 −45.05 −35.23 −68.42 −40.07x1 69.66 36.98 88.03 98.76 29.43 69.66
L-O MVO x2 30.34 33.20 11.97 1.24 70.57 30.34x3 0.00 29.81 0.00 0.00 0.00 0.00
Applying parameter set #1, we obtain the traditional ERC portfolio based on the volatil-ity risk measure. Indeed, all the risk premiums πi are equal to zero, implying that the riskcontributions RC?i are exactly equal to the volatility contribution VC?i . For the mean-variance approach, the optimal portfolio is the minimum variance portfolio because theexpected returns are equal to zero. We can therefore see several major differences betweenthe RB portfolio and the MVO portfolios. If we move on to apply parameter set #2, thedifferences are minimal because the risk premiums are in line with volatilities3. In the threeother cases (#3, #4 and #5), the ERC portfolio differs from the MVO portfolios signifi-cantly. This result can be explained by the fact that the expected returns are not rankedin the same order as the volatilities. In the last case #6, the ERC portfolio is very similarto the L-O MVO portfolio because the third asset has a strong negative risk premium4 andthe risk premiums of the first two assets are in line with the volatilities.
The above numerical results demonstrate that the RB portfolio is less aggressive thanthe MVO portfolio, and that the MVO portfolio is more concentrated than the RB portfolio.The framework presented in this article is therefore an interesting alternative to the mean-variance framework when portfolio managers want active management without concentratingtheir portfolios on a small number of bets.
3In Appendix A, we show that the ERC portfolio is optimal under some conditions. In fact, the parameterset #2 is not so far to verify these conditions.
4In this case, it represents a low weight for the ERC portfolio whereas it is not selected by the L-O MVOportfolio.
11

Introducing Expected Returns into Risk Parity Portfolios
4.2 Strategic asset allocation
We shall now consider the example given on page 287 in Roncalli (2013). The invest-ment universe is composed of seven asset classes covering bonds, equities and commodities.Appendix C shows the values of the input parameters (expected return, volatility and cross-correlation) necessary to define a strategic asset allocation. Below we compare the RB andMVO approaches. The RB portfolio is defined using the following risk budgets: 20%, 10%,15%, 20%, 10%, 15% and 10%. Concerning MVO portfolios, the objective function is totarget an ex-ante volatility of 4.75% or 5%.
The results when the risk-free rate is equal to 3% are provided in Table 4. If c =∞, weget the RB portfolio based on the volatility risk measure. In this case, volatility contributionsare exactly equal to the risk budgets. In order to take the expected returns into account,we consider the RB portfolio with c 6= ∞. For instance, if c = 1.5, we overweight bondsoverall and underweight equities. We can compare the allocation of the RB portfolio withthose of MVO portfolios when we target a volatility σ?. MVO portfolios visibly improvethe Sharpe ratio, but are more concentrated than the RB portfolios, both in weighting (USBonds 10Y) and in risk (EM Equities). Therefore, even if the breakdown between bonds,equities and commodities is similar for RB and MVO portfolios, the RB allocation is clearlymore appropriate for a strategic asset allocation as it is more diversified within each assetclass.
Table 4: Long-term strategic portfolios with r = 3%
RB MVOc =∞ c = 3 c = 1.5 σ? = 4.75% σ? = 5%xi VC?i xi VC?i xi VC?i xi VC?i xi VC?i
(1) 36.8 20.0 36.9 19.3 37.2 18.6 60.5 38.1 64.3 34.6(2) 21.8 10.0 21.2 9.3 20.5 8.5 14.0 7.4 7.6 3.2(3) 14.7 15.0 14.5 14.5 14.0 13.8 0.0 0.0 0.0 0.0(4) 10.2 20.0 10.4 20.7 10.7 21.4 5.2 10.0 5.5 10.8(5) 5.5 10.0 5.6 10.3 5.7 10.5 5.2 9.2 5.5 9.8(6) 7.0 15.0 7.5 16.3 8.2 18.1 14.2 33.7 16.0 39.5(7) 3.9 10.0 3.9 9.7 3.8 9.2 1.0 1.7 1.1 2.1µ (x) 5.69 5.73 5.79 5.64 5.83σ (x) 5.03 5.08 5.14 4.75 5.00
SR (x | r) 0.53 0.54 0.54 0.56 0.57
In Figure 2, all these portfolios are located in the mean-variance (MV) and risk budgeting(RB) efficient frontiers5. We also report efficient frontiers when the risk-free rate is equal to0% and 4%. Depending on the level of this parameter, the Sharpe ratio of the RB portfoliois either a decreasing or an increasing function of the scaling factor c. The RB efficientfrontier is more limited than the MV efficient frontier. For instance, it is not possible toobtain an ex-ante volatility lower than 5% when the risk-free rate is equal to 3%. Moreover,the RB efficient frontier depends on the specification of the risk budgets.
5The RB efficient frontier is obtained by considering c ∈]SR+,∞
[.
12

Introducing Expected Returns into Risk Parity Portfolios
Figure 2: Strategic asset allocation
4.3 Tactical asset allocationWhile strategic asset allocation refers to long-term investment horizons, tactical asset allo-cation deals with short to medium-term investment horizons. The aim is to define a dynamicallocation in order to modify the neutral portfolio and to enhance its performance. Trad-ing signals based on fundamental analysis, medium-term market sentiment, business cycleforecasts or momentum patterns may be developed to achieve this.
In a TAA model, the risk measure is no longer static. At time t, it becomes:
Rt (xt) = −x>t (µt − rt) + ct ·√x>t Σtxt (7)
In this framework, µt and Σt are time-varying statistics. The vector xt corresponds to theportfolio weights at time t and generally depends on the previous allocation xt−1. Let bbe the vector of risk budgets. The risk parity strategy then consists of computing the RBportfolio for each time t:
RCi,t (xt) = biRt (xt)
By imposing πt = µt − rt = 0, this framework is already used to design ‘simple’ risk parityequity/bond funds. Some portfolio managers also use this framework to define a neutralportfolio which is then modified according to their views. This construction of ‘active’ riskparity funds is similar to the TAA approach of Black and Litterman (1992). A more naturalapproach is to introduce expected returns into risk parity portfolios directly using Equation(7). However, an issue exists concerning the calibration of the scaling factor ct. Indeed,we have previously seen that it is not possible to rely on the scaling factor ct at a givenconfidence level α of the value-at-risk (or the expected shortfall) because the RB portfoliomay not exist. It is therefore better to define ct endogenously. For each time t, we compute
13

Introducing Expected Returns into Risk Parity Portfolios
the maximum Sharpe ratio SR+t . We must then define a rule such that ct is greater than
the lower bound SR+t .
Let us consider an application with equities and bonds6 for the period January 2000 –December 2011. The empirical covariance matrix is estimated using a lag window of 260trading days. To calculate the vector of expected returns, we will use a simple movingaverage based on the daily returns for the last 260 trading days. We will also assume thatthe portfolio is rebalanced every week and that the risk budgets are equal. We will use thesimple risk parity strategy7 RP #0 and two versions of the active risk parity strategy8 RP#1 and RP #2. Whereas the first RP fund is a pure risk parity strategy, the two otherfunds mix risk parity and trend-following strategies. Table 5 states different statistics9 forthe period January 2000 – December 2012. Our goal is not to say that active risk paritystrategies are better than simple risk parity strategies, but to show that they are different. Inthis example, the trend-following signals have been positive, meaning that the performance,the Sharpe ratio and the drawdown of the simple risk parity strategy have all been improved.By taking expected returns into account, the turnover has been multiplied by a factor of 10.This justifies the tactical (or active) nature of this allocation method.
Table 5: Statistics of simple and active risk parity strategies
RP µ̂1Y σ̂1Y SR MDD γ1 γ2 τ#0 5.10 7.30 0.35 −21.39 0.07 2.68 0.30#1 6.36 7.74 0.50 −14.97 0.04 2.76 3.00#2 7.40 8.00 0.61 −12.84 0.04 2.74 3.64
Remark 2 By considering a simple risk parity strategy, we implicitly assume that the riskis fully represented by the volatility. For instance, in the above example, the allocation is thesame in the first quarter of 2003 and in summer 2010. This implies that these two periodspresent the same patterns in terms of volatility risk. By taking expected returns into account,we assume that directional risk is another component for measuring overall risk. From thispoint of view, the two periods do not present the same patterns, as they differ in terms ofdirectional risks (trend, valuation, risk premium, etc.). Changes in market conditions areimportant to mitigate risk parity allocations, which are highly sensitive to bond risk eventhough the risk of interest rate rises is significant (Martellini et al., 2014).
5 ConclusionIn this article, we consider the risk budgeting approach when the risk measure depends onexpected returns, showing that the problem is more complex than when the risk measure isthe portfolio volatility because there is a trade-off between performance contributions and
6These correspond to the MSCI World TR Net index and the Citigroup WGBI All Maturities index.7RP #0 corresponds to the classical ERC portfolio by considering the portfolio volatility as the risk
measure.8In the case of RP #1, we have ct = max
(1.10 · SR+
t ,Φ−1 (95%))whereas the scaling factor is ct =
1.10 · SR+t ·1
{SR+
t > 0}
+∞ · 1{
SR+t ≤ 0
}in the case of RP #2
9µ̂1Y is the annualized performance, σ̂1Y is the yearly volatility and MDD is the maximum drawdownobserved for the entire period. These statistics are expressed in %. SR is the Sharpe ratio, τ is the portfolioturnover, whereas the skewness and excess kurtosis correspond to γ1 and γ2.
14

Introducing Expected Returns into Risk Parity Portfolios
volatility contributions. It appears that risk budgeting makes sense only when the scalingfactor is higher than a specific value.
This framework is of particular interest when building a strategic asset allocation. Thetraditional way to apply the risk budgeting approach to an SAA is to link the risk budgetsto risk premiums. With the new framework, risk premiums may be used to directly definethe risk contributions of the SAA portfolio. Another important application concerns tacticalasset allocations. To date, risk parity has been used to define a neutral portfolio that wasimproved using the Black-Litterman model. We can now incorporate expected returns intothe risk budgeting step, in some ways making it an active management strategy.
By introducing expected returns, we nonetheless face the risk of incorporating bad fore-casts or views, meaning that the robustness and simplicity of the original ERC portfoliohas been lost. In our view, the framework presented here would therefore be more suitablefor building risk parity portfolios with moderate bets than for creating very active tradingstrategies.
15

Introducing Expected Returns into Risk Parity Portfolios
References[1] Black F. and Litterman R.B. (1992), Global Portfolio Optimization, Financial An-
alysts Journal, 48(5), pp. 28-43.
[2] Boudt K., Carl P. and Peterson B. (2013), Asset allocation with Conditional Value-at-Risk Budgets, Journal of Risk, 15(3), pp. 39-68.
[3] Chaves D.B., Hsu J.C., Li F. and Shakernia O. (2012), Efficient Algorithms forComputing Risk Parity Portfolio Weights, Journal of Investing, 21(3), pp. 150-163.
[4] DeMiguel V., Garlappi L., Nogales F.J. and Uppal R. (2009), A GeneralizedApproach to Portfolio Optimization: Improving Performance by Constraining PortfolioNorms, Management Science, 55(5), pp. 798-812.
[5] Eychenne K., Martinetti S. and Roncalli T. (2011), Strategic Asset Allocation,SSRN, www.ssrn.com/abstract=2154021.
[6] Griveau-Billion T., Richard J-C. and Roncalli T. (2011), A Fast Algorithm forComputing High-Dimensional Risk Parity Portfolios, SSRN, www.ssrn.com/abstract=2325255.
[7] Jagannathan R. and Ma T. (2003), Risk Reduction in Large Portfolios: Why Impos-ing the Wrong Constraints Helps, Journal of Finance, 58(4), pp. 1651-1684.
[8] Ledoit O. and Wolf M. (2004), Honey, I Shrunk the Sample Covariance Matrix,Journal of Portfolio Management, 30(4), pp. 110-119.
[9] Maillard S., Roncalli T. and Teïletche J. (2010), The Properties of EquallyWeighted Risk Contribution Portfolios, Journal of Portfolio Management, 36(4), pp.60-70.
[10] Markowitz H. (1952), Portfolio Selection, Journal of Finance, 7(1), pp. 77-91.
[11] Martellini L., Milhau V. and Tarelli A. (2014), Towards Conditional Risk Parity– Improving Risk Budgeting Techniques in Changing Economic Environments, EDHECWorking Paper, April.
[12] Michaud R.O. (1989), The Markowitz Optimization Enigma: Is ‘Optimized’ Optimal?,Financial Analysts Journal, 45(1), pp. 31-42.
[13] Roncalli T. (2013), Introduction to Risk Parity and Budgeting, Chapman & Hall/CRCFinancial Mathematics Series.
[14] Spinu F. (2013), An Algorithm for the Computation of Risk Parity Weights, SSRN,www.ssrn.com/abstract=2297383.
[15] Tseng P. (2001), Convergence of a Block Coordinate Descent Method for Nondiffer-entiable Minimization, Journal of Optimization Theory and Applications, 109(3), pp.475-494.
16

Introducing Expected Returns into Risk Parity Portfolios
A Optimality of the ERC portfolio
Let us consider the ERC portfolio in the case of the volatility risk measure. If we assumea constant correlation matrix, Maillard et al. (2010) show that the optimal weights aregiven by xi ∝ σ−1
i . They also show that it is the tangency portfolio if all the assets havethe same Sharpe ratio: µi = r + s · σi. This implies that the volatility contributions areequal: VC?i = VC?j . Because xi ∝ σ−1
i and πi = s · σi, we can deduce that the performancecontributions are also equal: PC?i = PC?j . It follows that the composition of the ERCportfolio is the same for both the volatility and standard deviation-based risk measures.Finally, we can confirm that the result obtained by Maillard et al. (2010) remains valid inthe case of the standard deviation-based risk measure:
Theorem 3 The ERC portfolio is optimal if we assume a constant correlation matrix andthat all the assets have the same Sharpe ratio.
B Additional results of the active management example
The composition x of the optimized portfolios is provided in Tables 6, 7 and 8 for the dif-ferent sets of parameters. For each portfolio, we have also computed the normalized riskcontribution RC?i , the normalized volatility contribution VC?i and the normalized perfor-mance contribution PC?i . The parameter ω is defined by Equation (2) and measures theweight of the volatility contribution relative to the risk contribution. Finally, we show therisk premium π (x), the volatility σ (x) and the Sharpe ratio SR (x | r) of the optimizedportfolio x. All the statistics are expressed in %, except the parameter ω and the Sharperatio SR (x | r) which are measured in decimals.
Table 6: ERC portfolios
Set #1 #2 #3 #4 #5 #6x1 45.25 37.03 64.58 53.30 29.66 66.50x2 31.65 33.11 24.43 26.01 63.11 31.91x3 23.10 29.86 10.98 20.69 7.24 1.59RC?1 33.33 33.33 33.33 33.33 33.33 33.33RC?2 33.33 33.33 33.33 33.33 33.33 33.33RC?3 33.33 33.33 33.33 33.33 33.33 33.34VC?1 33.33 23.80 60.96 43.79 15.88 64.79VC?2 33.33 34.00 23.85 26.32 75.03 33.10VC?3 33.33 42.20 15.19 29.89 9.09 2.11PC?1 0.00 84.09 0.00 0.00 68.92PC?2 35.66 15.91 55.69 112.95 33.06PC?3 64.34 0.00 44.31 −12.95 −1.98ω 1.00 1.40 2.19 0.76 2.10 8.63
π (x) 0.00 9.28 15.36 −9.34 16.76 24.12σ (x) 15.35 16.22 14.11 14.89 16.00 13.64
SR (x | r) 0.00 0.57 1.09 −0.63 1.05 1.77
17

Introducing Expected Returns into Risk Parity Portfolios
Table 7: Long/short MVO portfolios
Set #1 #2 #3 #4 #5 #6x1 76.00 36.98 96.69 111.53 74.00 82.95x2 43.11 33.20 48.36 23.70 94.41 57.13x3 −19.11 29.81 −45.05 −35.23 −68.42 −40.07RC?1 76.00 33.27 120.37 112.45 −67.64 4.69RC?2 43.11 33.46 88.59 25.58 24.68 3.23RC?3 −19.11 33.27 −108.96 −38.03 142.96 92.08VC?1 76.00 23.75 85.78 103.74 35.60 72.61VC?2 43.11 34.12 29.84 7.68 75.51 50.01VC?3 −19.11 42.13 −15.62 −11.42 −11.11 −22.61PC?1 0.00 79.99 0.00 0.00 44.08PC?2 35.77 20.01 −205.47 57.98 30.36PC?3 64.23 0.00 305.47 42.02 25.56ω 1.00 1.40 6.98 1.08 −1.90 −1.38
π (x) 0.00 9.28 24.17 2.31 48.85 47.04σ (x) 13.19 16.22 14.11 14.89 16.00 13.64
SR (x | r) 0.00 0.57 1.71 0.15 3.05 3.45
Table 8: Long-only MVO portfolios
Set #1 #2 #3 #4 #5 #6x1 69.66 36.98 88.03 98.76 29.43 69.66x2 30.34 33.20 11.97 1.24 70.57 30.34x3 0.00 29.81 0.00 0.00 0.00 0.00RC?1 69.66 33.27 89.81 98.65 44.05 69.66RC?2 30.34 33.46 10.19 1.35 55.95 30.34RC?3 0.00 33.27 0.00 0.00 0.00 0.00VC?1 69.66 23.75 92.36 99.47 14.91 69.66VC?2 30.34 34.12 7.64 0.53 85.09 30.34VC?3 0.00 42.13 0.00 0.00 0.00 0.00PC?1 0.00 93.63 0.00 0.00 69.66PC?2 35.77 6.37 100.00 100.00 30.34PC?3 64.23 0.00 0.00 0.00 0.00ω 1.00 1.40 3.00 0.99 2.95 12.72
π (x) 0.00 9.28 18.80 −0.25 21.17 25.00σ (x) 13.57 16.22 14.11 14.89 16.00 13.57
SR (x | r) 0.00 0.57 1.33 −0.02 1.32 1.84
18

Introducing Expected Returns into Risk Parity Portfolios
C Input parameters of the SAA exampleWe shall now consider the example given on page 287 in Roncalli (2013). The investmentuniverse is composed of seven asset classes: US Bonds 10Y (1), EURO Bonds 10Y (2),Investment Grade Bonds (3), US Equities (4), Euro Equities (5), EM Equities (6) andCommodities (7). In Tables 9 and 10, we provide the long-run statistics used to computethe strategic asset allocation10. We have assumed that the long-term investor has decidedto define the strategic portfolio using the risk budgets bi provided in Table 9.
Table 9: Expected returns, volatility and risk budgets for the SAA approach (in %)
(1) (2) (3) (4) (5) (6) (7)µi 4.2 3.8 5.3 9.2 8.6 11.0 8.8σi 5.0 5.0 7.0 15.0 15.0 18.0 30.0bi 20.0 10.0 15.0 20.0 10.0 15.0 10.0
Table 10: Correlation matrix of asset returns for the SAA approach (in %)
(1) (2) (3) (4) (5) (6) (7)(1) 100(2) 80 100(3) 60 40 100(4) −10 −20 30 100(5) −20 −10 20 90 100(6) −20 −20 30 70 70 100(7) 0 0 10 20 20 30 100
10These figures are taken from Eychenne et al. (2011).
19