intra-industry trade in biofuels - home | food and … recent periods we have seen significant...
TRANSCRIPT

Intra-industry trade in biofuels How environmental legislation fuels resource use and GHG emissions Seth Meyer, Josef Schmidhuber and Jesús Barreiro-Hurlé
ESA Working paper No. 12-08
December 2012
Agricultural Development Economics Division
Food and Agriculture Organization of the United Nations
www.fao.org/economic/esa

1
Intra-industry trade in biofuels: how environmental legislation fuels resource use and GHG emissions
Seth Meyer, Josef Schmidhuber, Jesús Barreiro-Hurlé Economic and Social Development Department
Food and Agriculture Organization of the United Nations
Abstract
In recent periods we have seen significant volumes of intra-industry trade in ethanol between the United States of America and Brazil. A trend began which started in 2010 and accelerated in the second half of 2011, with large quantities of ethanol crossing paths in trade between the two countries. While two-way or intra-industry trade of homogenous products is not a new phenomenon, it is typically explained by factors such as seasonality or cross-border exchanges caused by transportation cost differentials. We find that none of the traditional market factors can explain the notable volumes of intra-industry trade in ethanol between the US and Brazil. Instead, this trade appears to be driven by differential and uncoordinated environmental policy that aims to capture differences in production methods of the underlying feedstocks and processing methods based on credence attributes of biofuels which may be unobservable by consumers. The conclusion is that environmental legislation is inducing the product differentiation that invites arbitrage between the two countries resulting in the two-way trade of an otherwise physically homogenous product; in so doing, additional fossil energy is consumed in the mutual exchange of ethanol along with the associated emissions of greenhouse gases (GHGs) and the policy costs to consumers are raised which may suppress demand further reducing the displacement of fossil fuels, both of which are in direct conflict with stated environmental objectives of many biofuel programmes.
The potential for intra-industry trade in biofuels is further expanded by evolving legislation within the European Union (EU). With tighter environmental constraints on biofuel production written into EU policy, the potential for competition for classes of renewable fuels increases and could extend its reach from bioethanol to include biodiesel and/or the underlying feedstocks (rapeseed and maize) in the EU, the US and Brazil. This would create additional opportunities for arbitrage among the three regions as a result of disparate policy differentiation of biofuel products. Finally, we submit options to mitigate this unintended consequence through the use of a “book and claim” system under which each country could continue to pursue its’ own policy objectives while acting in a coordinated fashion to reduce costs and GHG emissions.
Keywords: ethanol, biofuels, biofuel policy, mandates, trade
JEL CODES: F14 Q17 Q18 Q41 Q48 Q58

2
Introduction
The year 2010 introduced a new phenomenon into the global biofuels economy: the mutual exchange of bioethanol between Brazil and the United States of America – the most important producers, consumers and traders of ethanol – one produced primarily from sugarcane, the other primarily from maize, which is physically indistinguishable. Ethanol intra-industry trade, as the phenomenon is known by now, remained small in volume until the end of 2010 and therefore went unnoticed or was discarded as irrelevant in the global context. The large increases in ethanol intra-industry trade between the two countries seen during 2011, however, make it difficult to ignore the phenomenon. Here we pose the question regarding its underlying causes and the associated economic and environmental costs and assert that under current policies, intra-industry trade is likely to increase, and potentially, to unsustainable levels.
Trade theory and common reasons for intra-industry trade
The mutual exchange of industrial goods between two countries is neither a new phenomenon nor is there a gap or absence of efforts to explain such trade in the literature. For industrial goods it is known as intra-industry trade (IIT) and refers to the exchange of similar products belonging to the same industry where the same types of goods or services are both imported and exported. Arguments about the motivation of such trade include differential natural endowments, quality and capital intensity of production, economic specialization and economies of scale. While these approaches may help explain the exchange of differentiated manufactures such as cars or personal computers and even differentiated food and agricultural goods such as different types of fruit or beverages, they fail to explain the phenomenon at hand, i.e. the mutual exchange of homogeneous products such as ethanol, without considering additional factors.
Intra-industry trade in food and agriculture – common explanations
The trade literature also offers reasons for the exchange of non-differentiated agricultural products. In this section we expose these reasons and provide the evidence that discards them as drivers of the US–Brazil trade in ethanol since 2010.
Aggregation or classification issues in trade data: Trade flow classifications may simply not be fine enough to differentiate between what are in fact different products. With pure anhydrous ethyl alcohol (ethanol) measured at the HS-6 level (HS 382490) and in standard units adjusting for modest water content, the data do not hide heterogeneous good shipments, and thus the argument does not apply in this case.
Seasonality. Annual trade statistics may simply mask the common phenomenon that countries exchange sometimes large quantities of an otherwise homogenous product to accommodate off-season consumer needs and match deficits through an intra-year exchange of goods. Even more important and more common are trade flows that exploit seasonality between the hemispheres. If seasonality were a driver, trade flows would exhibit an off-season/on-season pattern during the year, thus compensating for country-related shortages and surpluses and taking advantage of storage costs in each country. Observed ethanol trade flows in recent quarters, however, suggests that intra-industry trade flows are rising and falling simultaneously or pro-cyclically rather than intermittent or

3
anti-cyclically (Figure 1), particularly if Brazilian exports to the US via Caribbean1 countries is included in these trade flows (Figure 1, second pane). The pro-cyclical nature of the ethanol trade cast doubt on an argument of seasonality.
Figure 1: Quarterly bilateral ethanol trade between Brazil and the United States 2010-2011, with and without exports through Caribbean countries
Source: Global Trade Information Services (GTIS)
Border trade. This phenomenon refers to the incidence of large countries sharing a long physical border, or lacking efficient internal transport channels between supply and demand regions, that may find it more profitable to exchange homogenous products across borders rather than within their own borders simply because cross-border trade implies lower transportation costs. Border trade does not appear to be an issue as Brazil and the United States do not share a common border and the costs of shipment of ethanol between the two countries are multiples of shipments between ethanol production and consumption centres within the United States.2 As classic reasons for ethanol intra-industry trade can be discarded, we pursue the idea that ethanol intra-industry trade is due to a non-differentiated attribute of ethanol3 that has its roots in the policy framework that characterizes the biofuel economy in the US and in Brazil: the GHG saving associated with its use as fuel substituting fossil fuels.
1 During this period, the US imposed a $0.54 per gallon tariff on ethanol that was waived for Caribbean nations. Much of the ethanol from the Caribbean had its origins in Brazil. 2 Unit train price from Southwest Iowa to the Los Angeles Basin in California stood at of $0.13 per gallon in 2007 (USDA, 2007). Transport costs from Brazil to the US stand at price of 0.18 Brazilian Reals per litre which, using an exchange rate of 2.15 Reals per dollar means approximately $0.32 per gallon (Crago et al., 2010) 3 In consumer demand literature we would be talking about a credence attribute that consumers cannot experience even after purchasing and consuming (Roosen et al., 2007).
0100200300400500600700
2010 2011
Q1 Q2 Q3 Q4 Q1 Q2 Q3 Q4
mill
ion
liter
s
US - Brazil/Caribbean ethanol trade
US to Brazil Brazil/Caribbean to US
0100200300400500600700
2010 2011
Q1 Q2 Q3 Q4 Q1 Q2 Q3 Q4
mill
ion
liter
s
US - Brazi ethanol trade
US to Brazil Brazil to US

4
Intra-industry trade as a policy-induced phenomenon of process differentiation
There is a complex discussion about the driving forces behind the various biofuel initiatives in the US and the industry’s path of growth. Stated objectives have been wide-ranging, from domestic energy production and self-sufficiency, to the desire to address global concerns such the reduction of GHGs to reasons that fall into the realm of pure agricultural and farm income support.
Ethanol subsidies in the United States at the federal level got their start in the Energy Tax Act of 1978 with ethanol’s exemption from the gasoline excise tax worth the equivalent of $0.40 per gallon (~$0.11 per litre) of ethanol, motivated by OPEC embargos of the time and a desire to reduce energy consumption and import dependence.4 In 1980 a $0.54 per gallon (~$0.14 per litre) duty on imported alcohol was imposed.5 The duty made no explicit distinction of the imported fuels production process or feedstock, but affected trade of ethanol, including ethanol from Brazil produced from sugarcane. Subsequent amendments to the Clean Air Act in 1990, and the expressed impact of motorfuel consumption on air quality, saw the beginning of a pivot in renewable fuels policy toward environmental concerns. In 2005, the Energy Policy Act (United States Public Law 109–58) added quantitative mandates of 4 million gallons of renewable fuel consumption per year in 2006 to 7.5 billion gallons (28.4 billion litres) of annual renewable fuel consumption by 2012 in addition to the blenders’ tax credits and import tariff. The ethanol industry was given a further boost as the fuel oxygenate MTBE (methyl tertiary butyl ether) was eliminated as a groundwater pollutant with ethanol becoming the de-facto replacement, substantially boosting demand and resulting in a rapid expansion of the industry through early 2007.
The Energy Policy Act of 2005 while setting quantitative blending mandates also began the practice of differentiating renewable fuels based on feedstocks or production practices, for example defining cellulosic biofuel and allowing 1 physical gallon of cellulosic biofuel to count as 2.5 gallons of renewable fuel toward meeting a quantitative mandate. The mandate system was further differentiated and expanded in the Energy Independence and Security Act of 2007 (EISA) (United States Public Law 110-140).
While there numerous reasons stated for the expansion of biofuel policy, the primary policy instrument that is currently applied in the US contains elements of environmental legislation and aims at fostering specific environmentally friendly, carbon-saving production processes. Essentially all biofuel classifications are determined by feedstocks and production process rather than the final product (Table 1). This differentiation creates the potential for differential pricing of the product arising from non-physical attributes and creates the opportunity for arbitrage with countries that may have different classification schemes or no classification schemes at all. Differently put, the biofuel policies that aim to affect production processes and induce environmentally friendly and carbon-saving processes have led to a differentiation at the product level that can induce exchanges of anhydrous ethanol, an otherwise physically homogenous good, in carbon-releasing and therefore environmentally unfriendly trade. In this process, transportation fuel is wasted in the name of resource-saving policies and transportation costs increase the final costs to consumers, further
4 The gasoline excise tax was $0.04 per gallon and when blended at a required 10 percent a credit of up to $0.40 per gallon of ethanol could be claimed. 5 Ethanol Import Tariff of 1980.
5
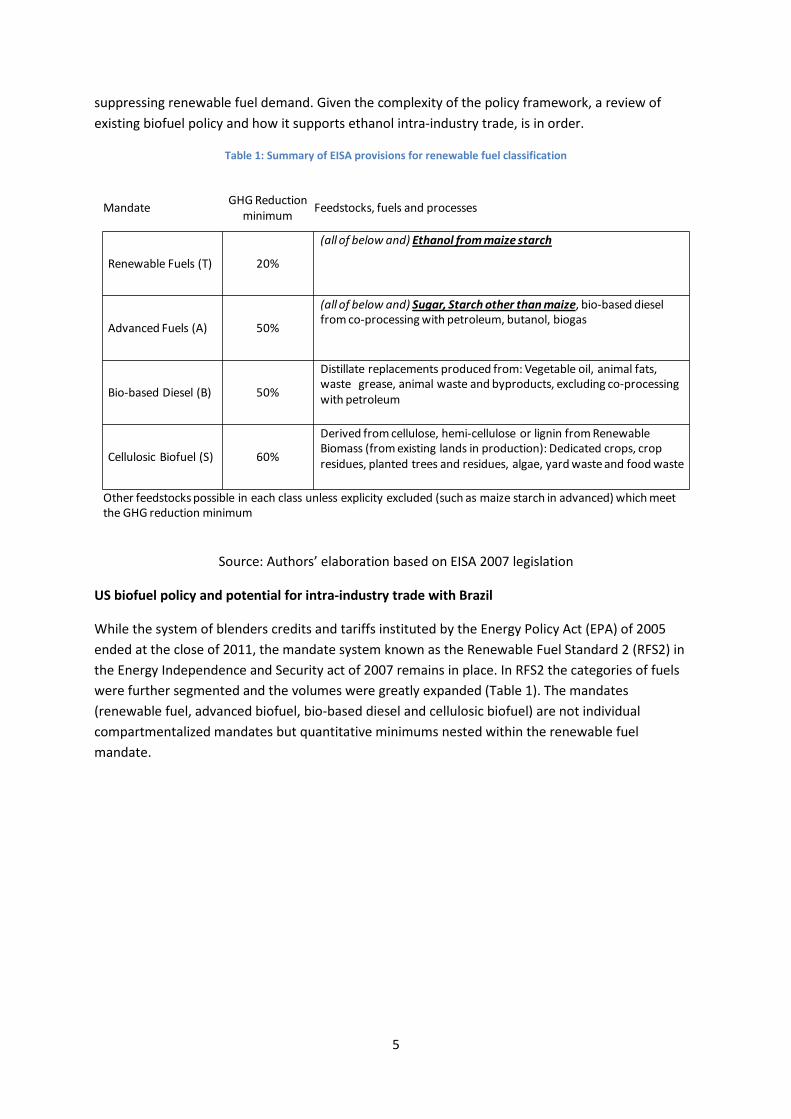
suppressing renewable fuel demand. Given the complexity of the policy framework, a review of existing biofuel policy and how it supports ethanol intra-industry trade, is in order.
Table 1: Summary of EISA provisions for renewable fuel classification
Source: Authors’ elaboration based on EISA 2007 legislation
US biofuel policy and potential for intra-industry trade with Brazil
While the system of blenders credits and tariffs instituted by the Energy Policy Act (EPA) of 2005 ended at the close of 2011, the mandate system known as the Renewable Fuel Standard 2 (RFS2) in the Energy Independence and Security act of 2007 remains in place. In RFS2 the categories of fuels were further segmented and the volumes were greatly expanded (Table 1). The mandates (renewable fuel, advanced biofuel, bio-based diesel and cellulosic biofuel) are not individual compartmentalized mandates but quantitative minimums nested within the renewable fuel mandate.
MandateGHG Reduction
minimumFeedstocks, fuels and processes
Renewable Fuels (T) 20%
(all of below and) Ethanol from maize starch
Advanced Fuels (A) 50%
(all of below and) Sugar, Starch other than maize, bio-based diesel from co-processing with petroleum, butanol, biogas
Bio-based Diesel (B) 50%
Distillate replacements produced from: Vegetable oil, animal fats, waste grease, animal waste and byproducts, excluding co-processing with petroleum
Cellulosic Biofuel (S) 60%
Derived from cellulose, hemi-cellulose or lignin from Renewable Biomass (from existing lands in production): Dedicated crops, crop residues, planted trees and residues, algae, yard waste and food waste
Other feedstocks possible in each class unless explicity excluded (such as maize starch in advanced) which meet the GHG reduction minimum

6
Figure 2: Nested mandates
Source: Authors’ elaboration
The four classes of mandates are delineated by fuel type, the reduction in lifecycle GHG emissions relative to a base for gasoline or diesel transport fuels, feedstocks and manufacturing process.
Table 2: Legislated and Implied mandates in EISA 2007
Source: EISA 2007 legislation
The cellulosic biofuel (S) and bio-based diesel (B) mandates set minimum quantities of these two types of fuels to be consumed. Cellulosic biofuels, not restricted to cellulosic ethanol, are defined by a biomass feedstock used to derive fuel from the cellulose, hemi-cellulose or lignin that produces a fuel which reduces GHGs by at least 60%. Bio-based diesel6 is a distillate replacement made from feedstocks such as vegetable oils or animal fats that reduces GHG emissions by at least 50%. The overarching advanced fuel mandate (A) is greater than (or equal to) the sum of the cellulosic and bio-based diesel mandates creating an implied advanced gap (O=A-B-S) for undefined other advanced fuels (O) used to meet the larger advanced fuel mandate (Table 1).7 Advanced fuels, those that can be blended to exploit the implied advanced fuel gap, are also defined by their feedstock and GHG reduction scores. They must reduce GHG emissions by at least 50%: they explicitly include ethanol made from sugarcane and explicitly exclude maize starch ethanol. This advanced mandate is nested
6 As defined in the Energy Policy Act of 1992. 7 The implied advanced gap calculation is complicated by the fact that the biodiesel mandate is in physical gallons but each physical gallon qualifies as 1.5 gallons toward the advanced and total mandates. Therefore the gap is calculated as (advanced mandate – cellulosic mandate – bio-based diesel mandate*1.5 ) or zero, whichever is greater.
T A
C
S
B
O
Mandates
C
Mandate quantitiesT = renewable mandateA = advanced mandateB = bio-based diesel mandateS = cellulosic mandate
Implied gapsC = conventional ethanol gapO = other advanced gap
2009 2010 2011 2012 2013 2014 2015 2016 2017 2018 2019 2020 2021 2022
Renewable fuels (T) 11,100 12,950 13,950 15,200 16,550 18,150 20,500 22,250 24,000 26,000 28,000 30,000 33,000 36,000 of which are Advanced fuels (A) 600 950 1,350 2,000 2,750 3,750 5,500 7,250 9,000 11,000 13,000 15,000 18,000 21,000 of which are Cellulosic biofuel (S) 0 100 250 500 1,000 1,750 3,000 4,250 5,500 7,000 8,500 10,500 13,500 16,000 of which are Bio-based diesel (B) 500 650 800 1,000 1,280 1,280 1,280 1,280 1,280 1,280 1,280 1,280 1,280 1,280
Implied renewable fuel gap (O) 10,500 12,000 12,600 13,200 13,800 14,400 15,000 15,000 15,000 15,000 15,000 15,000 15,000 15,000Implied advanced gap ( C) 0 0 0 0 0 80 580 1080 1580 2080 2580 2580 2580 3080
( million gallons )

7
in a larger over-arching renewable fuels mandate (T). The nesting creates an implied renewable fuel gap (C=T-A) for which maize starch ethanol qualifies (Table 2). As they are minimums, over production in each category can be used to meet the larger, less restrictive mandate. That is to say advanced fuels, for example sugarcane-based ethanol, blended in excess of the advanced mandate, can be used to satisfy the total renewable fuels mandate, crowding out maize starch ethanol, but the reverse is not true. This creates a hierarchy among the fuels based on the mandate classification while the physical product, in this case ethanol, is indistinguishable (Thompson et al., 2009).
As the different biofuels are basically indistinguishable for consumers they cannot be priced differently at retail8 and thus the additional benefits are translated into price incentives via an electronic tracking system of mandate obligations. The electronic classification instrument used for tracking mandate compliance, the Renewable Identification Number (RIN), is what differentiates the renewable fuels in the wholesale market. The RIN is assigned by the producer for each batch of fuel created and must accompany the fuel when sold to blenders who are the obligated party under RFS2 and so the wholesale price of the biofuel has in it the embedded value of the RIN. The RIN identifies the highest of the four classifications the renewable fuel can qualify for, the volume and the vintage of production. Once the renewable fuel is blended, RINs can be separated and used for compliance or sold to other blenders to meet their obligation in lieu of their own physical blending, much like a “book and claim” system (Schmitz, 2007). It is possible for each RIN to have a different price in the compliance market and so although fuels may be physically identical, at the wholesale level they can have different prices based on mandate compliance (Thompson et al., 2011a; Thompson et al., 2011b). This differentiation through RIN classification of the commodity by process or inputs versus physical characteristics opens the door for arbitrage where a physically identical product is cross shipped between countries or trade is reorganized based on different compliance systems.
The dominant feedstock for producing biofuels in the United States is maize, using a process that converts the starch of the kernel to ethanol. It is generally assumed that much of the implied advanced gap for of the RFS2 would have to be sourced from imported sugar-cane ethanol, as no other competitive fuel currently exists in the United States (FAPRI, 2012; OECD/FAO, 2012). If the implied advanced gap were negligible or the need for import sufficiently small, or in the absence of biofuel policies outside the United States, intra-industry trade of sugar ethanol and maize ethanol between Brazil and the United States may be vanishingly small. However, none of these factors currently hold and policy is driving the need for imports of biofuels by the United States.
The Environmental Protection Agency (EPA), faced with inadequate productive capacity to meet the cellulosic biofuel mandate as legislated for 2010, 2011 and 2012, was forced to reduce the mandate significantly while choosing to leave the total and advanced mandate alone (Table 3). The shortfall in cellulosic ethanol coupled with the EPA decision maintain the other mandates means that the size of the implied advanced gap has grown and even created the need for undefined advanced fuels in 2011 (not necessarily biodiesel [B] or cellulosic biofuels [S] but any fuel that meets the advanced classification [A]) and prompting US ethanol imports as seen in Figure 1. Plentiful supplies of maize starch ethanol in the US prompted increased exports, much of it back to Brazil (Figure 1).
8 Unless a specific labelling scheme is put in place. However, evidence from consumer demand surveys does not show a high willingness to pay for biofuels (Gracia et al., 2011).

8
Table 3: Adjustments to cellulosic biofuel mandate by the EPA
Source: US Environmental Protection Agency Rule Making for EISA 2007 Legislation
Ignoring the shortfall in cellulosic production, the potential (mandate-driven) market for imported ethanol in the US, through the implied advanced gap, grows to 3.08 billion litres by 2022 (Table 4) – an amount equal to over 50% of total Brazilian ethanol production in 2011. If cellulosic ethanol production continues to lag expectations and the EPA continues with its current policy of maintaining the other mandates while reducing the cellulosic mandate, the situation quickly becomes untenable. For exposition, if it is assumed that 25% of the cellulosic mandate can be met, the potential need for advanced fuels, largely to be obtained through trade, would grow to 15.08 billion gallons by 2022 (Table 4). This volume is clearly large enough to distort trade flows, raise world ethanol prices and drive US maize starch ethanol exports.
Table 4: Potential market for sugar-cane ethanol imports under an EPA cellulosic biofuel mandate waiver (shaded cells are the authors’ assumption for cellulosic biofuel production beyond 2012)
Source: Authors’ elaboration of EISA 2007
An additional factor affecting how intra-industry trade might evolve relates to the constraints on the ability of the motorfuel market in the US to absorb additional ethanol, known as the blend wall. Until recently, ethanol blending rates in the US for conventional vehicles were capped at 10% blends (E10). The number of flex fuel vehicles (FFVs), which can take up to 85% ethanol, is limited and most of the existing E85 dispensing locations are concentrated in the Midwest, away from the population centres on the coasts.9 With motorfuel demand between 140 and 150 billion gallons annually and ethanol disappearance in the US exceeding 14 billion gallons in 2011 with minimal sales of E85, the 10% blend market is approaching saturation (Thompson et al., 2012). Recent rulings by the EPA allows cars produced in the year 2001 or later to use up to 15% blend ethanol fuels but impediments remain. There is no physical difference between the cars produced before 2001 and those produced after that date, so ensuring that consumers do not dispense inappropriate fuel, either inadvertently or purposefully, is difficult to monitor and retailers have expressed concern about liability in such circumstances. Many new car warranties also specify a limit of E10 even today. There are also a limited number of dispensing options on consumer pumps and there may simply not be enough
9 http://www.afdc.energy.gov/fuels/ethanol_locations.html.
2010 2011 2012
Cellulosic biofuel mandate in EISA 2007 100 250 500Cellulosic biofuel set by EPA in waiver 6.5 6.6 8.65
EPA quantity as % of EISA legislated levels 6.5 2.6 1.7
(million gallons)
( percent )
2009 2010 2011 2012 2013 2014 2015 2016 2017 2018 2019 2020 2021 2022
Implied Advanced Gap ( C) 0 0 0 0 0 80 580 1,080 1,580 2,080 2,580 2,580 2,580 3,080
Waived cellulosic mandate 0 7 7 9 250 438 750 1,063 1,375 1,750 2,125 2,625 3,375 4,000New Implied Advanced gap 0 0 143 491 580 1,393 2,830 4,268 5,705 7,330 8,955 10,455 12,705 15,080
(million gallons)
9
“room at the pump” to dispense both E10 and E15, limiting the outward movement of the blend wall (Wisner, 2012).
The presence of the blend wall will also shape the competition to fill the implied advanced gap. Imported ethanol will need to be absorbed into the motorfuel supply, driving up compliance costs and pushing down the value of ethanol in the retail market. This will push excess US ethanol production, beyond that which can be allocated towards the implied renewable fuel gap, out into the export market as opposed to being consumed domestically. The blend wall may also allow for excess biodiesel to compete more effectively with imported sugar-cane ethanol as the constraints on the consumption chain in the distillate market are less binding and thus biodiesel prices and their associated RIN price will play a role in the speed and extent of intra-industry trade in ethanol between the United States and Brazil.
The intra-industry trade between Brazil and the US is unlikely to be a litre for litre, and the ratio of trade is likely to fluctuate from year to year based on relative feedstock prices (sugar and maize), the blend wall, transportation costs and oil prices. Shipping costs are ultimately borne by motorfuel consumers in both countries and the relative elasticities, under policy effects, will determine who pays for the transport and, ultimately, the number of ethanol ships passing in the night. The more restrictive the policies in Brazil, in terms of blending requirements, even if not segregated by process, the greater the intra-industry trade is likely to be.
Brazil policy and response
The 1973 oil embargo and the associated jump in oil prices came at a time when Brazil was importing over 80% of its domestic consumption and international sugar prices were putting significant economic pressure on producers (Hira and de Oliveira, 2009). The National Alcohol Program (Proálcool) was established in 1975 with the goal of improved foreign exchange and rural and agricultural development. Ethanol was promoted through heavy market intervention including fixed pricing, obligatory purchases and tax reductions on ethanol and neat fuel cars that consume pure ethanol (E100). Minimum blends were established for ethanol-gasoline blending, which required no immediate action for car manufacturers; however, the ongoing market intervention spurred the sale of neat vehicles throughout the 1980s (UNICA, no date). Increasing sugar prices, lower petroleum prices and an increase in the fixed sales price of ethanol significantly stressed the industry; during the first half of the 1990s Brazil was an importer of ethanol (Rosillo-Calle and Corez, 1998). In 1993, the Brazilian government passed a law mandating that all gasoline would be blended at 20 –25% ethanol inclusion rates. By the end of the 1990s, both anhydrous and hydrous ethanol prices had been liberalized along with gasoline and sugar markets, although ethanol still maintained a tax advantage relative to gasoline.
In 2004, the sale of FFVs took off in Brazil as the government provided the same tax breaks for the purchase of FFVs as it did for neat vehicles. The expansion of FFVs was rapid and they represented the majority of automobiles and light duty vehicle sales by 2005 and more than 90% of the sales by 2008. Currently, ethanol entering the motorfuel market in Brazil is consumed in two ways. First is consumption of pure ethanol (E100) by the aging fleet of neat fuel vehicles, whose sales numbers have plummeted. Second, ethanol is consumed in the FFV fleet that dominates current sales. Consumers with FFVs are able to use blender pumps when purchasing fuel and select the ethanol inclusion rate between the policy minimum and the FFV’s technical maximum based on relative

10
prices of ethanol and gasoline. The FFVs allow for a wide range of ethanol inclusion with the 20–25% policy blending requirement acting as a floor; consumers may be very responsive to prices until the blend minimum becomes constraining. Consumers with neat fuel vehicles will be unresponsive to ethanol prices in the short run (they cannot substitute away from alcohol fuels) but they will substitute other vehicles where available. The blending rate minimums support ethanol consumption but do not discriminate between feedstock or process in blending. The blending minimums then provide a mechanism to drive intra-industry trade.
In a stylized comparative static exercise (Figure 3) we can see that when US policy draws in imports from Brazil to satisfy the advanced mandate, ethanol market prices will rise prompting Brazil to re-import ethanol to satisfy market or legislative demand. The determinant of replacement volume depends on the position of supplies relative to consumer demand and mandated quantities (based on prescribed blending rates). The shift in domestic supplies can occur either through production shortfalls or from increased trade demand. If the market equilibrium in Brazil is such that the blend mandate is not binding (reflected by S1-D in Figure 3), an increase of imports from the US would reduce domestic supply from S1 to S2 with consumers being able to reduce their consumption of ethanol in Brazil by cutting the inclusion rate at the pump for FFVs and much of the adjustment in the Brazilian ethanol market may come through reduced domestic demand (Q1-Q2) resulting in a small price change (P1-P2) that may be insufficient to draw in large quantities of foreign ethanol. If the blend mandate is more constraining (S3-S4), effective demand will be less responsive (Q3-Q4) and prices will rise (P3-P4), inducing greater imports from abroad, with the US as the likely supplier as we saw in 2011.
Figure 3: Brazilian ethanol demand
Source: Authors’ elaboration
S4
S3
S1
S2
Blend Mandate
P4
P3
P1
P2
Q3,4 Q2 Q1
D
Q
P
11
Intersection with Europe’s Renewable Energy Directive (RED)
The magnitude of policy-induced intra-industry trade has been analysed so far taking into account the main elements of US and Brazilian policies. However, even though the EU has been a minor importer of Brazilian (or for that matter US) ethanol due to its focus on biodiesel as the main component of the biofuels mix (covering over 80% of the biofuel consumption in 2011 [USDA FAS, 2011]) recent developments in EU policies and transportation fuel market factors have the potential to boost ethanol intra-industry trade in the future, both for flows between the US and Brazil but also with the European Union.
EU policies
The EU policy framework to promote of renewable energy sources for transportation dates to 2003 and to the Directive 2003/30/EC, which foresaw a non-binding target of 5.75% market penetration for renewable transportation energy by 2010. While an exact impact assessment of Directive 2003/30/EC is not yet available, preliminary estimates suggest that the target will be or has been missed (Sorda et al., 2010; EC, 2012). In response to the low uptake, the targets were extended to 2020, lifted to 10% and made binding as part of the climate change and energy package of 2009.10 While the new package’s targeting for renewable energy in transport allows for different renewable energy sources (i.e. renewable electricity, hydrogen, biofuels, and other second- generation and non-land based biofuels) to count towards the overall 10% target, the actual implementation of the Directive has focused mainly on biofuels (Klessman et al., 2011). The latest projections by member countries for their National Renewable Energy Action Plans show that 88% of the target will be covered by traditional biofuels (Beurskens et al., 2011), and within biofuels, three-quarters will come from biodiesel.11
In addition to the mere quantitative targets, latest projections by member-states based on their National Renewable Energy Action Plans show that 88% of the target will be covered by traditional biofuels, ethanol and biodiesel (Beurskens et al., 2011); the climate change package also established minimum targets for GHG emission reductions. These foresee savings of 35% compared to fossil fuels during their life cycle up to 2017, rising to 50% savings by 2018 and to even 60% for installations starting production after 2017.12 The climate change package also included sustainability criteria which would require through verification schemes to prove that the aforementioned GHG reduction targets are accomplished. Tax exemptions and quotas provide the main incentives to reach these targets (Klessmann et al., 2011).
The need to take GHG-saving requirements into account opens two principal cases: one where the potential savings include the effects of indirect land-use change (ILUC) and the other where savings are defined through their direct impacts only. Figure 4 summarizes the saving potential for a range of
10 The Climate and Energy package implied the revision of three main pieces of EU legislation: the Renewable Energy Directive (Directive 2009/28/EC), the ETS Directive (Directive 2009/29/EC) and the Fuel Quality Directive (Directive 2009/30/EC). 11 Biofuels originating from primary forest, highly biodiverse grasslands, protected territories or carbon-rich areas are excluded. 12 21 649 ktoe of biodiesel (65.9%) and 7 307 ktoe of ethanol (22.2%) out of a total of 32 859 ktoe of renewable energy in total transportation needs.

12
biofuel feedstocks and suggests that the impacts are vastly different, depending on ILUC and on whether the feedstock is used for biodiesel or ethanol production. Excluding ILUC, essentially all feedstocks and regardless of whether they are used for biodiesel or bioethanol would clear the 50% GHG reduction hurdle. Disregarding possible blendwall limits for biodiesel (see below), this would suggest a continuation of current trends for feedstock use and biofuel production. Including ILUC, by contrast, (e.g. as reported by Laborde (2011)) would essentially eliminate all traditional biodiesel feedstocks from use under the climate change package of the RED. Other things being equal, such a scenario would suggest the EU would have to undergo a massive shift from biodiesel to ethanol and, within the ethanol use, the EU would have to source its needs from feedstocks that provide enough GHG-saving potential. In practice, only cane-based ethanol would qualify and only Brazil has the potential to supplies these extra quantities. Projections by Laborde (2011) show that meeting the mandate by 2020, the EU would need to import sugarcane equivalents from Brazil to the tune of 6 500 ktoe, thus inducing an increase in land devoted to sugarcane of under 500 000 hectares if import tariffs for ethanol13 remain in place and close to 1 000 000 hectares if trade is liberalized.
Figure 4: EU Biofuel GHG reduction scoring
Source: Laborde, D. (2011).
Considering an average yield for Brazil of 96.7 tonnes per hectare this implies that the EU27 would be importing between 48 and 96 million tonnes of Brazilian sugar-cane equivalents, which would imply 3.5 billion million litres when transformed into ethanol.14,15In practice, such increases in ethanol imports are unlikely to materialize simply because the fleet composition in the EU, with its strong focus on diesel vehicles, would not allow these quantities to be absorbed. Such a shift would require an increase in blend rates for ethanol to more than 45%, i.e. a shift the EU car fleet is not prepared for. As such a massive increase in imports of cane-based ethanol by the EU may also increase the
13 19.2 euro cents per litre or about 85 US cents per gallon. 14 Considering 73.71 litres of ethanol per tonne of sugarcane. 15 These figures also include the impact of increasing the current blending mandate in Brazil from 20 to 35%.
-20%
-10%
0%
10%
20%
30%
40%
50%
60%
70%
80%
90%
Wheat Maize Sugar beet
Sugarcane Palm fruit
Soybean Sunflower Rapeseed
GH
G s
avin
gs v
s. r
efer
ence
foss
il fu
el
Direct Savings Net Savings considering ILUC
13
need for Brazil to cover its own mandatory blending requirements (20%), it would spur Brazil’s own import needs. These, in turn, could only be covered by US exports to Brazil, and as the US still requires larger quantities of cane-based ethanol to cover its advanced quota, this would potentially further increase ethanol intra-industry trade between the US and Brazil.
Current EU biofuel policy within the Renewable Energy Directive (RED), remains in flux with the recent Commission determination to include indirect land-use change (ILUC) to calculate GHG savings and to cap ‘’food commodity’’ feedstocks at 5% of the 10% renewable energy in transport target by 2020. While both the US and EU will now include ILUC calculations, they arrive at significantly different scores and apply different criteria for fuels to qualify for compliance. In the EU, including ILUC eliminates most biodiesel products from RED compliance, but qualifies most ethanol products. EU ethanol production will then compete with potentially cheaper imports. The current policy environment would require the actual trade of the ethanol as accounting for the mandate requires that sustainability criteria are implemented using a mass balance system as opposed to a book and claim system (Article 18 of the RED). This was put in place to assure that the biofuels targets promoted additional production of sustainable biofuels. The proposed cut of the EU ethanol import tariff of 19.2 ct/l would favour imports and the Laborde assumes economics would favour cane-based ethanol imports from Brazil, which would bring it into competition with the United States for available supplies. This in turn would increase Brazil’s own import needs and thus corn-based ethanol exports from the US, i.e. intra-industry trade. If the US imports significant volumes of ethanol from Brazil to meet its advanced mandate, excess US ethanol produced from maize may find its way into European markets to meet up to half of the target of 10% renewable energy in the transport sector.16 Idled EU biodiesel capacity could then be redirected for export markets.
Biofuel tourism isn’t exclusively international
Independent policies between government entities which result in little net gain in biofuel use need not be between countries. Under California Executive Order S-1-0717, the California Air Resources Board (CARB) has implemented the Low Carbon Fuel Standard (LCFS) which scores individual fuels based on their GHG reduction score and then sets a target for a specific reduction in the quantity of GHG emissions.18 The policy requires the fuel to be consumed within California, but the RINs associate with the fuel can still be used to comply with the nation-wide RFS2. Renewable fuels can therefore be counted both towards the LCFS and RFS2 as long as the fuel is consumed within the state, however, differences in GHG reduction scores between California and the EPA will impact the production process or fuel types. Under RFS2 threshold levels, there is no incentive to further improve the GHG reduction score once the renewable fuel pathway breaches the desired mandate minimum. Under the LCFS, in theory, each improvement in the pathway would be accompanied by a larger GHG reduction score which would increase the value of the fuel in California. However, the impact of the LCFS in decreasing US GHG emissions is muted by the fact that the single unit of fuel can be used to comply with both state and national regulations.
16 While both sugarcane ethanol and maize ethanol would qualify equally toward the 10% inclusion of renewable energy in the transport sector, the higher GHG reduction score for sugarcane ethanol would give it additional value toward meeting the overall 20% GHG emissions reduction target from the energy sector. 17 http://www.arb.ca.gov/fuels/lcfs/eos0107.pdf 18 http://www.arb.ca.gov/fuels/lcfs/lcfs.htm

14
Brazilian imports may be diverted to California ports to comply with the LCFS with the RINs generated then traded to other states. Biodiesel could be produced and consumed in the Midwest and the RINs traded to California blenders for compliance with the RFS2 in isolation, but with the overlapping LCFS policy, the biodiesel, not the electronic credits, must travel to California, mitigating some of the GHG savings by the need to transport the fuel. While California GHG emissions would fall under the LCFS rule, the fact that RINs are likely to be generated and could be sold to the other 49 states would lower their GHG savings and the net effect on GHG emissions would be uncertain once transport of the biofuels is considered. Consumer cost of renewable fuels could rise due to the need to transport the renewable fuel to California (Kaufman et al 2009) and Californians will bear a larger share of the burden for meeting the mandate obligations under RFS2 while simultaneously complying with the LCFS.
Policy-driven intra-industry trade effects and solutions
While the intersection of Brazilian and US biofuel policy provides the necessary condition for the intra-industry trade of physically identical but policy differentiated biofuels to be cross-traded, it is other factors which will determine if and to what extent this will happen (Figure 5). Currently, the Brazil is the lower cost producer for what are classified as advanced fuels under US policy. The figure approximates the conditions found during the later part of 2011 where US conventional ethanol markets were (marginally) not binding and imports from Brazil represented the low-cost advanced biofuel with a strongly binding mandate and Brazilian markets were also (marginally) binding). In effect Brazil clears then ethanol market by supplying to the US advanced biofuel market while covering those exports with imports from the us conventional ethanol market. This results in policy induced trade between the two countries, which also incur transportation costs (and associated GHG emissions) to reach the US. This drives up ethanol prices in Brazil, the extent to which will depend critically on the size of the domestic supplies relative to Brazil’s own inclusion mandate and where demand sits relative to its own mandate (Figure 3). With higher Brazilian ethanol prices, the US conventional ethanol market, may then send supplies back to Brazil, incurring additional transportation costs and releasing GHG emissions and moderating some of the ethanol price impacts in Brazil.
While we can see that the result will be higher ethanol prices in Brazil, higher conventional ethanol prices in the US, lower advance ethanol prices in the US and additional expenditures on transportation costs. The actual volume of trade and the size of the price changes will depend critically on a wide range of factors. As an example of just one factor, the price of oil will influence market demand relative to mandated quantities. If oil prices move higher, this potentially pushes market demand beyond mandated quantities and increases the value of maize ethanol relative to gasoline in both the US and Brazilian markets. With both US and Brazilian markets operating on a more elastic portion of the demand curve, all else equal, this would likely reduce the ratio of intra-industry trade between the two countries as US import demand to fill the advanced mandate would not induce as large a price change in Brazil, limiting the response by US exporters.

15
Figure 5: A supply and demand representation of how the Brazilian ethanol market clears the US advanced biofuel and conventional biofuel markets, including transportation costs.
Source: Authors’ elaboration
Sugarcane and maize yields also play a critical role in determining the ratio of intra-industry trade but their yields are likely to have opposing effects on volumes. Above trend sugarcane yields are likely to increase available supplies of ethanol in Brazil, pushing out supplies relative to their own policy needs and thus reduce the needs for export replacement of supplies drawn out by the United States. Conversely, low maize yields in the US are likely to lead to a more binding total mandate in the US and reduce the ‘’excess’’ supplies of maize starch ethanol which could be shipped to Brazil in exchange for the mandate driven imports.19 Relative demand and supply elasticities in the two markets (as influenced by policies and the blend wall which will make such demand highly non-linear) and the market context (oil and feedstock prices) will ultimately determine the volume of ethanol exchanged. The size of the advanced mandate market in the US will expand rapidly in the next decade, making intra-industry trade much more likely and at substantially larger volumes (Table 4).
While an important motivation of biofuel policies is to reduce the emissions of GHGs associated with the use of motorfuel, as implemented, there is potentially significant efficiency loss in meeting that objective. The transport of ethanol between Brazil and the United States has its own GHG emissions and those flows identified as policy-driven intra-industry trade work against the policy objectives.20 In addition, the costs of transportation, both for the policy-driven imports by the US, and any subsequent intra-industry trade that emerges, must ultimately be borne by consumers of motorfuels and distillate (diesel) products. This increase in costs may serve to reduce the demand for biofuels, and reduce their consumption. A system of tradable obligations for both the United States and Brazil (and under the same arguments, the EU) could further reduce GHG emissions beyond the uncoordinated actions of each country.
19 Imports by the US to fill the implied advanced gap (O) will compete with biodiesel, in excess of its own mandate (B), which will be influence by the presence of the ‘’blend wall’,’ which will also influence the value of additional maize ethanol in the domestic (US) market relative to Brazilian markets where such constraints are far more limited.
20 It is not clear to the authors if the possibility of cross-trade has been included in the life-cycle analysis for renewable fuel GHG reduction scoring or even how one might allocate such emissions.
US ConventionalEthanol
US AdvancedEthanol
Brazil Ethanol
Brazil net-exports
Brazil exports
US maize ethanol exports
US sugarcane ethanol imports
Transport and Compliance CostTransport Cost
P1
P2
P3
Padvanced
Pconventional
US conventional Demand US conventional
SupplyBR Demand
US AdvancedSupply
US AdvancedDemand
BR Supply

16
A tradable system of obligations between countries, similar to what exists within the United States or the ‘’book and claim’’ system as proposed but not implemented in the EU, could potentially increase the efficiency of both policies in achieving GHG reduction goals and at lower costs for consumers. The US already implements a compliance system for certifying imported ethanol from Brazil that would facilitate this interaction of policies between the two countries, and thus minimal additional costs would be associated with program implementation in the US. The RINs created when the ethanol is produced in Brazil would still be created but then only the RINs would be required in the US for compliance with the RFS2, eliminating the transportation of the physical ethanol.
In order to avoid double counting this ethanol in Brazil, obligations toward its blending minimum would be converted to a RIN system. In this system, the Brazilian sugarcane ethanol, which had its RINs sent to the US for its mandate compliance could not be counted toward Brazilian blending minimums, now based on holding sufficient RIN volumes to equal 20% of the volume of fuel sold and not based on the physical blending of every individual gallon of motorfuel at a minimum of 20%. If the Brazilians needed additional ethanol beyond the unobligated physical sugarcane ethanol on-hand to meet its blending minimum it could obtain conventional RINs from the United States, again eliminating the need to transport physical ethanol. The physical quantity of ethanol consumed by the Brazilians could deviate from the blend minimum but the minimum net-consumption across both countries would remain constrained by the individual country policies.21 A Brazilian RIN system would come with additional compliance costs, but could also improve domestic market efficiency by removing the need to blend every gallon of gasoline, taking advantage of any geographic pricing differences in the country.
Conclusions
Current, uncoordinated policies in the United States, Brazil and the European Union encourage the intra-industry trade of physically homogeneous biofuels in contradiction to policy objectives of reducing greenhouse gas emissions. The implementation of the European Union RED may encourage additional US intra-industry trade with Brazil or further an exchange of ethanol and biodiesel among the three countries based in part on differential GHG scoring based on feedstocks, fuels and processes. The scope for intra-industry trade only increases with the growth in US mandates into the next decade and the advanced mandate expands rapidly and the prospects for cellulosic ethanol production remain limited. Medium-term limits in consumption, or blend-walls, in the US for ethanol and for both ethanol and biodiesel in the European Union are likely to contribute to the expanding intra-industry trade. Intra-industry trade and even trade motivated by a mass balance system as seen in the EU, could be eliminated, costs reduced and GHG emissions lowered by a inter-country book and claim system that would allow for multi-country objectives while improving the efficiency of such programs for consumers and in terms of GHG emissions. The intra-industry trade we have seen to date, remains the ‘’tip of the iceberg’’ as quantities expand or additional homogeneous products are classified differentially and traded. Existing policies may appear unsustainable, through high costs or politically sensitive volumes of imports, and the authors suggest there is an opportunity for a more efficient system which respects differing national objectives which can be found in a ‘book and claim’ system.
21 A Brazilian RIN system would also come with additional compliance costs, but could also improve domestic market efficiency by removing the need to blend each and every gallon of gasoline but could take advantage of any geographic pricing differences in the country while maintaining its blending minimums.

17
References
Gracia, A., Barreiro-Hurlé, J. & Pérez y Pérez, L. 2011. Consumers’ willingness to pay for biodiesel in Spain. European Association of Agricultural Economics 2011 Congress “Change and Uncertainty Challenges for Agriculture, Food and Natural Resources”, 30 August to 2 September, Zurich (Switzerland).
Crago, C.L., Khanna, M., Barton, J., Giuliani, E. & Amaral, W. 2010. Competitiveness of Brazilian sugarcane ethanol compared to US Corn ethanol. Poster prepared for presentation at the Agricultural & Applied Economics Association 2010, AAEA, CAES, & WAEA Joint Annual Meeting, Denver, Colorado, 25-27 July 2010.
European Commission (EC) 2012. EU energy in figures: pocketbook 2012. Luxembourg, Publications Office of the European Union.
Beurskens, L., Hekkenberg, M. & Vethman, P. 2011. Renewable energy projections as published in the National Renewable Energy Action Plans of the European Member States. Petten, Netherlands, European Research Centre of the Netherlands (ECN) and European Environmental Agency (EEA).
Food and Agricultural Policy Research Institute (FAPRI). US biofuel baseline and impact of E-15 expansion on biofuel markets. FAPRI-MU Report 02-12. 2012.
Hira, A. & de Oliveira, L.G. 2009 No substitute for oil? How Brazil developed its ethanol industry. Energy Policy, 37: 2450-2456.
Kaufman, J., Thompson, W. & Meyer, S. 2009. Implications of the low carbon fuel standard for state and national ethanol use. University of Missouri, Department of Agricultural Economics Working Paper No. AEWP 2009-05.
Klessmann, C., Held, A., Rathman, M. & Ragwitz, M. 2011. Status and perspectives of renewable energy policy and deployment in the European Union: what is needed to reach the 2020 targets? Energy Policy, 39: 7637–7657.
Laborde, D. 2011. Assessing the land use consequences of European biofuels policies. Report by ATLASS Consortium for DG TRADE under Framework Contract TRADE/07/A2, Brussels.
OECD/FAO. 2012. OECD-FAO Agricultural Outlook 2012–2021. Paris, OECD Publishing and Rome, FAO (available at http://dx.doi.org/10.1787/agr_outlook-2012-en).
Energy Policy Act of 2005, Public Law 109–58 (2005).
Energy Independence and Security Act of 2007, Public Law 110–140 (2007).
Roosen, J., Marette, S., Blanchemanche, S. & Verger, P. 2007. The effect of product health information on liking and choice. Food Quality and Preference, 18: 759–770.
Rosillo-Calle, F. & Cortez, L.A.B. 1998 Towards ProAlcool II: a review of the Brazilian bioethanol programme. Biomass and Bioenergy, 4(2): 115–124.
Schmitz, N. 2007. Certification to ensure sustainable production of biofuels. Biotechnology Journal, 2: 1474–1480. doi: 10.1002/biot.200700176.
Sorda, G., Banse, M. & Kemfert, C. 2010. An overview of biofuel policies across the world. Energy Policy, 38: 6977–6988.
Thompson, W., Meyer, S. & Westhoff, P. 2009. Renewable identification numbers are the tracking instrument and bellwether of US biofuel mandates. EuroChoices, 8(3): 43–50.

18
Thompson, W., Meyer, S. & Westhoff, P. 2011a. What to conclude about biofuel mandates from evolving prices for renewable identification numbers? American Journal of Agricultural Economics, 93(2): 481–487.
Thompson, W., Meyer, S., Westhoff, P. & and Whistance, J. 2012. A question worth billions: Why isn’t the conventional RIN price higher? FAPRI-MU Report 12-12, FAPRI, University of Missouri, Columbia, Missouri, December.
Sugar Cane Industry Association of Brazil (UNICA) (no date). Ethanol-powered automobiles statistics. Light vehicle sales (available at http://english.unica.com.br/dadosCotacao/estatistica/) Accessed 31/10/2012.
USDA FAS. 2011. EU-27 Annual Biofuels Report. GAIN Report NL1013. The Hague, United States Department of Agriculture.
USDA. 2007. Ethanol transport backgrounder. Washington DC, United States Department of Agriculture, Agricultural Marketing Service, Transportation and Marketing Programs, Transportation Services Branch (available at http://www.ams.usda.gov/AMSv1.0/getfile?dDocName=STELPRDC5063605). Accessed 31/10/2012.
Wisner, R. 2012. Ethanol exports: a way to scale the blend wall? Renewable Energy & Climate Change Newsletter, February. Agricultural Marketing Resource Center, Iowa State University.

ESA Working Papers WORKING PAPERS The ESA Working Papers are produced by the Agricultural Development Economics
Division (ESA) of the Economic and Social Development Department of the Food
and Agriculture Organization of the United Nations (FAO). The series presents ESA’s
ongoing research. Working papers are circulated to stimulate discussion
and comments. They are made available to the public through the Division’s website.
The analysis and conclusions are those of the authors and do not indicate
concurrence by FAO.
AGRICULTURAL DEVELOPMENT ECONOMICS Agricultural Development Economics (ESA) is FAO’s focal point for economic
research and policy analysis on issues relating to world food security and sustainable
development. ESA contributes to the generation of knowledge and evolution of
scientific thought on hunger and poverty alleviation through its economic studies
publications which include this working paper series as well as periodic and
occasional publications.
Agricultural Development Economics (ESA)
The Food and Agriculture Organization of the United Nations Viale delle Terme di Caracalla
00153 Rome, Italy
Contact: Office of the Director
Telephone: +39 06 57054368 Facsimile: + 39 06 57055522
Website: www.fao.org/economic/esa e-mail: [email protected]