interspecific genetic linkage map, segregation distortion...
TRANSCRIPT

Theor Appl Genet (2000, 101 569-676 O Springer-Verlag 2000
C.-L. Ky P. Barre M. orieux P. S. Akaffou - J. ouarn k A. Charrie P M.Poirot Interspecific genetic linkage map, segregation distortion and genetic conversion in coffee (Coffea sp.)
Received: 4 Janaury 2000 / Accepted: 17 Januar)? 2000
Abstract An interspecific partial genetic linkage map of Cofseu sp. based on 62 backcross hybrids is presented. F, hybrids were generated, by a cross, between the wild C. pseudozanguebariae and the anciently cultivated C. lib- erica var. dewevrei (DEW); progeny we from a backcross between F, hybrid and construction consisted of a two-step strategy using 5.5 and 3.1 LOD scores revealed by simulation file. The map consisted of I83 loci: 167 amplified fragment length polymorphism (AFLP) and 13 random fragment length polymorphism (RFLP) loci. The markers were as- sembled into 14 linkage groups, each with 4-31 markers covering 1,144 cM. Segregation distortion was observed for 30% of all loci. in particular 3:1 and 1:3 ratios equal- ly favouring each of the two parents. The existence of such ratios suggests genetic conversion events. This map also represents an initial step towards the detection of quantitative trait loci.
Key words Coffea sp. . AFLPs . RFLPs . Linkage map 1
Segregation distortion Genetic conversion
Introduction
Polymerase chain reaction (PCR)-based methods reduce both costs and time when screening large numbers of ge- netic markers, such as amplified fragment length poly-
Communicated by P.M.A. Tigerstedt
C.L. Ky ('24) . P. Barre . M. Lorieux . P. Trouslot S. Hamon . M. Noirot GeneTrop. Centre IRD de Montpellier. B.P. 5045, 34032 Montpellier cedex I , France FdX: +33467416222
S. Akaffou. J. LOU^ Station ORSTOM de Génétique du caféier. Man. B.P. 434. Ivory Coast
A. Charrier ENSA, UFR Génétique et Amélioration des Plantes. Place Viala. F-34060 Montpellier. France
- ^ ,"- -- I
morphism markers (AFLP, Vos er al.' 1995).The 6AFLP technology has two main advantages: (1) more reliability and consistency than .* random amplified polymyphic DNAs (RAPDs): (2) a large number of markers'on a sin- gle high-resolution sequencing gel. Consequently, a ' high-density map can be obtained from a small number of primers and minute amounts of DNA. AFLP.markers are typically domin to unique positions ploited in genetic a 1995: Meksem et al. 1995). RFLP (restriction fragment length polymorphism) markers do not have such advan- tages; the number of markers obtained from a gel'is low- er and higher amounts of DNA are required. In contrast. they are co-dominant. which allows between-map com- parison.
Coffee trees belong to the genus Cuffea sub-genus Coge,, family Rubiaceae and are mostly present in trop- ical and subtropical regions of the world. Most species (up to 80 vdxa) are diploid (2n=22), except C. arabica, which is tetraploid (Leroy 1980; Bridson 1987). Two specjes are currently cultivated world-wide: C. arabica and C. canephora. As wild species constitute the base of genetic resources for breeding, interspecific crosses have been realised to test breeding possibilities by introgres- sion (Louarn 1992). Those that include East African spe- cies and a West African species constitute an extreme situation, which is illustrated by the cross between C. pseudozanguebariae. native to Kenya and Tanzania, and C. liberica var. dewevrei, native to Central Africa. In the investigation reported here we used the C. pseudo- zanguebariaexC. liberica dewevrei cross for genetic mapping for two main reasons: (1) the availability of F, hybrids as well as backcrossed hybrids and (2) the low genetic distance between C. liberica dewevrei and C. caneptzura (Carvalho and Monaco 1967; Charrier 1978: Louarn 1992), which facilitates relating the results to cultivated species.
Distorted marker segregation has been reported in several interspecific linkage analyses (Grant 1975). This systematic deviation from an equal representation of al-
.
and most fragments the chromosome and hysical mapping (T

, . 670
leles among functional gametes inv,olves all chromo- somes and could be caused by selection processes at the gamete or zygote stage (Gadish Ad Zamir 1986; Zamir and Tadmor 1986). Our study was ,also' descgned to ob- tain .a quantitative estimation of the firoportion of un- equally segregating loci in thb interspecific cross and to provide a possible explanatio$ for its pkserice in Cofseu genera. The main purposes 06 tlïis papei are: (1) to pres- ent the first 'interspecific AFLP mar8er:based genetic linkage map of a cross in Cofseu; (2) to identify sets of markers showing important segregation:distortion.
Materials and methods
6:. . . .
I' .
Plant 'material
Plah material is'maintained at the Agriculkl Station IRD (Man, Ivory Coast). The cross lietween C. pseudozunguebariae Bridson (PSE genotype23044 used, as female parent): and C. liberica var. dewevrei (DEW; genotype 5851; used as male parent) was made by hand pollination under bags according to Louam (1992). Twen- ty-five FI hybrids were obtained and grew on the same plot of the station. Sixty-Mo backcross hybrids on DEW:(BCDEW) were ob- tained by open pollination of 13 F,.hybrids (used as female par- ent). Backcross ?hybrids were idenhfied using RFLP.and AFLP molecular q , k e r s (180 PSE and 30 DEW. specific markers). Twelve trees 'af both species were used to identify species-specific A,F'LP markers; 4 ,Before being, sent to France, fresh coffee leaves were packed in wet newspaper in an isotherm box. m e y w*e lyophilised and then stored in a cold room (4"C, 20% relative liumidity).
~~
DNA extraction
Coffee leaves of PSE and the hybrids were recalcitrant to DNA extraction due to the presence of polysaccharides and other sec- ondary metabolites. A direct extraction with CTAB (Doyle and Doyle 1987) or MATAB resulted in DNA in a gelatinous sub- stance (polysaccharide), consequently limiting PCR amplification and enzymatic digestion. A two-step, large-scale DNA extraction (nuclei isolation followed by MATAB lysis) ultimately constituted the protocol followed for DNA extraction in the coffee plant:
Step 1 -Nuclei extraction: - crushing of lyophilised leaves for 4 min in a ball mill (Dangou-
mill) to obtain a fine powder; - mixing of powder (1 g) with 100 mL of nuclei extraction buff-
er in an Erlenmeyer flask; the slightly modified lysis buffer of Dolezel (1989) was used 15 mM TRIs, 2 rnh4 EDTA, 80 mM KCl, 20 mM NaCl, 0.5% Triton X-100, 0.1% ß-mercaptoetha- nol, pH 9;
- shaking of Erlenmeyer flask for 2 h on a stirring table at 125 rpm;
- transfer of the suspension into two 50 ml capped tubes (Sarst- edt);
- centrifugation for 20 min at 3000 g ; - pooling of pellets and re-suspensions in 20 ml lysis buffer,
which was composed of 4% MATAB, 0.1 M TRIs, 1.25 M NaCl, 0.02 M EDTA, pH 8.0;
- storage of samples -20°C.
Step 2 - Nuclei lysis and DNA extraction: - incubation of capped tubes at 65°C for 4 h; - centrifugation at 3000 g for 10 min; - transfer of supernatant into a new 50 mL tube; - addition of 20 ml of chlorofondisoamyl alcohol (24/1:v/v);
- after a brief agitation, centrifugation of the emulsion for 10 min at 3000 g; washing with chloroform/ isoamyl alcohol was carried out twice;
- RNA suppression by incubation for 30 min at 37°C with 200 pl RNAase solution (10 mg/ml RNAase A from bovine pancreas, Boehringer); - DNA precipitation with 20 ml isopropyl alcohol;
- centrifugation at 3,000 g for 10 min; - re-suspension of pellet in 0.7 ml TE (10 mM TRIS-HCl, 1 mM
EDTA, pH 8.0); - transfer into 1.5-ml hbes; - DNA precipitation with 0.6 ml isopropyl alcohol and 70 pl 3 M
sodium acetate (pH 5.2); - centrifugation at 12,000 g for 10 min; - washing of the pellet in 70% ethanol; - centrifugation at 12,000 g for 10 min, - drying of pellet; - re-suspension in TE.
DNA content was evaluated on 1% agarose gel to compare the sample to the hDNAIEcoRI+HindIII marker (Promega). DNA yield depended considerably on the genotypes and varied from 125 pg to 1,000 pg per 1 g of lyophilised leaves.
RFLP markers
DNA probes came from two genomic libraries. Probes for which the name begins with a G or AR were derived from a BamHI li- brary of the Arabusta genotype (hybrid issue from a cross between C. arabica and C. canephora). The probes designed CA were ob- tained from a C. arabica PstI library. Preparation and characteris- tics of the libraries have been previously described (Paillard et al. 1996). DNA digestion, separation by electrophoresis, blotting and hybridisation were performed following the manufacturer's in- structions.
AFLP markers
The AFLP protocol by Zabe Vos (1993) and Vos et al. (1995) was carried out with minor modifications. Total genomic DNA (50 ng/ pl) was restricted with two enzyme combinations, 10 U EcoRI and 5 U MseI (from Gibco BRL), in 5xT4 ligase buffer for 2 h at 37°C. Twenty-five microlitres of a mixture containing 100 ng/pl of EcoRI adapter, 1 pglpl of MseI adapter, 1 U T4 DNA ligase (from Gibco BRL) and AFLP water-grade was added to the restricted DNA. The ligation reaction was incubated at 37°C for 3 h.
The pre-amplification profile by PCR was performed with 5 pl of template DNA using a primer pair based on the sequences of the EcoRI and MseI adapters. These had one additional selective nucleotide at the 3' end (EcoRI+l primer and MseI+l primer) (Vos et al. 1995). This first round of amplifcation consisted of: 20 cy- cles: 30 s at 94"C, 1 min at 56°C and 1 min at 72°C. The pre-am- plification products were then diluted 30-fold with AFLP water- grade. The second and final round of ampliiïcation was performed using primers based on the same sequence but with two additional selective nucleotides at the 3' end (EcoRI+3 primers and MseI+3 primers). The EcoRI+3 primers were labelled by phosphorylating the 5' end with [y-[33P]-ATp (Amersham). The amplification pro- file consisted of 13 cycles of 30 s at 94"C, 30 s at 65°C and l min at 72°C and 33 cycles of 30 s at 94"C, 30 s at 56°C and 1 min at 72°C. The PCR was performed on a MJ Research FTC 200 thermoc ycler.
The PCR products were mixed with an equal volume of 98% formamide, 10 mM EDTA, 0.05% bromophenol blue and xylene cyano1 as tracking dyes. They were denaturated at 90°C (3 min) and maintained at 70°C. Aliquots (5 pl) were loaded onto a de- naturating 8% polyacrylamide gel which consisted of 40 g urea, 12 ml acrylamide, 8 ml IOxTBE (108.0 g TRIS, 55.0 g boric acid, 40.0 ml 0.5 M EDTA, pH 8 in 1 1) and 28 ml distilled water. The electrophoresis buffer was 1xTBE. Gels were run at constant pow-
,
er (50 W for 3 h 40 min), futed, dried as for the sequencing gels and then exposed to X-ray film (Kodak Biomax film) for 48-72 h.
Morphological marker
Only one morphological and monogenic marker was used for mapping: the fruit colour at maturity (purple in PSE and red in DEW, with purple being dominant).
Data analysis
&P and RFLP data were obtained by two readers visually scor- ing the autoradiograms independently. Only unambiguous bands specific to PSE were scored (present=l, absent=O). Marker segre- gations were checked for deviation from the expected Mendelian segregation (1:l) by chi-squared analysis.
Map construction strategies
Linkage analysis was assessed using the MAPMAKER~EXP version 1 3.0b computer software (Lander et al. 1987; Lincoln et al. 1992).
Map units (cM, centiMorgans) were derived using the Kosambi (1944) mapping function. The marker order.was confirmed with the ripple command.
A two-step procedure was carried out to manage the two statis- tical error risks (I and 10. In the first step, MAPMAKER was sepa- rately applied to distorted markers and non-distorted markers. The LOD score was defined to obtain highly likely linkage groups. In the second step,'MAPMAKER was applied to regroup previously de- fined linkage groups that can be linked. The LOD score was then defined to avoid pseudo-linkage. .
A simulation was carried out to define the two LOD score val- ues. The simulated table of 62 individuals and 80 markers was structured & follows: 1) four independent linkage groups A, B, C, D of 10 non-distort-
ed markers. The first marker of each linkage group was ob- tained using a binomial distribution (n=2, Pd.5). The second marker arose from the first marker by random swapping (O be- came l and vice-versa) for 10% of the 62 individuals. The same process was used to obtain the third marker from the sec- ond one, and so on, up to the tenth marker. Markers were ap- proximately equally spaced;
2) an independent linkage group E of 10 distorted markers (segre- gation 3:l). Obtaining differed only by the initial use of a bino- mial distribution with P=0.75;
3) a second distorted linkage group, F, related to the group A of non-distorted markers. This group F also included of 10 mark- ers, but its first marker arose from the first marker of the group A in which 50% of O (selected at random) became 1. Thus, A and F should be linked after mapping;
4) ten distorted and independent markers, obtained using a bino- mial distribution (n=2, P=0.75);
5) ten distorted markers simulating band superposition. Each marker "MY' resulted from 2 markers (M1 and M2) randomly selected among the groups A, B, C and D. The algorithm was: if Ml=l or M2=1 then M3=1, otherwise M 3 d .
6) The two LOD scores we defined from the simulation were 5.5 for the first step and 3.1 for the second one.
Results
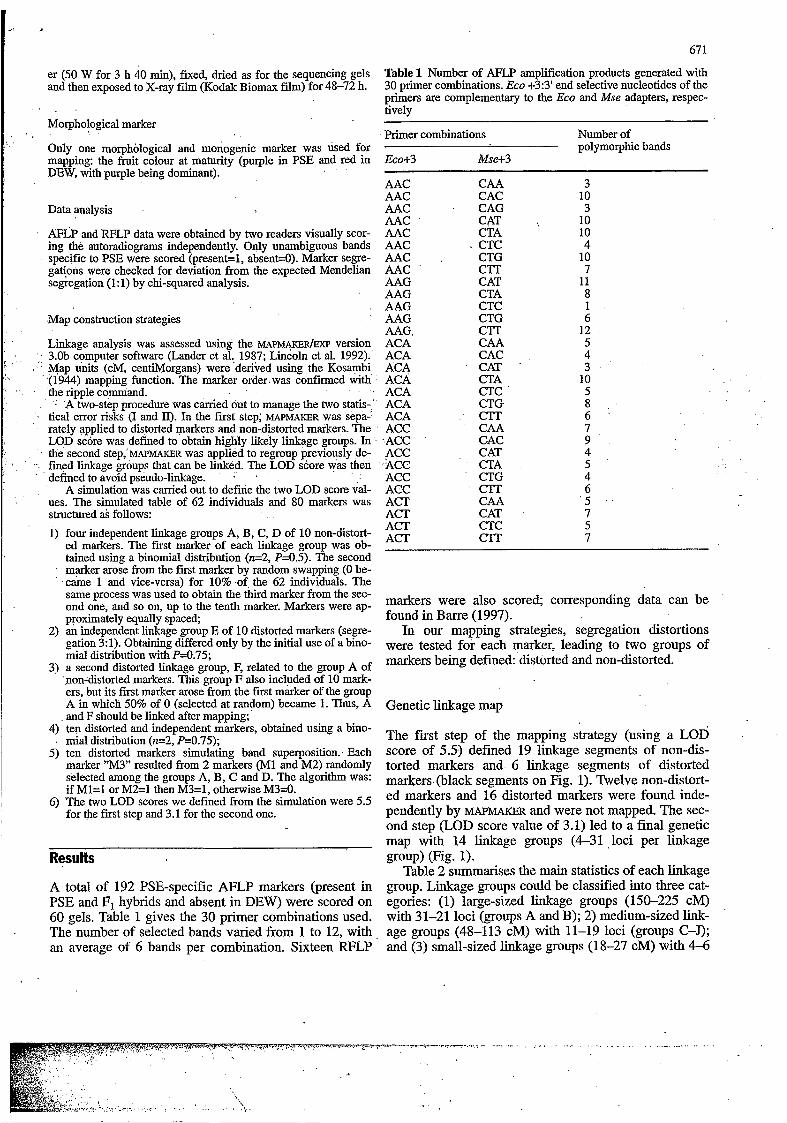
A total of 192 PSE-specific AFLP markers (present in PSE and FI hybrids and absent in DEW) were scored on 60 gels. Table 1 gives the 30 primer combinations used. The number of selected bands varied from 1 to 12, with an average of 6 bands per combination. Sixteen RFLP
67 1
Table 1 Number of AFLP amplification products generated with 30 primer combinations. Eco +3:3' end selective nucleotides of the primers are complementary to the Eco and Mse adapters, respec- tively
~ ~~
Primer combinations Number of
Eco+3 Mse+3 polymorphic bands
AAC AAC AAC AAC AAC AAC AAC AAC AAG AAG AAG AAG AAG. ACA ACA ACA ACA ACA ACA ACA ACC ACC ACC ACC ACC ACC ACT ACT ACT ACT
CAA CAC CAG CAT CTA CTC CTG CTT CAT CTA CTC CTG CTT CAA CAC CAT . CTA CTC CTG CTT CAA CAC CAT CTA CTG CTT CAA CAT CTC CTT
3 10 3
10 10 4
10 7
11 8 1 6
12 5 4 3
10 5 8 6 ' 7 9 4 5 4 6
7 5 7
' 5 '
markers were also scored; corresponding data can be found in Barre (1997).
In our mapping strategies, segregation distortions were tested for each marker, leading to two groups of markers being defined distorted and non-distorted.
Genetic linkage map
The Fust step of the mapping strategy (using a LOD score of 5.5) defined 19 linkage segments of non-dis- torted markers and 6 linkage segments of distorted markers (black segments on Fig. 1). Twelve non-distort- ed markers and 16 distorted markers were found inde- pendently by MAPMAKER and were not mapped. The sec- ond step (LOD score value of 3.1) led to a final genetic map with 14 linkage groups (4-31 loci per linkage group) (Fig. 1).
Table 2 summarises the main statistics of each linkage group. Linkage groups could be classified into three cat- egories: (1) large-sized linkage groups (150-225 cM) with 31-21 loci (groups A and B); 2) medium-sized link- age groups (48-113 cM) with 11-19 loci (groups C-J); and (3) small-sized linkage groups (18-27 cM) with 4-6
= - . , , ~ . " l , p y 7 . - - ~ l , . - . - - ~ . . .... ..^. .. . . . . . . . . . . . . . ..... . . .
. . . .
. .

672
PSE
LG C' LG A LG B LG D
IO8 - CA71
118 - ACACACI
LG E
A , m m
ACOCm
Qß .IO6 -
AACCAGl ACOCAR
ACCCTT4P
15D -
253 - m -
148 -
123 -
18a -
116 -
16 OD I I5
I 3 2 82 133
I I 1 -
PSE
'SE
LG F LG'G
- MCC906 13.7
OD 70
I44
31 49 O0 24 24
169
176
148
LGH . LG J LG K LG L LG I ACACIR.*** IPSE , --f AAGCTA7
OD AACCATlO A m
AcAcAA3 AACau AACw\o AACcrO AAGCAT8 ACKTCS ACACIA10 ACOCTA3 ACAUCI ACACnn
AAGCATIP
4 9 1 pcrcrrs
lb '-
na - IrAAcCTT1 DEW
32
OD Il5 287 -
Iz 16 ao
)EW ;z 16 65 16
1 17 35 -
142 - ' 1
LG M LG N
Fig.1 Genetic linkage map constructed from 62 backcross hy- brids derived from the interspecific cross [(PSExDEW)xDEW] showing the location of 168 AFLP and 12 m P . AFLP markers are described in terms of the three selective nucleotides used; for example, AACCTG8 - the EcoRI primer is given to the left (AAC), the MseI primer to the right (CTG). RFLP markers are pre- jìxed with G or AR for loci detected by the Arabusta cDNA clone and CA for loci detected by random genomic clones of C. arabica.
Recombination distances are given in centMorgans (cM), Kosam- bi units on the left side of each linkage group (LG) and markers names are given to the right of each LG. Fourteen LG covering 1,144 cM are indicated by letters A through N, ordered by their length. Loci marked *, **, ***, **** and ***** deviated signifi- cantly from a 1:l ratio at RO.01, P<O.OOl, P<O.OOOl, P<O.OOOOl and P<O.O00001, respectively. The lines specified by PSE or DEW correspond to distortion in favor of PSE and DEW, respectively
I . ' , I . *.

673
Table 2 Main ch&acteristics of the linkage groups (size, number of markers and distances) in the genetic map resulting from the 62 BCDEW hybrid progeny
~
Linkage groups Length (cM) Number of markers Means distances (cM) Min-ma (cM) distances
A 224.4 31 7.5 0.0-25.3 B 150.6 21 7.5 0.0-22.3 C 112.7 16 7.5 0.0-24.4 D 101.6 15 7.2 0.0-17.8 E 100.4 . 12 9.1 1.9-15.0 F 97.3 13 8. 1 0.0-17.6 G 96.1 19 5.3 0.0-20.1
0.0-28.7 0.0-22.0
H 70.7 13 5.9 I 51.8 11 5.2 J 48.6 11 4.9 . 0.0-24.4 K 26.9 5 6.7 0.0-20.3 L 25.2 6 5.0 0.0-12.6 M 19.7 4 6.7 0.0-16.8 N 18.2 4 6.1 1.6-13.4
O 2 4 6 8 10 12 14 16 18 20 22 24 26 28 30
Distance (cM)
Fig. 2 Distribution of the distance between two successive mark- ers
42
39 36 33
2 30 9 27
E 24 o 21 c
j 18 5 1s z 12
9 6
3 I l
(1:3) (1 :1) (3:v DEW Segregation type
Fig. 3 Distribution of the 181 markers mapped in the BCDEW progeny in relation to the relative contribution of PSE. The figure clearly shows a predominant fraction of markers presenting a Mendelian segregation of 1:l and two categories of segregation distorsion following a 3:l ratio in favor to PSE and a 1:3 ratio in favor to DEW
Table 3 Average number of segregation types of the 181 markers in the BCDEW progeny
Total bands Segregation ratio Other segregation scored (181) Distortion ratio*
1:1* 1:3* 3:1*
100% 70% 14% 12% 4%
* Significant at -0.05
markers (groups K-N). The genetic linkage map covered 1,144 cM.
The distances between 2 consecutive markers varied from O to 29 cM, with a mean of 7 cM. This distance dis- tribution, shown on Fig. 2, reveals a strong skewness. Among the 167 intervals, 60 were smaller than 2 cM (36%), and 12 were larger than 20 cM (7%). The small intervals were gathered together and eight clusters could be easily observed in the large- and medium-sized link- age groups (except for groups D and E on Fig. 1). The density on these clusters varied from 6 to 15 markers for an interval segment of 20 cM.
Segregation distortion
Segregatiqn distortion were observed for 30% of the loci (1 RFLP and 53 AFLP markers). The distribution of seg- regation ratio corresponded with three modes centred on three different ratios: (1:3, 1:l and 3:l; Fig. 3). We as- sume that there are mainly three segregation types result- ing in three binomial distributions, with the P parameter equal to 0.25, 0.5 and 0.75, respectively. Tested with chi- square, the distorted loci were classified as: (1) 26 loci (14% of the 181 markers) segregating according to a 1:3 ratio in favour of PSE; (2j 21 loci (12%) segregating as a 3: 1 ratio in favour of DEW; (3) 7 loci presenting strong- er distortion of segregation (Table 3). Proportions of 1:3 and 3: 1 loci were similar.
The distribution of the 54 distorted markers on the ge- netic map is illustrated in Fig. l. They were grouped at
1c ...:., - _. .___ ~ . . . ~ ... . . . . -?l-T-.-~TT-7"7-. .. . . . , . . . . : .

674 ’
the end of long and intermediatij,kkage groups ahd were not found on the 4 smaller groups. The segments which were distorted in favour of DEW constituted the whole of the H group and a part of the I group. The dis-
., . torted fragments in favour of PSE were located on 6 linkage groups: all of C, half of each of the B, E and F groups and, for 1 and 2 markers, on the J and G, groups, respectively.
Discussion
The PSExDEW interspecific coffee map consisted of 181 markers covering 1,144 CM distributed over 14 link- age groups. AFLP clusters were observed, suggesting the location of centromeric regions. This map also revealed a relative important portion of distorted loci (30%), which were symetrically distributed following 3:l and 1:3 ratios in favour of PSE (14%) and DEW (12%), re- spectively.
Genetic linkage map
PSE and DEW species have a strictly allogamous repro- ductive behaviour. Genitors are highly heterozygous and alleles segregate in the FI generation. The segregation of 2-4 alleles per loci and the impossibility in parents to distinguish between coupling and repulsion phase makes genetic mapping more complicated than for autogamous species. A double pseudo-test cross is then recommend- ed (Grattapaglia and Sederoff, 1994). Our approach con- stituted an altemative: we selected specific PSE markers so DEW gametes could be considered to be genetically homozygous (double absence) for these markers. In con- trast, the F, hybrids generated different gametes segre- gating in BCDEW hybrids. Consequently, the loci from parental or recombinant could be distinguished.
Fourteen linkage groups were identified for 11 chro- mosomes, an indication that the genome was not fully covered. Seven percent of 2 successive marker intervals were larger than 20 cM, confirming that additional mark- ers areneeded to cover all of the genome. The strong skewness of the distance distribution shows that this number should be high enough to fill all the large inter- vals.
Eight AFLP clusters were observed. Such clusters are known to characterise centromeric regions (Qi et al. 1998; Vuylstecke et al. 1999), and Alonsa-Blanco et al. (1998) used this property to locate the centromeric re- gion on chromosome 3 of Arabidopsis thaliana. In addi- tion, our markers emphasise (1) the very conserved parts of the PSE genome (no within-PSE polymorphism) and (2) the interspecific differentiation of the two genomes. Consequently, centromeric markers should be markers of speciation, thereby involving repeated sequences and im- plicated in chromosome pairing. Their presence on sev- eral centromers should also allow specific markers to be defined for chromosome in situ hybridisation studies.
The size difference. between intraspecific (1,402 cM) and interspecific (1 , 144 cM) maps would result from the lower genome homology between parents in an interspe- cific cross, reducing recombination and map size. For example, in potatoes, the map size of an interspecific cross was found to be 65% smaller than the intraspecific one (Bonierbale et al. 1988; Gebhardt, et al. 1991). In coffee, the map size of the intersp.ecific cross is 18% smaller than the intraspecific one on C. canephora: 1,144 CM (Paillard et al. 1996). The smaller difference between map sizes in coffee trees could reflect a higher genome homology in the genus Cuffea than in potatoes.
Among the 12 RFLP markers mapped, only.1 (CA 30) is common with the intraspecific map developed by Paillard et al. (1996), the other RFLP markers being ho- mozygous in C. canephora.
Segregation distortion
With AFLP markers, co-migration and superimposition of non-allelic amplification products is possible (Clou- tier et al. 1997) leading to pseudo-distortion of (3:l) ra- tio. With our two-step mapping method, the mapping of pseudo-distorted markers is not likely. Nevertheless, the symmetric situation between the 1:3 and 3:l ratios (Fig. 3) constitutes the main argument in favour of true dis- torted markers.
Skewed segregation ratios have been reported frequent- ly in interspecific cross for all types of markers (morpho- logical, isozyme, RFLP or AFLP). The percentage of loci showing segregation distortions was highly variable: 69% in Cryptomeria japonica (Nikaido et al. 1999), 37% in Citrus (Luro et al. 1994), 36% in Oryza (Xu et al. 1997; Virk et al. 1998), 33% in Prunus (Foolad et al. 1995), 23% in Helianthus (Quillet et al. 1995), 8.4% in Lens sp. (Eujayl et al. 1998) and only 1.4% in Hevea spp. (Lespin- asse et al. 2000). Comparedto these data, our distorted frequency appears to be intermediate, 30%:
In the genus Lycopersicum, based on a wild species crossed with the cultivated L. esculentum, interspecific crosses led to distortion rates varying from 51% to 80% (Paterson et al. 1988, 1991; de Vincenteand Tanksley 1993). Our cross included two species among the most differentiated of the genus (Lashermes et al. 1997), it should therefore be interesting to observe the variation of this parameter when the genetic distance between pa- rental species is lower.
The explanations given for such distortions are most- ly gametic, zygotic or/and post-zygotic selection, but these are not plausible in explaining a symmetric and polymodal distribution, especially 3:l and 1:3 ratios. In contrast, gene conversion implying DNA heteroduplex formation is known to give such ratios (Leblon and Ros- signol 1973; Nicolas and Rossignol 1983; Nag et al. 1989). Post-meiotic segregation is another process lead- ing to distortion segregation, but with 5.:3 and 3:5 ratios. A high rate of conversion i d low rate of post-meiotic segregation reflect a high level of heteroduplex forma-

675
Barre P (1997) Les transferts de gènes entre espbces de caféiers diplo: étude des hybrides F, et BC, entre C. pseudozangueb- ariae Bridson et C. liberica Bull ex Hiem (C. dewevrei De Wild et Th. Dur). PhD thesis, Ecole Nationale Supérieure Ag- ronomique de Montpellier, France
Barre P, Noirot M, Louarn J, Duperray C, Hamon S (1996) Reli- able flow cytometric estimation of nuclear DNA content in coffee trees. Cytometry 2432-38
Barre P, Akaffou S, Louarn J, Charrier A, Hamon S, Noirot M (1998) Inheritance of caffeine and heteroside contents in an in- terspecific cross between a cultivated coffee species Coflea liberica var ‘dewevrei’ and a wild species caffeine free C. pseudozanguabariae. Theor Appl Genet: 96:306-3 1 1
Bonierbale MW, Plaisted RL, Tanksley SD (1988) RFLP maps based on a common set of clones reveal modes of chromosom- al evolution in potato and tomato. Genetics 120:1095-1103
Bridson DM (1987) Nomenclatural notes on Psilanfhus, including Coffea sect. Paracoffea (Rubiaceae tribe Coffeeae). Kew Bull
Carvalho A, Monaco LC (1967) Genetic relationships of selected CofSea species. Cienc Cult 19:151-165
Charrier A (1978) La structure génétique des caféiers spontanés de la région malgache et leurs relations avec les caféiers d’origine africaine (Eucoffea). PhD thesis, Mémoire ORSTOM, Paris, no. 87
Cloutier S, Cappadocia M, Landry BS (1997) Analysis of RFLP mapping inaccuracy in Brassica napus L. Theor Appl Genet
De Vicente MC, Tanksley SD (1993) QTL analysis of transgress- ive segregation in an interspecific tomato cross. Genetics 134:
Dolezel J, Binarova P, Lucretti S (1989) Analysis of nuclear DNA content in plant cells by flow cytometry. Bio1 Plant 32:113- 120
Doyle JJ, Doyle JL (1987) A rapid DNA isolation procedure for small quantities of fresh leaf tissue. Phytochem Bull 19:ll- 15
Eujayl I, Baum M, Powell W, Erskine W, Pehu E (1998) A genetic linkage map of lentil (Lens sp.) based on RAPD and AFLP markers using recombinant inbred lines. Theor Appl Genet
Foolad MR, Arulsekar S, Becerra V, Bliss FA (1995) A genetic map of Prunus based on an interspecific cross between peach and almond. Theor Appl Genet 91:262-269
Gadish I, Zamir D (1986) Differential zygotic abortion in an inter- specific Lycopersicum cross. Genome 29: 156-159
Gebhardt C, Ritter E, Barone A, Debener T, Walkemeier B, Schachtschabel U, Kaufmann H, Thompson RD, Bonierbale MW, Gand MW, Tanksley SD (1991) R E P maps of potato and their alignment with the homologous tomato genome. Theor Appl Genet 83:49-57
Grant V (1975) Genetics of flowering plants. Columbia University Press, New York
Grattapaglia D, Sederoff R (1994) Genetic linkage maps of Euca- lyptus grandis and Eucalyptus urophylla using a pseudo-test- cross mapping strategy and RAPD markers. Genetics 137:
Kosambi DD (1944) The estimation of map distances recombina- tion values. Ann Eugen 12:172-175
Ky C-L, Louarn J, Guyot B, Charrier A, Hamon S, Noirot M (1999) Relations between and inheritance of chlorogenic acids contents in an interspecific cross between C. pseudozanguab- ariae and Coffea liberica var ‘dewevrei’. Theor Appl Genet 98:628-637
Ky C-L, Doulbeau S, Guyot B, Akkafou S, Charrier A, Hamon S, Louarn J, Noirot M (2000) Inheritance of coffee bean sucrose content in the interspecific cross: Coffea pseudozungueb- ariaexcoffea lihericu ‘dewevrei’. Plant Breed 119: 165-168
Lashermes P, Combes MC, Trouslot P, Charrier A (1997) Phyloge- netic relationships of coffee-tree species (CofSea L.) as in- ferred from ITS sequences of nuclear ribosomal DNA. Theor Appl Genet 94947-955
- .
36:817-860
95~83-91
585-596
97:83-89
-
1121-1137
tion and efficient repair of the resulting mismatch (Nag et al. 1989). This explanation fits well with our results. A high rate of heteroduplex formation and mismatch are expected during meiosis pairing in interspecific hybrids. This phenomenum could be due to differences in DNA amount &ong parents as the DEW genome size is 25% higher than PSE one (Barre et al. 1996). The intergeneric cross Citrus reticulataXPoncirus trifoliata (tangerine treexgrapefruit tree) studied by. Luro et al. (1994) showed 37% of distorted loci (for both RFLPs and RAPDs). Although not emphasised by authors, the data clearly show two types of distorted markers: 9 markers in favour of Poilcirus with P=0.30 and 29 markers in fa- vour of Citrus with P=0.75. Again the P values fit well with the 1:3 and 3:l ratio, respectively. Obviously, gene conversion seems to characterise a interspecific cross and does not depend on the type of marker (AFLP, RFLP and RAPD). These results led us to develop software to test such ratios. MAPDTSTO (the software) is available on the website: http://www. mpl.ird.fr/-lorieux.
Perspectives
The present work demonstrates the feasibility of an AFLP marker-based genetic linkage map of the diploid coffee genome. This map is a starting point for further molecular studies in coffee genetics.
Firstly, this map could be used to identify quantitative trait loci (QTL) for highly discriminant and specific traits. Biochemical traits implied in the coffee cup quali- ty will be interesting because of the differences between species. This is the case for caffeine with 0% in PSE and 1% in DEW (Barre et al. 1998), the chlorogenic acids with 1.2% in PSE and 5.5% in DEW (Ky et al. 1999) and sucrose (8% in PSE and 3% in DEW (Ky et al. 2000). Identification and location of interspecific QTL will lead to the use of bordering molecular markers as tools for assisting in the introgression of this interesting characteristic from wild coffee to cultivated coffee spe- cies (molecular assisted selection).
Secondly, this map could be used to select AFLP markers for sequencing and obtaining Co-dominant PCR markers. These markers will be used to compare our re- sults with other interspecific maps currently in progress, such as these three from crosses under study: C. pseudo- zanguebariaexc. canephora, C. heterocalyxxC. caneph- ora and C. eugenioidesxc. canephora. And, finally, se- quenced AFLP of either distorted loci or clustered loci will permit meiotic pairing mismatching using in situ hy- bridisation.
References Alonso-Blanco C, Peeters AJM, Koornneef M, Lister C, Dean C,
Van den Bosch N, Pot J Kuiper MTR (1998) Development of an AFLP based map of Ler, Col and Cvi Arabidopsis fhaliana ecotypes and construction of a Ler/ Cvi recombinant inbred lines population. Plant J 14:259-271
s . . . '. ..
I -676
Lander ES, Green P, Abrahamson J, Barlow A, Daly MJ, Lincoln SE, Newburg L (1987) MAPMAKER: an interactive computer package for primary genetic linkage maps of experimental and natural populations. Genomics 1:174-181
Leblon G, Rossignol JL (1973) Mechanism of gene conversion in Ascobolus immersus. The interaction of heteroalleles in the conversion process. Mol Gen Genet 122:165-182
Leroy JF (1980) Evolution et taxogénnbse chez les caféiers (CofJea L., Psilanthus Hook. f.' et Nostoluchma Durand). Hypothese sur leur origine. C R Acad Sci 291:593-596
Lespinasse D, Rodier-Goud M, Grivet L, Leconte A, Legnate H, Seguin M (2000) A saturated genetic linkage map of rubber tree (Hevea spp.) based on RFLP, AFLP, microsatellite, and isozyme markers. Theor Appl Genet 100127-138
Lincoln S, Daly M, Lander E (1992) Constructing genetic maps with MAPMAKER~EXP version 3.0. Whitehead Institute Techni- cal Report, 3rd edn., Cambridge, Mass.
Louarn J (1992) La fertilité des hybrides interspécifiques et les re- lations génomiques entre les caféiers diplo d'origines afri- caines (Genre CofJea L. sous-genre Coffea), PhD thesis, Uni- versity of Orsay, France
Luro F, Lorieux M, Laigret F, Bové JM, Ollitrault P (1994) Car- tographie du génome des agrumes & l'aide des marqueurs moléculaires et distorsions de ségrégation. In: Berville and Tersac (eds) Techniques et utilisations des marqueurs molécul- aires, vol. 72. INRA, Montpellier, France, pp 72:69-82
Meksem K, Leister D, Peleman J, Zabeau M, Slamini F, Gebhardt C (1995) A high-resolution map of the vinicity of the R1 locus on chromosome V of potato based on RFLP and AFLP mark- ers. Mol Gen Genet 249:74-81
Nag DK, White MA, Petes TD (1989) Palindromic sequences in heteroduplex DNA inhibit mismatch repair in yeast. Nature
Nicolas A, Rossignol JL (1983) Gene conversion: point-mutation heterozygosities lower heteroduplex formation. EMBO J 2
Nikaido A, Yoshimam H, Tsumura Y, Suyama Y, Murai M, Nagasaka K (1999) Segregation distortion for AFLP markers in Cryptomeria japonica. Genes Genet Systems 7455-59
Paillard M, Lashermes P, Pétiard V (1996) Construction of a link- age map in coffee. Theor Appl Genet 93:41-47
Paterson AH, Lander ES, Hewitt JD, Peterson S, Lincoln SE, Tanksley SD (1988) Resolution of quantitative traits into Men-
340~318-320
2265-2270
delian factors by using a complete linkage map of restriction fragment length polymorphisms. Nature 335:721-726
Paterson AH, Damon S, Hewitt JD, Zamir D, Rabinowitch HD, Lincoln SE, Lander ES, Tanksley SD (1991) Mendelian fac- tors underlying quantitative traits in tomato: comparison across species, generations, and envimnments. Genetics 127:
Qi X, Stam P, Lindhout P (1998) Use of locus-specific AFLP markers to construct a high density molecular map in barley. Theor Appl Genet 96:376-384
Quillet MC, Madjidan N, Griveau Y, Serieys H, Tersac M, Lorieux M, Bervillé A (1995) Mapping genetic factors controlling pol- len viability in an interspecific cross in Helianthics sect. Hel- ianthus. Theor Appl Genet 91:1195-1202
Thomas CM, Vos P, Zabeau M, Jones DA, Norcott KA, Chadwick BP, Jones JDG (1995) Identification of amplified restriction fragment polymorphism (AFLP) markers tightly linked to the tomato Cf-9 gene for resistance to Cladosporiumfilvum. Plant
Virk PS, Ford-Lloyd BV, Newbury HJ (1998) Mapping AFLP markers associated with subspecific differentiation of Oryza sativa (rice) and an investigation of segregation distortion. He- redity 81 :6 13-620
Vos P, Hogers R, Bleeker M, Reijans M, van de Lee T, Hornes M, Frijters A, Pot J, Peleman J, Kuiper M, Zabeau M (1995) AFLP: a new technique for DNA fingerprinting. Nucleic Ac- ids Res 23:4407-4414
Vuylsteke M, Mank R, Antonise R, Bastiaans E, Senior ML, Stu- ber CW, Melchinger AE, Liibberstedt T, Xia XC, Stam P, Zabeau M, Kuiper M (1999) Two high-density AFLP linkage maps of Zea mays L.: analysis of distribution of AFLP mark- ers. Theor Appl Genet 99:921-935
Xu Y, Zhu L, Xiao J, Huang N, McCouch SR (1997) Chromosom- al regions associated with segregation distortion of molecular markers in F,, backcross, double haploids, and recombinant inbred populations in rice (Oryza sativa L.). Mol Gen Genet
Zabeau M, Vos P (1993) Selective restriction fragment amplifica- tion: a general method for DNA fingerprinting. European Patent Application number: 92402629.7, Publ. no. O 534 858 A l
Zamir D, Tadmor Y (1986) Unequal segregation of nuclear genes in plants. Bot Gaz 147:355-358
181-197
J 8:785-794
253~535-545
' I

r
----.._I_-