interpreting the efficacy of frequency-lowering...
TRANSCRIPT
Interpreting the efficacy of frequency-lowering algorithmsBy Francis Kuk, Denise Keenan, Jane Auriemmo, Petri Korhonen, Heidi Peeters, Chi Lau, and Bryan Crose
Despite a long history of research and commercial efforts,1
hearing aids with frequency-lowering algorithms havebecome popular only recently. Their lack of commer-cial success may be attributed in part to the immaturityof analog technology when these devices were intro-duced such that artifacts were plentiful. But insufficienttraining provided to the wearers of such devices, unre-alistic expectations, and inadequate means to evaluatetheir efficacy are equally important contributors to thelimited acceptance for this technology.
Widex re-introduced the concept of linear frequencytransposition in its Inteo hearing aid in 2006 under thename Audibility Extender.2 Since then, we have exploredvarious avenues to better understand how such a fea-ture can be fitted3,4 and its use facilitated.5 Just as impor-tant, we also studied (and developed) research tools thatmay be optimal for evaluating such an algorithm. Oureffort led us to report on the efficacy of such an algo-rithm in a simulated hearing loss,6 in an open-tube fit-ting,7 in children,8 and in adults in quiet and in noise.9
We have learned that demonstrating the efficacy of afrequency-lowering algorithm is not a straightforwardmatter. We would like to share our experience in thispaper.
WHAT IS AN ADEQUATE EVALUATION?Any evaluation must begin with the assumption thatthe optimal settings have been verified. That is, the hear-ing aid settings are indeed providing the potential forthe added audibility. Verification does not guaranteethat the Audibility Extender (AE) algorithm is helpful
and/or produces meaningful changes. It simply verifiesthat the algorithm results in “optimal” acoustic changesthat are needed for improved performance. If the set-tings are not optimal, one cannot draw any conclusionon the efficacy of the processing algorithm. See Kuket al.3 for a brief description on how to verify the AEsettings using the SoundTracker.
An adequate evaluation informs the clinician (andpatient) how changes in the acoustic condition (i.e.,from using the AE) affect the patient’s performance.However, performance is not an all-or-nothing phenom-enon. While one may not notice any substantive changeson one task, changes may occur on other tasks. Indeed,one lesson we have learned is that a battery of tests vary-ing in the cognitive/integrative demand is necessary toevaluate the efficacy of the AE.
THE EVALUATION BATTERYThe auditory system is capable of handling tasks of vary-ing complexity. Auditory signals must be detectable (oraudible) before they can be discriminated. However,being discriminable does not guarantee that they can beidentified. Thus, evaluation needs to be inclusive andmulti-leveled. Otherwise, an incomplete picture of theefficacy may result.
Detection
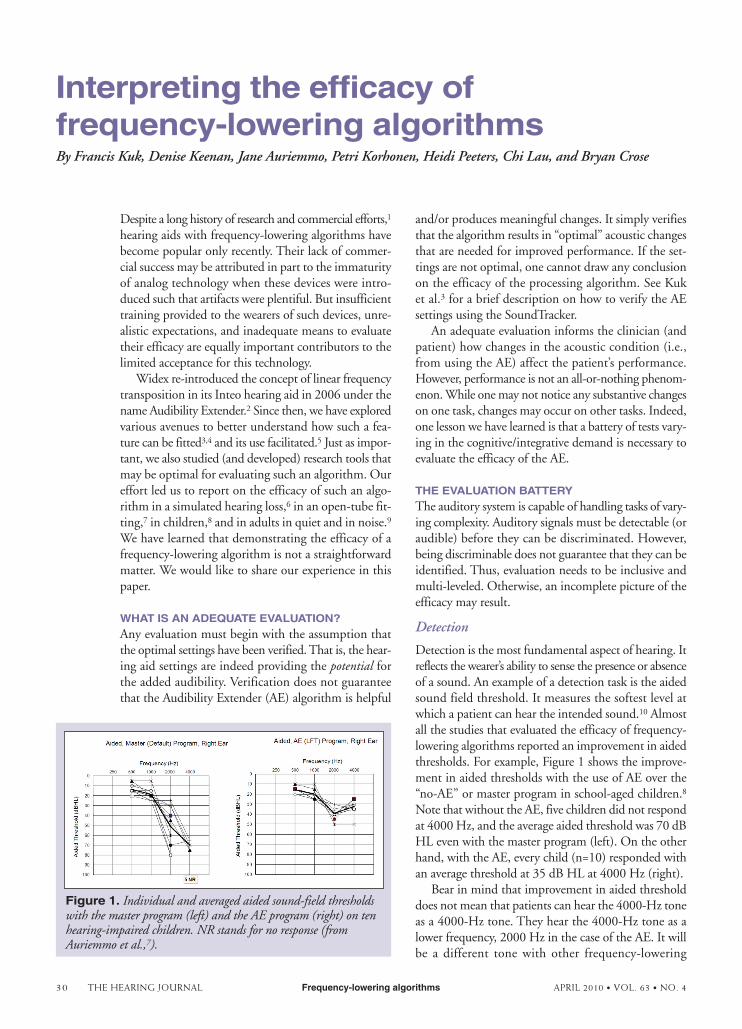
Detection is the most fundamental aspect of hearing. Itreflects the wearer’s ability to sense the presence or absenceof a sound. An example of a detection task is the aidedsound field threshold. It measures the softest level atwhich a patient can hear the intended sound.10 Almostall the studies that evaluated the efficacy of frequency-lowering algorithms reported an improvement in aidedthresholds. For example, Figure 1 shows the improve-ment in aided thresholds with the use of AE over the“no-AE” or master program in school-aged children.8
Note that without the AE, five children did not respondat 4000 Hz, and the average aided threshold was 70 dBHL even with the master program (left). On the otherhand, with the AE, every child (n=10) responded withan average threshold at 35 dB HL at 4000 Hz (right).
Bear in mind that improvement in aided thresholddoes not mean that patients can hear the 4000-Hz toneas a 4000-Hz tone. They hear the 4000-Hz tone as alower frequency, 2000 Hz in the case of the AE. It willbe a different tone with other frequency-lowering
30 THE HEARING JOURNAL Frequency-lowering algorithms APRIL 2010 • VOL. 63 • NO. 4
Figure 1. Individual and averaged aided sound-field thresholdswith the master program (left) and the AE program (right) on tenhearing-impaired children. NR stands for no response (fromAuriemmo et al.,7).

schemes. The important point is that information carried bythe 4000-Hz tone is now decoded by the neurons responsiblefor the 2000-Hz (or other lower frequencies) auditory fibers.
An improvement in sound detection can also be assuredwhen patients report increased awareness of sounds in theirdaily environments. Often patients comment on a “fuller rangeof sounds,” “feeling less fatigue,” and “increased comfort” withthe use of the AE program. These are reflections of the bene-fits of frequency lowering as more sounds become available.These benefits should be documented as indications ofimproved sound detection. This level of benefit may be imme-diately measurable with the use of the AE.
We have developed a checklist to measure improvementin sound awareness. This list (Figure 2) identifies 76 soundsthat typically occur in everyday listening situations. After thefitting and verification of the AE (or any other hearing aids),we give this checklist to the patient and ask him or her tocheck off the sounds that are audible without the hearing aid,with the hearing aid in the master program, and with the hear-ing aid in the AE program. A difference in the number ofsounds heard between the unaided and the aided conditionsreflects the improvement offered by that hearing aid condi-tion. Furthermore, using this checklist can help heighten thepatient’s awareness to sounds in general (and to the AE in par-ticular).
Discrimination
Discrimination refers to the ability to tell if two sounds aredifferent from each other. This usually involves a “same-different” paradigm in which the wearer is presented with twosounds and asked to judge if they are the same or different. Avariant of this is seen in tasks that ask the wearer if the singu-lar form of a word (e.g., cat) is different from its plural form(e.g., cats). A discrimination task does not require the wearerto identify the meaning of the sound, simply to indicate if thesounds are different from each other.
While good performance on a discrim-ination task reflects the patient’s ability touse the newfound audibility (from ampli-fication and frequency lowering) to dis-cern differences between sounds, it doesnot guarantee that the person can identifyeither of the sounds or use that differencefor higher processing. As evidence, someearlier research found improvement in dis-crimination tasks but not on identifica-tion ability.11 For that reason, we focusedour effort on the higher level ofprocessing/testing (i.e., identification)instead of on discrimination tasks.
Discrimination tasks often use speechstimuli and are therefore sometimes called“speech discrimination tests.” However, inclinical audiology, speech-identification/-recognition tests such as the W-22 andNU-6 have also been referred to as speech-discrimination tests. For that reason, it
could be confusing to call a discrimination task using speechmaterials a “speech-discrimination test.” Clinicians must under-stand the nature of the evaluation task and not assume that allspeech tests require identification skills, since they may requireonly discrimination ability.
Identification
The ability of hearing aid wearers to identify sounds requiressufficient audibility of the necessary cues that are keys to iden-tifying the target sound. In addition, the wearer must be ableto match the sound(s) to his/her repertoire. This can becomean issue in evaluating the efficacy of frequency-lowering devicesin that the improved audibility may be “foreign” to the wearerand delay identification of the sound.
Simple sounds (i.e., those with simple spectral and tempo-ral structures) are easier to relearn and identify. But more com-plex sounds such as speech may be more difficult to identifyeven though audibility is guaranteed. Sometimes, a subjectivechange in sound quality accompanies the improvement insound identification. There are many considerations whenusing speech-identification tests as a measure of the efficacy offrequency lowering.
CONSIDERATIONS IN CURRENT SPEECH TESTS
Think high-frequency sounds
Frequency-lowering algorithms work to ensure the audibil-ity of high-frequency sounds that are either inaudible or unus-able when amplified with conventional means. Given today’sadvances in hearing aids, such as a broader bandwidth andactive feedback cancellation, the hearing loss in the high fre-quencies must be severe to profound for frequency loweringto provide unequivocal benefit. In today’s terminology, thehigh frequencies should be “dead” so the recoding of thehigh-frequency sounds is the only way to gain access to them.This means the evaluation materials must include sufficient
Figure 2. Widex developed this checklist to be used to sensitize hearing aid wearers’ attention to some sounds in their daily environments.
32 THE HEARING JOURNAL Frequency-lowering algorithms APRIL 2010 • VOL. 63 • NO. 4
information in the high frequencies to provide a basis forevaluating the efficacy of frequency lowering.
High-frequency content varies by gender
The typical speech tests now used in the clinic are monosyl-labic words presented in quiet or sentence tests presented innoise. Although these tests may be suitable for a general eval-uation of word comprehension, they may not be optimal forthe evaluation of frequency-lowering devices for several rea-sons.
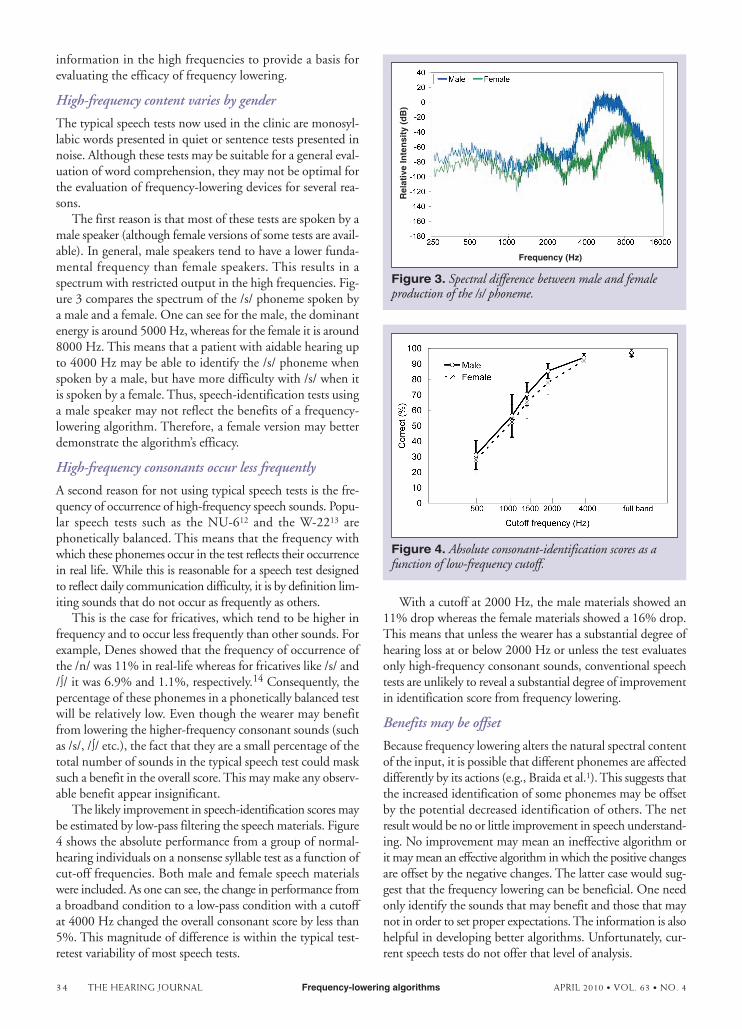
The first reason is that most of these tests are spoken by amale speaker (although female versions of some tests are avail-able). In general, male speakers tend to have a lower funda-mental frequency than female speakers. This results in aspectrum with restricted output in the high frequencies. Fig-ure 3 compares the spectrum of the /s/ phoneme spoken bya male and a female. One can see for the male, the dominantenergy is around 5000 Hz, whereas for the female it is around8000 Hz. This means that a patient with aidable hearing upto 4000 Hz may be able to identify the /s/ phoneme whenspoken by a male, but have more difficulty with /s/ when itis spoken by a female. Thus, speech-identification tests usinga male speaker may not reflect the benefits of a frequency-lowering algorithm. Therefore, a female version may betterdemonstrate the algorithm’s efficacy.
High-frequency consonants occur less frequently
A second reason for not using typical speech tests is the fre-quency of occurrence of high-frequency speech sounds. Popu-lar speech tests such as the NU-612 and the W-2213 arephonetically balanced. This means that the frequency withwhich these phonemes occur in the test reflects their occurrencein real life. While this is reasonable for a speech test designedto reflect daily communication difficulty, it is by definition lim-iting sounds that do not occur as frequently as others.
This is the case for fricatives, which tend to be higher infrequency and to occur less frequently than other sounds. Forexample, Denes showed that the frequency of occurrence ofthe /n/ was 11% in real-life whereas for fricatives like /s/ and/∫/ it was 6.9% and 1.1%, respectively.14 Consequently, thepercentage of these phonemes in a phonetically balanced testwill be relatively low. Even though the wearer may benefitfrom lowering the higher-frequency consonant sounds (suchas /s/, /∫/ etc.), the fact that they are a small percentage of thetotal number of sounds in the typical speech test could masksuch a benefit in the overall score. This may make any observ-able benefit appear insignificant.
The likely improvement in speech-identification scores maybe estimated by low-pass filtering the speech materials. Figure4 shows the absolute performance from a group of normal-hearing individuals on a nonsense syllable test as a function ofcut-off frequencies. Both male and female speech materialswere included. As one can see, the change in performance froma broadband condition to a low-pass condition with a cutoffat 4000 Hz changed the overall consonant score by less than5%. This magnitude of difference is within the typical test-retest variability of most speech tests.
With a cutoff at 2000 Hz, the male materials showed an11% drop whereas the female materials showed a 16% drop.This means that unless the wearer has a substantial degree ofhearing loss at or below 2000 Hz or unless the test evaluatesonly high-frequency consonant sounds, conventional speechtests are unlikely to reveal a substantial degree of improvementin identification score from frequency lowering.
Benefits may be offset
Because frequency lowering alters the natural spectral contentof the input, it is possible that different phonemes are affecteddifferently by its actions (e.g., Braida et al.1). This suggests thatthe increased identification of some phonemes may be offsetby the potential decreased identification of others. The netresult would be no or little improvement in speech understand-ing. No improvement may mean an ineffective algorithm orit may mean an effective algorithm in which the positive changesare offset by the negative changes. The latter case would sug-gest that the frequency lowering can be beneficial. One needonly identify the sounds that may benefit and those that maynot in order to set proper expectations. The information is alsohelpful in developing better algorithms. Unfortunately, cur-rent speech tests do not offer that level of analysis.
Figure 3. Spectral difference between male and femaleproduction of the /s/ phoneme.
Frequency (Hz)
Rel
ativ
e In
ten
sity
(d
B)
Figure 4. Absolute consonant-identification scores as afunction of low-frequency cutoff.
34 THE HEARING JOURNAL Frequency-lowering algorithms APRIL 2010 • VOL. 63 • NO. 4

AN ANALYTIC NONSENSE SYLLABLE TESTIn view of such a difficulty, we devised a nonsense bisylla-ble test (ORCA-NST), which has a consonant-vowel-con-sonant-vowel-consonant (CVCVC) format. This is an
open-set test that contains all 23 Eng-lish consonants, with each appearing atleast once in the initial, medial, and finalword positions (unless prohibited). Thereare a total of 115 items on the list (inrandom order). A female and a malespeaker version of the test, in full (115items) and shortened (32 items), areavailable. A detailed description of thetest, including normative data, is foundin Kuk et al.15 One advantage is that atthe end of the test a display of the scoresfor each phoneme class is immediatelyavailable.
We evaluated the efficacy of the AE oneight hearing-impaired adults with a severeto profound high-frequency hearing lossusing the ORCA-NST.9 Figure 5 showsthe performance on each phoneme class(fricatives, affricates, stops, nasals, approx-imants) at four hearing aid time intervals(visit 1 - master or no AE, visit 2 - AEbaseline, visit 3 - AE at 1 month with
training, and visit 4 - AE at 2 months without training). Onecan see that for fricatives and affricates the benefit of the AEwas immediate. There was a 10% improvement in fricativeidentification even at the initial fit (without any training).
Figure 5. Absolute identification scores on the ORCA-NST for five phonemeclasses at four hearing aid intervals: v1 – master or no AE (LFT) at initial fit; v2– AE at initial fit; v3 – AE at one month use; and v4 – AE at 2 month use. Themagnitude of the standard deviation is included (from Kuk et al.9).
36 THE HEARING JOURNAL Frequency-lowering algorithms APRIL 2010 • VOL. 63 • NO. 4
Furthermore, the benefit in fricative and affricate identifica-tion improved over time.
For other phoneme classes, notably stops, there was aninitial decline in identification, which reverted itself overtime. For example, there was a 10% decrease of stop conso-nants over the master program at initial fit. That decreasenarrowed over time. After 2 months, the identification ofthe stop consonants with the AE program was higher thanwith the master program. This was also true for the otherconsonants. This shows that a speech test that allows analy-sis of phoneme errors could offer more insights into howfrequency lowering may haveaffected speech perception at the fun-damental level.
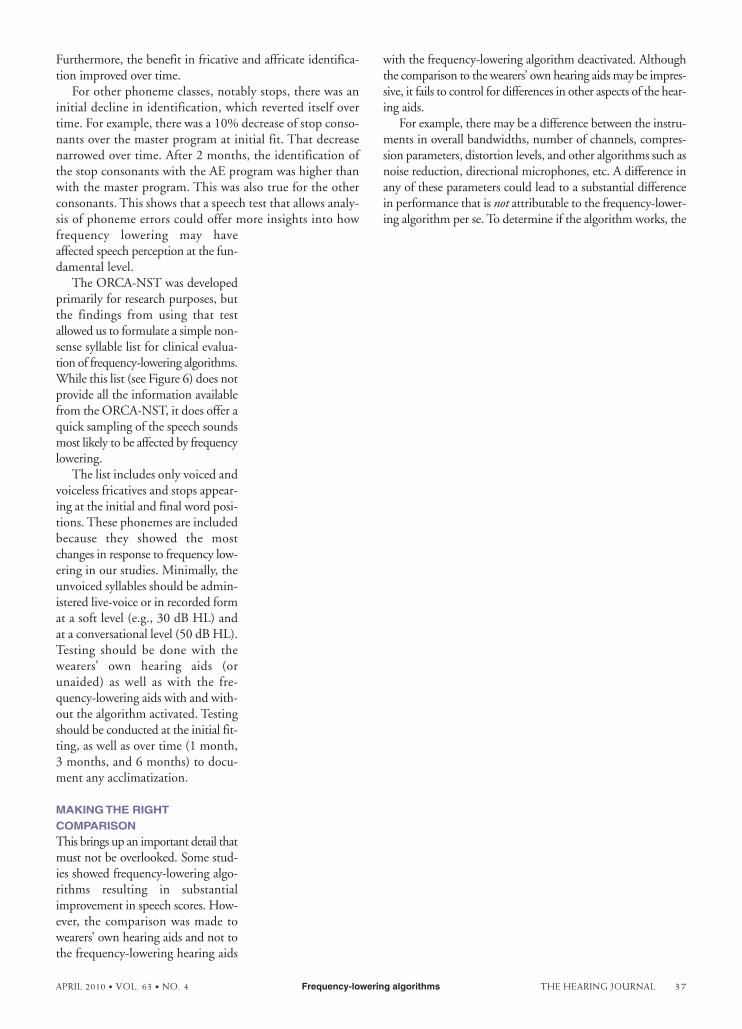
The ORCA-NST was developedprimarily for research purposes, butthe findings from using that testallowed us to formulate a simple non-sense syllable list for clinical evalua-tion of frequency-lowering algorithms.While this list (see Figure 6) does notprovide all the information availablefrom the ORCA-NST, it does offer aquick sampling of the speech soundsmost likely to be affected by frequencylowering.
The list includes only voiced andvoiceless fricatives and stops appear-ing at the initial and final word posi-tions. These phonemes are includedbecause they showed the mostchanges in response to frequency low-ering in our studies. Minimally, theunvoiced syllables should be admin-istered live-voice or in recorded format a soft level (e.g., 30 dB HL) andat a conversational level (50 dB HL).Testing should be done with thewearers’ own hearing aids (orunaided) as well as with the fre-quency-lowering aids with and with-out the algorithm activated. Testingshould be conducted at the initial fit-ting, as well as over time (1 month,3 months, and 6 months) to docu-ment any acclimatization.
MAKING THE RIGHTCOMPARISONThis brings up an important detail thatmust not be overlooked. Some stud-ies showed frequency-lowering algo-rithms resulting in substantialimprovement in speech scores. How-ever, the comparison was made towearers’ own hearing aids and not tothe frequency-lowering hearing aids
with the frequency-lowering algorithm deactivated. Althoughthe comparison to the wearers’ own hearing aids may be impres-sive, it fails to control for differences in other aspects of the hear-ing aids.
For example, there may be a difference between the instru-ments in overall bandwidths, number of channels, compres-sion parameters, distortion levels, and other algorithms such asnoise reduction, directional microphones, etc. A difference inany of these parameters could lead to a substantial differencein performance that is not attributable to the frequency-lower-ing algorithm per se. To determine if the algorithm works, the
APRIL 2010 • VOL. 63 • NO. 4 Frequency-lowering algorithms THE HEARING JOURNAL 37
comparison must be made on the same hearing aid with thefrequency-lowering algorithm turned “on” and “off.”
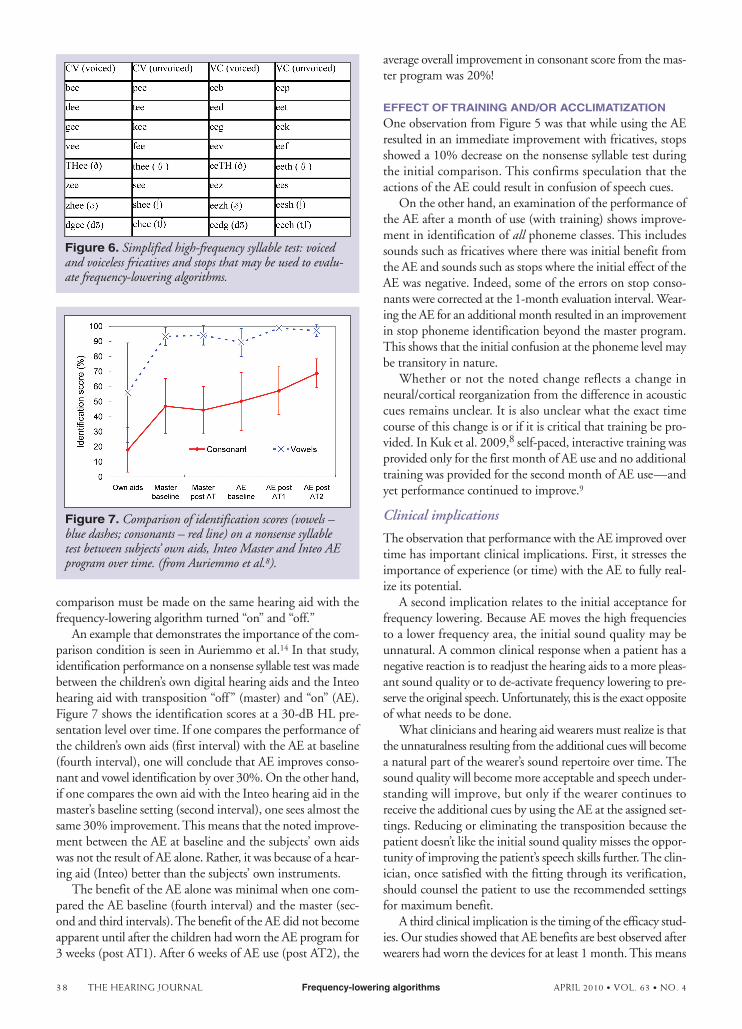
An example that demonstrates the importance of the com-parison condition is seen in Auriemmo et al.14 In that study,identification performance on a nonsense syllable test was madebetween the children’s own digital hearing aids and the Inteohearing aid with transposition “off” (master) and “on” (AE).Figure 7 shows the identification scores at a 30-dB HL pre-sentation level over time. If one compares the performance ofthe children’s own aids (first interval) with the AE at baseline(fourth interval), one will conclude that AE improves conso-nant and vowel identification by over 30%. On the other hand,if one compares the own aid with the Inteo hearing aid in themaster’s baseline setting (second interval), one sees almost thesame 30% improvement. This means that the noted improve-ment between the AE at baseline and the subjects’ own aidswas not the result of AE alone. Rather, it was because of a hear-ing aid (Inteo) better than the subjects’ own instruments.
The benefit of the AE alone was minimal when one com-pared the AE baseline (fourth interval) and the master (sec-ond and third intervals). The benefit of the AE did not becomeapparent until after the children had worn the AE program for3 weeks (post AT1). After 6 weeks of AE use (post AT2), the
average overall improvement in consonant score from the mas-ter program was 20%!
EFFECT OF TRAINING AND/OR ACCLIMATIZATIONOne observation from Figure 5 was that while using the AEresulted in an immediate improvement with fricatives, stopsshowed a 10% decrease on the nonsense syllable test duringthe initial comparison. This confirms speculation that theactions of the AE could result in confusion of speech cues.
On the other hand, an examination of the performance ofthe AE after a month of use (with training) shows improve-ment in identification of all phoneme classes. This includessounds such as fricatives where there was initial benefit fromthe AE and sounds such as stops where the initial effect of theAE was negative. Indeed, some of the errors on stop conso-nants were corrected at the 1-month evaluation interval. Wear-ing the AE for an additional month resulted in an improvementin stop phoneme identification beyond the master program.This shows that the initial confusion at the phoneme level maybe transitory in nature.
Whether or not the noted change reflects a change inneural/cortical reorganization from the difference in acousticcues remains unclear. It is also unclear what the exact timecourse of this change is or if it is critical that training be pro-vided. In Kuk et al. 2009,8 self-paced, interactive training wasprovided only for the first month of AE use and no additionaltraining was provided for the second month of AE use—andyet performance continued to improve.9
Clinical implications
The observation that performance with the AE improved overtime has important clinical implications. First, it stresses theimportance of experience (or time) with the AE to fully real-ize its potential.
A second implication relates to the initial acceptance forfrequency lowering. Because AE moves the high frequenciesto a lower frequency area, the initial sound quality may beunnatural. A common clinical response when a patient has anegative reaction is to readjust the hearing aids to a more pleas-ant sound quality or to de-activate frequency lowering to pre-serve the original speech. Unfortunately, this is the exact oppositeof what needs to be done.
What clinicians and hearing aid wearers must realize is thatthe unnaturalness resulting from the additional cues will becomea natural part of the wearer’s sound repertoire over time. Thesound quality will become more acceptable and speech under-standing will improve, but only if the wearer continues toreceive the additional cues by using the AE at the assigned set-tings. Reducing or eliminating the transposition because thepatient doesn’t like the initial sound quality misses the oppor-tunity of improving the patient’s speech skills further. The clin-ician, once satisfied with the fitting through its verification,should counsel the patient to use the recommended settingsfor maximum benefit.
A third clinical implication is the timing of the efficacy stud-ies. Our studies showed that AE benefits are best observed afterwearers had worn the devices for at least 1 month. This means
38 THE HEARING JOURNAL Frequency-lowering algorithms APRIL 2010 • VOL. 63 • NO. 4
Figure 7. Comparison of identification scores (vowels –blue dashes; consonants – red line) on a nonsense syllabletest between subjects’ own aids, Inteo Master and Inteo AEprogram over time. (from Auriemmo et al.8).
Figure 6. Simplified high-frequency syllable test: voicedand voiceless fricatives and stops that may be used to evalu-ate frequency-lowering algorithms.
that the evaluation of AE efficacy is an on-going process andcannot be completed at the initial fitting.
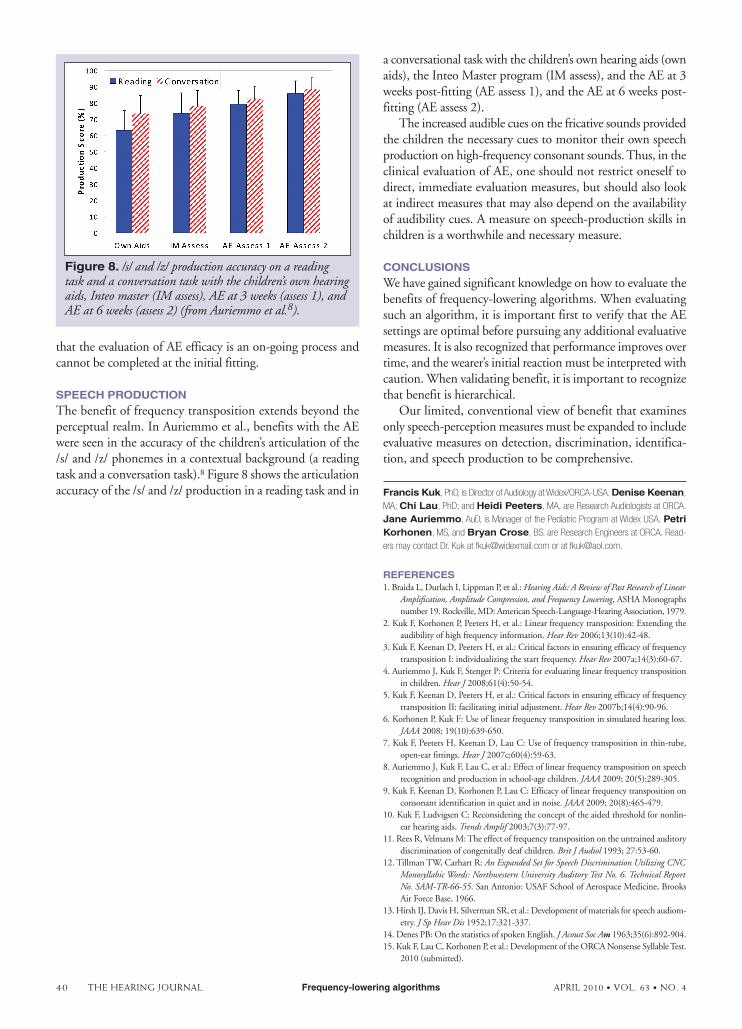
SPEECH PRODUCTIONThe benefit of frequency transposition extends beyond theperceptual realm. In Auriemmo et al., benefits with the AEwere seen in the accuracy of the children’s articulation of the/s/ and /z/ phonemes in a contextual background (a readingtask and a conversation task).8 Figure 8 shows the articulationaccuracy of the /s/ and /z/ production in a reading task and in
a conversational task with the children’s own hearing aids (ownaids), the Inteo Master program (IM assess), and the AE at 3weeks post-fitting (AE assess 1), and the AE at 6 weeks post-fitting (AE assess 2).
The increased audible cues on the fricative sounds providedthe children the necessary cues to monitor their own speechproduction on high-frequency consonant sounds. Thus, in theclinical evaluation of AE, one should not restrict oneself todirect, immediate evaluation measures, but should also lookat indirect measures that may also depend on the availabilityof audibility cues. A measure on speech-production skills inchildren is a worthwhile and necessary measure.
CONCLUSIONSWe have gained significant knowledge on how to evaluate thebenefits of frequency-lowering algorithms. When evaluatingsuch an algorithm, it is important first to verify that the AEsettings are optimal before pursuing any additional evaluativemeasures. It is also recognized that performance improves overtime, and the wearer’s initial reaction must be interpreted withcaution. When validating benefit, it is important to recognizethat benefit is hierarchical.
Our limited, conventional view of benefit that examinesonly speech-perception measures must be expanded to includeevaluative measures on detection, discrimination, identifica-tion, and speech production to be comprehensive.
Francis Kuk, PhD, is Director of Audiology at Widex/ORCA-USA. Denise Keenan,
MA; Chi Lau, PhD; and Heidi Peeters, MA, are Research Audiologists at ORCA.
Jane Auriemmo, AuD, is Manager of the Pediatric Program at Widex USA. PetriKorhonen, MS, and Bryan Crose, BS. are Research Engineers at ORCA. Read-
ers may contact Dr. Kuk at [email protected] or at [email protected].
REFERENCES1. Braida L, Durlach I, Lippman P, et al.: Hearing Aids: A Review of Past Research of Linear
Amplification, Amplitude Compression, and Frequency Lowering, ASHA Monographsnumber 19. Rockville, MD: American Speech-Language-Hearing Association, 1979.
2. Kuk F, Korhonen P, Peeters H, et al.: Linear frequency transposition: Extending theaudibility of high frequency information. Hear Rev 2006;13(10):42-48.
3. Kuk F, Keenan D, Peeters H, et al.: Critical factors in ensuring efficacy of frequencytransposition I: individualizing the start frequency. Hear Rev 2007a;14(3):60-67.
4. Auriemmo J, Kuk F, Stenger P: Criteria for evaluating linear frequency transpositionin children. Hear J 2008;61(4):50-54.
5. Kuk F, Keenan D, Peeters H, et al.: Critical factors in ensuring efficacy of frequencytransposition II: facilitating initial adjustment. Hear Rev 2007b;14(4):90-96.
6. Korhonen P, Kuk F: Use of linear frequency transposition in simulated hearing loss.JAAA 2008; 19(10):639-650.
7. Kuk F, Peeters H, Keenan D, Lau C: Use of frequency transposition in thin-tube,open-ear fittings. Hear J 2007c;60(4):59-63.
8. Auriemmo J, Kuk F, Lau C, et al.: Effect of linear frequency transposition on speechrecognition and production in school-age children. JAAA 2009; 20(5):289-305.
9. Kuk F, Keenan D, Korhonen P, Lau C: Efficacy of linear frequency transposition onconsonant identification in quiet and in noise. JAAA 2009; 20(8):465-479.
10. Kuk F, Ludvigsen C: Reconsidering the concept of the aided threshold for nonlin-ear hearing aids. Trends Amplif 2003;7(3):77-97.
11. Rees R, Velmans M: The effect of frequency transposition on the untrained auditorydiscrimination of congenitally deaf children. Brit J Audiol 1993; 27:53-60.
12. Tillman TW, Carhart R: An Expanded Set for Speech Discrimination Utilizing CNCMonosyllabic Words: Northwestern University Auditory Test No. 6. Technical ReportNo. SAM-TR-66-55. San Antonio: USAF School of Aerospace Medicine, BrooksAir Force Base, 1966.
13. Hirsh IJ, Davis H, Silverman SR, et al.: Development of materials for speech audiom-etry. J Sp Hear Dis 1952;17:321-337.
14. Denes PB: On the statistics of spoken English. J Acoust Soc Am 1963;35(6):892-904.15. Kuk F, Lau C, Korhonen P, et al.: Development of the ORCA Nonsense Syllable Test.
2010 (submitted).
Figure 8. /s/ and /z/ production accuracy on a readingtask and a conversation task with the children’s own hearingaids, Inteo master (IM assess), AE at 3 weeks (assess 1), andAE at 6 weeks (assess 2) (from Auriemmo et al.8).
40 THE HEARING JOURNAL Frequency-lowering algorithms APRIL 2010 • VOL. 63 • NO. 4