interpreting microarray expression data using text annotating the genes michael molla, peter...
TRANSCRIPT
Interpreting Microarray Expression DataUsing Text Annotating the Genes
Michael Molla, Peter Andreae, Jeremy Glasner, Frederick Blattner, Jude Shavlik
University of Wisconsin – Madison

The Basic Task
Given
Microarray Expression Data &
Text Annotations of Genes
Generate
Model of Expression
Motivation
• Lots of Data Available on the Internet– Microarray Expression Data– Text Annotations of Genes
• Maybe we can Make the Scientist’s Job Easier– Generate a Model of Expression Automatically– Easier First Step for the Human
Microarray Expression Data
• Each spot represents a gene in E. coli
• Colors Indicate Up- or Down-Regulation Under Antibiotic Shock
• Four our Purpose 3 Classes– Up-Regulated– Down-Regulated– No-Change

Microarray Expression Data
From “Genome-Wide Expression in Escheria Coli K-12”, Blattner et al., 1999

Our Microarray Experiment
• 4290 genes
• 574 up-regulated
• 333 down-regulated
• 2747 un-regulated
• 636 non enough signal

Text Annotations of Genes
• The text from a sample SwissProt entry (b1382)– The “description” field
HYPOTHETICAL 6.8 KDA PROTEIN IN LDHA-FEAR INTERGENIC REGION
– The “keyword” fieldHYPOTHETICAL PROTEIN
Sample Rules From a Model for Up-Regulation
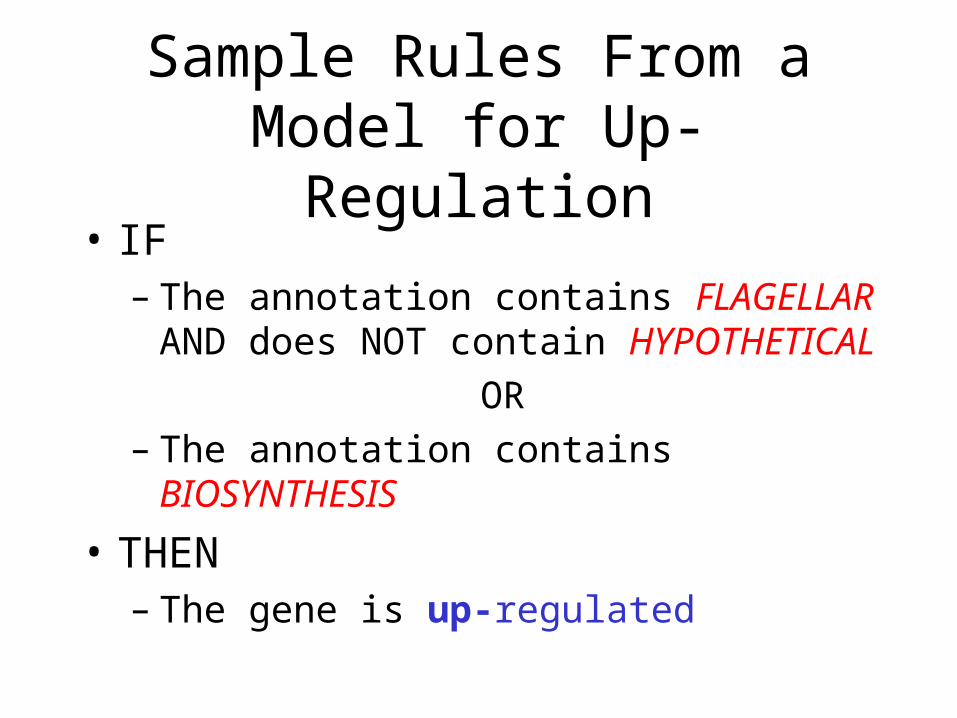
• IF– The annotation contains FLAGELLAR AND
does NOT contain HYPOTHETICAL
OR– The annotation contains BIOSYNTHESIS
• THEN– The gene is up-regulated

Why use Machine Learning?
• Concerned with machines learning from available data
• Informed by text data, the leaner can make first-pass model for the scientist

Desired Properties of a Model
• Accurate– Measure with cross validation
• Comprehensible– Measure with model size
• Stable to Small Changes in the Data– Measure with random subsampling
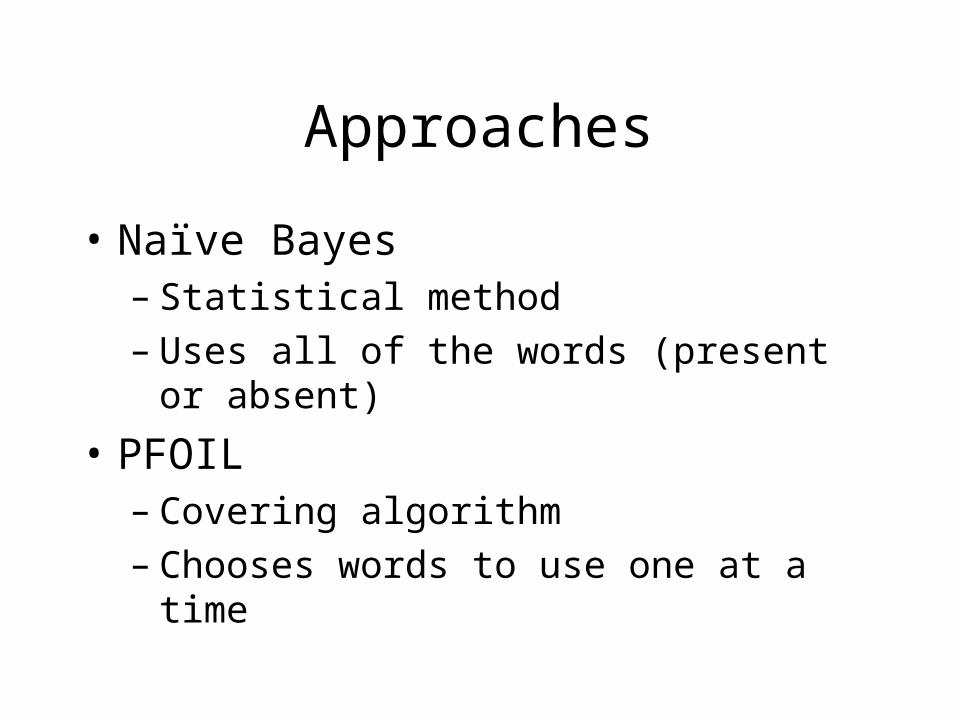
Approaches
• Naïve Bayes– Statistical method– Uses all of the words (present or absent)
• PFOIL– Covering algorithm– Chooses words to use one at a time
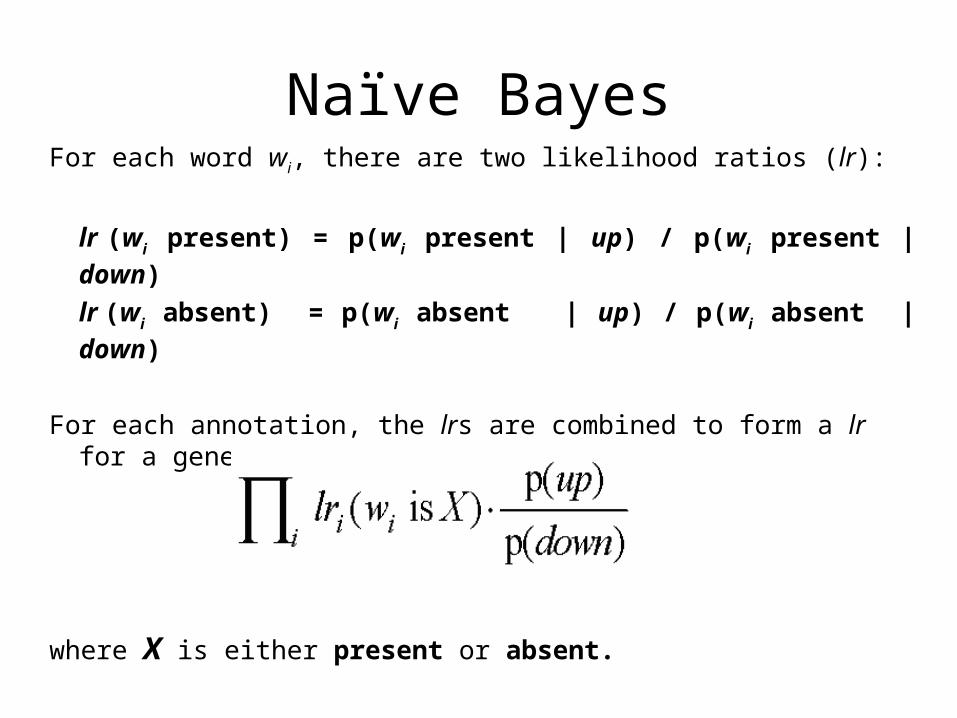
Naïve BayesFor each word wi, there are two likelihood ratios (lr):
lr (wi present) = p(wi present | up) / p(wi present | down)
lr (wi absent) = p(wi absent | up) / p(wi absent | down)
For each annotation, the lrs are combined to form a lr for a gene:
where X is either present or absent.
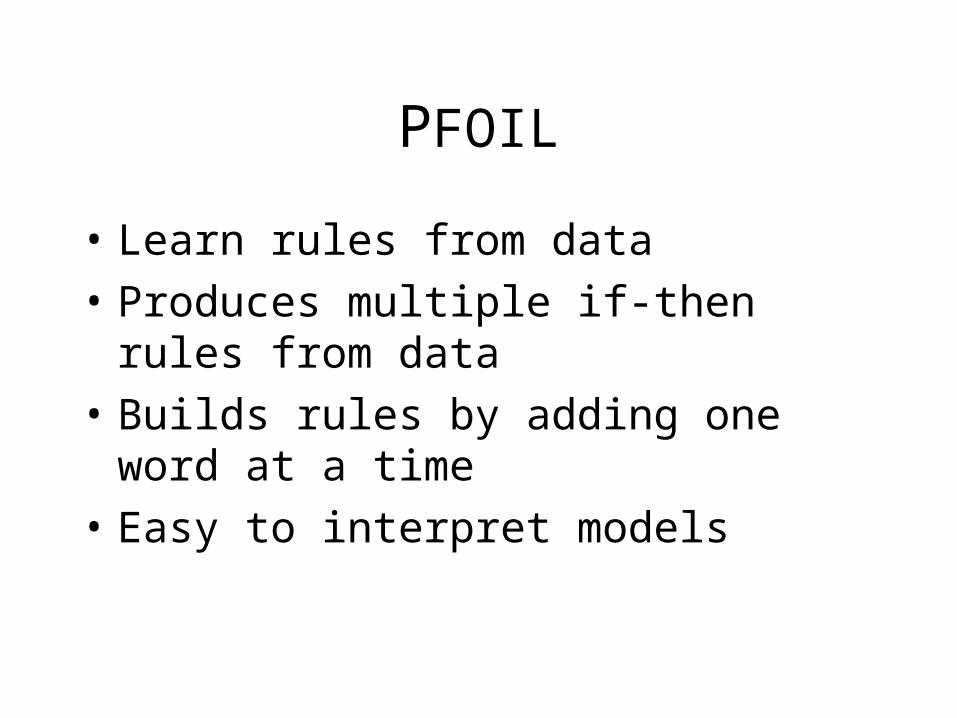
PFOIL
• Learn rules from data
• Produces multiple if-then rules from data
• Builds rules by adding one word at a time
• Easy to interpret models
0%
10%
20%
30%
40%
50%
0102030405060708090100
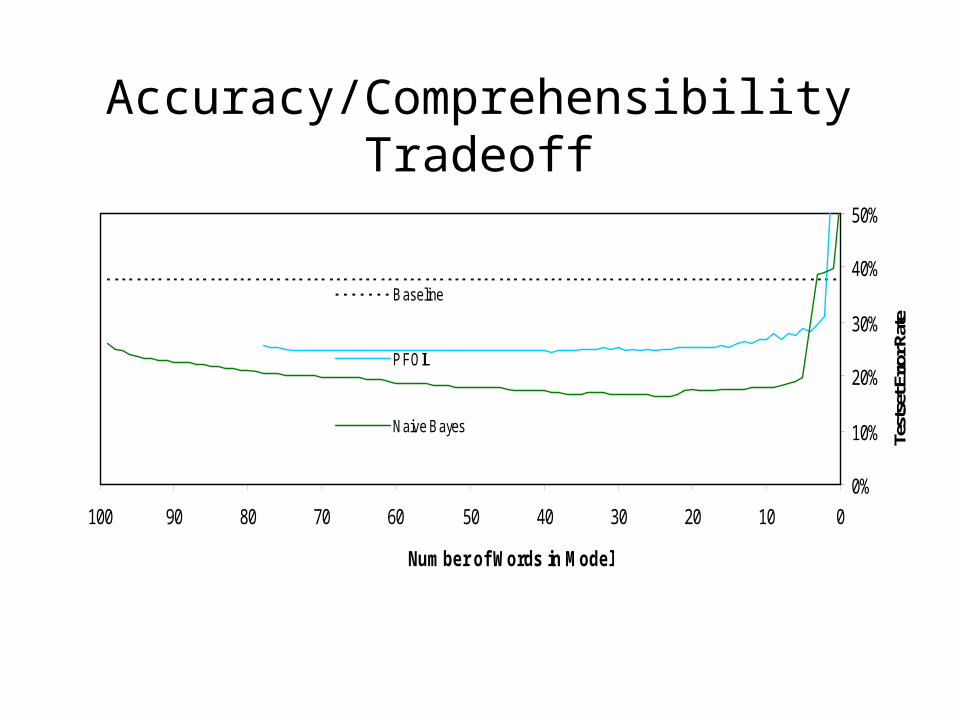
Number of Words in Model
Test
set E
rror R
ate
Baseline
P FOIL
Naive Bayes
Accuracy/Comprehensibility Tradeoff
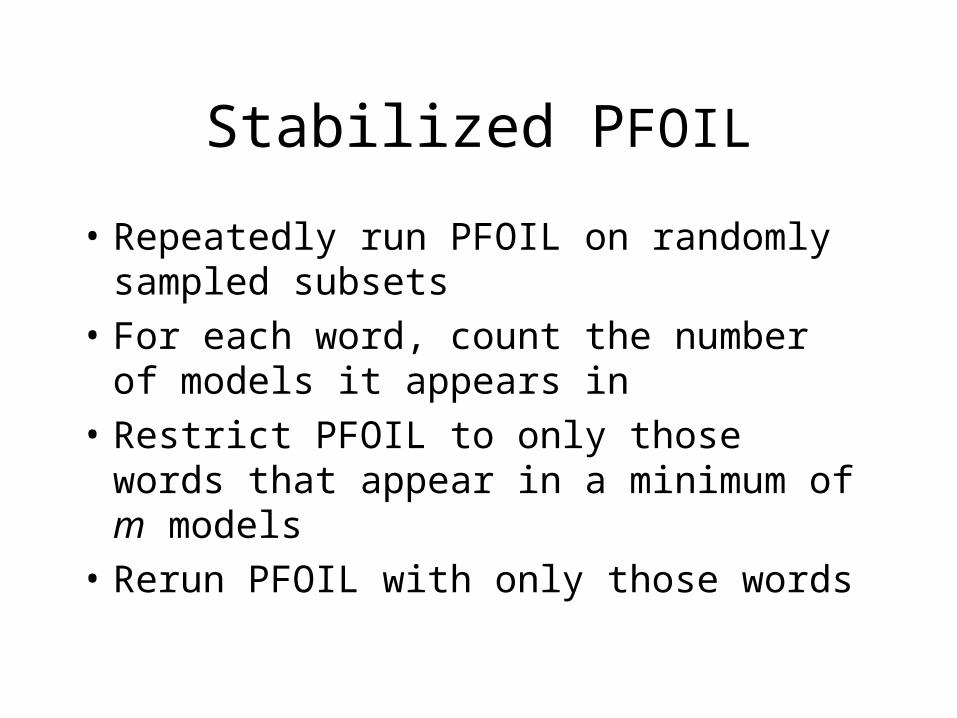
Stabilized PFOIL
• Repeatedly run PFOIL on randomly sampled subsets
• For each word, count the number of models it appears in
• Restrict PFOIL to only those words that appear in a minimum of m models
• Rerun PFOIL with only those words

Stability MeasureAfter running the algorithm N times to generate N rule sets:
Where:U = the set of words appearing in any rule set
count(wi) = number of rule sets containing word wi

0%
5%
10%
15%
20%
25%
30%
35%
40%
45%
50%
0 5 10 15 20 25 30 35 40 45 50Value of m
Test
set E
rror R
ate
0.0
0.1
0.2
0.3
0.4
0.5
0.6
0.7
0.8
0.9
1.0
Stab
ility
Stabilized P FOIL Error Rate
Stabilized P FOIL Stability
Unstabilized P FOIL Stability
Accuracy/Stability Tradeoff

Discussion
• Not very severe tradeoffs in Accuracy– vs. stability– vs. comprehensibility
• PFOIL not as good at characterizing data– suggests not many dependencies– need for “softer” rules

Future Directions
• M of N rules
• Permutation Test
• More Sources of Text Data
Take-Home Message
• This is just a first step toward an aid for understanding expression data
• Make expression models based on text in stead of DNA sequence.

Acknowledgements
• This research was funded by the following grants:NLM 1 R01 LM07050-01,
NSF IRI-9502990,
NIH 2 P30 CA14520-29, and
NIH 5 T32 GM08349.