interpreting evalu8ing results to improve client / agency relationships
TRANSCRIPT
Evalu8ing. Collaboration. Relationships. Performance.
1
Evalu8ing
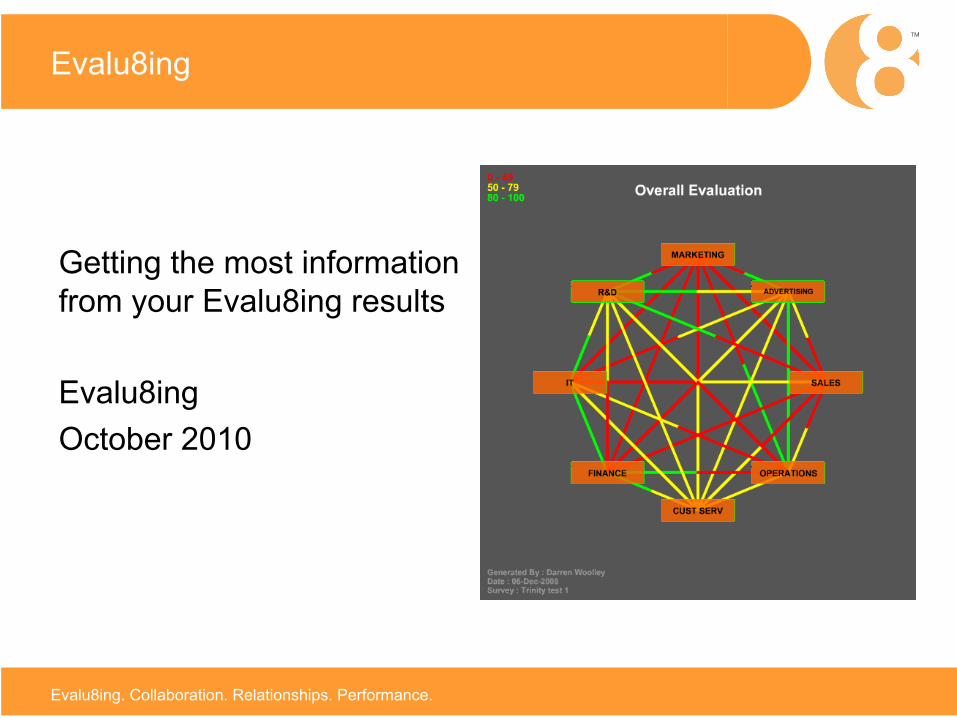
Getting the most information from your Evalu8ing results
Evalu8ing October 2010

Evalu8ing. Collaboration. Relationships. Performance.
2
Analysing your Evalu8ing results
When you have completed your Evalu8ing survey there are three types of metrics / results that the system produces:
1. Evalu8ing Relationship Maps
2. Relationship Metrics
3. Participant Commentary
Together the three provide valuable direction and invaluable stimulus materials for discussions between the groups participating in the relationship.
Here we have a report that brings these three outputs together.
Evalu8ing. Collaboration. Relationships. Performance.
3
Reading the Evalu8ing relationship maps
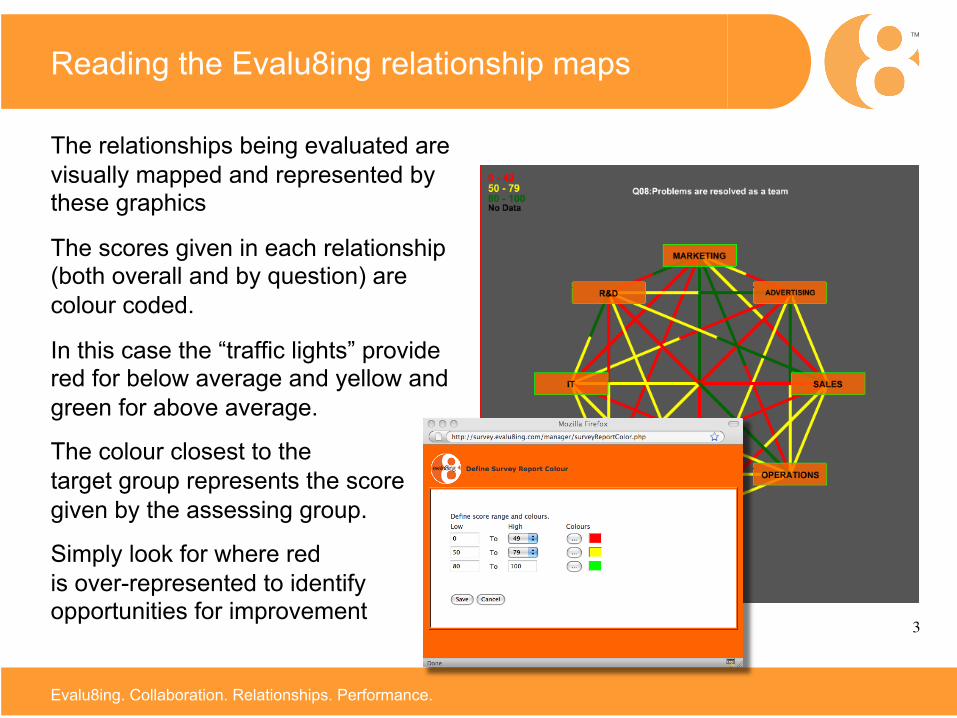
The relationships being evaluated are visually mapped and represented by these graphics
The scores given in each relationship (both overall and by question) are colour coded.
In this case the “traffic lights” provide red for below average and yellow and green for above average.
The colour closest to the target group represents the score given by the assessing group.
Simply look for where red is over-represented to identify opportunities for improvement

Evalu8ing. Collaboration. Relationships. Performance.
4
The meaning behind the relationship metrics
The Evalu8ing system generates a comprehensive range of metrics for each relationship including:
1. Average overall score given to the target group by each of the assessing groups.
2. Average score per question given by the target group by each of the assessing groups.
3. Number of participants who provided a response overall and by question.
4. Overall, and by question, average score from all assessing groups of the target group.

Evalu8ing. Collaboration. Relationships. Performance.
5
Insights from the participant commentary
The relationship map and scores lets you identify where the issues are, and provide an indication of the magnitude of the issue.
The participant commentary provides insights into the underlying cause or details of the specific issues, behaviours or circumstances. It is for this reason that participant commentary is actively encouraged.
The commentary is always individually anonymous and attributed to the group.

Evalu8ing. Collaboration. Relationships. Performance.
6
Putting the Evalu8ing results together
The steps for interpreting the results and metrics produced by the Evalu8ing system are:
1. Use the Evalu8ing relationship maps, overall and by question, to identify which relationships are below the average.
2. Use the Evalu8ing relationship metric to then identify trends in subsequent surveys and differentiate the magnitude of the issue.
3. Read the Evalu8ing participant commentary to look for understanding and insight into the scores and results.
Use all three to stimulate discussion between all groups.

Evalu8ing. Collaboration. Relationships. Performance.
7
For more information…
Evalu8ing Pty Ltd Sydney +612 8399 0922 Melbourne +613 9682 6800 London +44 7880 910 064 Wellington +64 21 515 650 Hong Kong +852 3589 3095 Singapore +65 6884 9149
[email protected] www.evalu8ing.com