interpretation of environmental isotope hydrology … 0116... · iaea-116 vic library 0« 000002 «...
TRANSCRIPT

IAEA-116
VIC Library
0« 000002 « 006673'
INTERPRETATIONOF
ENVIRONMENTAL ISOTOPEHYDROLOGY
REPORT OF A PANELSPONSORED BY THE
INTERNATIONAL ATOMIC ENERGY AGENCYAND HELD IN VIENNA,
24-28 JUNE 1968
A TECHNICAL REPORT PUBLISHED BY THEINTERNATIONAL ATOMIC ENERGY AGENCY, VIENNA, 1970

The IAEA does not maintain stocks of reports in this series. However,microfiche copies of these reports can be obtained from
INIS Microfiche ClearinghouseInternational Atomic Energy AgencyWagramerstrasse 5P.O. Box 100A-1400 Vienna, Austria
on prepayment of Austrian Schillings 40.00 or against one IAEA microficheservice coupon.

IAEA-116
NTiL ISO!
REPORT OF A PANEL
SPONSORED BY THEINTERNATIONAL ATOMIC ENERGY AGENCY
AND HELD IN VIENNA,24-28 JUNE 1968
A TECHNICAL REPORT PUBLISHED BY THEINTERNATIONAL ATOMIC ENERGY AGENCY, VIENNA, 1970


FOREWORD
The following papers, oral contributions
and discussions, were assembled informally by the
Scientific Secretariat of the Panel Meeting on
Interpretation of Environmental Isotope Data in
Hydrology (Vienna, Austria, 24-28 June 1968).
They have not been edited formally, so that minor
changes have not been cleared with the original
authors. They are reproduced for informal dis-
tribution as they may be helpful to hydrologists
and- others interested in the application of en-
vieonmental isotopes in hydrologic studies.


I N D E XPage
1. INPUT OF ENVIRONMENTAL ISOTOPES TO EYDROLOGICAL SYSTEMS
1.1 GENERAL PATTERNS OF DEUTERIUM AND OXYGEN-18 CONTENTOF THE PRECIPITATIONSummary of the contribution by W. Dansgaard 1
1.2 ENVIRONMENTAL ISOTOPE VARIATIONS IN THE PRECIPITATION,SURFACE 13ATERS AND TREE RINGS IN CANADASummary of the contribution by R.M. Brown 4
1.3 DISCUSSION ON THE FACTORS AFFECTING THE ENVIRONMENTALISOTOPE CONTENT OF PRECIPITATION 6
1.4 DISCUSSION OF THE VARIATIONS OF TRITIUM CONTENTOF THE PRECIPITATION IN SCANDINAVIAN PRECIPITATIONBy E. Eriksson 7
1.5 A GLOBAL SURVEY OF ENVIRONMENTAL ISOTOPE DATASummary of the contribution by C. Lewis Meyer 8
1.6 DISCUSSION ON THE ENVIRONMENTAL ISOTOPEDATA COLLECTION NETWORK 8
1.7 THE RELATIONSHIP BETWEEN ISOTOPIC COMPOSITIONOF PRECIPITATION AND LYSIMETER PERCOLATES 10
1.8 DISCUSSION ON LYSIMETER STUDIES 13
1.9 THE"USE OF ENVIRONMENTAL ISOTOPES IN INFILTRATION STUDIESSummary of the contribution by L. Thilo and K.O. Munnich 14
1.10 DISCUSSION 17
1.11 ENVIRONMENTAL TRITIUM IN SOIL MOISTUREAND GROUND!?ATER IN DENMARKSummary of the contribution by Lars Jørgen Andersen 18
1.12 DISCUSSION 20
2. ENVIRONMENTAL ISOTOPES IN SURFACE WATER AND GLACIOLOGICAL STUDIES
2.1 THE USE OF ENVIRONMENTAL ISOTOPES IN PRECIPITATION-INFILTRATION-RUNOFF RELATIONSSummary of the contribution by T. Dincer 22
2.2 DISCUSSION 23
2.3 THE USE OF ENVIRONMENTAL ISOTOPES IN GLACIOLOGICAL STUDIESSummary of the contribution by W. Dansgaard 24
2.4 DISCUSSION 25

GROUNDWATER STUDIESPage
3.1 SOME PRACTICAL CONSIDERATIONS IN ENVIRONMENTALISOTOPE APPLICATIONS IN HYDROLOGIC STUDIESSummary of the contribution "by G.H. Davis 27
3.2 DISCUSSION 29
3.3 ON THE APPROACH TO HYDROLOGIC PROBLEMSSummary of the contribution by A. Nir 30
3.4 ON THE APPLICATION OP ENVIRONMENTAL ISOTOPEDATA IN GROUNDWATER RESOURCE DEVELOPMENTSummary of the contribution by T. Harpaz 31
3.5 DISCUSSION 32
3.6. UTILIZATION OP ENVIRONMENTAL ISOTOPE TECHNIQUESIN WATER RESOURCE INVESTIGATION AND DEVELOPMENT 33Summary of the contribution by R. Ambroggi and D.J. Burdon
3.7 AN EXAMPLE OP THE COOPERATIVE TTORK WITH PAOIN GROUNDWATER INVESTIGATIONS IN JORDANBy G.H. Davis 34
3.8 DJTSCUSSION 3 5
3.9 THE USE OP ENVIRONMENTAL ISOTOPES IN KARST HYDROLOGYSummary of the contribution by B.R. Payne and T. Dinper 37
3.10 DISCUSSION 40
3.11 CONSIDERATIONS ON THE GROUNDWATER MOVEMENT IN KARST FORMATIONSWITH REFERENCE TO TOTES GEBIRGE MASSIF IN AUSTRIABy J.G. Z8tl 41
3.12 DISCUSSION 41
MATHEMATICAL MODELS IN ENVIRONMENTAL ISOTOPE STUDIES
4-1 COMMENTS ON THE USE OF MATHEMATICAL MODELSIN INTERPRETING THE ENVIRONMENTAL ISOTOPE DATASummary of the contribution by A. Nir 43
4.2 DISCUSSION 47
4.3 ON THE CHARACTERISTICS OF RIVER BASINSSummary of the contribution by E. Eriksson 49
4.4 DISCUSSION 52

Page
5. LAKE WATE5 BALANCE STUDIES
5.1 LAKE WATER BALANCE STUDIES WITE ENVIRONMENTAL ISOTOPESSummary of the contribution by T. Dineer 54
5.2 DISCUSSION • 55
6. THE USE OF CAEBON-14 IN QROPITO WATER STUDIES
6.1 ADJUSTMENT OF RADIOCARBON AGES OF GROUNDWATERBY MEANS OF 13(j/14c
By B. Hanshaw 56
6.2 DISCUSSION 62
6.3 TEE CAEBON-14 WATEE AGE DETERMINATIONBy I . Wendt 63
6.4 DISCUSSION 65
6.5 CARBON-14 STUDIES MADE 31 THE INSTITUTEOF GEOLOGY OF THE AQUITAINE BASINBy P. Leveque 6§
6.6 DISCUSSION 6§
6.7 ENVIRONMENTAL ISOTOPE INVESTIGATIONS IN THE GRAZ BASIN,AUSTRIASummary of the contribution by J.G. Zb'tl and G.L. Meyer 6%
ANNEX List of Participants


- 1 -
INPUT OP TTfVIPOFTTT X I~O' OF*"S TO HTPP0L03ICAL CYS7" :S
1.1 G^np.iL PATT^PP" ™? 2TrT~?rj:: .-/ID OXYGT:-18 c^T^i^r ^FTIT "P^CIPITiTIO:1. Summary of the contribution made byProf. T. Dansgaard.
During the hydrologic cycle, the stable isotoioic conroonents ofthe water are exposed to several fractionaticn effects. One of theseeffects occurs because the vapour Tessure of the light isotoriccomponent, H2 ^"O, is higher than the heavier comronents HDO andH2 ^"O. Another inmortant effect is the molecular exchange betweenvrater in the liquid and gas phases which is a complicated process.For several years IiZA has carried out, in cooperation with 110,a collection of the -nrecrnitation samples in a world-wide networkof about 110 meteorological stations. These samples have been measuredfor tritium, deuterium and oxygen-18 content, and the followingdiscussion is based on these data.
Fig. (l) shows the mean oxygen-18 content 'of the r.recir.itationin January. The values presented are the weighted means of severalJanuary samples.
High oxygen-18 values are found in the mid-Atlantic and alongthe equator. The water which evaporates from the oceans condensesin such a "-ray so that initially the oxygen-18 content of the nreci-"oitation is Relatively high. As tfie condensation -proceed1: however,the water valour and consequently nrecinitation originating from iT;'is more and more depleted in oxygen-18. This is the main cause forthe change in oxy£-en-l8 with latitude seen in Fig. (l). A noticeablefeature is a broad tongue of high values in the northern Atlantic.This, which is -probably an indication of exchange between theatmospheric water vigour and the ocean r^rface is also su -norted bythe low tritium values ^erha-ns resulting- from molecular exchange.However, the oxygen-l8 and tritium variation over the northernAtlantic could also be correlated by the nrecipitable water over thisregion, which would tend to increase the oxygen-18 content of precini-tation while decreasing the tritium content.
The "inland effect" is also illustrated in the same figure.In North America nrecirit.stion decreasing inland is accompanied bya decrease in oxygen-18 content of precipitation. The same trend isobserved in South-America; South Africa and in
This effect is also observed over the other hi.~h mountain rangessuch as the Andes and Eocky Mountains of the American continent, andthe Alps and mountains in Norway in Europe.
Fig. 2 shows the mean oxy,.en-l8 content of the preci-nitaticnin July. The patterns are almost th.% same as tvose of Januarybut show a shift of oxygen-18 content toward higher values. In theIndim Ocean high values of oxygen-18 can be explained by the factthat monsoon nrec:irotation represents the first stare of condensation.
-sed in relative deviation with res-nect to SMO" .
- 2 -
Pig. 3 shows "the annual mean values for deuterium and oxygen-18content of the precipitation for all the stations of the network.The correlation is linear and the slope of the line is 6. In arid zonesthe scattering can "be explained partly by the kinetic effect introru ;ed •by the evaporating raindrops.
The location of the annual values on a line with si one S and apositive intercept is explained by the following process: The oceanwater, when evaporated, produces a vapour which is lighter than thewater vapour but which is in equilibrium with the ocean water.The difference is larger for oxygen-18 than for deuterium. Also uponcondensation the water vapour produces precipitation which is in equi-librium with the vapour phase. Thus, the stable isotope composition ofthe precipitation is slightly lower than the ocean water, the differencebeing larger for oxygen-l8 than for deuterium. When the process ofcondensation continues, both the water vapour and the precipitation com-position move along a line with slope 8, which is defined initially bythe water vapour originating from the oceans. The intercept of the linewith deuterium axis is generally found to be + 10$o. but in certainregions intercepts higher than +"lO$o have been found. The abovecorrelation is made among stations, but when monthly values of oxygen-l8and deuterium for a given individual station are plotted versus each other,a different regression line, which does not necessarily have the slo-ne 8nor the intercept + 10$o, is obtained.
Evaporation from water causes the enrichment of remaining watervjith res-nect tojstabl-e isotopes. When the initial isotopic conmositionof such waters is the same (as in raindrops), the evaporated waters arefound on a (f. Q - L granh along a line passing by the conmosition of theoriginal water with a slope less than 8.
The altitude effect was studied in Innsbruck (600 m), Austria,and a station 6 km from Inns-ruck, Hafelekar, which is 700 m higher.The oxygen-18 content of the precipitation in June showed significantlylighter isotopic composition in Hafelekar precipitation. In these mid-Alpine regions precipitation is released from clouds nearly all at thesame altitude so there should not be an orographic type altitude effect.Pig. 4 shows that the difference of the isotopic composition of theprecipitation in Innsbruck and in Hafelekar is due to the evaporation.The intermediate values are from Honeburg, which is about 400 m higherthan Innsbruck. The line joining Hafelekar and Honeburg values has aslope lower than 8, which indicates evaporation.
Pig. 5 shows the oxygen-18 content of the precipitation in winterin the same region. As expected, they are much lower than the summervalues- the difference between Innsbruck and Hafelekar is not systemati-cally positive, as it is in summar precipitation. This does not meanthat there was no evaporation, or rather sublimation, from the precipi-tation in fall but it is due to the fact that sublimation from thesnow flakes cannot bring the same type of fractionation as that fromraindrops. In a snow flake or crystal sublimation takes place layer bylayer, without any mixing process.
Pig. 6 shows the so-called amount effect in Kinshasa (Leopoldville).Congo precipitation which can also be used in hydrological studies.The oxygen-l8 content of intense and long duration rains must be lowerthan the oxygen-18 content of less intense rains with short duration.Monthly precipitation is also given at the lower part of the figure.There is an antiphase correlation and a correspondence of maximum and

- 3 -
minimum values for the amount of the -precipitation and its oxygen -IScontent. At higher latitudes the same amount effect is observed insummer as shown in Pig. 7 which shows the monthly precipitation and itsoxygen-l8 content in Tokyo. The amount effect vanishes in winter due tothe solid state of the precipitation.
In Dolar regions the altitude effect is much greater than at thelower latitudes because no fractionation by evaporation can take placefrom solid precipitation. At higher latitudes the altitude effect foroxygen-18 amounts to O.&foo per 100 meters of altitude difference.At low and mid-latitudes the altitude effect is 0.2$o per 100 meters.

— A —
1.2 ENVIRONMENTAL ISOTOPE VARIATIONS IN Tff PRECIPITATION,SURFACE WATERS AND IK TREE RINGS TN CANADA. Summary of thecontribution made by R.M. Brown.
1.2.1 Deuterium in Precipitation and Surface Waters
A survey of the deuterium content of precipitation and surfacewaters across Canada is under way. Precipitation from 15 precipitationstations and river waters from 100 sites are being analyzed every secondmonth for a two year period. Measurements to date show that seasonalvariability is not more than i 2 p^m in surface streams in spite of beingup to - 10 ppm in precipitation. Fig. 8 shows concentrations observedin December 1967* Concentrations are expressed relative to SHOW - 157*6derived from recent absolute calibration work in our laboratory.
Main features of the distribution of deuterium across Canada ares
(a) High concentrations in the east and west coastal regions with asharp drop inland from the west coast because of the Rocky Mountains
(b) Low concentrations in northern Canada where temperatures are low,and central Canada which derives its moisture from northern airmasses.
(c) High concentrations in the Great Lakes where a long residence timeaffords opportunity for extensive evaporative enrichment.
,Figures 9 and 10 show deuterium concentrations along the drainagesystems of central Canada and the Great Lakes - St. Lawrence River.The latitude effect is apparent in the Saskatchewan Rivers - highdeuterium in the South Saskatchewan River, low deuterium in the NorthSaskatchewan River. The concentration increases in Lake Winnipegbecause of the admixture of water from southern Manitoba originating inthe Gulf of Mexico - Mississippi Valley air mass system. In the GreatLakes - St. Lawrence system, local precipitation and tributary streamshave lower deuterium than the main stream indicating enrichment hasoccurred in the Great Lakes. An enrichment of 2 ppm occurs acrossLake Erie. Lower concentrations are observed down the St. Lawrence*River where the admixture of local drainage, much of it from Ithe nurtli.dilutes the Great Lakes deuterium.
1.2.2 Storm-to-storm Variation of Tritium and Deuterium inPrecipitation
Figure 11 shows the storm-to-storm variability of deuteriuto'and tritium in Ottawa precipitation,. 1961. An inverse correlation of.the deviations of individual tritium and deuterium values from theirres-nective mean curves is observed. Studies of air mass trajectories"show that the high tritium and low deuterium values are associated wi"t"h"air masses of northern origin, low tritium and high deuterium with airmasses of southern origin.
1.2.3 Tritium in Tree Rings
The distribution of tritium in the annual growth rings of treeshas been investigated as a possible means of learning the history oftritium deposition at sites for which - ast data is not available.The method involves mechanical separation of individual rings} chemicalseparation of cellulose, removal of any labile tritium (the threehydroxyl hydrogens of the cellulose unit) by boiling in 0.5 F HC1solution made up with tritium-free water, combustion of the driedcellulose , electrolytic enrichment and low level counting.

- 5 -
Trees growing in tritiated groundwater in the CTNL LiquidDis-nosal Area were examined first to see if recent tritium was incor-porated in older wood. Figure 12 shows the pattern observed. Althoughthe high tritium concentrations of recent years penetrated the treemoisture back to 1945> it was not incorporated in cellulose formed r>riorto the time of its a-n-oearance in groundwater of the area. This workgave the history of tritium dispersal in this area.
Somewhat in contradiction to the foregoing, we have not beenable to obtain values less than 50 TU on 1920-30 wood grown at anuncontaminated site. For the present, we have accepted this as a back-ground level which we subtract from the measured concentrations of morerecent rings to deduce the tritium pattern of the thermonuclear period.Figure 13 compares concentrations observed in a tree grown on well-drained, sandy soil at .Deep River with mean concentrations of Ottawaprecipitation for the growth period of each year. Excess tritiumappears in the rings of I960, 61, 62, but evidence from a few Deep Riverprecipitation samples indicates that some reactor tritium from CRNL(6 miles downwind) was deposited at Deep River at this time.
1.2.4 Perch Lake Evaporation Study
It was reported that P.J. Barry and W.F. Merritt are making anextensive study of evaporation from a small lake at Chalk River.Perch La^e has been uniformly labelled with ab'out 0.5 /uCi/l tritiumas a result of reactor liquid waste disposals. Absolute measurements ofevaporation can be obtained by observing HTO vapour profiles over the lake.-The site is fully instrumented for meteorological and hydrologicalmeasurements to obtain evaporation data by the various conventionalmethods (e.g. pan evaporation, water and energy budgets) for comparisonwith the tritium results. It was suggested that it would be valuableto make deuterium measurements in the course of this work to learn moreabout D/H fractionation in natural evaporation.

- 6 -
1.3 Discussions on the factors affecting the environmentalisoto-oe content of precipitation.
The most important "effects" to be used in hydrological workwere the so-called "altitude", "inland" and "temperature" effects, dueto the rather local nature of the most hydrological and hydro-geologicalproblems. The basic relation to be studied was the temperature effectbecause this is t>robably the cause of the altitude and latitude effects.
Temperature however, is closely related to the moisture contentof the air, i.e. the lower is the temperature the lower is thecapacity of the air to hold moisture. Therefore, the stable isotopecontent - temperature relation has an intermediate step, namely, themoisture content of the air. Air with a low moisture content isexpected to contain less deuterium and oxygen-18 because, starting fromits production in oceanic environments it should have gone throughseveral processes of condensation and consequently of depletion withrespect to stable isotopes. On the other hand, the influence of tempera-ture on the value of the fractionation factor is a negligible secondaryeffect which would be difficult to detect even in the condensation of waterin nature.
In arid regions in the lower latitudes, evaporation of the rain-drops during their fall is important, and affects the stable isotopecontent of the precipitation. The initial stable isotope content of theraindrot) can be modified considerably toward heavier valwes during itsfall. Precipitation on the southern slopes of the Sierra-Nevada Spainand the-Taurus, Turkey,mountain ranges shows a significant altitudeeffect as well as some deviation from the equilibrium line.
A question was raised concerning the antiphase variation of thetritium and deuterium content of the Canadian precipitition. The causeof this antiphase correlation could be that the storms with high turbu-lence contain more stratospheric air with high tritium and lowdeuterium content. However the meteorologic investigations, which werecarried out together with these isotope studies, indicate that thisvariation could only be due to the different sources of mristure.
A more general explanation of this antiphase correlation betweentritium and deuterium content of the precipitation (which is observed inalmost every region of the world) can be made by considering themoisture content of the atmosphere. Dry polar air masses are likely tocontain moisture with high tritium content and low deuterium content.On the other hand, oceanic moist air masses have low tritium content andhigh deuterium content, reflecting their immediate marine origin.When such problems are studied it is important to start with factors,such as temperature, moisture content, and to also consider the originof the air.
In many actual applications of the environmental isotopes,meteorologists and hydrologists are interested in the time variations ofthe isotopes at a given locality. The negative correlation between thetritium and deuterium contents of the precipitation raises interestingquestions, such as the mechanism of atmospheric vapour transport.The fluctuations about the recession line probably represent the localeffects. The overall effect can be obtained by the superposition of theflux or the vapour transport effect with the local effect. This mightlead to *.he quantitative evaluation of the both, provided a proper modelis chosen.

- 7 -
1.4 Discussion of the variations of tritium content of theprecipitation in Scandinavian precipitation^ by E. Eriksson
As there is only a limited number of precipitation stationswhere tritium has "been measured for more than several years it isnecessary to correlate the tritium content of the precipitation instations with short tritium records with neighbouring stations havinglonger records.
The tritium-precipitation network in Scandinavia is extensiveand has operated collecting monthly samples since 1961* It is possibleto calculate the annual mean values of tritium in the precipitation anddoing so to remove the seasonal variation. In the present analysisthe Stockholm (Huddinge) meteorological station, which belongs to theWMO/lAEA network, was used as a benchmark.
There are a number of other stations in Sweden where samples fortritium are collected and 10 of these stations have 6 years of tritiumrecord as does Huddinge station. The ratio of the annual mean tritiumconcentrations of these stations to the annual mean tritium concentrationsat Huddinge were calculated. These ratios varied considerably, both fromone place to another and one year to another. The lowest value was0.64 and the highest was a little higher than I.50. The purpose of thisstudy was to find the error of the estimate of the mean annual tritiumcontent of the precipitation using the annual tritium data in a neigh-bouring station. This can be done by using the well-known analysis ofvariance technique with two ways of classification, which are classifi-cation by stations and classification by years.
•Such an analysis allows elimination of the variations amongstations and the variations among the years. The variability among yearsindicates broad changes in climate from year to year.
Table I shows the final analysis of variance. The estimates ofvariances made with respect to stations and years are very significantcompared to the residual. This means that there is a difference oftritium deposition from-one station to another, but even more significantis the fact that the deposition pattern of tritium varies considerablyfrom one year to another.
Table I
Table of Analysis of Variance
Origin of variation D.F. Variance estimate f
Among stations 9 0.2470 16.41
Among years 5 0.1829 12.11
Eesidual 45 0.0151
These changes affect all the stations in any region.The remaining variability can be explained as changes which affect onlysome stations, not all of them. The standard deviation of an individualestimate is 12$, of which approximately 5% results from analytical errors.If the above analysis were done on a monthly basis, the variability of"f" values would be higher. These results agree well with the resultsobtained by the chemistry of precipitation.

- 8 -
1.5 A GLOB1L SURVEY OF ENVIRONMENTAL ISOTOPE DATA.By G. Lewis Meyer
The Data
Since 1961, monthly precipitation samples for the IAEA/TOOIsotopes-In-Precipitation Network hare been collected at more than 100meteorological stations in 67 countries and territories. To give theglobal coverage needed for a representative basic data network, stationsat Argentine Islands in Antarctica Thule in Greenland, Uaupes in theupper Amazon Basin and Ouargla' in the Sahara have been requested tocooperate. Pig. 14 shows the stations in the network.
Stationkeepers participating in the network collect and conrnositetotal rainfall for each month for tritium, deuterium and oxygen-18analysis and bottle half-litre and 20-ml samples of the composite fortritium and for deuterium-oxygen-18 analysis respectively. The deuterium-oxygen-18 samples are shipped to Copenhagen for measurement under acontract from the IAEA with the Oersted Institute, University of Copenhagen.Approximately half of the tritium samples and selected weather data fromall network stations are sent to the IAEA Laboratory in Vienna for analysis.The remainder of the tritium samples are forwarded to cooperatingtritium laboratories in Canada, India, New Zealand, Sweden and the USAfor analysis. Supplementary isotope data are received by the TA"EA fromother tritium laboratories in fTance, Germany, Iceland, the UnitedKingdom and the USA.
The IAEA acts as a collection and coordinating agency for theisotope and meteorological data necessary for hydrologic investigations..It has published the data at regular intervals. Data now (1968) includedfor each monthly sample are tritium, deuterium and oxygen-18 content,type and amount of precipitation, and mean temperature and relativehumidity. These data are now computer-compatible and are available uponrequest on magnetic tape in the Fortran format. All old isotope andmeteorological data available will be reissued in yearly blocks in aformat prepared by the computer* These will begin to appear late in 1968and new data will be issued yearly.
Similar but less extensive networks for collection of river andocean water samcles for isotope analysis have been established within theframework of the IHD. Two networks, one of 21 major river stations andthe other of 11 ocean stationst collect regular monthly instantaneoussanmles. As the programming workload permits, the data will be integratedinto a common computer storage system for an "isotope-in-water" data filealong with the precipitation data.
1.6 Discussion.
Some questions raised in the discussions were*
Is the monthly sampling really necessary?Would a weighted composite annual sample be satisfactory inenvironmental isotope studies in hydrology?
These questions, it was suggested, could be partly answered if theexisting data are properly analyzed and interpreted, depending in parton the type of application of the environmental isotope data. Averagingis a good practice if done in the bottle. It was also pointed out thatthe theory of sampling could supply part of the answer on the frequency ofsanroling: If the frequency spectrum of the tritium output is consideredit is seen that many fast molds are damped by the hydrologic system, so

- 9 -
th3t there is no point of collecting very frequent samples in the input.However one should also be careful to collect environmental isotope datato handle unforeseen situations and problems which may arise in thefuture.
The use of environmental isotopes in hydrometeorological andgroundwater studies requires different sampling methods. In hydro-meteorological work a high frequency of sampling the precipitation andbroad areal coverage are necessary due to the high variability of theenvironmental isotope content of the precipitation both in time andspace. On the other hand, the groundwater hydrologists normally requireonly the mean isotope in- ut to the groundwater systems. This can beobtained from the mean values for the isotope content of the precipi-tation if collected when the precipitation is closely related to therecharge to the groundwater. This is valid only in some regions wherethe precipitation is concentrated in a well defined period of the year(examples: mediterranean and monsoon climates). In Eimpe for example,the summer precipitation probably seldom reaches the groundwater and islargely transpired by plants. Thus the isotopic composition of onlythe winter precipitation, in such a case should be considered if arelation is sought between -the isotopic composition of the precipitationand the groundwater. Monthly sampling is needed,therefore, to estimatethe input concentrations with more precision.
Quarterly sampling was also proposed as a compromise between therequirements imposed by the cost of the analysis and the reliability ofestimates of the environmental isotope input concentrations to^thehydrologic systems*

- 10 -
1.7 THE RELATIONSHIP BETT/7EEK ISOTOPIC COMPOSITION OFPRECIPITATION" AND LYSIMETER PERCOLATES.By. E. Halevy
1.7*1 Introduction
Realizing the importance of climatic and pedologic conditions onthe quality and isotope composition of -mater in the unsaturated zone,the International Atomic Energy Agency set up a cooperative -programmeto study the changes in and relationship between precipitation and soilwater, as reflected in the composition of lysimeter percolates.Lysiroeter stations were selected to represent a broad" spectrum ofclimates and soil conditions. This paper presents and discussesresults from lysimeter stations for which data accumulated for at leasttwo years. Results of other stations will be published when more databecomes available. Although two years may not be enough for conclusivestudies of this nature? the data accumulated so far have interestingimplications which ,<may stimulate similar studies elsewhere.
1.7*2 Description of lysimeters and sampling methods
Each lysimeter was at least 2 x 2 x 2 meters (except Petzenkirchen),kept under natural regime (with one exception, Taastrup, discussedlater) including natural drainage (without suction).
Juprelle, Belgium (5O°41'N 5°26»E)j filled with a loess soil,texture clay loam, good drainage (krilium added to ensuregood drainage). " «,
Mbl. Belgium (51°11 fIT 5°7fE)j sandy white soil. Excellentdrainage. Data for this lysimeter are available for one yearonly. However, results are included for comparison with Juprelleand other stations.
Taastrup. Denmark (55°39'N 12°l8TE)j sandy soil covered withalfalfa. In summer 1967 the lysimeter was irrigated. Samples ofirrigation water were taken and regarded as "precipitation"for the purpose of the present study.
Coshacton, Ohio, USA (40°l6rtf 8l°5OTW)j constructed in asilt loam residual soil (Muskingum series, a Gray-BrownPodzolic soil) on a slope of 23*2$. Good drainage, covered withpasture grass. Lysimeter Y101A was not fertilized whereasY101C was fertilized. In operation since 1944*
Petzenkirchen, Lower Austria (48°6 'If 15°12f!E)j size 1 x 1 x 1.3 m,filled with colluvial brown loam. Lysimeter 1 has no cover anddeveloped spaces between well and monolith. Lysimeter 3 isgrass covered. In operation since 1953.
Precipitation was collected on site, in a standard rain gauge.Water collected during one month was combined for a weighted average.The lysimeter percolates, with one exception, were collected in acovered container, mixed at the end of the month for a weighted sample.In Coshocton, the lysimeter data represent water collected on thelast day of each month.

- 11 -
Results and discussion
The results are shown in Pigs. 15 - 18. There are severalcommon features to all data worth pointing out:
(a) Escept in Mol, a pure sand lysimeter. the isotopic conmosition ofthe percolates show a relative degree of stability, not reflectingthe annual or seasonal variations.
(b) The weighted yearly average of stable isotopes in the percolate isdepleted with respect to the precipitation.
(c) The tritium curves are receding- as a function of time, in a regularmanner resembling the atmospheric recession.
(d) The weighted yearly averages of tritium concentration in thepercolate is higher than that of the -precipitation.
Tritium Data
The main features of the tritium data are the recession trendand the difference "between the weighted averages of the ureci-pitation and percolation. Although the percolate tritium lineshows in most cases a large decree of buffering caused bymixing and dispersion in the soil, the distinct recessive trendindicates vertical flow that keeps a temporal identity.The degree of buffering and the turn-over time depend on soiltexture and are more pronounced in loamy textured soils than insandy soils.
Owing to the present moratorium on atmospheric nucleartesting, tritium in the atmosphere is characterized by recessionfollowing the 1963-4 peak.
The higher than average concentration of tritium in thepercolate in comparison with the precipitate indicates that thebulk of the percolated water is infiltration from the previousyear or even earlier. The longest set of data on tritium isprovided by Petzenkirchen. Here, we find also the only exception>1965 tritium values in the percolate are lower than the assumedaverage of the precipitation (the assumed value was reached "bycomparing the yearly weighted averages Vienna and Petzenkirchen.Vienna values in 1966 and 1967 were 20 TU higher. In 1965 theaverage for Vienna was 876 and thus a value of 850 was chosenfor Petzenkirchen. This value seems to be reasonable from thePetzenkirchen data available for the period April-December 1965)*
If this peak is an actual reversal of the generally observedtrend, it may belong to the peak year of the percolate activityand thus give us a rate of movement of 2 years because theatmospheric peak of tritium in Vienna occurred in 1963* However,it is possible, as will be discussed from stable isotopes data,that computations based on yearly averages are not correct inall cases. The stable isotopes data, in cases where the precipi-tation - percolation ratio is high, are strongly biased towardswinter precipitation. As observed, tritium values in winterprecipitation are generally lower than in spring and early summer*The weighted average for the following winters (October-March) are:

- 12 -
year1963/64
1964/651965/66
1966/67
•precipitation
1772 TU
577303
208
•percolation-
~ 750
~ 650
~ 400
These comparisons show further that at least a one-year delayoccurs unless there is an immediate effective percolation ofspring-summer precipitation which raises the average tritiumconcentration in the percolate. In Austria the summers of 1965and 1966 had excessive rain falls. This may explain therelatively high values for percolate 1965/66 which otherwiseshould be interpreted as originating prior to 1964/65* and thesame may "be said for 1966/67 which show a pre 1965/66 value.
In Juprelle the weighted average for the percolate in 1967is slightly lower than the precipitation of 1966 and thusindicates a delay of about one year. In Taastrup the weightedaverages of percolate and precipitate are close to each other andin 1966 they are equal. Thus, if the average for the whole yearis considered,the turn-over time is less than one year. However,the sharp decline in composition of June 1967 caused by appli-cation of irrigation water which was followed by low values inJuly and August, does not show up in the percolate of the end of1967 and thus the turn-over time may be'longer than half a year,but less than a full year.
Stable isotope data
Here too, in spite of the highly fluctuating input values, theoutput exhibits a large degree of stability. In no case does thedeviation from the weighted mean exceed one delta unit for 1^0.(Note: Deuterium values are not shown because they follow thesame general pattern. However, the relationship between D and"*-°0 is in some cases very useful and will be discussed separately).
Assuming that the years under consideration represent thenormal climatic conditions, it is then possible to use the stableisotopes data to compute the relative contribution of winter andsummer input to the percolate since its average compositionreflects the weighted mean of the effective infiltration.For instance, the Coshocton data for the period 1966 and 1967shows:
Weighted average of percolate -11 » of winters (Jan/Mar, Oct/Dec)-
" n of summers (Apr.-Sept.) - 5*7$o
Had the percolate consisted only of winter input, its compo-sition should have been different. If, however, we attribute•70$ of winter input and 30$ of summer tlie actual composition iBthe outcome. As discussed above, there exists an average delayof at least one year between input and output and thus suchcalculations are only justified if the previous years were notsubstantially different from 1966/67* An attempt to compare thetritium data of Coshocton and Chicago in order to obtain past

- 13 -
records for Coshocton showed a poor correlation and could notbe applied to this case. As a test the assumed 7O-3OJ»effective input was applied to the 1966 tritium data inCoshocton in order to predict the 196? percolate composition.
This resulted in a calculated value of 2*88 TD against the actualvalue of 313 TU. This may either be caused by a longer delayperiod (higher values in 19-65) or larger summer contribution.The second assumption is not consistent with the stable isotopedata. The same analysis for Juprelle shows an equal contributionof winter and summer. The application to tritium data resultsin a discrepancy of 40 TU (actual is lower than calculated).In Taastrup- both tritium and stable isotope averages for inputand output are close to each other and this type of calculationcannot be applied.
1.8 Discussion of the lysimeter studies.
It was reported that similar tritium output curves were obtainedin lysimeter experiments made in Heidelberg, Federal Eepublic of Germany.The considerable smoothing of the tritium in the lysimeter percolateswas first attributed to mixing, but soil cores showed that there was nosignificant mixing of water layers having different tritium contents,although some smoothing due to diffusion did occur. The second effect,which is such more important, is the preferential intake of the preci-pitation falling during different periods of the year. The summerrains, with high tritium content, are more or less consumed by theplants and do not reach the lysimeter bottom. The same is true alsofor late winter and spring precipitation. The early winter precipitation,which has relatively low tritium content, does reafih the lysimeter
/bottom. In the lower part of the lysimeters, the capillary fringe mayalso contribute to the smoothing of the tritium variations. The processof movement of soil moisture is a complicated one* the mean passagetime denends on the moisture content and on the depth of the lysimeter.The smooth curves of tritium which have values close to the annualmean tritium concentration in precipitation, are not due to the mixingthey result from a process of selecting the precipitation which has atritium concentration not very different from the annual mean.
Isotope data may provide valuable information on moisturemovement in the soil, even in cases where basic hydrological data aremissing. If a system is stable, and if deuterium and tritium contentsof the precipitation and the percolate are available, information onthe evaporation and mass transfer are not necessary.
The method of accounting for moisture can also be used to solveproblems of soil moisture movement.-- In this method, however, thephysical mechanism of the moisture transfer cannot be studied. It ispossible to use both methods, i.e.,- moisture accounting and variationsof the environmental isotopes in the input and output of the lysimeterstudy area. Certainly more information can be obtained in this way.The major objective of the lysimeter studies was the investigation ofchanges in the isotopic composition of the water between its infil-tration into the soil and its percolation into the zone of saturation.In this way the environmental isotope data of the precipitation can beused to estimate the isotope content of the input or recharge toground water systems.
Also reported were studies on large lysimeters (400 m surfacearea and 4 m deep). Three lysimeters having different plant covers arebeing studied with particular emphasis on C-14 analysis but samples arecollected also for analysis of tritium and deuterium content of the water.Such studies require long periods of time because the water percolatesvery slowly in the lysimeters.

- 1 4 -
1.9 TEE USE OP ENVIRONMENTAL ISOTOPES IK INFHTFATIOH STODXBS.BY L. Thilo and K.O. lEinnich.
H-3 and C-14 in shallow groundwater3 14The rise of both H and C concentrations in nature due to the
atmospheric tests of nuclear weapons opened the way for a number ofuseful applications in which these radioactive isotopes are used astracers. In particular, the way in which the increase of the 3 H (as wellas that of 14c concentration) are reflected in shallow groundwater canbe used to check the reliability of 3n and 1 4 Q ag e g of groundwater.Under favourable conditions bomb-produced tritium in uppermost ground-water also allows a determination of the recharge rate.
The validity of the isotope ages is based on a comparison of thebomb increase of both isotopes in the groundwater. An older age from14c data than from % means that there has been exchange in the *4C withcarbonate compounds in the transit of water from the land surface to thegroundwater sampling point. The average recharge rate, on the other hand,is determined by comparison of the total bomb tritium found in theupper groundwater with the average tritium concentration in post-bombrain. The -principles and the conditions for application and preliminaryresults in a few cases are given by Iffiinnich £~lJ7» With the techniquedescribed in detail elsewhere extensive sampling has been done in thearea of Sandhausen (Ehinevalley near Heidelberg). A tritium profiletaken at the same plaoe previously has been reported by Munnich £~lJ/»At that time a specially drilled observation well in which** a fillertube had been blocked by rubber balloons, thus confining a certain depthinterval, was sanroled. All tritium depth-profiles obtained are shownin Pig. 19. The total amount of tritium found below the water talfle(integral under TU vs. depth-curve) for the individual profiles is givenin Table I.
Site,
a
a
a
b
b
b
c
d
Date
IX, 67
XII, 67
I, 68
X, 66
TO, 67
XII, 67
I, 68
III, 68
TableSandhausen a, b,
TU x meter/€
900
1160
1360
1220
980 >
1390IJttO
1310
Ic and d
Depth of half value belowwater table
2.32.8
3.0
3.5?
3.22.0
4-2
*)' admixture from below during sampling

- 15 -
In Table I the variations with sampling site, as well as with thesampling date, are larger than was originally expected. Although thevalues for site A (Fig. 19s) seem to be rising with time, this increaseis too rapid to be attributed 'to the continuous tritium input byrecharge. That recharge is not the cause of the increase can also beseen from the shape of the curves in Pig. 19a where only the upper partof the curves is pushed down whereas the lower part is similar.The differences from one sampling site to another are not as serious asone might assume in view of possible inhomogeneities in the aquifer.Although the sampling sites are quite near to each other (from 10 to 20meters) small scale irregularities could still have an influence, sincethe flow velocity of the groundwater is only a few centimetres a day.The slight indications of peaks or other details in the individualprofiles may also be attributable to small irregularities in theaquifer. Although it is tempting to ascribe such peaks to thecorresponding variations of tritium concentration in rain, it isunlikely that such an effect would still be observed after the water hasbeen flowing in the aquifer for almost ten years. Nevertheless, withthe obtained recharge rate-of 170 mm/year and an assumed porosity of
£e O.35> the variations of tritium-concentration in rain,if "projected"into the aquifer are shown in Fig. 20. The sampling technique proved notto result in a vertical mixing of water in the aquifer even if largersamples are taken for ^4c measurement. ^See Fig. 19d}» To determine therecharge rate by measuring the tritium accretion in groundwater; it isnecessary to take more than one tritium-profile to determine an averagevalue for the tritium amount. From all the profiles measured in Sand-hausen an average value of (1200 ± 180) x£-TU metre - below the watertable is obtained. £ is the porosity. The standard deviation of 15%is not too serious if compared to uncertainties in the porosity andmoisture content above the water table.
The rise of H concentration in shallow groundwater can be conrDaredwith that of 14c. Since the laboratory experiments with aquifer materialfrom Sandhausen indicate a surface-layer carbon exchange taking placebetween the solid and liquid phase, this should also occur in nature,as the material we used in the column was untreated. As was explainedin ^"1 7- such an exchange would not influence equilibrium conditionswhere~the surface layer of the solid has been loaded to equilibriumwith C. In the case of a rising 14c concentration in the water,however, the establishment of a new exchange equilibrium results in thesame delay effect as observed in the column experiments. This effectcan be sought by comparing the increase of ^H and 14c concentrations ofgroundwater at different depths.
Samples for C analysis were taken in the same way as samples fortritium. Since larger samples are needed (60 liters for groundwater ofmedium hardness approx. 200 m mole of COp are needed for the measure-ment) care must be taken to prevent vertical mixing in the aquiferduring sampling. In the initial sampling technique with the moveablefilter such mixing did occur, as has been shown by tritium measurementof the same samples (see profile of June 66 in Fig-. 19b). With the newsampling technique (sampling downwards) no such mixing occurred(tritium values in Fig. 19d). The depth profile of 14c concentration
the uncertainty in € causes an additional error in the total amountof tritium in the groundwater.

- 16 -
in the groundwater is shown in Fig. 21. The profile for June 67corresponds to sampling site of Pig. 19b and that for March 68 toPig. 19d. The values for the June 67 profile for 5 and 6 metres mightbe higher, since the tritium values indicated admixture from below.The ^ C values are indicated. As the undisturbed 43 concentrationsshow, the initial value is around 60$ whereas the values normally foundfor groundwater are around 85$. This indicates that the input of CO^into the groundwater happens in such a way that, after dissolution ofCaCCL in the water containing CO^ the resulting HCO^ solution is nolonger in contact with the CO- source. This is confirmed by the13c values being around - ll$o (against PDB) instead of around - l6$owhere after dissolution of CaCO, the water remains in contact with theC0_ supply. This raises the ^t concentration from about 60$ to 85$ana causes *^C to change from - 12$o to about - I6$o. A depth profileof the CaCO.. content of the aquifer in Sandhausen is shown in Pig. 22.As there is^little CaCO, above the water table in the unsaturated zone,the C0_ can reach the water table in the gas-phase by diffusion.It dissolves in the water causing dissolution of CaCO...
The exchange between the resulting HCO, solution at the water tableand the C0? gas phase is much less than it is between soil moisture andC0p in the unsaturated zone. This is due to (l) considerable diffusionresistance in the gas phase and (2) the absence of turbulence in theliquid. Thus, a liquid layer even of moderate thickness reducesdiffusion to a minimum. Direct measurements of C0_ concentrations inthe unsaturated zone made by J. Pantidis resulted, in values between -0.3_and 0.5$ by volume. Such concentrations can keep about 3 m mo3feHCO3 and 0.2 m mole CO- in solution. The total carbonate hardness ofthe water as measured from the samples increased from about 3 m molejust below the water table to nearly 5 ni mole 7*5 meters deeper(see Pig. 23)» The &^C values of the CO,, above the water table being- 22 and - 20$o against PDB indicate the COp to be from plant origin.The origin of the CO- is important when loosing for a delay of ^ Cincrease in the groundwater. If from plant origin (humus), an additionaldelay of more than 2 years in the biosphere occurs. In Pig. 24 "the14c increase in the atmosphere is "projected" into the groundwater withand without this delay of 2 years. Even without the two.years delayno delay of 14c incrase can be seen if compared to the C input.With the half value-depth more than 3 meters below the water table,there also is no delay compared with the tritium profiles where thehalf value-de-nth is close to 3 meters below the water table also.
This result, on the other hand- should not be surprising if onethinks of the delay factor (see this report and £ 1 J) which iscalculated as /3= 1.1 for particle size 100 diameter, porosity O.35iCaCO.. content 15$ and carbonate hardness of 3 m mole/iitre. Even ifthis delay of 10$ occurs one would not expect to observe it.
Reference
£~1 7 K.O. Munnich et al., "Isotopes in Hydrology", p. 305IAEA, Vienna (1967).

- 17 -
1.10 Discussion on the use of environmental isotopes ininfiltration studies.
The first comment dealt with the horizontal groundwater movement.Because of the continuity requirement, one has to consider the horizon-tal movement of groundwater and the modification it would imply on thetritium and carbon-14 profiles. TEhen the movement is slow, it does notdistort much the profiles, as is probably the case in the aquiferstudied' the hydraulic gradient is 2foo and the groundwater velocity isestimated to be 20 m/yr.
A second comment pointed out that correction for the decay oftritium would improve the profiles presented in Fig. 19 and wouldlower tritium peaks. The method presented in the paper is based on theamount of tritium which goes to the groundwater rather than the identi-fication of thermonuclear tritium pulses. The former approach is moreconservative than the second, which uses the shape of the tritium pro-files in the groundwater•
Similar profiles were observed also in two boreholes in thesouthern Vienna Basin. This suggests active recharge from above withhigh tritium content mixed with a horizontal contribution of groundwaterflow that has a low tritium content. Although they give valuableinformation on the rate of recharge such studies are much more compli-cated than anticipated*
In ^C measurements made in the U.S.A., in two wells 20 metresapart, one well going just below the water table, and the otherconsiderably below, at about 25 metres, the -^C data indicated the sameage about 50$ of the modern standard for both wells. When ^C adjust-ments were made the ^4c of the shallow well came to 70$ and thedeeper one to &Ofo of the modern or more. This is rather a curiousresult as one expects younger water in the shallow well. Tritiumresults, however, confirmed the ^C results. The tritium content ofthe water sample collected from the shallow well was 20 TU- and fromthe deeper one was 50 TU. This indicated that the area around theshallow well receives recharge much less readily than the area aroundthe deeper well.
Fig. 23 shows that water at-the water table has an appreciablecarbonate content- this shows that solution has taken place in thenon-saturated soil zone, a fact observed in other studies made inGermany also.

- 18 -
1.11 EHYIF0BF3NTAL TEITIUM IN SOIL MDISTUEE AND GROUNDWAT^BIN DENMABK. Summary of the paper by Lars Jørgen Andersen.
Geogra-nhy and Geology
The investigations took place in a representative area of Karupin the central isart of Jutland Denmark (Fig. 25). Two wells wereaugered at localities with different geological and hydrologicalconditions. The first one Gr^nh^j no. 1 is in an unconfined aquiferof the outwashed sand and gravel of the last glaciation, which is themost common geological formation in the area. The land surface slopesslightly l,2^o. to WSW and the depth to the groundwater is about25 m below land surface. Wiis well is located at the groundwater divide,the depth to water decreases toward a central stream which has a slopeof about 1$
The second well is located near Engesvang in the southern part ofthe representative area, where the geological formations consist of theglacial drift, boulder clay from the Riss-glaciation and layers of melt-water sand. In the clay formation, a perched groundwater aquifer occursfrom 5-10 m below land surface. Beneath this aquifer and the boulderclay is a water-table aquifer in the meltwater sand. The groundwatertable here is about 25 m below land surface.
Drilling and sampling procedure
At two localities 6-inch wells were augered. Special care wastaken to prevent waj;er from entering the hole during drilling. Thematerial was sampled every*20 cm and stored in sealed tin containersfor later evaporation tests the weight of each sample was about 6 kg.Below the water table, water samples were*taken by hammering a screen,half a meter down below the bottom of the hole, and pumping by compres-sed air. The groundwater was stored in glass bottles. The pumping wascontinued long enough'before sample collection to obtain raw ground-water. The soil moisture from the unsaturated zone was later evapora-ted by distillation at. 110 - 125°C« The Bamples were weighed beforeand after evaporation and the distilled water from the samples wasweighted. The total loss in weight during the procedure averaged 1.8%.Th© water loss can probably be exnlained as a result of the effects ofa vacuun water pump whfch was introduced in.the pT©«edure to acceleratedistillation.
The volume of evaporated water varied from one sample to anotherdepending on the moisture content, which varied from 150 - 1500 cm3.
The number of samples, evaporated samples and analysed samplesfrom each of the two wells are as follows:
N U M B E R O P S A M P L E S
j
Grj^nh^j no. 1
ifengesvang
Prom the unsaturated zone j Prom the saturated zone1
sampled evaporated) analysed; sampled j analysed
j 1110 ' 43 ; 32 ! 11
j ! ]-
90 j 24 j 8 ] 8
5 • \
01
- 19 -
The tritium analysis has been made by the Danish Isotope Centrein Copenhagen by Mr. E. Morck. The benzene method was used. The sensi-bility of this method is 10 TU and the standard error is -^/o. All thevalues of the tritium concentrations are given fox December 1967*
The tritium x>rofiles
The result of the tritium analysis is shown graphically on Pigs.26 and 27 together with a geological log and a moisture log.The moisture determinations were made by the neutron method.
No tritium determinations are available on precipitation samplesfrom Danish stations during the previous years. Therefore, the valuesof Huddinge, Sweden, were adjusted with a factor of O.85 and correctedfor radioactive decay up to December 1967*
Values of precipitation at Gr/nh^j and estimated values of thedifference between precipitation and evapotranspiration from January1962 - March 1966 together with the above-mentioned adjusted tritiumvalues from Huddinge are tabulated in Table I, and weighted averageof tritium concentrations for the periods October - December. September-March and the year from February - February are tabulated in Table II.The low tritium content in the soil moisture below 18 m in the profilefrom Gr/nh^j may originate from precipitation from 1962 or earlier, andthe three peaks may represent recharge from precipitation from the years1963. 1964 and 1965* The low values in the upper two metres correspondto the precipitation values fj pm October 1965 to March 1966.
If the calculated tritium concentrations for the precipitation atGr^nhf$j are correct, the tritium concentration of tKl" soil moistureshows that the recharge may originate partly from precipitation in thesummer time too. It can be seen from Tables I and II that the tritiumconcentrations of the precipitation from wintertime are too low duringthe years 1962 - 1965 to produce the registrated- tritium content of thesoil moisture. From Table I it can be seen that an excess in precipi-tation (the volume of precipitation minus the volume of evapotranspi-ration) normally exists in all months except June and July. This shouldalso indicate that the possibilities of recharge to the groundwater orto the deeper parts of the unsaturated zone is possible during most ofthe year in the investigated area.
In the profile from Engesvang (Fig. 27) the low content of tritiumin the unsaturated zone below the perched aquifer indicates that onlysmall amounts of water infiltrate to this depth. This may be due tolow hydraulic conductivity of the clay formation, but the relativelyhigh moisture content of the clay beds should also prevent a fastermovement of the front of the infiltrated water. If the measuredcontent of 30 TU from the groundwater level is correct, it can beinterpreted as a result of horizontal movements of groundwater and theorigin of the tritium should be referred to as recharge outside thearea of the perched groundwater aquifer.
The amount of the recharge
If it is assumed that all soil water successively will be replacedby the later infiltrated water it should be possible to determine theamount of recharge if the total amount of soil water and the time duringwhich it has been infiltrated are known.

- 20 -
This should be the case at the well Gr^nh/j no. 1. Prom the moisturelog the amount of the total stored water in the unsaturated zone can becalculated. A summation of soil moisture between ground surface and18 m below ground surface gives a stored soil water volume of about1600 mm.
In accordance with the above assumption, this volume should beequal to the recharge during the years 1962-1966 because the tritiumprofile shows that the recharge from 1962 has arrived to a depth of about18 m below ground surface. The yearly amount of recharge as an averageof these 4 years should be calculated to be about 400 mm.
The summation of excess of precipitation during the same periodgives a value of about 1350 mm for the recharge. The deviation betweenthese two values can be explained if the estimated values of the evapo-transpiration are 400 mm per year but perhaps this value is too highand a value of 350 mm would be more realistic. This would increase theexcess in precipitation with 200 mm and agreement of the two determi-nations would be achieved.
Conclusion
The investigations have shown that the soil moisture is wellstratified in Tespect to tritium content and that a change in the contentof tritium of the precipitation during a rather short time seems to bedetectable in the soil moisture. It can be concluded that the summerprecipitation also contributes to the recharge.
The tritium profile at Gr^nh^j shows that the infiltration ratein homogeneous formations is rather low (4-5 m/year) in spite of arather high recharge (300 - 400 mm/year) and a low soil moisture content(about 10 vol.$). Tritium profiles in the unsaturated and saturatedzones would give much more information about the hydrological propertiesif the input concentration of the recharge water was better known.This probably can be done by a continuous sampling of recharge water,just below the root zone by using tensiometres under vacuum.
1.12 Discussion on environmental tritium in soil moistureand groundwater in Denmark.
By means of ^-transmission methods in two drillholes,the high apparent speed of the moisture movement, compared to theactual movement of water is also observed in other experiments.After a heavy rain moisture seems to move very fast downwards.In summer the movement of moisture does not reach the groundwater table,it actually is sucked by the plant roots to be transpired and evaporated.
When the water content of the soil exceeds the specific retentionof the soil, the downward movement starts. This movement is faster whenthe volume of the gravity water is larger. This type of movement isdifferent"from that taking place under saturated conditions where theresponse is almost immediate. In the case presented in the workingpaper the total porosity was 35$ and the moisture content only10 ~ 15$ per volume.

- 21 -
Table I
Precipitation at Gr^nh^j, estimated values of excess (P-E ) andcorrected values of tritium content in precipitation at HuddYnge 1962-66
!{'t
December
November
October
September
August
July
June
May
April
March
February
January
Pmm
56
5632
1966
P-B^mm
40
5132
ToorrTU
3
213
204
196
Pmm
92
544468
62
04
46
3470-
20
23
74
1965
P-E^mm
87
391421
2
34
-15
-1932
418
74
corrTU
158
15799296
610
539858668
265328
313
303
Pmm
120
4443
715698
93
24
37714
50
1964
P-Bmm
115
29
13
24
-428
32
-29-1
950
T"cor*TU
269
221
291
4711230
970
1715
1640
829
74§_675617 !
mm
14
L44LOO
51
139
5938
8741
33
8
8
1963
?-Evcm
9129
70
479
-11
-23
71
* 3
17
38
TeorrTU
487698
6931240
1805
2690
2745
1815
1730
1050
710
368
pmm
32
2942
58
143
575496
36
39
5760
1962
mm
27
1412
11
73
-13
-74320
23
5260
i TcorrTU
192
258
136
268
315538
576
574590420
472
276
Table II
Precipitation in mm and weighted average in tritium concentration TU,for the years 1962-1966
[
October-December
September-March
February-February
1965
mm
190
346
733
TU
145
188
350
1964
mm
207
375
625
TU
263
310
825
1963
mm
258
323
720
TU
690
770
950
1962
mm
113
167
592
TU
172
262
410

- 22 -
2. ENVIRONMENTAL ISOTOPES IN SURFACE WATER AND GLACIOLOGIC&L STUDIES
2.1 THE USE OF ENVIRONMENTAL ISOTOPES-PRECIPITATION - INFILTRATION - RUNOFF RELATIONS.Summary of the paper by T. Dinper
The use of environmental tracers in studying storage and waterbalance problems in surface and groundwater hydrology is possible onlyin cases where the tracer concentration in the input to the system isdifferent from the output due to fractionation, radioactive decay andto mixing processes which occur during the storage and the transit ofthe water in the system. In precipitation - infiltration - runoffrelations- the difference between the short-term variations in theinput concentrations and the almost constant tracer concentrations inthe output can be used with advantage to separate the different compo-nents of the runoff and to estimate the actual input to the subsurfacestorage.
It is possible to separate the two basic components of the totalrunoff by using the equations
- CSQs + CgQg &> 2>
where Q_ is the total runoff, Q is the surface runoff and Q is thesubsurface runoff," and C are the associated environmental tracer cotrations. Once the direct runoff is Calculated, infiltration can beestimated from the difference of precipitation and the total runoff
I - P - Q_ (3)a
The calculation of the infiltration by the subtraction of thetotal runoff from the precipitation which is used in routine hydrolo-gical studies is thus gredtiy improved, due to the fact that thislatter method does not taTee into account the increase of the subsurfacerunoff in res-oonse to the increasing infiltration.
It is also Dossible to calculate the build-up of subsurfacestorage by using the relation
AS - (i - Q_)At (4)
and relate it to Q , thus developing a relation between the activestorage and outflow from the storage.
The total subsurface storage volume can be determined usingthermonuclear tritium content of the base flow in a given basin. Thishas been extensively discussed by A. Nir,and some practical applicationshave already been made. /~lj %J
In studying Precipitation - Infiltratipn - Runoff relations, agood sampling coverage of precipitation and o^ the streamflow isnecessary. Samples of groundwater also could be helpful in choosingre-nresentative environmental isotope concentration values for thesubsurface runoff. The frequency of sampling depends on the type ofproblem studied^ in a rainflood study, hourly sampling could benecessary, whereas in a snowmelt runoff study daily sampling would besatisfactory.

2.2 Discussion
The present methods of studying the interaction of precipitation,surface water and groundwater are not adequate. Many of the routinemethods are based on some assumptions rather than observations of thehydrologic phenomena. Concepts o^ surface flow, subsurface flow andinterflow should be revised in the light of the results of the studiesby environmental isotopes.
The study of river basins with environmental isotopes, especiallywith tritium gives sur-nrising results and shows that only a small portionof water -nreci-nitated during the current year is carried out by thedrainage system. A study of environmental isotopes made in a smallmountain basin in northern Czechoslovakia [~i "J confirmed this fact.It was seen that less than kalf of the me&water from the snow appearedin the runoff during the snowmelt season. The larger part of itinfiltrated and reap-neared mixed with water from the preceding andfollowing years, two years later. Jlg.28 gives the basic environmentalisotope and hydrological data in graphical form*
References
/" 1 7 A. Kir, On the interpretation of tritium "age" measurements ofgroundwater. J. Geophys. Ees. §9_ (1964) No. 12 pp. 2589-95.
/~2 7 T. Dinner and G.H. Davis, Some considerations on tritium dating*~ ~ and the estimates of the tritium input functions.
Memoires Vol. VIII. International Association of Hydrogeologists Congress of Istanbul. 1967 "DP. 2?6-286.
7 T. Dinper et al», Tritium and oxygen-18 in snowmelt-runoffstudies (to be^published).

- 24 -
2.3 THE USB OF MVIBOlfMENTAL ISOTOP-S HvT GLACIOLOGICAL STUDIES.Summary of the contribution by W Dansgaard
Ten years ago Schoellander measured the age of the icebergscoming from glaciers,using the ^4c dating method and foundsuprisingly low ages; one was 3000 years old and ten others had agesof less than 1000 years. Recently we repeated the measurements usingimproved sample collection and extraction techniques. When the snow isaccumulated in a glacier, some atmospheric air is trapped in the veryfine bubbles which makes the ice- appear white. Since the ice ispractically impermeable, the measurement of the *4c content of the airtrapped in the ice is a good measure of the period when the air wastrapped. To obtain 50 milligrams of carbon for analysis about 4 tonsof ice are required.
Samples were collected from 15 icebergs. The C analyses havenot been made yet. but the silicon-32 content of the ice samples hasbeen measured. In fact no silicon-32 has been found in these samplesexcept in one. The measuring accuracy bein 0.01 dm/ton, which is 30times lower than the natural specific activity of silicon-32 in the ice,th? ice samples should be at least 3000 years old as one would exnect.
Fig. 29 shows the flow pattern of the ice in Greenland. The ice.in the central part of the island moves right down to the bottom andthen follows a course parallel to the land surface. Since the accumu-lation is 0.3 metres of ice per year and since the depth of the glacieris approximately 3000 m- it -mist take mor'e than 10,000 years for the iceto reach the bottom of the glacier and much more down to the coast.
In 1966, the Cold Region Research Establishment laboratories(CORE) in Hanover, New Hampshire, obtained cores of ice at Camp Centuryin Greenland down to a depth of 1400 m. The stable isotope variationsof these samples were measured and provide an almost unique opportunityto study the past climatic conditions.
The surface velocity of the glacier where the samples were takenis 3«3 m/yr. This implies that all samples which were measured havetheir origin in the same area.
By studying the stable isotope variation in the core, which showssignificant seasonal variations, it is possible to estimate the accumu-lation rate of the ice. The mean oxygen-18 content of the longerportions of the core, on the other hand, gives information about themean atmospheric temperature at the time of deposition of the snowseveral thousand years ago.
The vertical stress in the glacier reduces the wave lengths ofthe stable isotope content of the ice. Therefore, the actual thicknessis not necessarily the accumulation at the time of deposition.A correction factor, which depends on the mode of flow of the ice isneeded.
Owing to diffusion the amplitude of the seasonal variations isreduced in time. The diffusion coefficient of the ice at prevailingtemperatures is 5 x 10~^^ cm2/sec Although this value is extremelylow, it stabilizes the seasonal variations in several thousand years.

In order to interpret the variations in wave lengths and ampli-tudes related to stable isotope content of ice layers, a proper flowmodel should be chosen. The generally accented model conceived byNye simply assumes a uniform vertical strain rate which is defined asthe relative change of thickness of the annual layers per unit of time.This implies a flow model with uniform horizontal velocities along avertical core until a few metres above the bedrock. This is a simplemodel, which would be suitable for an ideal plastic material. However itis known that the ice is not perfectly plastic.
The velocity -profile can be approximated by horizontal velocitiesproportional to the distance from the bed up to some 400 metres from thebottom and between 400 - 1400 metres from the bottom constant velocitycan be assumed. Based on these assumptions the vertical velocities canbe calculated.
If a coordinate system moving with the same velocity as the iceis introduced and if a sheet of ice in this coordinate system is consi-dered, the sheet of ice involving many periods of practically the same A. ,it will be seen that there is a certain velocity in this moving system.
If the amplitude of oxygen-18 variations are plotted versus timeor age of the ice layers, the amplitude will practically be zero in12,000 years. This gives an indication how far back one can go in timeto find the oxygen-18 variations in the ice.
* *At Camp Century the oxygen-18 variations were measured in function
of the depth. It was found that some years had an accumulation of0.17 metres, almost half of the mean accumulation rate.
2.4 Discussion
The determination of stable isotope variation in the past10 - 20,000 years would be useful in other environmental isotopeapplications in hydrology. In many cases when the deuterium andoxygen-18 content of the groundwater sanroles in a given region areplotted against each other a scattering of data is observed, eventhough no altitude effect is expected. This scattering is probably dueto the difference of mean ages of the samples. If the stable isotopevariations in the past were known, it would be possible to interpretthe groundwater data and even tell something- about the recharge period.
A second point of interest is the analogy of the reduction of theamplitude of stable isotope variations in glaciers and in groundwater.In some aquifers, where the circulation is fast the stable isotopevariation in the input is not completely lost in the output, especiallythat of springs. The comparison of the variation in the input andoutput is related to the turnover time of the system. In a study madein Cheju Island, South Korea, such variations were observed in thesprings along the periphery of the island, indicating rather a fastcirculation in the basalt aquifer feeding these springs /~1_7»On the other hand, in groundwater where the movement is slow, no stableisotope variations are observed.
Such interpretations may be misleading when there are mixtures ofwaters of different ages and origins. A change in the relative contri-bution of the components or sources of the water causes some variationin the stable isotope content in the outlet. However, this is also truefor the other environmental isotope data, namely, tritium or carbon-14»

- 26 -
The changes that are observed in the mean annual stable isotopevalues could be due either to a real change or to the relative change ofseasonal contributions or both. The phases, it was stated., were not equalas in a cosine function. The samples representing one year are coveringthe period since I89O. They show clearly the warming up of the climatein the twenties and also the cooling of the climate after the forties.To study these variations it is also necessary to measure the oscillationabout the mean value. The curve in Fig. 3 0 shows the distribution betweenthe summer and winter precipitation and thus gives much more information.
The core in Camp Century probably represents a few thousands ofyears of accumulation. Toward the bottom of the glacier the definitionof the individual layers is impossible and it is not known how manyyears are represented. In the usual procedure 8 samples were analyzedfor an annual layer, thus 80 samples give satisfactory information for adecade.
Davis, G.H., et al. Geohydrologic interpretations of volcanicisland from environmental isotopes.

- 27 -
3.1 SOLS PRACTICAL CuvSIDEMTIONS IKI3CT0PE APPLICATIONS IN EYDROLOGIC STUDIES.Summary of the contribution by G.H. Davis
Research in application of environmental isotope techniques tohydrologic problems has been active and fertile over the past decade.The development of techniques for use of tritium, carbon-14 and morerecently silicon-32 in groundwater dating and the broad spectrum ofapplications of deuterium and oxygen-18 in water problems has nearly alltaken place during this period. However, the practical use of thesetechniques has generally not kept pace with the research and development.This is due, no doubt, in part to lack of communication between researchscientists and people concerned with practical field problems, but alsoto the fact that water problems in the highly developed nations wherethe research is carried out, generally are greatly different in type andscope from water problems in the developing nations. For example, themain problems facing hydrologists in Northwestern Europe, a humid,industrialized area, are entirely different from the arid and semi-aridbelts of Asia, Africa and South America.
Even the most sophisticated techniques for investigating under-ground raters give results that are crude in comparison with the simpletechnique of gauging flow in a surface stream with a current meter.Like*>7ise, quantitative estimates of interrelations of surface and under-ground ••/aters are subject to similar uncertainties because undergroundflow of some form plays an important role in nearly all flow systems.By the same token, underground*'flow does not lend itself to applicationof simple models because of the great complexity of the flow paths.For these reasons the subsurface environment deserves the specialattention of isotope workers. The task is complex and difficult butthe need is great for better tools.
The great value of environmental isotope applications to subsur-face water problems lies in the fact that the isotopes of hydrogen andoxygen form part of the water molecule and therefore approach therequirement for the ideal tracer. Furthermore, the environmentalisotopes, such as tritium, carbon-14> and silicon-32, are not subjectto replenishmentpfrom underground sources. Used- in combination, thestable isotopes H, and ^"0 offer the features of areal and seasonalvariability in input (recharge) while the radioactive isotopes, ^E, l^C,and 32(ji} have known variable inputs as well as characteristic radio-active decay rates after the water has been removed from contact withthe atmosphere.
From the beginning of environmental isotope applications tounderground waters much emphasis has been placed on using the propertyof radioactive decay to gauge velocity of flow. T.Vhile this is indeedan important potential application, other equally valuable applicationshave tended to be overlooked. Furthermore, many attempts to arrive atsubsurface flow rates have failed because of the use of oversimplifiedor erroneous models of the subsurface flow system. One example of thisis the use of models assuming piston flow of water in groundwatersystems despite a voluminous literature that demonstrates the importanceof dispersion mixing in flor/ through porous media. Such oversimplifi-cations have tended to discredit isotope work in the eyes of conventionalhydrologists and many sound demonstrations of valid results will beneeded to dispel this poor impression.

- 28 -
One particularly important aspect of application of environmentalisotope techniques that has not received sufficient attention is theiruse in describing the subsurface environment. Unlike the physicalscientist, who can design his experiment, the practising hydrologistis usually faced with a situtation where nature designed the experimentfor him, then threw away the plans, and buried the equipment. Thehydrologist can often draw broad qualitative conclusions as to directionand rate of flow from surface evidence, such as terrain features, geologicfeatures, and surface waters. To quantify these concepts, however,generally requires expensive and detailed sampling of the subsurfaceenvironment by test drilling, laboratory analysis or core materials,pumping tests, chemical analyses of the water, and other indirectsampling procedures. Even with intensive investigation using theseconventional methods, many questions cannot be resolved without theapplication of environmental isotopes. To cite but a few of the moreimportant questions where even qualitative answers help to define theflow system model:
(a) Degree of stratification of subsurface waters.
(b) Whether or not infiltration from land surface is significant.
(c) Degree of confinement.
(d) Sources and seasonal distribution of recharge.
(e) Relative contributions to blends of waters havingdifferent travel times.
(f) General magnitude of underground storage asreflected by isotope variability in discharge.
(g) Hydraulic connection with lakeland swamps,
(h) Sources of contamination.
A good example of point (g) is the study of the Cheju island, anoceanic island which consists mainly of volcanic terrains similar tothe Hawaiian volcanic formations, with apparently high permeability.In general one would have expected a large ground\vater reservoir beneaththe island, a fresh vater lens floating over salt water, due to thedifference of density of about 3$ of the two fluids. However, thedrilling which has been carried on by the Korean government was invariablyunsuccessful in that whsn they found the water at all, it was saline.This led thsm to the conclusion that the fresh wator lena was so thinthat it would not be economic to consider the development of thisresource. However, by periodic tritium and stable isotope samplingit was possible to show that the turnover time of the subsurfacereservoir was substantial, on the order of about 9
Using the combined environmental isotope approach, it is generallypossible to greatly improve the model of the subsurface-flow regime.I/Then a valid model has been developed, it is feasible to apply theproperty of radioactive decay to quantitative estimates of groundwatervelocity and storage capacity.
It is evident that the approach described above requires theclose collaboration of laboratory and field workers and a full spectrumof analytical facilities for adequate backup. Such a systematic,integrated technique has been applied with great success in recent years

- 29 -
"by IAEA in its field projects. A technique of special value is thatused "by IAEA cf reconnaissance sanroling of numerous sources for stableisotope analysis followed later by more time-consuming and expensivetritium and carbon-14 methods depending on what the stable isotopework reveals.
3.2 Discussion
An exam-le of testing of hydrologic hypotheses with environmentalisotopes was given by describing a study made by the U.S. GeologicalSurvey in conjunction with the State of Texas. The problem was todetermine the origin of some saline springs (2>Ofo sodium chloride) whichwere causing serious contamination to rivers to which they weretributary. This problem was solved with relatively little effort bystudying the deuterium content of the springs and the precipitationoriginating from storms having various moisture origins.
The collection and storage of water samples for subsequentanalysis would greatly help many studies of environmental isotopes ingroundwater in the future. This especially applies to the thermonucleartritium, which has a transient feature. The collection and storage ofwater samples from rivers springs and groundwater in general does notpresent problems and does not cost much. The analysis of these sanmles,whenever needed, could help to solve many hydrological problems,especially those related to aquifers with rapid circulation systems,such as karst and non-confined aquifers. A watar sample represents apotential amount of information even before it is analysed. Ihensamples are not available, it is not possible to obtain the informationrelated to time, as there is continuous time variation in the thermo-nuclear tritium content of the water. Hydrological services of thecountries should therefore-, have a reasonable routine programme ofwater sampling. This is true also of the chemical analysis of thewater. As to the storage of the samples, glass bottles with a screwcap and polyethylene gaskets would be adequate. The losses from suchbottles would be about 10 mg/yr. They can be weighed with sensitivebalances to see whether significant losses have taken place.

- 3*-
3 O ON TEE APPBOACH TO EYDROLOGIC PBOBLEMS.Summary of the contribution by A. Hir
When using environmental isotope methods, hydrologists shouldfirst formulate a hypothesis or hypotheses concerning a given hydro-logic -nroblem. The second step is to figure out isotopic patterns thatfit the different hypotheses. A few measurements of environmentalisotope content of water in the system may then "be sufficient tosupport one hypothesis and reject others. Before drilling a "borehole,for exampl-e, geologists liave some idea of the formations and theaquifers which can "be tapped during the drilling based on surfacegeology, previous reports., or other sources of information. The isotopeworker also should have the same type of knowledge- he should haveat least a hypothesis before the sampling programme for environmentalisotopes is undertaken. In fact, the extent and frequency of thesampling depends on the type of problem and the hypotheses that canlogically be developed to study the problem.
In general, in areas where little is known about the hydrology,environmental isotope studies are of greatest value. In areas wherehydrologic information is abundant, environmental isotope data isuseful mainly to give additional confirmation to conditions alreadylargely known.
As with some other relatively young scientific disciplines, inthe application of environmental isotope techniques in h^irology, firstthe measurement technique was developed and then a considerable amountof data has been collected but adequate interpretation of much of thedata is still lacking. Generally methods of interpretation develop andimnrove after initial data collection. The application of environmen-tal isotopes in 1968 is still in the stage where reliable measurementsand a large amount of data are available but these data contain alarge amount of "noise" that needs to be eliminated. Better measure-ments are not enough to remove this noise; it is inherent in themeasurements of hydrologic parameters. It would be useful for hydro-logists to learn from other disciplines techniques used to filter thenoise out of the significant information. These methods should bestudied ancl tested experimentally first in areas where good hydrologicinformation is available* then they may be applied to other regions.

- 31 -
3.4 OK THE APPLICATION OF HmHOKlCTTAL ISOTOPE DATAIK GROUED^ATSR RESOURCES DEVELOPMENT.Summary of the contribution by T. Harpaz
There are three phases in the water resources developmentengineering which can be defined as:
(a) Exploratory stage: In regions where no or little physicaldata (climate, geology, hydrology, etc.) are available, itis usual to start with a reconnaissance study to obtain somequalitative information concerning the availability of thewater resources and on the possibility of their developmentfor various uses, which are. in general, water use fordomestic purposes and for irrigation.
(b) The Development stage: This is the second stage wheredetailed investigations are made in order to make quantitativeevaluation of the water resources in the region. This stagealso involves the construction of the first facilities suchas dams, and canals, for storage and distribution of waterand exnlatory boreholes and wells for groundwater.
(c) The Operation and the Management stage: This stage is concer-ned with the optimal operation of the water resources in use. •In this stage much more sophisticated quantitative methodsare needed.
-. — — —In all three stages environmental isotopes can be used profitably.
The three basic conmonents of a hydrologic system are the inflow, theoutflow, and the system itself. The system has 2 kinds of properties•(l) "medium" and (2) "state" (or operational level) parameters.The first are storativity, permeability, transmissivity and the porosi-ty of the system, which do not change with time but may have, and,indeed often do, have large variations from one point to another. Thesecond type includes the instantaneous levels of a reservoir, andvolume of storage, at a given time; they are not related to the medium.
It.is useful furthermore, to classify the methods used in hydro-logic studies in two basic groups called direct and indirect methods.Direct methods are those in -which physical measurements can be made,such as water level measurements, determination of the porosity andpermeability of the aquifer samples in the laboratory, measurement ofthe spring flow and so on. The indirect methods are those in which,for example, an estimate of the input is made by knowing the output andchange of volume of the reservoir, or the reservoir characteristicsare determined by comparing the input and the output.
In the exploratory stage of water resource development there isnoed to define the system, its boundaries and general characteristics.These evaluations are, in general, of qualitative nature they describesuch characteristics as confinement of the aquifer, active recharge, orthe dependability of the storage. In such descriptions environmentalisotopes are useful in estimating the rate of circulation and recharge(tritium carbon~14). interrelation with surface water (deuterium,oxygen-l8) and dependability of the storage (tritium, carbon-14)»

- 32 -
In the second stage of water resource development, however,environmental isotopes can be an even more powerful tool. The answersshould "be quantitative and should complement conventional hydrologictechniques. In this case environmental isotopes help determine theinput, the output, and the state parameters. At the end of this stagehydrologists develop a model which can be used in the operational stageto forecast the effect of various inputs and changes in the system.
In the second stage, also, it is possible to use environmentalisotope tracers to estimate the mean residence time of the water inthe system, the storage volumes, and to establish the water balanoe ofthe system using additional isotope balance equations. One of the mostimportant applications is the use of.stable isotopes to identify areasof recharge and areas of discharge^easily located by conventionalhydrologic methods.
In the third stage the use of models is necessary to calculatethe response of the system to natural and man-induced inputs. Newstate parameters, such as disttersivity and mixing which are notimportant at the earlier stages have to be considered at this stage.Stable isotopes and tritium can be very useful in this respect.
In the third stage also, hydrologists may use "mass models"in addition to an hydraulic model in which only the dynamics of thesystem is studied. Environmental isotope tracers along with artificialradioisotopes, can "be useful in establishing and testing the massmodels. A new parameter — th*e tracer concentration — is thus intro-duced in the study,
3.5 Discussion
During the discussion of the paper by Harpaz, it was stressedthat the environmental isotope sampling should start at the earlieststage of water resource investigations. For a successful interpre-tation of the environmental isotope data, a long series of observationsis necessary just as is true for other type of hydrological information.This is especially important when there are transient conditions inthe mass flow and the environmental tracer input to the system.

- 33 -
3.6 UTILIZATION OP ENVIRONMENTAL ISOTOPE TSCSTIQitTES INWATER EESOUECES INVESTIGATIONS ANT DEVELOPMENT.Summary of the naner by E. Ambroggi and D.J. Burdon
The i>aper reviews the urgent need for development of water resourcesand the:role of^national and international organizations in thatdevelopment. After dealing with the nroblems of water-resources investi-gations and development, planning and management of environmental iso-topes in hydrology is explained. It is pointed out that chemical methods(l) are still of major importance in studying the genesis of waters.These methods now should be supplemented by environmental isotope tech-niques .
In the part dealing with precipitation, surface water and under-ground water, the authors point out the usefulness of WMO/IAEA worldwidenetwork of survey of environmental isotopes in precipitation. Theyfurther note the potential use of environmental isotopes in surface, waterstudies. Concerning the groundwater, they state that the intangibleoccurrence of groundwater has led to neglect of this major resource byhydrologists. Now environmental isotopes offer a powerful tool for theinvestigation of this resource.
The authors then point to the collaboration of FAO and IAEA inseveral UN Special Fund projectB which provide means for improving ourunderstanding of both groundwater hydrology and the behaviour of theEnvironmental isotopes in nature; this work will also improve the inter-pretation of the environmental isotopes in hydrology.
There is need for a continual dialogue and exchange of hypothesesbetween the field hydrologists, hydrogeologists and the physicists andother research workers. Some hypotheses put forward by the laboratoryworkers as a result of their analyses may readily be disproved by somerelated field evidence; likewise, other hypotheses may ox>en up new linesof field investigations, which would otherwise be neglected. This activequestion-and-answer relation is most beneficial for the interpretationof the environmental isotopes because it requires the translation of theisotope data into the hydrological information.
The authors finally arrive at the following conclusions:
(i) The utilization of environmental isotope techniques in waterresources investigation and development by FAO in collabora-tion with IAEA is a direct application of science and techno-logy to the problems of the developing countries.
(ii) The use of environmental isotope techniques reduces the timetaken to determine and evaluate water resources and so permitssound water resources development to take place at an earlierdate. It thus helps to accelerate the use of water forirrigation and food production.
(iii)The use of environmental isotope techniques represents acollaboration between the field workers on water resourcessurvey and development projects (mainly under the UNDP SpecialFund) and the research workers who have made available suchtechniques for the use and benefit of the developing countries.
(iv) There is a need for a continuing and active dialogue betweenthe field workers and the research workers; this interchangeof problem and hypothesis must be strengthened to lead toeven quicker and more fruitful solutions.

- 34 -
3*7 AN EXAMPLE OP TEB COOPERATIVE WORK WITH FAO IN GROUND WATERINVESTIGATIONS IN JORDAN. Summary of the paper "byG.E. Davis
Fig. 32 shows the general layout of the project, a study of thegroundwater resources in the high plateau and the southern desert ofJordan. The Dead Sea occupies a structural downdrop block, and isbordered on the east by a major fault. East of this fault line a verysxeep escarpment rises from about 400 m to more than 1000 m above sealevel. In the high plateau, where the precipitation varies between200 - 600 mm, the rainfall belt is very narrow and follows a north-southdirection. The rest of the country receives less than 50 mm precipita-tion. The major input to groundwater, therefore, is along the escarp-ment where the precipitation is relatively high; it originates frommoist air masses coming from the west.
Initially no environmental isotope data were being collected atprecipitation stations in the project area. The first task, then, wasto sample the precipitation at four stations in the rainfall belt(irbid Amman, Rabba and Shobak). The precipitation increases in thenorth-south direction: however, there is also a marked decrease ofaltitude in that direction. It was expected, therefore, that thealtitude effect would be counterbalanced by the amount effect. This hasnow been confirmed by the stable isotope data (Fig. 3 2)»
The isotopic composition of the groundwater was found to varyslightly from one point to another. However, a common feature of thesewaters was the fact that on a j) - ^°o diagram all points were foundon the right side of the so-called mediterranean precipitation linedefined by -fche precipitation in Israel and Jordan precipitation. (Fig. 33)'Some of the groundwater samples were collected from springs, some fromwells and test holes. The points representing these samples.areclustered around the line with slope 8 and intercept 10, instead of theline representing the precipitation in Jordan and Israel. This illus-trated that a single isotope is not enough to define a body of ground-water and that the isotopic composition of the groundwater samples do notnecessarily fall on the line defined by the isotopic composition of theprecipitation occurring in the presumed recharge area.
There are groundwater samples containing significant amounts ofthermonuclear tritium. The carbon-14 content of the samples are about80-85$ of the mod'ern, which also shows that the waters are modern andhave an average residence or transit time of 10 ~ 20 years. On theother hand, there are samples with low tritium and carbon-14; theseshould be ancient waters. Carbon-14 dates were corrected using a modifi-cation of Pearson's method based on the ^-3c/12c ratios.
In the high plateau the aquifer consists of limestone where, itwas assumed, recharge would occur readily. Oddly enough, however, thetritium content of the waters in this region is rather low. In theJebel-Druz area, on the other hand, groundwater samples are depleted withrespect to stable isotopes as a result of the high elevation of therecharge area. Characteristically, in the hot springs, a marked shiftin 0-18 values was found.
- 35 -
These results, although difficult to interpret in some cases,yield valuable information on the groundwater system in Jordan. Atspecific locations information was obtained on the existence of modernrecharge using tritium. There is no doubt that much of the water in theSouthern Desert is of Pleistocene age as indicated by the carbon-14contents. In the Azraq basin, which is heavily developed with shallowirrigation wells it was first assumed that recharge came from along theEastern Jordan Valley escarpment moving rapidly toward the Azrag region.However the carbon-14 and stable isotope content of the waters indicatethat they ate at least thousands of years old and are related torecharge taking place in the arid zone rather than from the precipitationalong the escarpment.
A major question in interpreting the stable isotope data is thesignificant shift toward the right of the points representing groundwaterswith respect to the Jordan-Israel precipitation on the D -J-°X) graph.No satisfactory answer has yet been found to this question.
3.8 Discussion
The pH of groundwaters can influence the oxygen-18 content of thesamples collected. When pE ie higher than 6, the possibility of exchangebetween a limestone aquifer and the water can be discarded.
The frequency of storms decreasing toward the east may beresponsible for a different isotopic composition of the rainfall inland.Obviously such problems should be solved in connection with the study ofthe major storms in the region considered.
In the southern desert region old waters, probably of Pleistoceneage, although depleted with respect to the modern groundwaters, arefound on the same " D - i&0 relation with modern waters. This relationis different from the line defined by the precipitation data obtainedduring recent years in Israel and Jordan* Evaporation could cause sucha shift toward the right. However, such evaporation is different fromthat which occurs during the fall of the raindrops and is probablyrelated to the evaporation taking place at the surface of the soil,prior to infiltration.
The interpretation of the stable isotope content of groundwater inrelation to the stable isotope content of the precipitation contributingto the recharge is rather questionable; in a^discTission of tha$cseveralfactors should be taken into account^when interpreting these results.
An important point is the statistical nature of the variations ofthe stable isotope content of the precipitation. Time and areal isotopicvariations should be studied separately. At a given station the stableisotope content of the precipitation depends largely on the isotopiccomposition of the water vapour from which the precipitation is derivedplus such effects as the evaporation of the falling raindrops. There is,therefore, no reason to expect a definite relation between deuterium andoxygen-18. As the condensation occurs in equilibrium, i.e. in saturationconditions, the deuterium and oxygen-18 values of the precipitationsthat result from this vapour will lie on a line with a slope of 8.

- 36 -
The subsequent evaporation, which takes place during the fall of theraindrops, may change this slope somewhat, but in general, if the timeaverages of the deuterium and oxygen-18 content of the precipitation ina given region are plotted against each other, a slope of approximately8 results.
The relation between deuterium and oxygen-18, however, might havedifferent intercepts on the deuterium axis, i.e. excess deuterium valuesrelative to the regional or global climatic changes. Such variationswill make the comparison of the stable isotope content of the groundwaterswith that of the precipitation difficult because the time averagesrepresented by groundwater samples cover much longer periods than thestable isotope data of the precipitation.
In some cases carbon-14 ages are well correlated with the stableisotope content of the groundwater. In the Graz basin in Austria aremarkable relation (Fig* 34) 'vr&s actually found, which indicates theinfluenoe of the paleotemperatures on the stable isotope content of thegroundwaters. If the variations of paleotemperatures were known, stableisotopes, together with the chemical quality of water could give valuableinformation as to the age of water. Such information could be used in con-junction with the apparent carbon-14 ages and be useful in a way toadjust these apparent ages and bring them to the true time scale.
This approach, although theoretically acceptable, does not holdin regions si ch as FloricLa- where no significant variation in stableisotopes occurs in either modern or very old groundwaters. according tothe deuterium and oxygen-18 data collected in eartoa-14 studies fa IlarMa-This can be explained by the geographic setting of Florida, a peninsulasurrounded by oceanic waters. Recharge patterns of the past weresimilar to those of today. Most recharge occurs in summer by heavythunderstorms and isoto-ne fractionation takes place as a single stageEayleigh process. A change in stable isotope content of the precipi-tation would occur only if different temperature and relative humidityconditions prevail over the oceans.

- 37 -
3.9 THE USE OF WYIROMKnTAL ISOTOPES IS KARST EYDEOLOGYBy B.B. Payne and T. Dincer
3«9«1 Background
Karst formations are the most important aquifers in many regionsof the world. Three special hydrologic features characterizing themare: the absence of a well-developed surface drainage network: a highinfiltration capacity- and a concentrated subsurface flow pattern.
Several aspects of a karst aqvifer system resemble a surfacewater system. For example, flow in the subsurface karst system isconcentrated along major faults, solution channels and fractures, asflow in surface water is concentrated in surface streams. The highinfiltration capacity of karst formations is evidenced by scarcity ofsurface drainage, the disappearance of large rivers into sinks, andlarge losses of water from lakes through sinks into the subsurface.The discharge of water from springs in large flows at the terminal endsof karst aquifer systems parallels the discharge of water by surfacestreams in a normal surface water system.
Finally, flow from a karst aquifer has the same two basicconroonents as surface water. The first component which recedesquickly, is seasonal and is related to precipitation and the undergroundchannel system. The relatively small storage capacity of thesechannels compares with channel storage of a surface system. The secondcomponent recedes slowly and indicates a large storage volume. Itcorresponds to base flow from a basin and comes from the multitude ofminute fractures which make up the real storage capacity of a karstaquifer. *"
3»9«2 Interpretation of Environmental Tritium Data in Karst Groundwater
Separation of the two basic components in karst springs qualita-tively may be possible through use of tritium. High tritium contentduring times of high flow and low tritium content during low flow periodsindicate that the high-flow with high tritium content should come mostlyfrom recent precipitation containing bomb-produced tritium. Low tritiumcontent in the low "base" flow should come mostly from water that hasbeen in storage (and in transit) since pre-bomb times. Pointing outthese two facts with tritium is neither startling nor particularlyinteresting. Hydrologists have made this separation for many yearsby merely measuring discharge regularly, without resorting to elaboratelaboratory analyses. The interest of the tritium data in karst hydro-logy consists essentially in estimating the mean residence or transittimes in the karst and in estimating the size of the storage in the casewhere the outlet is a karst spring with a known discharge.
3.9*2.1 Transit time distribution function in karst systems
In an interpretation based on transient tracer input in ahydrologic system, the so -called transit or residenoe time distributionof the water becomes one of the most important elements to be determined.In studying karst hydrology with tritium — which is particularlysuited for such studies because karst hydrology has some characteri-stics of both surface- and ground-water systems — the determination ofthe transit time distribution is critical owing to the presence ofthermonuclear tritium from precipitation.

- 38 -
Pirst, assume that the transit time distribution at the outlet ofa karst system, that is a spring, is similar to the transit timedistribution of the surface runoff in a basin. This assumption is basedon the following:
(a) Unlike the slow movement of a granular aquifer, the flowin a karst follows a concentrated pattern like surface flowwith rather high velocities.
(b) Karst systems ordinarily have extensive recharge areas; thisis evident from the large spring flows observed in such regions.
(c) Surface streams and karst systems are similar.
(d) Karst systems have a slow moving component similarto the subsurface runoff in river basins.
(e) Most of the large outlets of karst systems are found,in general, at or near the watershed borders. In many casesthey are also situated close to recharge areas and includedischarge that is circulated rather rapidly.
It is possible to consider the transit time distribution of waterin a karst system as a two-dimensional distribution. The first dimen-sion - time - results from the dispersion of water molecules startingfrom the same area of recharge; the second dimension — again time -results from the various distances water has to travel from widelyseparated recharge areas to the outlet of the system. In a confinedaquifer, only the first dimension would be important. This two-dimeri- "*sional transit time distribution function is, therefore, a rather flatdistribution and its standard deviation is in the order of magnitudeof its mean value.
3.9.2.2 Calculation of expected tritium content of the springs underdifferent assumptions.
The interpretation of the tritium content of karst water is madeaccording to the following steps:
(a) Estimate the tritium in the recharge either on a monthly orseasonal basis, depending on the climatic features of theregion studied*
(b) Calculate the transit time distribution functionswith different variances.
(c) Ccrpare the expected "tritium values obtained from theccnvolution integral with the actual tritium contentcf water samples collected from springs or groundwater
Although the approach is relatively simple, there are severalproblems related to the comparison of the expected and actual tritiumcontent of water samples.
One of these problems arises when we consider the mixing of watershaving essentially different mean transit times, i.e. the mixture ofsome recent karst water with the old karst water. In such a case, therelative tritium variation observed in a series of samples collectedduring a certain period of time will be similar to the variation whichwould be observed in a sample consisting only of recent waters containingthermonuclear tritium. Therefore, the absence of large time variationin tritium concentration in karst spring water indicates a single system.

- 39 -
3«9»2.3 Patterns of tritium variation in karst springs
Actual observations made in many karst springs have shown thatas the tritium content of the water decreases, the time variation isalso considerably reduced. The high tritium fallout of 1963-64 does notappear to have affected the tritium concentration of many karst snrings.This can be explained by very flat transit time distribution in comparisonto the mean transit time in the karst systems so far investigated, whichfits the analogy of karst systems with surface waters.
Once a mean transit" time has been determined using the aboveapproach, it is possible to estimate storage in a karst aquifer if thedischarges of the main springs are known. In a karst snring in southernTurkey with a constant discharge of apnroximately 10 nH/sec, tritiumlevels never rose above 30 TU during the period 1963-68. Even withoutattempting to estimate the storage feeding this spring, one wonders whathappened to the tritium going into the recharge in the early part of thethermonuclear period. If it is assumed that the tritium is still storedin the system, the average transit time should be at the order of10 years or more. On the other hand, and in agreement with the approachexplained in this paper, if it is assumed that tritium of thermonuclearorigin exists in a small percentage in the samples collected between1963 and 1968, again one has to agree that the storage should be at least20 times the mean annual recharge in order to have such a dilution rateof the tritium input in 1963 and 19^4, not to mention other years.
The"above considerations show the uniqueness of tritium as atool in karst hydrology. The interpretation of the tritium content ofthe karst springs based on the influence of large recharge areas on thetransit time distribution — and other similarities with surfacedrainage networks — seems to be logical in the light of the results sofar obtained. However, a few more years of monitoring the tritiumcontent of karst springs will show definitely the basic hydrologiccharacteristics of karst regions.
3>9*3 Interpretation of Stable Isotopes
The stable isotope content of karst springs, and in general ofwater in karst regions, can be used to better define hydrologicboundaries in karst regions. The method gives unequivocal results whenthe interrelation of lakes formed in karst regions and the springs isstudied. The existence of isotopically heavier water in a spring with ahigher enrichment rate in oxygen-l8 in comparison with deuterium, is theseverest test for hypotheses which postulate the connection between aspring and a lake in an upland area.
Determination of subsurface karst basin boundaries by the stableisotope content of the groundwater and the spring water can often be usedadvantageously. It is possible to compare" the stable isotope content ofthe karst water with the stable isotope content of the precipitation inthe same region for the period when recharge to the karst system takesplace. Also one can compare karst water samples from two differentlocalities.

- 40 -
3*10 Discussion
A question was raised on the- analogy "between the transit timedistribution function and the unit hydrograph concept. It was pointedout that the unit hydrograph does not correspond to the transit timedistribution function. The time distribution of runoff is the result ofthe distribution of the distances of travel and of the transit timedistribution of the flow originating from elementary areas forming thebasin. Although the expressions used to describe the unit hydrographand transit time distribution are similar, the unit hydrograph ismerely the dynamic response function and does not take into accout thetransport of the matter in the basin per se. Transit time function, onthe contrary, is related to the distribution of the probability of thetransit time (or residence time) of every individual molecule of water.
It was further pointed out that the analogy of the karst ground-"water systems with the surface water systems would not hold, beoausethere groundwater reservoirs are present in karst, while most surfacewater systems do not have large reservoirs.
Concerning the fit of the tritium data of springs with thetheoretical curves based on the assumed transit time distributionfunctions it was stated that the time of observation was probably tooshort - only 4 years - to reach conclusive agreements.
The use of exponential transit or residence Jime distributions"was suggested. This type of distribution holds for well mixedreservoirs. Mien the value of the parameter k in the equation givingthe contribution of the n^h year in a well mixed reservoir
xn ~ (1 - k) kn
becomes large, this distribution tends to give results similar to thoseof the rectangular distribution.
The use of artificial traoers in conjunction with environmentaltracers in this type of karst was discussed. HBhen the tritium contentof the spring waters indicate mean transit times on the order ofdecades, the use of artificial tracers cannot be recommended. An experi-ment made with artificial tritium in the region studied in Turkey wasunsuccessful, because of the relatively slow movement of water in thistype of karst terrain. There are some karst formations in Yugoslavia,Italy and Austria where artificial tracers have been used with success,but the tritium content of the waters in these regions also indicate thatthe transit time of water is of the order of days, or weeks.
It was pointed out that, when persistently low tritium values arefound indicating long transit times, any type of transit time distri-bution function could be used to fit to the experimental data. In suchcases the transit time distribution function would be flat, and, as thebulk of the tritium is provided by the years included in the thermonuclearperiod, these contributions would have approximately the same weight.
The delay of water in the unsaturated zone could also be consi-dered to explain the rather low tritium content of the spring waters inthe Antalya region. The percolation of water in such regions could takeconsiderable time as the water table is probably relatively low comparedto the earth surface*

- 41 -
3.11 CONSIDERATIONS OU THE GROUNDWATEP MOVEMENT IN KARST FORMATIONWITH REFERENCE TO TOTES GEBIRGE MASSIF IN AUSTRIA.Summary of paper by J.G. ZStl
In karst massifs the joints are wider at the surface and at theborder of the massif. At the core the joints are rather fine, and thewater movement is relatively slower. Tracers injected some years agowere found in some galeries constructed in karst formations; however,tracers were found almost immediately in the springs at the borders ofthe massif.
In general, large solution caves are found at the base level ofthe karst reservoir. This base level changes with time, because oferosion. In Central Europe, for example, such caves are found high upin the .massifs, such as at Dachstein in Austria. The base level changesnot only by erosion, but also with the changes in the sea level. In thePleistocene period ('Wurm) sea level was 100 meters lower than itspresent level? investigations made in Greece show that there are zonesof high permeability lower than the present sea level. This should betaken into account when the storage in karst is studied and in inter-preting the environmental isotope content of the water occurring inthese regions.
In a karst massif the topographic basin does not, in general,correspond to the actual recharge area which is difficult to define,except perha-ns in the case of isolated karst massifs. The tracer experi-ments made a few years ago in fhe karst massif of Totes Gebirge i» theCentral Alps shows the complexity of this situation. In these experi-ments the tracers injected £ the central part of the massif were foundin springs more than 30 km away from the point of injection. A curiousfact is that the same tracer was found at a much later time in somesprings which were much closer to the point of injection. So the tracertravelled in several directions but with very different velocities.' •Fig. 35 shows the outcome of these experiments and the tracer movement inthe massif of Totes Gebirge.
3«12 Discussion
The tritium data obtained in a variety of karst springs shows thatthe conditions found in Totes Gebirge and other similar karst massifscannot be generalized. In springs in the Southern Vienna Basin, forinstance, different tritium levels ranging from the values found insimultaneous precipitation to concentrations lower than 100 TU were found.Almost all karst springs in Southern Turkey have tritium concentrationsbetween 20 - 100 TU. This shows that the groundwater movement in karstcan show large variations from one region to another. The use of theartificial tracers should, therefore, be recommended only in cases wherethe tritium content of the waters in the region is similar to that ofprecipitation at the time of sampling.
In Israel studies have shown that a karst aquifer can be studiedin ways similar to those for granular aquifers. An analog model of akarst aquifer approximately 800 m deep was built using data on the permea-bility, effective porosity distribution which had been calculatedpreviously from pumping tests. The results were satisfactory and provedthat karst aquifers can be simulated by electrical analog models. Studiesmade by isotopes can be very useful to check the validity of such models*

- 42 -
A karst system is one in which the aquifer matrix reactschemically with the water moving ir. it. This applies, with certaindifferences, to anhydrites, gypsums and essentially all the carbonates.Water reaches equilibrium with its container when all the carbon dioxidehas been used up in the reaction. The time required to reach equilibriumis different for different rock species.
In a karst system turbulent flow can take place in contrast tothe laminar flow which usually occurs in granular aquifers. Dependingon the region the flow in a karst formation can be either turbulent orlaminar. It is ordinarily turbulent near the exits of the system, butit may be turbulent also in the core of karst massifs. When a karstaquifer is confined, as it is the case in the karst aquifers in Israel,no or little turbulent flow should be emected. This makes the appli-cation of analog models appropriate as they are based on the similarityof Darcy Law and the flow of electrons under a hydraulic gradient anddifference of "ootential, respectively.

-'43 -
4.1 COMMENTS OR "TEE USE OF MATHEMATICAL MODELS IKINTEBPBETIKG TITS ENVIRONMENTAL ISOTOPE DATA".Summary of the paper by A. M r
4»1«1 Introduction
This working paper discusses the concepts and "background infor-mation for using isotope date in geohydrology. This kind of review isnecessary for evaluation of the present status of such work, to indicategaps in our knowledge and to plan future work. This report does notinclude detailed mathematical formulations, as these are available inthe references quoted; these should be consulted in detail before theactual discussion of the panel.
A discussion of interpretation of isotope data in hydrology isclosely related to the general problem of models and interpretationmethods in hydrology. Therefore this discussion will start with a briefsurvey of current interpretation of models in hydrology.
4*1.2 Current Methods in Eydrologio System Investigations
In the following discussion we use the terminology and definitionsproposed by Amerocho and Hart (1964). They subdivide the major hydro-logical fields of study into physical hydrology and system investigations.Physical hydrology is concerned with well-defined physical components ofthe hydrologic cycle, such as evaporation, energy transfer, watershedhydraulics and others. The ultimate aim of this research is tounderstand the action of the basic physical components and their inter-actions, in order to combine them into a complete description of thehydrologic cycle. The system investigations approach is motivated bytwo main arguments: (a) the inadequacy of the knowledge now availableand the knowledge likely to exist in the foreseeable future of thephysical components and their interactions make the probability of afull synthesis of such a complex system very remote, (b) the success ofthe system approach in describing many features of the rainfall-runoffsegment of the hydrologic cycle, and the significant advances in metho-dology of these techniques that we witness at present. The system in-vestigations may be subdivided into parametric and stochastic methods.Parametric methods attempt to develop a completely deterministicdescription in terms of functional dependence between rainfall andrunoff, considered as mass input and output to a hydrologic system.They are in turn subdivided into lumped and distributed systems andeach of these may be linear or non-linear (Chow, 1967a).
Stochastic methods of system investigations comprise time seriesanalysis, including Markov chains, stochastic system response analysis,and Monte Carlo methods.
The parametric approach, especially the distributed systemsynthesis may base its elements and their interconnections on certainanalogies with the physical system. However, its usefulness in adescriptive or predictive role does not depend on these analogies.The above subdivision of hydrological research methods can besummarized in Table It

- 44 -
Table I
Classification of hydrologic studies
Physical hydrology System investigations
1. Components of hydrologic 1. Parametric methodscycle groundwater, unsatu- / \ T , .rated zone evaporation etc. < a ) Lumped-systems
(l; Linear2. Energy transfer (ii> »on-H»e«
(b) Distributed systems3« Watershed hydraulics (i) Linear
(ii) Non-linear
2. Stochastic methods
(a) Time series, Markov chains
(b) Stochastic systemresponse functions
(c) Monte-Carlo
A comprehensive summary of parametric and stochastic methodsapplied to hydrology is given in the proceedings of two recent symposia*Proc. Symposium on Analytical Methods in Hydrology (Symposium, 1967a)and Proc. International Hydrology Symposium, Port Collins (Synroosium, 1967b).
It seems that at present both approaches and their combinationsfall short of the objectives of scientific hydrology, which can bedefined, following Chow (1967b), as follows: Given initial and boundaryconditions of hydrological, hydrogeological and hydrometeorologicalparameters, to forecast subsequent states of the hydrological system inboth time and stjace. The physical system studies do not encompass yetfully many of its components and certainly not their multiple inter-actions. The parametric and stochastic methods can deal at best withdescription and prediction of existing systems in their stationary statebut are unable to predict responses to changed conditions. Clearly thedevelopment of this subject requires incorporation of the physicalknowledge in the system approach, so as to increase its capacity to dealwith changing systems.
4.1.3 The Role of the Isotope Methods in Hydrological Models
The introduction of environmental isotope data into hydrologicalmodels may be better understood in view of the above presentation ofgeneral hydrological methodology. The initial work by Begemann andLibby /~1957_7" attempted to interpret tritium data"in terms of directphysical models - the one compartment mixing model in this case.The widespread objection to this interpretation was due to the specificphysical assumption, which is not uniquely implied by the isotope dataand the oversimplification to a one-parameter (mean residence time)mixing model» Another attempt of Brown jT~l96l_7* w a s again of this nature -assumption of a physical model, again, the one-parameter mixing model-.Ee-evaluation of these and subsequent data of the Ottawa Valley ledEriksson £"l9&bj "bo interpretation of the recharge area in terms ofsystem analysis. This yielded a complete transit time distribution, i.e.much more information than the single mean residence time. The datawere smoothed and renormalized to allow for fluctuations of the distri-bution function - some of the fluctuations possibly due to errors in

- 45 -
measurement "but some possibly due to non-steadiness of the hydrologicsystem. The same analysis mentions also the possible physical systemproviding the transit time distribution - in terms of fast runoff and alake system, supplying a delayed response. From the point of view ofmethod development, this -was the most complete interpretation of isotopedata, with the then available analytical tools. The presently availablemethods would allow this analysis to proceed further. Steady stateassumptions would not be required. Use of a larger body of data couldpossibly allow the determination of the "Best" distribution in astochastic sense, as shown by- Eagleson / ~ 7 '
The concept of dating, as ap-nlied to tritium data by Libby andothers, in the first years of application uses only the property ofdecay of tritium, assuming known and constant input concentration. It wasbased on two physical models: the piston flow and the one-compartmentmixing models. The interpretation of dating data has been extended totwo-parameter models by Nir £^-9&4ji the second parameter being thehydrodynamic dispersion, Dm. of a gaussian transit time distribution.This can, however, be generalized to a gaussian distribution due tostratification and recharge variations. Such an interpretation has beenapplied by Davis et al. /~1967_7 t o tlie Vienna Basin.
The use of a radioactive isotope as a dating tool can solve aone-parameter model or alternately reduce by one the number of unknownparameters of a multi-parameter model, as it provides only one "unit" ofinformation in the form of one equation. /Fir, ISSiJ* 3ut the solutiondepends on the type of model assumed, which determines the form of theequation to be solved.
Stable isotope data have been used mainly in physical hydrology:geographic origin of rainfall, amount of evaporation from surface bodies,ratio of actual mixing of defined water bodies are examples of suchapplications /""IAEA, 1963-_7'» This can be understood in view of relativeconstancy of stable isotope inputs and the difficulty of measurement ofpossible small fluctuations. Therefore average differences betweendifferent bodies of water were used rather than temporal fluctuations inone body.
This situation may, however, change with the accumulation ofmore data and improvements in instrumental precision. The role ofisotope data in eliminating non-relevant information is not emphasizedenough. It is often easier to state that certain waters cannot originatein a given area, cannot be of older recharge date or could not be incontact with older sources, than to indicate a definite way where theycome from, or what is the date of origin. This information whilenegative in form of statement, in fact eliminates one or more alterna-tive physical hypotheses. This elimination may save time and effort inthe elucidation of the correct physical mechanism
4.I.4 The Role of Isoto-pe Data in Future Developments
It may be safely assumed that environmental isotopes will continueto play a significant part in physical hydrology.
This may be inferred from the multitude of methods offered todayto the experimenter studying atmosphere - surface water relations,evaporation, lake dynamics, infiltration, stratification etc. /"IAEA, 1968_XHowever, with the increasing emphasis on system analysis and stochasticapproach, especially in catchment area investigations, there is a newfield of application and in fact a new need for isotope data. Theirimportance may be seen in the following uses: /""Mr, 1968_7".

- 46 -
(a) extension and amplification of hydrological data usedin system analysis through .isotope data.
(b) Formation of a connecting link between system analysisand physical hydrology: isotope data are often verysensitive to a specific physical model and may evensuggest such a model.
(c) Preliminary information on a geohydrological system,where no hydrological data are available. Parametricor stochastic analysis of isotope data may give indicationon deviations from steady state, stationary characteristicsof the rainfall runoff, relations, type of distributions oftransit times and, as mentioned in 4*1*6, even suggest aphysical system. Such contribution is of major importancein investigation of underdeveloped areas where hydrologicaldata may not be available and their collection moredifficult and costly than that of isotope data.
4*1*5 Future Development of Isotope Methodology
If we accent the areas of future applications of the isotopedata, there is a clear need to improve the interpretative tools at ourdisposal. Three stages can be indicated:
(a) Better theoretical understanding of the information-contentof tracer data in system analysis, both parametric andstochastic.
(b) Investigation of specific models, by mathematical simulationas to their response to varied tracer inputs under steady
« state conditions - this will supply an extension of thetheoretical studies, to situations not covered by the theory,due to limitations in mathematical methods.
(c) Test of theories on some representative basins.
All three stages can be pursued simultaneously as there is already someamount of knowledge in these areas. It would be of advantage to therate of progress if theoretical hydrologists, with experience in recentstochastic system analysis, could be brought to cooperate actively insuch research programs.
REFERENCES
Amarocho, J. and Hart, W.H., A critique of current methods in hydrologicsystems investigation, Trans.Am.Geophys. Union 45.,3O7 (1964).
. . * «»-Begemann, F. and Libby, W.F., Continental Water Balance etc. Geochim*
& Cosmochim.Acta 12_ (1957) 277*
Chow, V.T., General Report on new ideas and scientific methods in deter-ministic hydrology Proc. Int. Eydrol. Symposium, Sept. 1967,Fort Collins. Colo.., V.II, p . 50- Colorado State University, 1967a.
Chow, V.T., The progress of hydrology, Proc. IAEA Symposium on Isotopes inHydrology, p . 3. Vienna,1967fc*
Davis, G.E. et al., Seasonal variations in the tritium content of ground-waters of the Vienna Basin, Austria, Proc. Symp. on Isotopes in Hydro-logy, Vienna 1967, p* 451*
- 47 -
Eriksson, E.. Atmosnheric tritium as a tool for the study of certainhydrologic aspects of river basins, Tellux XV (1963) 303.
IAEA, Proc. IAEA Symposium on Isotopes in Hydrology, Vienna, 1967.
IAEA, Guide book on nuclear techniques in hydrology, Vienna, 1968.
Kir, A., On the interpretation of tritium age measurements in ground-water, J. Geophys. Ees. _69_ (1964) 2589.
Hir, A., Some stochastic and deterministic approaches to tracer datainterpretation in geohydrological systems, Part I. InternationalReport, International Meteorological Institute, Stockholm, 1968.
M r , A., Development of Isotope Methods Applied to Groundwater Hydrology,Proc. Conf. on Isotope Techniques in the Hydrologic Cycle. AmericanGeophys. Union, Geophysical Monograph fio. 11, 109, 1967*
Proc. Symposium on Analytical Methods in Hydrology (Symposium. 1967a).
Proc. International Hydrology Symposium, Port Collins (Symposium, 1967b).
Stout, G.E. (Ed.). Isotope Techniques in the Hydrologic Cycle, Geophys.Monograph No. 11, American Geophys. Union, 1967*
4-2 Discussion«.
In some areas -where the water movement is fast, such as in karstand basalt flows significant time variation of concentration in theenvironmental isotopes occurs at the outlet of such system. Thesevariations in the case of a transient state - tritium for example - canbe reproduced by a convolution integral assuming a convenient transittime distribution. In the case of stable isotopes there is a randomstationary state created by the random selection of the precipitationcontributing to the recharge. In sub-tropical regions, for example, thedistribution of the months where the precipitation exceeds potentialevaporation is almost random. In other regions, the input occurs atwell defined periods of the year. However, the mean stable isotopecontent of the recharge water is subject i;o random fluctuations from oneyear to another as is the case for the volume of the annual recharge itself.
In regions where the mean transit time of the water is of the orderof a few years, these variations of the stable content of the rechargeare found in the outflow from the system, although considerably dampedby the action of dispersion and mixing which takes place in the system.Such variations, if larger than the measuring accuracy are a sure signof the relatively fast turnover rate of the system studied. It would bevery desirable to relate the variance in the inmrt and the output anddetermine a parameter related to the turnover time of the reservoir.
A second question was raised regarding use of the system analysistechniques for very slowly moving groundwater, where no time variationcan be observed at the output and all original variation in the input issmoothed down by long transit times. It was stated that in theory thiswould be possible. However much of the resolution in such cases islost by long-term integration and no information can be obtained, i.e.the signals are getting weak and the noise is relatively high.

- AS -
It may "be useful to apply the environmental isotope techniquesto sub-systems, instead of to the large systems as a whole. Environ-mental isotope techniques, however, give the opportunity of lockinginto the large system and its different parts* 1/Jhen a lake is studied,for example, the residence time distribution of the water is perfectlyexponential if there is instantaneous and complex mixing. Any deviationfrom this theoretical distribution would indicate incomplete mixing, whichis a function of the temperature gradient in the lake, its depth etc.Therefore, when a reservoir of any type is studied, the output of theenvironmental isotopes can generally give good information, although itis not always quantitative.

- 49 -
4.3 OK THE CHARACTERISTICS OF RIVER BASINS.Summary of the paper by E. Eriksson
4*3•! Introduction /—,•. y
Eriksson (1963) analyzes the characteristics of river basins frominput - output data on tritium — Brown £^2j— in the Ottawa River Basin.Wo model parameter assumption was made in this analysis, although steadystate was assumed and the frequency distribution of transit times of thewater through the basin was computed.
This paper discusses estimating transit time distributions inriver basins from isotope data. As Kir points out, the estimatesimprove with the amount of data collected, provided sound procedures areadopted.
Eriksson's approach was to consider the mean concentration oftritium in river water as made up of a number of various fractions fromprevious years properly connected for radioactive decay. It is convenientto start with the year 1964* If the time ever since is divided intoequal intervals we get for the first period
_ A,
and the second
etc. In these (^0 is the mean concentration of tritium in river waterfor the particular period in question, C is the mean concentration inthe net amount of water added during the particular period and theexponential is simply the mean radioactive decay connection needed.In a more general form this can be. written
which is the formula corresponding to the so-called convolution integralused in hydrology. Equation (l) contains the tacit assumption thath. i.e. the fractions of the precipitation ( % ) intervals earlier is thesame from year to year or in other words that the system is in a completesteady state. Rate of addition of water is constant, equalling therate of runoff. Since this is hardly realistic we ought to considerthe case where h. is also a function of time i.e. depends on thespecific interval*1 under study. This additional restraint, which nolonger involves any assumption of a steady state, can be indicated by anadditional subscript, n, so that the equation reads:
Y, =ZOne could of course use this straight ahead in the computations butwe can put but little confidence in the series of h. :s so obtained.Sometimes an h. would turn out negative which is physically unrealistic.
0 n

- 50 -
We can, however define a mean h. and a deviation from the mean, h!so that h. = h. + h! 3 3'
By this definition / h! = 0 and h! now becomes a stoehastic variablewith respect to n. j=l J' J'
We can now rewrite the equation
The last term will, of course, oscillate around zero even if theh! :s are being weighted by the decay corrected tritium concentrations.
We might put the second form on the righthand side equal to z where2 is now defined as a stochastic variable. Then we get n
« —
As the equation stands the variance of z will determine theconfidence intervals for our estimates of the h.ts. If the varianceis large, the estimates of the h.:s will be poor and vioe versa.We hence need an estimate of the variance of i .
nIn order to obtain an estimate of the variance of x it is
necessary to terminate the series of h.:s at some"suitable j-value, sayk. If we divide the series into two parts we get*
4 T -j~t J "fi-j J'iCri J
where the second sum on the righthand side can be regarded as a residual,say E so that the equation readst
We would further have the condition that ^. h.^,1. We could make theassumption that if the residual E j=l ^contributes very littleto X s this part of the reservoir could be regarded as well mixed, i.e.h. for jNk would be written
It should further fit smoothly with the last h. value of the first sum,i.e. a = h, . Hence J

- 51 -
This refinement is perhaps not needed since in general theerror 3C would be larger than this residual. This means we may write
with the condition that
k -
We observe that the variance of x consists of sums of weightedh! :s and the h! :s can "be regarded as stochastical variables with acif?ain variance?* say c^* The variance of x is, therfore, of the orderof the variance of h! times the square of the mean c _ . . Since thelatter will vary witn'n, the variance of x will also "''vary with n.We can standardize this by dividing by Y and write:
& c .
The best choice of the h.:s would be obtained through the leastsquares procedure giving 3
which is then differentiated with respect to the h.:s. These would haveto be zero from which we would obtain the set of equations needed tosolve for the h.:s and compute the variance of
0
n
r».'The latter would give an idea about the significance of the h.:s.
The variance as —y would now depend only on the variance of theh! :s, i.e. the #n deviations of h from the mean. Thisvariance would depend to a considerable degree on the time intervalchosen. If we chose a fraction of a year as our time interval, we willget the seasonal fluctuations in the h! :s which wn most cases would belarge. This means that our_ error of the estimates of the h.:s would belarge. In addition, many h.:s would be needed to cover a reasonable partof the transit time frequency distribution, so that there would not beso many degrees of freedom left. Chosing a year as the interval removesthe seasonal variation from h! . Since no dependency can be expectedin h! from yearly means, we3* would expect this choice to be satis-factory. We lose, of course, the fine structure of the transit timefrequency distribution_but, on the other hand, we gain informationbecause the estimated h.:s will contain less error. "
So far we have had anough data to make an analysis in which propererror estimates are obtained. This will be possible in future also ifadequate data are collected.
To compute transit time frequency distributions in river basins,yearly averages seem to be sufficient. Thus, it is inexpensive toobtain the data needed, especially if weighted monthly samples arelumped into representative yearly samples, before tritium analysis ismade. This, at present, is the plan for the Scandinavian rivers whichhave been investigated since 1961.
4*4 Discussion
To apply this method one must determine the environmental isotopecontent of the input and the output. The frequency of the sampling forthis is a function of the hydrologic characteristics of the basin*In large river basins the output concentrations do not have largevariations and sampling is needed less frequently than in small basinsto determine the tracer output of the system. However, representativesampling of the input (the precipitation over the basin) is usuallydifficult because the environmental isotope content of the precipitationhas large seasonal variations. Especially for tritium, if the record forone.particular month is missing or left out of a seasonal mean-valuecalculation of input, serious errors may result in the estimate of theinput concentration.
The straightforward approach to this problem is to consider onlythe months when precipitation exceeds potential evaporation in the basin.This jnay work for surfaoe waters, but the environmental isotope input*to groundwater systems in river basins is related to a different periodor season. Lysimeter data and some field experiments show that underthe conditions prevalent in Central Europe, the spring precipitation isbeing evat)orated in subsequent months and thus does not reach thesaturated zone.
To identify variations in the source of river water, it is necessaryto measure the tritium content throughout the year. Measurements oftritium content of the Saskatchewan river during 1963-64 showed widefluctuations throughout the year; it was evident that the sources feedingthe river changed with time. At certain periods subsurface inflow and atother times glacier and snowmelt were the most important contributors.The base flow had a low tritium content compared to that of meltwater, whichreflected the high tritium content of current precipitation. Such variationsare useful in understanding groundwater systems? an example of their useis a study in the Modry Dul basin, Czechoslovakia.
A question was asked whether future changes in the hydrological cyclewould or would not significantly modify the environmental isotope inputsand relations. Such modifications could occur by the reforestation,artificial recharge of the aquifers,-urbanization and the establishmentof large surface reservoirs. Water stored in artificial surfacereservoirs is considerably enriched with respect to the tritium aridstable isotopes due to the molecular exchange of the reservoir waterswith the atmospheric water vapour.

- 53 -
The question of change in the hydrologic regime is a generalone when hydrologic time series such as runoff, sediment load ofstreams are studied. Especially when the changes are rapid theremay "be disruption in the time series. In that case, the analysiscould be modified to treat them as transient phenomena to determinethe new age distribution function.

- 54 -
LAKE WATER BALANCE STUDIES
5.1 LAKE WATEE BALANCE STUDIES WITH HnTCROKlSSETAL ISOTOPESSummary of the contribution "by T. Dincer
Stable isotope measurements of the lake waters made in various -cartsof the world have shown that lakes are considerably enriched with rest>ectto stable isotopes compared to the -precipitation, runoff and groundwatersin the same region.
In the steady-state conditions the isotopic composition of theinflow and lake waters is related to the inflow and evaporation by thesimple equation
- *LE Ej-Bj,
where I and E are the rates of inflow and evaporation respectively,E_, the isotope ratio
l 8(5 orin the net water vapour flux from the lake, R- the isotope ratio of theinflow and E_ the isotope ratio of the lake waters.
With a careful survey E- and E. can be estimated- However, thedetermination of E_ which is giverr By the following equation is muchmore difficult 'more difficult.
<sr-h V (2)where E is the isotope ratio in the atmospheric water vapour over thelake, h the relative humidity calculated with respect to the watersurface temperature, A » "the equilibrium fractionation factor and K,afactor taking into account the diffusion velocities of the various isoto-pic species of water and is not well known.
It seems to be possible however to bypass the difficulty of esti-mating K and measuring E by using lakes in the same region where thewater balance is well known.
The stable iBotope composition of the atmospheric water vapour canbe estimated from the isotope balance of the lake with known waterbalance. For this estimation it is necessary to use a reasonable Kvalue which is not necessarily the correct one. However,using the samevalue of K for evaluation of the stable isotopic composition of the netwater vapour flux for the lake with unknown water balance will preventlarge errors introduced by using'an uncorrect K value.
Evaporation pans can possibly be used to estimate C- for the lakes.At present, studies are being made in Neusiedler See in Sustria toevaluate the usefulness of evaporation pans in lake isotope studies.
When the isotopic composition of the atmospheric water vapour ismeasured by sampling, it should be borne in mind that the selection ofthe location of the sampling point is not very important.

- 5 5 -
We can write
cv " v f\ _ v / T" - vm n C + n a C_J/ [3)CE - Z (1 - h) / f (» b Cft
where mh is the partial pressure of the water valour from sources otherthan the lake and nh is the partial pressure of the water vapour pro-duced by the lake. By solving this equation with respect to C_ andnoting that
Knh = nh the equation can be simplified to obtain
- mh) (4)
which is a good approximation even for relatively small values of mcompared to unity in the case of deuterium.
Equation 4 shows that the water vapour produced by the lake haslittle influence on the isotopic composition of the water vapour at thepoint where the relative humidity is measured, regardless of the situa-tion of this point with respect to the lake. It should be added howeverthat this reasoning holds for lakes which do not have an influence inthe environment as a major source of moisture.
5*2 3)iscussion
A question was raised on the validity of equation 4 showing therelative importance of the atmospheric moisture being contributed bythe lake and by the other sources. This equation is an approximation andis valid where the contribution of the lake is a few percent in the caseof oxygen-18, but is valid for much higher percentages for deuterium.
The isotope content of the lake water is by far the most importantfactor to determine. However when a sufficient number of samples whichsubsequently can be combined and > repeatedly measured are collectedthe mean isotope content of the lake waters can be determined withdesired accuracy.
Studies made in South Western Prance on six lakes having capacities10 - 350 x 10° nr were reported. These studies which were made usingenvironmental tritium, have shown the difficulty of applying tritium inlake water balance studies. The difficulty is due to the transientcharacter of thermonuclear tritium.
Because there is no fractionation effect in the evapotranspirationprocess, the presence of swamps can be a complicating factor in lakestudies. The water lost by evapotranspiration can be treated as otherlosses and cannot be easily separated from them.

- 5 6 -
6.1 ADJUSTMENT OP RADIOCARBON AGES OF GROUNDMTEE BY MEANS OF 13C/12CSummary of the contribution "by B.B. Hanshaw
The successful application of environmental isotope techniques inhydrology requires close cooperation between the isotope worker and thehydrologist. It is important to understand the problems that hydrolo-gists are interested in solving. Ordinarily the basic problem for thehydrologist, as it is in all scientific fields, is the predictiontHow will a hydrologic system respond to a given set of conditions? orwhat will happen if new conditions are introduced in the system. Thepurpose of the isotope worker,therefore, is to find ways of helpingthe hydrologist understand a system and predict its response.
In groundwater studies, hydrologists are interested in defining theboundaries and the aquifer characteristics such as the permeabilitydistribution in the groundwater system. Telling the hydrologist the ageof the water at a given point of the system may not be of much valueto him. It is much more useful to identify the recharge and the dis-charge regions the interconnections between different surface andgroundwater bodies and to give a reasonably accurate estimate ofregional permeability of the aquifer.
One of the best uses of carbon-14 can be in estimating aquiferpermeabilities. Darcy's formula states that the filter velocity isequal to permeability times the hydraulic gradient. The actual velocityof water in the aquifer is equal to filter velocity divided by theporosity. If the hydraulic gradient is known and if porosity can beestimated, it is possible to determine the regional permeability distri-bution using carbon-14 ages. Hydrologists are not interested in whetherthe water is 22.000 or 25*000 years old- therefore, 4he use ofdifferent age adjustment techniques is perhaps not as important as itlooks to the laboratory worker. The raw C-14 data itself is already avaluable tool in groundwater studies for the hydrologist.
Most of the C content picked up by groundwater in a recharge areacomes from the soil-zone C0?, derived principally from the oxidation oforganic matter* Once the carbonate species and CO- from the zoil zoneare incorporated in the groundwater system, two major problems,(l) the isotopic exchange of the dissolved carbonate species with theaquifer material and (2) the dissolution of the carbonate rocks by thefree C0_ available in the water, remain. Both are likely to add non-radiogenic carbon to the dissolved carbonate species in the water. Theisotopic exchange is not significant in influencing the carbon-14 contentof the groundwater. Recent studies by Bye of the US Geological Surveyalso bear on the isotopic exchange problem. Eye found that in calcitedeposits 50 million years old, the dissolved C02 species were out ofisotopic equilibrium with the solid phase.
One way to account for the dissolution of the carbonate rocks isbased on the ^C content of the dissolved carbonate species in water.The C0_ which has been derived from-the soil zone approximated by thatof plant material, generally has a C content a 13c of -25 - 2$o relativeto the Peedee belemnite (pDB)standard. A major problem in finding a true"age" for groundwater is that the water generally dissolves non-radiogenie material, chiefly marine carbonate minerals with a £13c value ofabout zero. ,Solution of these minerals decreases the *4c/ c value,causing the C age of the groundwater to appear older than it actually is.To adjust for the solution of carbonate minerals, we have had goodresults using a correction equation developed by Pearson (Pearson andTShite, 1967). This equation is:
1 4C# mod.(adj.) * * Cs{?*l " *13(frf. . 14(# mod.(lab)

- 51 -
We believe that the age adjustment made using this equation is much moreaccurate than the one obtained simply by using the empirical approach ofchanging all laboratory -^C determinations to reflect a postuTsted initial•^C content of 85^ of modern. Also, in more than a dozen (out of about200 groundwater samples) that we analyzed, we found an initial 14($ ofgreater than 85$ with some as high as 9&fo of modern. Obviously, thisempirical correction can be subject to considerable error.
The validity of the above adjustment equation is strengthened bytritium analysis in a recent study — one of a series of -^C groundwaterstudies being conducted in various geologic terranes in the United States.
Field test of ^C adjustment using tritium
Samples of groundwater from both recharge and confined portions ofthe limestone aquifer of central Florida were analyzed for carbonisotope and tritium content. Because tritium has a short half-life(12.26 years) compared to 14c (5570 years), water in recharge areas shouldcontain tritium whereas samples from farther down-gradient, in the non-recharge part of the system, should lack tritium and indicate old radio-carbon ages. Eesults of the study are given in Table 1 taken fromHanshaw and others (1968).
Table 1
Comparison
Sample
of lab and adjusted
Laboratory 13«
age
14C ages using
Adjusted1 4 Q <aere
C correction
%. TU
Weeki Wachee-11 3,800 -17.1 250 103 ± 10
Lecanto-5 5,800 -14.4 800 36 +_ 4
Lecanto-6, 5,350 -15.8 1,250 15 +, 2
Frostproof 21,800 -13-2 16,000 0.0+1
Holopaw 23,800 -14.9 19,200 0.7 ± 1
Arcadia 35,500 - 13-3 29,800 0.0 + 1
Ft. Pierce 31,000 - 5.8 0.1+1
Palmdale 35,000 - 2.9 11.0 +_ 2,0.6 i 1
The first three wells in Table 1 are in a recharge area and containthermonuclear tritium. Weeki Wachee-11 had 103 T.U. in 1966; the averagetritium content of rainfall in central Florida that year was 114 T.U.which indicates the sample was primarily post-1954 rainfall. The radio-carbon age of this samples is in agreement with tritium results whenadjusted for solution of limestone by means of l^C content. This shallowwell is located almost exactly on the piezometric high and shouldcontain only recent recharge. The two Lecanto samples are from wellsfarther down-gradient. They receive recharge both locally and by lateralflow from up—gradient recharge. Therefore, we would expect less tritiumowing to mixing of recent rainfall with much older groundwater fromup-gradient recharge. The next three wells in Table 1 are from the

.- 58 -
confined portion of the system, contain no measurable tritium, and producevery old water according to both columns of ii+C age.
The Ft. Pierce sample is an example of a situation where nocorrection is presently possible. The well produces slightly salinewater (1300 mg/l TDS) of the sodium chloride type and doubtless repre-sents mixing of potable groundwater with connate ocean water. Becausethe ^^30 ratio of sea water bicarbonate ion is zero, the result ofmixing is to increase the -^c content of the water. Also, when twosolutions are mixed, local solution or precipitation of carbonateminerals could occur: this would change the *^C content of the solutionin an un^-nown way. Currently no way is known to adjust the age of suchmixed samples if mineral solution or precipitation occurs. A furthercomplication — discussed in more detail in the next section — in theFt. Pierce well is the presence of H2S gas.
Two samples for tritium analysis were taken at the Palmdale well.The analytical results point out the ease of sample contamination fromatmospheric tritium. The well has an aerating tower to rid the water ofH2S prior to consumption. Apparently, several minutes contact with warm,humid air is sufficient to increase the tritium content of a water sample.A second sample for tritium analysis was taken before the water reachedthe aerating tower and essentially no tritium was found in this sample.The radiocarbon age was not adjusted for 13c content because of theanomalously low <£l3c value. The cause of this low value is presentlyunknown.
Sulfate reduction""•~*~""~'~~"—""•"1-""~'~^~~ —2
One reaction expressing sulfate reduction i s : SO. + 2CHpO •+ 2HC0,~ or, in a petrol iferous or more reducing^environment ••2 +
Hg 2 H , or, i a p e r f o r ore reducigenviroment364-2 + CH/ + H + • HgS + HCO3- + H20. Chemical changes such as thoseindicated by these equations, are observed in nature. Thus, in Florida -and many other aquifer systems, sulfate commonly increases away from therecharge area. Generally, however its concentration levels off ordecreases where E2S occurs in the water. Likewise, HCO3- may increase inthe area where E2S is found. In order to correct for the production ofdissolved carbonate species by sulfate reduction, we need to know theH2S content; from it we may be able to calculate the amount of HCO-"*produced. Also we need to know the 6 ^C of the HCO3- produced.To calculate this the 3c content of the bicarbonate precursor and thefractionation factor for the organictbicarbonate reaction, must be known;these may be difficult to obtain. However, because the concentration ofH2S in most groundwater is commonly relatively low (on the order of 2to 15 pnm), the sulfate reduction reaction may actually produce an insigni-ficant additional amount of dissolved carbonate species and can, possibly,be ignored. It is possible that the activity of H2S is buffered by somesolid phase, perhaps pyrite. If so, the I2S content is not a true measureof the HC03~ produced by sulfate reduction; perhaps the decrease inSO4-2 or increase in HCO3"* concentration (these would check each other) inthe area of E2S occurrence could be used to calculate the amount of HCO3""produced by the reaction. However, two problems remain: (l) lack ofknowledge of the 13c of the HCO3- produced, and (2) the possibility ofcarbonate precipitation. Until the effects of the reduction reaction arebetter known, thiB should be considered a problem for further research.

- 59 -
g fractionation during sampling
In order to use the adjustment equation, the measured <v^C must berepresentative of the true value, Recent work has indicated that aserious discrepancy ezists "between <f>13c values obtained from SrCO^ froma gas evolution method for collecting all the dissolved carbonate'speciesand £ -*C -values run on SrCXH obtained by means of direct precipitation.The results are given in Table 2.
Table 2
Comparison of obtained by gas evolution (G.E.) and direct precipitation
(P.P.) techniques
SampleG.E*
Weeki Wachee Spring ...
Weeki Wachee-12
Yeehaw Junction
Ft. Pierce
Cocoa-12A 1....
Clermont
Frostproof \
Vero Beach
Arcadia
Container Corporation..
Ft. Clinch
Sether
N.E. Florida Hospital..
-13-40
- 4.00
- 5-32
- 2.40
- 8.8l- 9-99- 8.80
- 3-59
- 8.05
-10.38
-10.40
-10.20
-10.04
-15.72
-10.62
- 8.40
- 5.79-11 .69
•-I4.I2
-13.21
- 8.89
-12.34
-16.39
-I6.46
-15.79
-15-72
+2.32
+6.62
+3.08
+3.39
+2.81
+4.13
+4141
+5-30
+4*29
+6.01
+5.6O
It is obvious that a serious difference exists and that the C . ,results obtained from the D.P. method are invariably heavier than the Cresults from the G.E. technique. The first nine sample pairs were notobtained at the same time nor in a necessarily totally comparable manner.Before the last four samples were taken, we had become aware of theproblem and these were processed with great care. Samples were processedin a chemically identical manner' the results indicate the magnitude ofthe problem. An average discrepancy of 5*8 +, 0.2$o occurs between thefour pairs. In order to try to establish which technique gives the true<i 13c value an NaHC03 solution was prepared in the laboratory fromreagent KaHCO3 with known 4 c* ^he results are inconclusive:
Standard NaHC03, -11.4

- 60 -
Apparently both methods give results which deviate from the true & CjG.E. gave light results, and the H.P. method gave too heavy value.13c fractionation during collection means that 14c is most likely alsofractionated. This is not a serious problem by itself in groundwaterdating, but should be corrected if possible. However, the seriousnessof the 13c error shows up particularly in the use of the age adjustmentequation. Further work to understand the reason for these deviationsand to establish the best technique for obtaining samples of dissolvedcarbonate species for carbon isotope analysis is underway.
General hydrologic conclusions
With the help of the carbon-14 and tritium results and studiesmade independently by other workers using mineral saturation and tempera-tures, the area of major recharge of the aquifer has been extendedconsiderably in comparison with the earlier assumptions based on thepiezometric map only. The recharge area thus redefined has a broadly,scattered carbon-14 age, total chemistry and other parameters.
The total dissolved solids, for exanroledo not show systematic variations nor does the distribution of chloridesulfate or calcium-magnesium ratio. However, from the region where theaquifer becomes confined toward the south, there are systematic variationswith res-pect to carbon-14 content, which decreases gradually? down-gradient the total dissolved solids increase in a similar way. Chloridecontinues to increase until it £d&ches a very high value along the coast.
Pig. 36 shows that in the area of major recharge the waters whichare under saturated are not right*" on the-pieztJmetric high. "In the areawhere the aquiclude is thinner, low values for both calcite and dolomitesaturation are found. The total dissolved solids show the same picture,i.e. the lowest values are not at the top of the piezometric high but ina different region, where actually large amounts of recharge are takingplace. The carbon-14 ages agree with the chemistry of waters? theyoungest ages are not found on the piezometric high but some distancedowngradient, where probably recharge is more significant. However, ifcarbon-14 data are used without any hydrologic information, such aspiezometric maps, they may lead to unacceptable results such as waterflowing upgradient. It is important, therefore, to consider all thehydrologic, geologic, ohemical and isotope data together in order todefine a coherent hydrologic situation.
Figa §7 and 33 show the unadjusted and adjusted carbon-14 isochronesof the groundwater and how the age contours are moved by almost ahalf-life toward the recharge area when the adjustment is applied.
Table 3 shows the groundwater velocities calculated by carbon-14ages compared with the velocities estimated by conventional techniques.The agreement is good both for corrected and uncorrected ages; thecorrected ages are slightly more accurate. However considering theuncertainties in the estimates of the r>ermeability, the difference isnot significant. Permeability is a parameter which changes by severalorders of magnitude in most aquifers so Tralues that fall into the sameorder of magnitude can be considered compatible. This shows that thecarbon-14 age adjustment using different techniques is not critical forpractical hydrological work.

- 61 -
Table 3 Comparison of groundv?ater flow velocities fromunadjusted and adjusted radiocarbon dates with,hydrologic calculations. Velocity is in metersper year.
No. Location VC14 V 4 ( a d j u s t e d ) VhycLrologic
5
2
7
1
6
Between
Between
Between
Polk City
F t . Meade
Wauchula
Arcadia
Cleveland
5 and-7
5 and 1
5 and 6
8
2
12
—
4
5
7
13
4
6
5-5
8
7
9
10
7-
5
—
9
7
7

- 62 -
6.2 Discussion
A question was asked about the source of CO2 that increases thehardness of water along its course downgradient. The amount of C02 isnot enough to increase,markedly, the bicarbonate content by dissolution.If an extra millimole of bicarbonate is to be added to water, one needshalf a millimole of CC>2« The answer is that the CO2 that originates froirthe soil zone reacts completely in the recharge area. Throughout thewhole recharge area in the aquifer studied in Florida, waters are stillundersaturated with respect to the calcite and continue to increase insaturation downgradient. These increments are not very large in manycases. It seems that there is still an "agressive" tendency in the watereven beyond the recharge area and that it takes thousands of years forwater to reach equilibrium with aquifer minerals. Unfortunately thiscannot be duplicated by laboratory experiments.
If slightly acid water is passed through a column of calcite, noacid water is found at the bottom of the column even though the movementof water is very fast. This seems to show that the dissolution process isnot slow. However it has been found in field experiments that unsatu-ration can extend for considerable distances.
Concerning the Pearson formula of adjustment of carbon-14 ages,it was stated that in some soils in arid and semi-arid regions limestone -horizons are present at relatively shallow depths. In such casesconsiderable exchange can take place immediately after infiltration tothe soil, before.the water reaches the aquifer. Such a process makes theapplication of the Pearson's equation not valid.
In studies made in USSE, values of ^ C content were found to be-25^0 without exception in the soil air taken from depths 20-30 cm.In Germany, in similar experiments, similar results have been obtained,although the 13c values were slightly lower — about -20 and -22$o.This shows that the value of -25%o used in Pearson's formula isreasonable.
- 63 -
6.3 THE 14c-WATER-AGE DETERMINATION "by I iVendt.
The water-age determination by means of carbon-14 is based on theassumption that biogenic CO (14c activity = 100$ compared with atmo-spheric CO2 and o1:>C = -25?oo) dissolves fossil carbonate (14c = Os
I = 0) according to the equation
x CaCO, + (x + y) C02 2x SCO," + y C02
The water therefore, has a certain concentration of HCO, and C0_.In case this reaction represents a closed system, i.e. tile total amountof CO, and COp present before the reaction is equal to the amount ofECO, and C0_ in solution after the reaction, the relative *4c activityand the <Jl u value would be equal to the relative amount of biogeniccarbon.
If, however, the CaCO, dissolution takes place above the groundwatertable, the.relative biogenic carbon content and, accordingly, the initialrelative C activity, is considerably higher than one would calculatefrom the HCO^ and the COp concentrations measured in the water sample.This is simply because part of the C0_, which has exchanged with thedissolved carbon, remains in the pore volume of the soil.
The influence of this exchange has beeniinvestigated both theoreti-cally and by means of model experiments in the*laboratory. These investi-gations have proved that it is not possible to calculate the initialcarbon-14 activity using the measured ^l^C value.
Based on these results, the groundwater recharge has been studiedunder natural conditions in large lysimeters of 4 m depth and 400 m^ area.The three lysimeters were filled with predominantly sandy soil and werecovered with grassi leaf-wood and pine-wood, respectively.
One can draw the following conclusions from the results obtainedup to now:
6.3*1 The carbon-14 activity of the dissolved carbon increased from1965 to 1968 slightly — from about 90$ modern to about 115$modern in all three lysimeters.
6.3*2 The carbon-14 activity and its time dependence is not equal inthe three lysimeters.
6.3.3 The HCO3 concentration changes within a few months, up to afactor of two.
6.3*4 The water is very soft and therefore contains only small COpconcentrations (compared with the HCO, concentration), but isstill considerably higher than the theoretical equilibriumconcentration.
6.3»5 The & ^C values remain within the range from -15%o to -l8$o.The simple l^C correction would yield 14c activities of thebiogenic CO2 of 115 to lfO/oo modern. If one corrects the measured14c activities using the chemical Q factor

- 64 -HCCL + CO
3 2HCO, + CO2
one would obtain values of 150$o modern to 200%o modern. Such adifference between the two types of correction must be expected,in case the CaCCL dissolution takes place above the groundwatertable. •*
The water collected at about 4 m depth is probably two to fouryears old. But because of the very -nronounoed change of the atmosphericcarbon-14 activity during the last five years a correlation ofcarbon-14 activity of the water samples and the atmospheric COp ispossible only after a longer period of observation.
Eepeated measurements of natural groundwaters show that most of thewater sampling stations are constant in carbon-14 activity over severalyears, but some show changes with time.
An improvement of the carbon-14 method of water-age determinationshould include a check of the following assumptions:
a. Soil-CO- consists of pure modern C0?:14c - 100% modern? ^ C * -25%o
b. The carbonate in the soil is purely fossil:14C = 0? 13C « 0
Assumption £) seems to be proved at least partly, h C value's ofsoil-CO_ already published and measurements made by the author*yielded 13c « -25 +, 2%o. The 14C activity of soil CO2 taken from2030 d t h t i l h d *4c tiiti f 125%y 5 , % y 220-30 cm denth at various places showed *4c activities of 125% to 155% .modern while the atmospheric CO2 measured simultaneously yielded aconstant value of 157 +. 1% modern.
6.4 Discussion
To take care of the process of dissolution taking place in the non-saturated zone the *3c value of the biogenic carbon could be increasedto, for example, -22%o or even to -20%o» The work in the Floridanaquifer shows that the Pearson's adjustment formula is valid.
A question was raised also concerning the new method of adjustment.It was stated that the water moving in the unsaturated zone would stillcontain free CO2 and by the time it reaches the water table it wouldstill potentially dissolve carbonate from the soil. Conditions wheresuch water is not actively dissolving calcite are rather unusual.
However, there is much more.COg present in the upper layers of thesoil than finally is carried away by percolating water. Considerableamounts of CO2 is active in some way or another in the solution processbut is not finally dissolved in the water. The CO2 concentration inthe water drops very rapidly from the surface downward.
Concerning the time required for saturation of the water with respectto dissolved carbonate species the saturation is only a matter of daysin laboratory experiments. However, in nature this does not happen andwater is unsaturated with respect to dissolved carbonate species in manyinstances. Supersaturation and undersaturation are frequently observed,depending on the environment studied*

- 65-
It was pointed out that the carbon contributed by the organicmatter in the soil is not necessarily modern. A certain part could beas old as 2000 years, for example. However, it should be rememberedthat what matters in this case, is not the residence time, but theturnover time, i.e. mass divided by the flux; this is hardly more than100 years, although a certain fraction of the carbon in the soil isvery old. The contribution of this old carbon is negligible.

- 66 -
6.5 CARBON-14 STUDIES MADE BY THE INSTITUTE OF GEOLOGY OFTHE AQUITAINE BASIN.Summary of the contribution by P. Levfeque
Studies of methodological nature have been made on three types ofaquifers. The first, a non-confined aquifer, is situated in southernFrance on the left "bank of the Eh6ne in the Crauz plain. Tritium,carbon-14 and uranium were used together with the routine chemicalanalyses of water. The second aquifer is situated to the east and south-east of Paris, in a rather peculiar formation. The aquifer is confinedin some places and non-confined in others; it is typical1 y karstic atsome places. The situation is complicated and the results of carbon-14and tritium are both very interesting and useful. The third aquifer isthe great sedimentary basin of Aquitaine. It is confined and has depthsranging between 100 and 550 meters.
The tritium content of the groundwater of the aquifer in the Crauxplain has been measured and compared with the tritium content of theprecipitation in the same region. The tritium concentration of thegroundwater samples, which were about 250 T.U., indicated that the waterwas derived from precipitation that occurred three or four years ago,when the tritium content of the precipitation was high.
The carbon-14 results agreed with the tritium results. Eight samples,which were collected for carbon-14 analysis, showed ratios ranging from86 to, 300$ of the modern carbon. The only carbon-13 result availableis •T « - 14»4$o« The corrected carborT-14 age is found to be *260 +_ 90 years. -
6»6 Discussion «%-
It was pointed out that in cases where carbon-13 values were moreenriched than -12$o, the Pearson's corrections would not be applicable.Carbon-13 contents more enriched than -12$£o probably indicate water ofYOlGSnie origin. The carben-13 content of waters in regions of activevolcanism can be as high as Ofoo or even higher. Another possibility isthe supersaturation where C-13 values as high as -lOfoo can be observed.However, the temperature of waters of the Aquitaine Basin, which followclosely the geothermal gradient, indicate that the waters are not ofvolcanic origin.
If the C-13 content of the carbonate rocks or cement material in asandstone aquifer is lower than +_ C$o then the resulting carbon-13content of the dissolved carbonates species will be too low, giving anapparently higher contribution to the biogenic carbon-13 and consequentlymaking the water look older than it actually is. The carbon-13 contentof an aquifer, or cement material, may also be different from one placeto another. This makes it necessary to have a representative carbon-13value of the aquifer by adequate sampling and measurement. The changeof carbon-13 content of the limestone is not due to isotopic exchange*It is rather due to the solution and reprecipitation process.

- 67 -
6.7 ENVIEOMEHTAL ISOTOPE UT7ESTIGATIONS IK TEE GRAZ BASIN, AUSTRIASummary of the contribution "by J.G. Zotl and G.L. Meyer
The tritium content of the samples collected in the deep artesianwells of the Graz basin was all below measuring level. The carbon-14results indicated groundwater ages between 4000 and 25,000 years, showingthat the groundwater movement in the aquifer studied is very slow.The raw carbon-14 ages were corrected by several methods which gavecomparable results.
Because information on the aquifers tapped by the wells and theirrespective piezometric surfaces was lacking, no quantitative answers asto the velocity of the groundwater were obtained. This makes the deu-terium and oxygen-18 content of the waters sampled even more critical.When oxygen«l8 is plotted versus deuterium (Fig. l) it is seen that allsamples with relatively younger carbon-14 ages, i.e. less than 12,000years, uncorrected, are found on the upper part of the diagram. This,of course, gives added confidence to the carbon-14 dating of the ground-water. The points representing groundwater samples do not fall on themodern precipitation line with the slope of 8 and deuterium excess of+10$o. Instead they all fall to the right of the line in similar fashionto those of Jordan and the Konya plain of Turkey. The isotopic changesthat occur during the infiltration and percolation of the water into thesoil may help explain the reason for this anomaly.
One plausible explanation of this condition is that there werechanges in the paleozoic temperatures* during the past such changes wouldhave influenced the isotopic composition of the precipitation and conse-quently of recharge as well. Also the chemistry of waters can help explainsuch situations; it should be investigated with the environmentalisotope content of the groundwater. The variation in the stable isotonecontent of waters, in the case studied cannot be explained by the altitudeeffect as no large altitude differences can be expected in the recharge.areas.
The carbon-13 values, which are around -10$o, should also beexplained in order to have a satisfactory picture of the carbon-14 ages.The extracting of carbonates by different methods, i.e. gas evolutionand precipitation from the water, may cause the high carbon-13 values.
Although there are obvious difficulties in the interpretation ofcarbon-14 data, they are extremely useful. For example, the oldestwaters were not found, as one would expect, near the center of the basinbut at its borders. This may be significant in making estimates of theavailability ard the reliability of the groundwater resources in the Grazbasin, where wqter supplies for dairy industries are important to theregion's economy.
Whenever it is possible to check carbon-14 results by conventionalhydrologic methods, excellent agreement has been found, but in regionswhere hydrologic information is not available or very sparse, one has torely on the indications given by carbon-14 results only; quantitativeresults cannot be obtained.
The work in the Graz Basin is still in progress. In order to havea better interpretation of the environmental isotope data and especiallyof carbon-14 content of the groundwater, basic data collection such asstreamflow measurements, piezometric elevation has started.

- 68 -
6.8 Discussion
Several persons expressed the opinion that the carbon-14 method hadstood the test of several studies. Tiiere is no doubt that a powerfulnew hydrogeological tool is now available in the carbon-14 dating ofwater. However, it was also an unanimous opinion of the panel that someconfusion reigned in the problems of exchange and adjustment of ages.The hydrologist in the field is not in a position to solve all thesecomplicated problems and choose the right way of adjusting carbon-14 data.It was decided, therefore, that the panel make definite recommendations.The sub-group of the panel made the following recommendations, which weresubsequently discussed by the whole panel and adopted:
6.9 RECOMMENDATIONS CONCERNING THE RADIOCARBON DATING OF GROUNDWATER
6.9.1 General Recommendations
6.9»1»1 It is the consensus of all the participants that radiocarbondating of groundwater is a valid method and in most cases, whenapplied properly, it will give valuable new information aboutthe aquifer system. This information is not available from othermethods or available at least only after long and extensiveinvestigation by routine hydrologic methods.
6.9.1.2 The carbon-14 method of dating applied to groundwater studiesshould be made more readily accessible to the field hydrologists.Most of the papers which cover the subject-adequately andcompetently are scattered through a number of different publi-cations that are not easily accessible for the practisinghydrologist. A good survey paper covering the limitationsand the advantages of the method, sampling procedures andinterpretation of carbon-14 ages of groundwater should beprepared and published in a widely-read hydrologic journal.
6*9*2 A large number of studies indicate that molecular exchange of thewater with the aquifer probably does not play a significant role inaltering the carbon-14 content of groundwater. If considerable massexchange did take place, the carbon-14 dating method could not work.The favourable comparison of flow rates and other aquifer characteristicsestimated both from carbon-14 data and data obtained by standard hydrologictechniques indicates that this is not the case.
6.9.3 It is recommended that 6 C standards be established and a limitedintercomparison be carried out among the few laboratories. .
6.9*4 Further investigations should be conducted for the comparison ofgas evolution and precipitation methods of collecting the carbonates fromthe water sample.
\

- 6 9 -
ABHEX
List of Particinants
Mr. L.J. Andersen
Mr. PL.K. Brown
Mr. '*.. Dansgaard
Mr. G.E. Davis
Mr. E. Eriksson
Mr. B.B. Hanshaw
Mr. Y. Harpaz
Mr. P. Le"v§que
Mr. K.O...MunnAch
Mr. A. Kir
Mr. E . I . Wendt
Mr. J.G. Zotl
Organ iz a t i ons
Mr. K.A. Bochin
Mr. D. Bur don
Mr.A. Forsman
Technical Secretariat
Mr. T. Din9er
Mr. G.L. Meyer
Observers
Mr. J . Alvinerie
Mr. R. Ambroggi
Mr. E. M^rck
Mr. H. Moser
Geological Surrey of DenmarkCharlottenlund, Denmark
Chalk River Uuclear Labs.Chalk River, Ontario, Canada
University of CopenhagenCopenhagen, Denmark
U.S. Geological SurveyWashington, D.C. U.S.A.
International Meteorological Ins t i tu t eStockholm, Sweden
U.S. Geological SurveyWashington, D.C. U.S.A.
Tahal - \ 'ater Planning for I s rae l Ltd.Tel Aviv, I s rae l
In s t i t u t de Giologiedu Bassin d'Aquitaine
Talen ce, France
University of HeidelbergHeidelberg, FexL. Rep. of Germany
Weizmann Ins t i t u t e of ScienceRehovot, I s rae l
Bundesanstalt f. BodenforschungHannover-Buchholz, Fed.Rep. of Germany
Vereinigung fur HydrogeologischeForschungen
Graz, Austria
UNESCO
F . A . O .
TK.M.O.
IAEA
IAEA
Institut de Ge"ologiedu Bassin d'Aquitaine
Talence, France
F.A.O.
Danish Radioisotope CenterCopenhagen, Denmark
Gesellschaft fur Strahlenforschung mbH.Munich, Fed. Rep. of Germany


OXYGBN -IB CONTENT
OF TUB P/?e~CiPl TA TION IN

-/eor rue pue apt TA TION IN

-26 _24 - 2 2. - «
>
/
-2o -18
' 8.i7±o.o8)
6-ooSi
BfiKKou
S
-16
c
$ o
tr BAY
.14 -in -lo -8 _6
ENfl•h(?.??±6.S8)
ATHENS p
TOKYO %S^
/* srurro
j/*' VIENNAyr
• /
s
9A/T0A/
FOKT SMITH
ase
f/6. 3 pe-u
COM 7
by i
_4 _2 o +1
j/Z' BARBADOS
i **K*CHI
lldO
4RT
to*.
T&Z'U'-) f> HD O X. y<j£*t - If
-&NT OF p/ZeciPtTAT>o*
r.K. yew
i
•f- 2.O
o
-2O
.-4O
_ do
_ Bo
.- too
-I2.O
.-IUO
• - ' *
._ I8ot
-Zoo
I
wI

A6 (Jnnsbruck- Hafelekar)
28'30 1 5 7 9 11 13 15 17 19 21 23 25 27 29
May June 1966
Fig. 4 Summer precipitation.. Lower section:Amounts of precipitation at Innsbruck. Mid section:Mean <5(O") of precipitation at Innsbruck. Uppersection: Mean 6(OU) difference, Ad, between Inns-bruck and Hafelekar. .
A 6 (Innsbruck • Hafelekar}
mm1510
5
70 31
" • 00 XXXX XX OHIKX XMXKOXXX X «O0 XXxxx x • * i x t o i x * o o x
1 5 10 15 20 25 30 5 10 15 20 25 30 5 10November December 1966 Jan. 1967
Fig. 5 Winter precipitation (cp. Fig. 1).
- 0 •
-2
-4 •
- 6 •
mm
200
100
f '•"'? VI
P
l\A
\ * \ "i
A
JFMAM3JASOHDJFMAMJJASOND1961 1962
0 :
-2
-4
- 6 •
-a •
100 200 300 400
FIG. 6 Amount effect at Binza (Leopoldville),Congo.
0
-2
-6
-10
mm
200
100
•MAMJJASO NO1*6!
ttti
FIG. 7j. Combined temperature effect and amounteffect at Tokyo. Upper section: S - mean 6 of twoneighbouring months. Mid section: p = the corre-sponding amount of precipitation. Lower section:The corresponding mean air temperature at surface.

DEUTERIUM IN CANADIANWATERS
• RIVER WATERSO PRECIPITATION
VALUES IN

14 5 -
oEa.a.
140zo
HZUlozoo
a135 —
130
-
-
- /65
- - _
—
-
-
^i ^^ O
1
- ^
J 67
A
69
• / ii
6 i y o
- O 6O3^
68 !1
70o
67
Cr65
_L_
64
•1 68
+*•*' 64
•
I ^
)
SOUTH
J
NORTH
1
i /\ ('>\\
CD63
/
Q___/58
SASKATCHEWAN R.6n2
\\\\
66
61SASKATCHEWAN R.
i 1 , 1
49 J
579/
^N 59
•
56
/ 1
j 60 2
Ai\: i
1 /; /• /:
OCTOBER
SMOW = 57.
1
--\\ 48
• NELSON R.
-
^ LAKE/WINNIPEG
-
1967
6 ppma
11400 1300 1100 900 700 500 300
DISTANCE FROM HUDSON BAY (MILES). DEUTERIUM CONCENTRATIONS ALONG THE SASKATCHEWAN-WINNIPEG-
NELSON SYSTEM
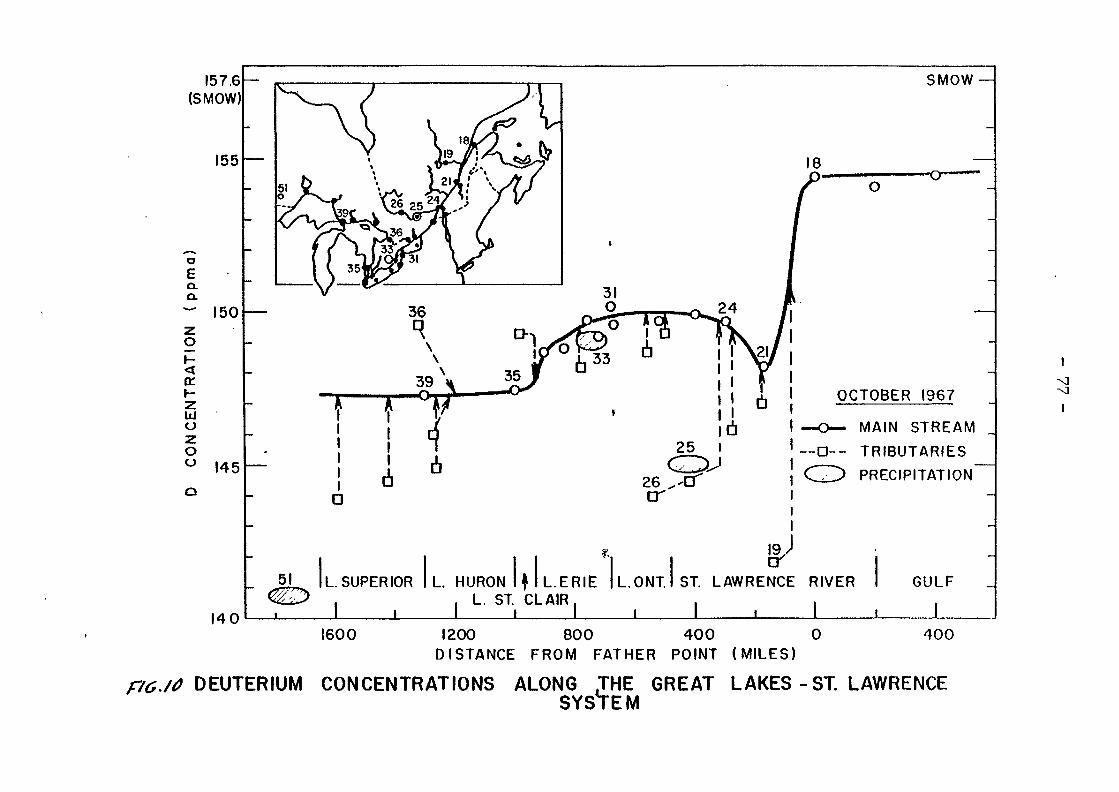
157.6(SMOW)
155
oEQ.
w 150zo
\-zUJozo° 145
140
51
SMOW —
o
OCTOBER 1967
MAIN STREAM
O-- TRIBUTARIES
PRECIPITATION"
ILSUPERIOR IL . HURON
I i, L. ST. CLAIR.
i I
I . ERIE IL .ONT. IST. LAWRENCE RIVER
i I I
GULF
J L _1600 1200 800 400 0
DISTANCE FROM FATHER POINT (MILES)400
DEUTERIUM CONCENTRATIONS ALONG THE GREAT LAKES-ST. LAWRENCESYSTEM
I

400
z 300o
\-2LJOZ
g 200
2t
100 —
0
—
—
D (ppma)
157.6 *S MOW155
/
145 <f/^ ."""V135
1 1
\h
1 \ft l>*r
i l'j11/? \\
/[I/ I
i i i
O TRITIUM MEASURED—> TRITIUM MEAN CURVE
^ tM-n-ri-nlilii iil->iMinl-n
• Ut.Ulb.mUIV! MtAoUntU
DEUTERIUM MEAN CURVEBASED ON AIR TEM^
* N n o
\ )
\ /
i
1 ! 1 1 1
4CJl"11
—
D(ppma)
155-
w1
M M N D
TRITIUM AND DEUTERIUM IN OTTAWA PPTN1961

- 79 -
22
20
18
-* 16
O
. R E A C T O R T R I T I U M IN
TREE R I N G S
0
2 12
TRIT IUM IN CELLULOSE
COMBUSTION WATER
TRIT IUM IN WOODMOISTURE
Z 10UJ
o
oo 8
orf- d( 1945)
2 -
'45"'52 '54 '56 *58 '60 "62
RING YEAR
DISTANCE OF TREEFROWDISPOSAL-PIT
50 f t .
200 ft.
1700 ft.
'64 '66

4000
2000
tiooo
p 600<
400<
o
8 200
t 100I-
60
40I
I Cellulose Tritium at Time ofWood Formation
I Precipitation Tritium at OttawaI -Means for April-Sept.
I I I I I I I 1
I -
I -
1954 55 56 57 58 59 60 61 62 63 64 65
CD
o
. /3 TRITIUM IN TREE RINGS AND PRECIPITATION AT DEEP RIVER

F\G.\4 STATIONS COOPERATING IN THE IAEA/WMO ISOTOPES-IN-WATER NETWORK
INCLUDING THOSE RECOMMENDED FOR ADDITION
• MIDWAY I f .
I OB MORE STATIONSTO BE LOCATED BY
USSR
•HAWAII
JOHNSTON IS.
• CANTON If .
• AHA
• RAROTON«A
PASCUA
• PRESENT NETWORK STATIONS
A STATIONS RECOMMENDED FORADDITION
INVERCARfilLL
ANtENTINE IS.IMAULEY BAY
(OFF HAP I
T
r

- 82 -
mrr1 J i F
r—M
i
vm~~i:
-Oft
no"500
Oft
eo7fl
60
.Anq u
! • • •
io
....
7GG
B9C
6ft-1
2S-C
6
-
jI
4-_j_- - ( • -
- • -
i
- •
- | -
I
|
i
j . . . .
4-• - : • •
" T
...
i—
—
i.....
i
- K
—
' 1
-
-
——
- •
-
1
j
J
. . . j .
!
.!
1
'IK/ • • •
T(
1
•
fT ;r i
i• ! -
ij .
-4-
A M J A!—1
COlsCiHOICTJON
T "
i
I
i
-j-
i
.
sr
;j
r
i
PRJEC.LPJ.J.PElRCiOLiAT
.....
\
:
/ ,
;
•
T
r
i, J_ii
—
*%.
Ok ; — '
,
,.,.1
7
•
- * -
!
1
AA
.:_.- i .
i _it
'
s
v\\
!1
S 0 i N1 j
1
k T i o. !
0]N1
:
;
1
\
I
\
;
!
. . . . . .
•
(\
V
i •
M
' D ; J
— i
_ •——
1C ^— •*"R A " *
F M A • M J J A
• - '
!
:i 4-
i
i
—
\V
...
• •
\\
kJ
1
1
;
— -
I
—
f
V—-.
.... --
J
-,
-**
-A-
is1
.....
0
....
N
1
N D
• - i -
- 4 • •
i
- — -
A
-0-
v
M
•
\
r
-©-
1. . . K
-6
-7a
-9-<0-11
12
-13
^4
-15

- 83 -
—
M
(«(
• O t
8C
—-
ru30C
30C
XK
CO!
ooc9OC
3BC
£ M
-
r.
•j
i
1 •
—
—
_
- -
-
M J J - A ' S .C
T\ r~:—:
: - ; - ; -
1
" i : p -1 j
1—j
!: s >--
N 0 J • F M A M J J A S ' 0
1 9-6 6
Pt ' l Z'ENK! RCHfc'N
;
I
t
j—I
IE• ' ! i
u | I !
'/ \ : '
/ i\ = ! •
\/i A; :
' ' - ^ -A ! . •
• • • ' ' \ !
•
«1 1
s *
•£_
i
-
i
•i
i
i ;
j. i i! ' •
! i i• ! i '!
!
j . '•
I 1
' . i
i ' i
! t '
1
- !—
- j
-I—;•
• ' :
; . •
' ' • '.
1 :
1 i . , . —Jn r-n
i
-
! •
J •
! • "'l-.j. . ...j-.-i H -
i . j -...!
• - i - j - i ••
, • p
• N 0
Fr.CI»l
J
rAi
F ' H . A H-J
, - . . ; .I.....XS
. r
r|f)N ' ~ ~r~~
=EPCOLAT!CN ' ''LfSlHEnR
JJ
.. : .
-1 1
1
1 , 1
t _I
_ J ._..i .
i ' ''i 1.. '..' '-.
I-- '^^ • • ' ' •
•
• • • ' • /
/ • •
: »_/: \ i
• •
••
-•: V
-
I ' \! ; \
i V
: 1 ,
; : .'
; : i
• ' :i i : '
\ ' ''
\y\ •.
! ' \
->s \• • : \
- U
•46
lik
-43i
1 • • i
1 • ! '
, ! j i j! , ' ' i ' '
' t '
• j
; ; i: •• i j !: M ! !
• ' ! \
ii1 1
-4-
!—!
\
nL\; .
j
; .
i
i
i '
-!: ^
X .
1
1 !
: ,
1 ;1 '
:
! ,I
!
...
-
V
J\ \ 1 !{ • • • \ / - i
t -
• •
*
•,
1
;-A-<-S ! o
.---!—.
i ;
, —
uJ "I! !
—
-
;
j 4_ . .
i1 I
1
i
-
/ •• "
J
• ' • • /
. /r ~\// • . • - .
V'—'-1 •
•
J...
• 1 •
....
/ s
-• —
!
i
IN ' -O- J I - f . M .
-
- - -. : . . . . . . . ;
• -. - -
i •
I•i
v A\ /\iV---
•
—j-4—
A"' t c
1 •
1 ' . 1
I : ' t !
j ! j :
j I
1
1 1• r " i
1;—,-..
~t --
-> i
1 :
;
-
—
— i - —
i
T ."! - 1 — ! — 4 -
' 1 • ]"~"T j " ' j *'|
•i ; •
i ! I
H- i -i ! -\ i -
' X ' ; • '
i i j • ! • i
j
]
! i i -
i i '1 '
I i '
t ; - j ;! 1
— —
r—-Hri\-r/i-i-
-••i
-
—-
——__.- •
V
—...
- -
—
— - •
j
1
. . - ! _
.1
1M D ' J T ! M ]

- 84 -
5£-
?e-
TU500
400
m m J ! F M ; A : M
or
am
2&ci
* * J
-a-
-3-
^
A
M A M J J A . .i i 9 i 6 7
JUPREL LE
i ' ; • •
PRECIPlfATiON;—;
PERCOLATION ' - - - i !
I r. . L
II
• 1
_ 4 -
A..[.hi L.
i ! T"
i t :
i I !I Tr T
\ i•f-^h-
r-j.
j
r ' T I ! i ~T i i

- 85 -
PE ft r. r - i / A pja-yearly wt. average
*>; M-^--^-
I I
• - - -1- -1—r «r—r ,
L J-..-J- - ! —1 1 1 !
! I I !• -|-—I—1—i—r

- 86 -
too Zoo Zoo 400 tOO ZOO 300 AOO
tOO 2OO
Dec 67
srnr(J>)
4oo
to
too Zoo 3oc 47&/7/t/st „ 7.i/.
JBi.£
}
•
neiDBi.Be/m)
-K- In (ei; t»)St.e TAK&J 1/TAtT Hi. A

- 87 -
•
Its
tIT
10
F'/a. Zo
T.U.100 loo Z>oo AOO
—
A , _ \>fftT£e. T/f3LE v
4r ~*eou ee.
I
7s/6. /? (<z) . A/0 C0/££ £~Cf/0tfAfAP^ F&Jt P€~CAy .
Jan. €7
Ja/>.66
64
6Z
SB
54-
SZ

•I
70 8O 9oC-14%
* -12
*?
• ^ 1
8
\- I I
7o Qo% *
•xr W/17&Z 7% Bar. ~W 0 -If. 3
/•
-11.3
~/2
00
i
F/<S. 21 /¥C
/f &J.

- 89 -
2o
I-/o
F/6. 2Z

- 90 -
1
V- 5
-/o
U/ziTe/z. TAALS
\
-
ToTAL CA&&0A//9jr£- &>*/?
S£"£- ALSO fe/6. ZZ
T
\
•
TEA/T or

To 6c
•
-,/1
F/6 . Z4
7o So
(-A-J A"£>
€>£L*y or
—
V Ot" ** & Jl
2 ye
f 0*
loo //o
A
\
•
*• ApYfS/W&t
t*Afl'(4/# /ex! Ctff
rA&S /V 7/V-tz
*fe COAt££W7X.
m
a
*
-
-
-
Jan. £7
Tan 6C
&
60
56
56
54
52
l/C
/*?

. £5 LOCAT/OK

- 93 -
Welt GR0NH0J No 1 D.G.U. file nr. 66.664
Depth
o 10-
* 15-
2U1
o 25-
30-QJ
35-
A0-
55-
60-
SANDAND
GRAVEL
SANDGRAVEL
ANDPEPPELS
FINESAND
SILT
FINESAND
FINESAND
FINE TOMEDIUM
SAND
QUARTZSAND
FINESANDWITHMICA
Tritium concentration TU Soil moisture vol %i
200 400 600 S00 0 10 20 30
Well drilled JULY 1966 l__n. g D u . r m M . M_ , , . . ~n *-#vtw ,nr.r~ rGEOL. SURV. OF DENMARKSamples evaporated APR-MAY 1966JWater analysed MARCH 1968 by DANISH ISOTOPE
CENTRE
Compiled APRIL 1968 byL.J. ANDERSEN, GEOLSURV.OFDENMARK
F/G. 26

Well near ENGESVANG D.G.U. file no. 86.913
Depth
X 10-
15-c
I 20J
I 25-
L1TH0-LOGY
SANDYCLAY
CLAY SAKDAND GRAVEL
SANDY
CLAYW/
STONE
Tritium concentration TU Soil moisture vol %
200 400 600 800 0 10 20 30 40i I i i i i i i i i i i
Perched water labie
FINE TOMEDIUM
SAND
DARKSANDY
Water tabel
° F
Water analysed MARCH 1968 by DANISH ISOTOPECENTRE
Compiled APRIL 7968 byL. J. ANDERSEN, GEOL. SURV OF DENMARK
F/G.

- 95 -
700 OXYGEN-IE CONTENTOF THE RUNOFF
TRITIUM CONTENTOF THE RUNOFF
APRIL MAY
—11.5 -f
-12 0
iz
-t2.S
-13.0
FIG.28 Streamflow hydrograph, tritium and 18O content of the runoff during snafcrmelt season 1965-66in Modry Dul basin. The sub-surface runoff is estimated by using the relation given in Fig. 2. (V.2)

km 400 200 0
FIG.29 Cross-section of a glacier.
Camp Century
D«Dth 6 D — I n t e r p r e t a t i o n
1 - 3 0 0 - 2 5 0 - 2 0 0 % t e * t l i t i
e m300
400
700
S 55
S 54
S S3
FIG.30 Deuterium profile of a. glacier.

- 97 -
200
--I5O
J 0 R 3D A N
TABUK / BASIN/
'.0
150 200 2S0 300 350Figure 31- Major topographic features and drainage basins of Jordan.
Nuabers along bottom and right margins are coordinatesfor Jordan kilometer grid system.

10J-
1OT
Ssz"op<t in
o :UJaa.>-. '
THI
z
i
IRBID . KABBA1—1 < 1—i |"~'i 1 • 1 ' 1 ' I • I • | • l • 1 • 1 • 1 • If—'—I—'—T • 1 ' • I r —j i I ~ " T ~ ' 1 T 1 •—1—i 1—I—1—i—|—T 1—i—|_ 7 - 6 - 5 - 4 - 3 - 2 - 1 0 _ 8 { - 7 - 6 - 5 - 4 - 3 - 2 - 1 0 1 2
> y =3.08-4.79 Ic)gXx * ( , = 0 . 8 7 5 )
X
X
<
V X "
x N.
AMMAN •
IRB1D X
RABBA o
SRAUBAK *
V. X
\ ^\ ^
\
\
\
\ ^\ ^
- 8 - ;
_ y=4.92-5.80 Icg x• * (pr=0.B39)
\
\
>
X
- 6 - !
•
>•
i - 4 - ;
•
•
- 2 -1
\
\
0
\
0
».
w y == 1.16-3.27 ogx* (p=0.794)
\ J\A
0
\N»
o
a
\\
\\
\\
\ \\\
\
\
\
\\
A
\
\
- 8 -
—I 1 « t • 1 i I . t . I . t . I • . I • I • 1 • t . i • il—<—1—i—i—1—l_i—1—1—1—i 1 i 1_ i 1 _i 1—l—1
. y = i .56-2.62 lo(5X* (p = 0.676)
V x
\
\
\
k
- 6 - £
u _i , i
v\\\\\\\
\
.-4 -x |_j
V
\
\
? - 2 -
t _ , I L._l1AMMAN KHAUBAK
00
Figure 32 Monthly precipitation amount vs. 180 content

-? -8 -7
A
/
-6 - S
s
/s
sr
—4mO y
"~/Cs
- 3
<3. 3 31
-2%
V
t
/A/
/ / V
- /
re
~ SDG&OUfi/t
O
+ 40.
0 .
-Zo
_3o
-40-

-AO.O -9.5
C ACJ?
/2000
y
- 7 o
oo
A
A
. 34STASLe ISOTOPE COMT&MT -7S~
or GR.OUNPWQT££- MGRAZ AMD STYRIA } AUSTRIA

Border uf (he catchment
areas according fo
official nrvs list
drift direction of
violet spores
dtift direction of
green spares
direction ofurtdyed spores
\AD ISCHL
discharge.
e l«* than 10 IAO W - 50 l/tO SI-KO (A
rtwr» fr)an 500 (A
2i

- 102 -
83° 80*
EXPLANATION
-v 1\ sea level, in meters
Area of principle recharge
" * 0 N . Lines of equal heod abovt
29*
zr
Figure 3£ Potentiometric surface of the principal artesianlimestone aquifer in central Florida showingareas of principal recharge.

- 103 -
83° 82* 81* 80*
29°
EXPLANATION
Ltnei of equal heod abovesea level, in mettrj
Area of principle recharge
Unadjusted radiocarbon
\ Isochron, in 103 yearsage
29*
28*
zr
Figure 37 Potentiocetric nap of principal artesian aquiferin central Florida showing unadjusted hydroisochronsfrom Carbon-14 dating of dissolved carbonate speciesin ground water.

- 104 -
80»
29°
ines of <quol head above
sea level, in meters
Area of principle recharge
Adjusted radiocarbon age
Isochron, in 10s years B. P.
Figure 38 Potentiometric nap of principal artesian aquiferin central Florida showing adjusted hydroisochrons.Carbon-14 age of dissolved carbonate solution iscorrected for limestone solution by means ofC13/C12 r a tios.