internship report - arizona state universitycbs/projects/2006_report_goldberg_loretta.pdfinternship...
TRANSCRIPT
INTERNSHIP REPORT
EXTENDING GENE FAMILIES VIA
PREDICTED ANCESTRAL SEQUENCES
An internship report presented in
partial fulfillment of the requirement of the Professional Science Master's
in Computational Biosciences
Loretta G. Goldberg Computational Biosciences Program
Arizona State University
Michael S. Rosenberg, Ph.D. Internship Advisor
School of Life Sciences Arizona State University
Internship: From: September 2005 - May 2006
THIS REPORT IS NOT CONFIDENTIAL
Technical Report Number: 06-04 April 28, 2006
ACKNOWLEDGEMENTS
I would like to thank my advisor, Dr. Michael S. Rosenberg for suggesting this internship
project, and for his guidance and support throughout the completion of it.
I would like to thank my committee members, Dr. Rosemary Renaut, Dr. Jeffrey
Touchman, and Dr. Michael Rosenberg for their feedback on this final report, and their
guidance with respect to numerous projects completed as part of the Computational
Biosciences Program.
- 2 -
TABLE OF CONTENTS
TABLE OF FIGURES........................................................................................................ 5
TABLE OF TABLES ......................................................................................................... 5
ABSTRACT........................................................................................................................ 6
GOALS OF PROJECT ....................................................................................................... 7
INTRODUCTION .............................................................................................................. 8
OVERVIEW ..................................................................................................................... 10
METHODS ....................................................................................................................... 14
1. Protein Sequence Selection................................................................................... 15
2. All-vs-All Searching, Clustering of Homologous Sequences............................... 16
3. Sequence Alignment ............................................................................................. 19
4. Construction of Phylogenetic Trees...................................................................... 20
5. Prediction of Ancestral Sequences........................................................................ 21
6. All-vs-All Searching, Clustering with Ancestral Sequences ................................ 22
RESULTS ......................................................................................................................... 23
1. Performance/Timing ............................................................................................. 23
1.1 Acquisition of NCBI Non-redundant Protein Data base (nr).............................. 23
1.2 Obtaining a “Species” Specific Protein Database............................................... 23
1.3 Obtaining a BLAST formatted “Species” Specific Protein Database ................ 23
1.4 Clustering the Sequences** ................................................................................ 24
1.5 Collecting the clusters*....................................................................................... 24
1.6 Alignment and Tree Building per cluster*.......................................................... 24
1.7 Ancestral sequence Reconstruction per cluster***............................................. 25
1.8 Performance/Timing Summary.......................................................................... 25
2. Clustering Data (Initial Clustering) ...................................................................... 26
3. Clustering Data (Clustering with Ancestral Sequences)....................................... 27
4. Comparison of Clustering Data ............................................................................ 28
5. A Detailed Example.............................................................................................. 31
CONCLUSIONS............................................................................................................... 35
1. Research Goals...................................................................................................... 35
2. Educational Goals ................................................................................................. 36
- 3 -
FUTURE DIRECTIONS OF THE PROJECT ................................................................. 37
REFERENCES ................................................................................................................. 41
APPENDIX A: SOFTWARE PACKAGES UTILIZED................................................. 43
1. formatdb................................................................................................................ 43
2. blastclust ............................................................................................................... 43
3. clustalw ................................................................................................................. 44
4. codeml................................................................................................................... 45
APPENDIX B: PERL SCRIPTS ..................................................................................... 46
1. mySubs.pm: .......................................................................................................... 46
2. bClust.pl:............................................................................................................... 46
3. buildClustalBat.pl: ................................................................................................ 46
4. buildCtlFiles.pl: .................................................................................................... 46
5. collectClust.pl: ...................................................................................................... 47
6. collectClustHdr.pl: ................................................................................................ 48
7. compareClust.pl: ................................................................................................... 48
8. countClust.pl: ........................................................................................................ 48
9. dbFormatter.pl:...................................................................................................... 48
10. extractAnSeq.pl:................................................................................................ 49
11. modifyAlignFiles.pl:......................................................................................... 49
12. modifyTreeFiles.pl:........................................................................................... 50
13. spFilter.pl : ........................................................................................................ 50
14. testTiming.pl: .................................................................................................... 50
APPENDIX C: BATCH FILES....................................................................................... 51
1. clustalw ................................................................................................................. 51
2. codeml................................................................................................................... 51
APPENDIX D: CONTROL FILES ................................................................................. 52
1. codeml....................................................................................................................... 52
APPENDIX E: SUMMARY OF BLAST PROGRAMS................................................ 53
1. Search Utilities...................................................................................................... 54
2. Sequence Manipulation Utilities........................................................................... 55
3. Advanced Utilities ................................................................................................ 56
APPENDIX F: GLOSSARY ............................................................................................ 57
- 4 -
TABLE OF FIGURES
Figure 1. Proposed Project Workflow ............................................................................. 11
Figure 2. Cluster File Comparison – no change in clustering........................................... 28
Figure 3. Cluster File Comparison – additional sequences linked to ancestral sequences29
Figure 4. Cluster File Comparison – clusters combined and sequences added ................ 30
Figure 5. Clusters and singletons following initial clustering ......................................... 31
Figure 6. Clusters with their Reconstructed Ancestral Sequences, prior to reclustering. 32
Figure 7. Linkages within Single composite cluster......................................................... 33
Figure 8. Phylogenetic tree for the Olfactory Receptors .................................................. 34
TABLE OF TABLES
Table 1. Software Implemented....................................................................................... 14
Table 2. Size of species specific databases...................................................................... 16
Table 3. blastclust Protein Clustering Default Parameters .............................................. 17
Table 4. Time required per species database ................................................................... 26
Table 5. Initial Clusters per species database ................................................................... 27
Table 6. Clustering with Ancestral Sequences ................................................................. 28
Table 7. Summary of Impacts – Clustering with Ancestral Sequences............................ 31
- 5 -
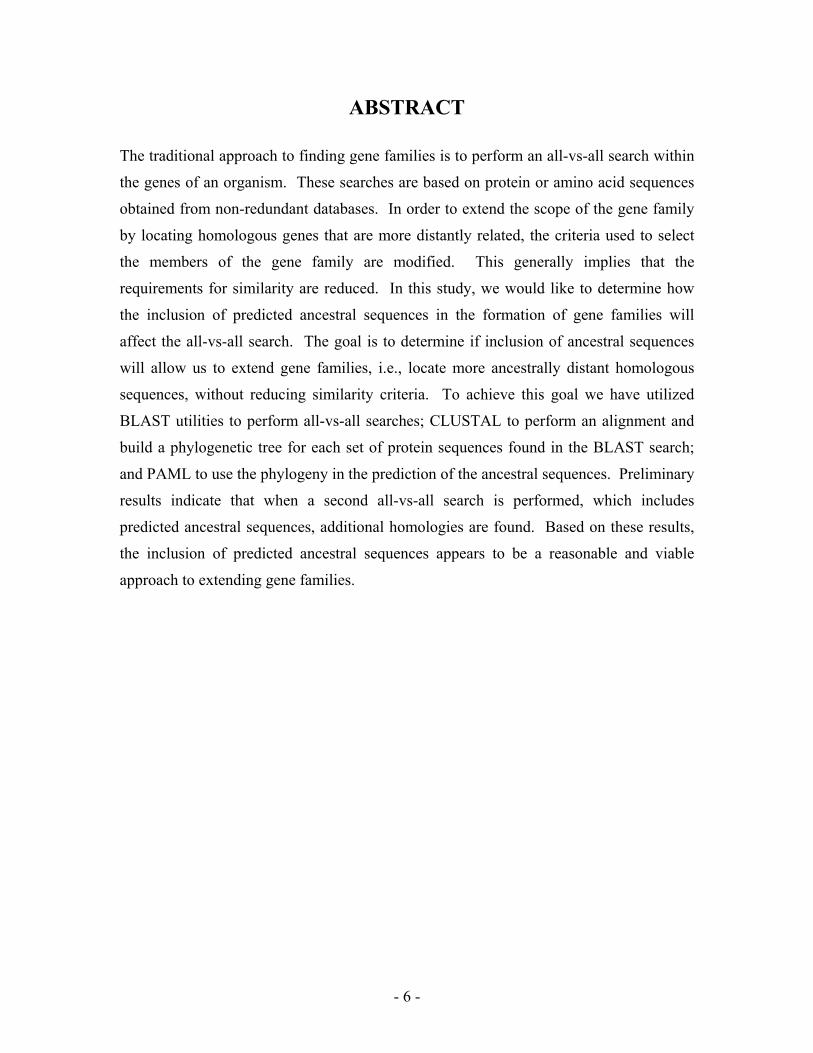
ABSTRACT
The traditional approach to finding gene families is to perform an all-vs-all search within
the genes of an organism. These searches are based on protein or amino acid sequences
obtained from non-redundant databases. In order to extend the scope of the gene family
by locating homologous genes that are more distantly related, the criteria used to select
the members of the gene family are modified. This generally implies that the
requirements for similarity are reduced. In this study, we would like to determine how
the inclusion of predicted ancestral sequences in the formation of gene families will
affect the all-vs-all search. The goal is to determine if inclusion of ancestral sequences
will allow us to extend gene families, i.e., locate more ancestrally distant homologous
sequences, without reducing similarity criteria. To achieve this goal we have utilized
BLAST utilities to perform all-vs-all searches; CLUSTAL to perform an alignment and
build a phylogenetic tree for each set of protein sequences found in the BLAST search;
and PAML to use the phylogeny in the prediction of the ancestral sequences. Preliminary
results indicate that when a second all-vs-all search is performed, which includes
predicted ancestral sequences, additional homologies are found. Based on these results,
the inclusion of predicted ancestral sequences appears to be a reasonable and viable
approach to extending gene families.
- 6 -
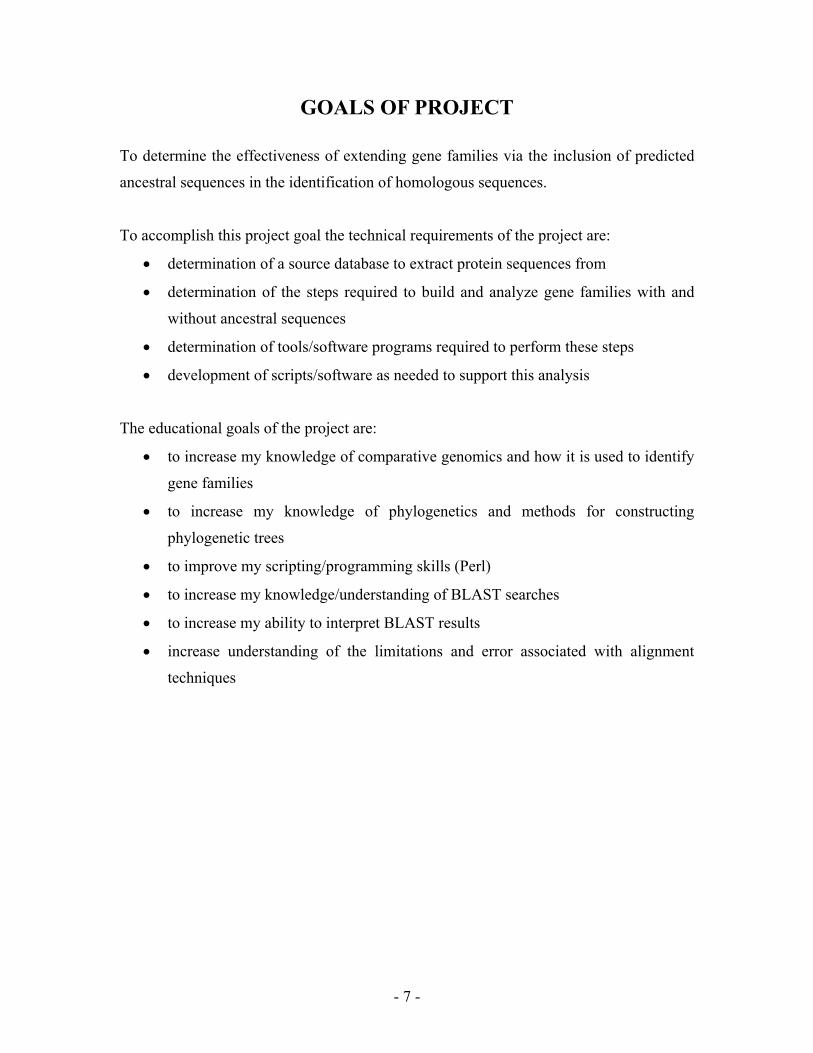
GOALS OF PROJECT
To determine the effectiveness of extending gene families via the inclusion of predicted
ancestral sequences in the identification of homologous sequences.
To accomplish this project goal the technical requirements of the project are:
• determination of a source database to extract protein sequences from
• determination of the steps required to build and analyze gene families with and
without ancestral sequences
• determination of tools/software programs required to perform these steps
• development of scripts/software as needed to support this analysis
The educational goals of the project are:
• to increase my knowledge of comparative genomics and how it is used to identify
gene families
• to increase my knowledge of phylogenetics and methods for constructing
phylogenetic trees
• to improve my scripting/programming skills (Perl)
• to increase my knowledge/understanding of BLAST searches
• to increase my ability to interpret BLAST results
• increase understanding of the limitations and error associated with alignment
techniques
- 7 -
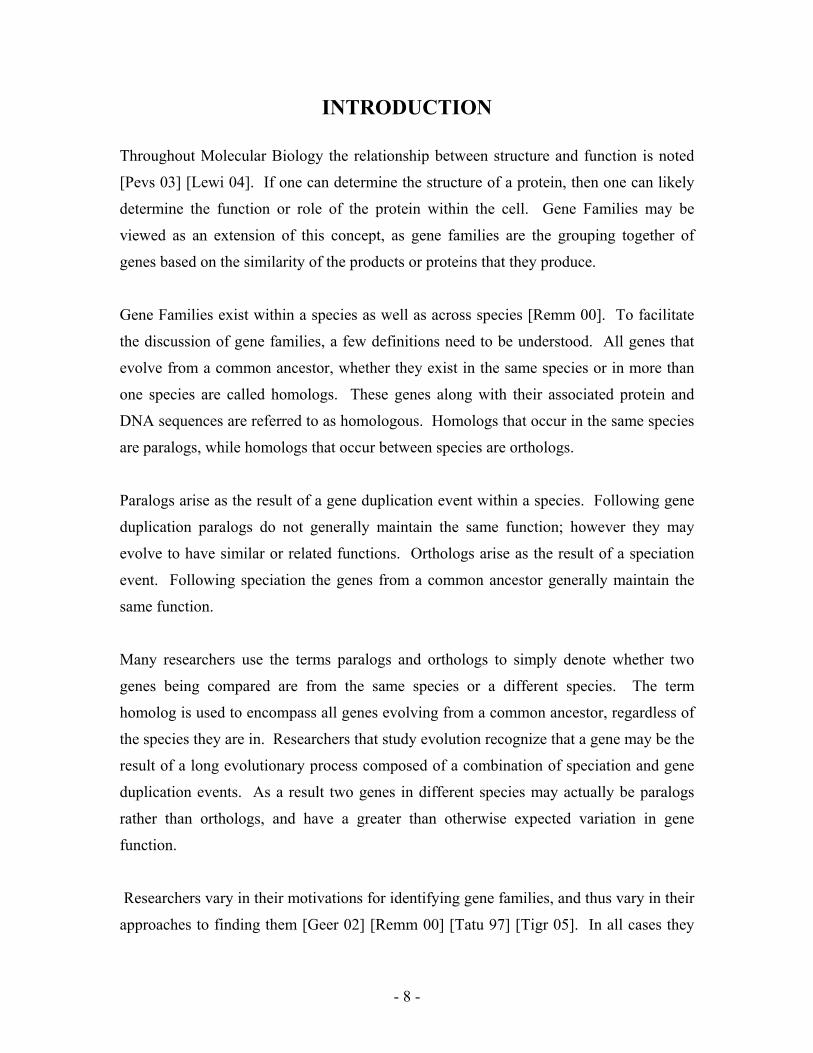
INTRODUCTION
Throughout Molecular Biology the relationship between structure and function is noted
[Pevs 03] [Lewi 04]. If one can determine the structure of a protein, then one can likely
determine the function or role of the protein within the cell. Gene Families may be
viewed as an extension of this concept, as gene families are the grouping together of
genes based on the similarity of the products or proteins that they produce.
Gene Families exist within a species as well as across species [Remm 00]. To facilitate
the discussion of gene families, a few definitions need to be understood. All genes that
evolve from a common ancestor, whether they exist in the same species or in more than
one species are called homologs. These genes along with their associated protein and
DNA sequences are referred to as homologous. Homologs that occur in the same species
are paralogs, while homologs that occur between species are orthologs.
Paralogs arise as the result of a gene duplication event within a species. Following gene
duplication paralogs do not generally maintain the same function; however they may
evolve to have similar or related functions. Orthologs arise as the result of a speciation
event. Following speciation the genes from a common ancestor generally maintain the
same function.
Many researchers use the terms paralogs and orthologs to simply denote whether two
genes being compared are from the same species or a different species. The term
homolog is used to encompass all genes evolving from a common ancestor, regardless of
the species they are in. Researchers that study evolution recognize that a gene may be the
result of a long evolutionary process composed of a combination of speciation and gene
duplication events. As a result two genes in different species may actually be paralogs
rather than orthologs, and have a greater than otherwise expected variation in gene
function.
Researchers vary in their motivations for identifying gene families, and thus vary in their
approaches to finding them [Geer 02] [Remm 00] [Tatu 97] [Tigr 05]. In all cases they
- 8 -
are looking for similarities from which they hope to gain additional information with
respect to the genes. In their study and classification of proteins within a single species
Remm et. al. utilized nine different approaches to finding paralogous proteins [Remm00].
Once they had fully characterized the proteins in a single species, they used the
information to gain insight into human proteins (orthologs to the initial study).
This study investigates a single approach for finding homologous sequences. A
combination of established techniques is utilized. A search of the literature did not find
any studies which utilize this same combination of techniques.
This study started with analysis of protein sequences from a single species. Based on the
results for a single species, the feasibility of processing additional species will be
discussed. This discussion must consider any limitations of the approach with respect to
the amount of data to be managed as well as the processing time and computer memory
required. The success of the approach with respect to the ability to find homologous
genes, i.e. extending gene families will be presented.
- 9 -
OVERVIEW Researchers investigating gene families have a variety of research goals. A researcher
may be looking for genes with a specific functional domain [Remm 00] or they may be
interested in improving the accuracy of existing database annotations [Geer 02]. The
differences in their goals may determine whether they are searching for specific motifs
within the proteins or whether they are interested in all aspects of gene families. A
common starting point, regardless of the specific research goals, is identifying the
appropriate source for the protein sequences and performing an all-vs-all or all-against-all
search within the protein sequences [Geer 00] [Li 01] [Tatu 97] [Tigr 05].
Some authors gather their protein sequences from a species specific database, while
others gather their sequences from a database encompassing numerous species, e.g.
Swiss-Prot, UniProt, or NCBI [Pevs 03]. The database that appears to be referenced most
often in the literature is the NCBI non redundant protein database (nr)1 [Geer 02] [Tigr
05]. The nr database contains protein sequences for many species.
BLAST, Basic Local Alignment Search Tool has become a standard with respect to
sequence searching, for both DNA and protein sequences [Atls 90]. Numerous variations
of the BLAST search tool have been developed, such that the appropriate BLAST search
varies with the type of sequence (DNA or protein) and the sequence characteristics being
searched for [Atls 97] [Geer 02].
For this study the decision was made to use NCBI’s nr database as the source for protein
sequences. This database can be downloaded from NCBI’s website using the URL listed
in the footnote below. Figure 1 depicts a high level view of the steps necessary to
complete this study, with the collection of protein sequences depicted as first step. Our
plan was to start the analysis with a single species, and thus the sequences for a single
species are filtered from this database, to obtain a species specific database.
The second step in this study is to perform an all-vs-all comparison on the sequences. To
determine the type of BLAST search most appropriate to this project, the suite of BLAST 1 ftp://ftp.ncbi.nlm.nih.gov/blast/db/
- 10 -
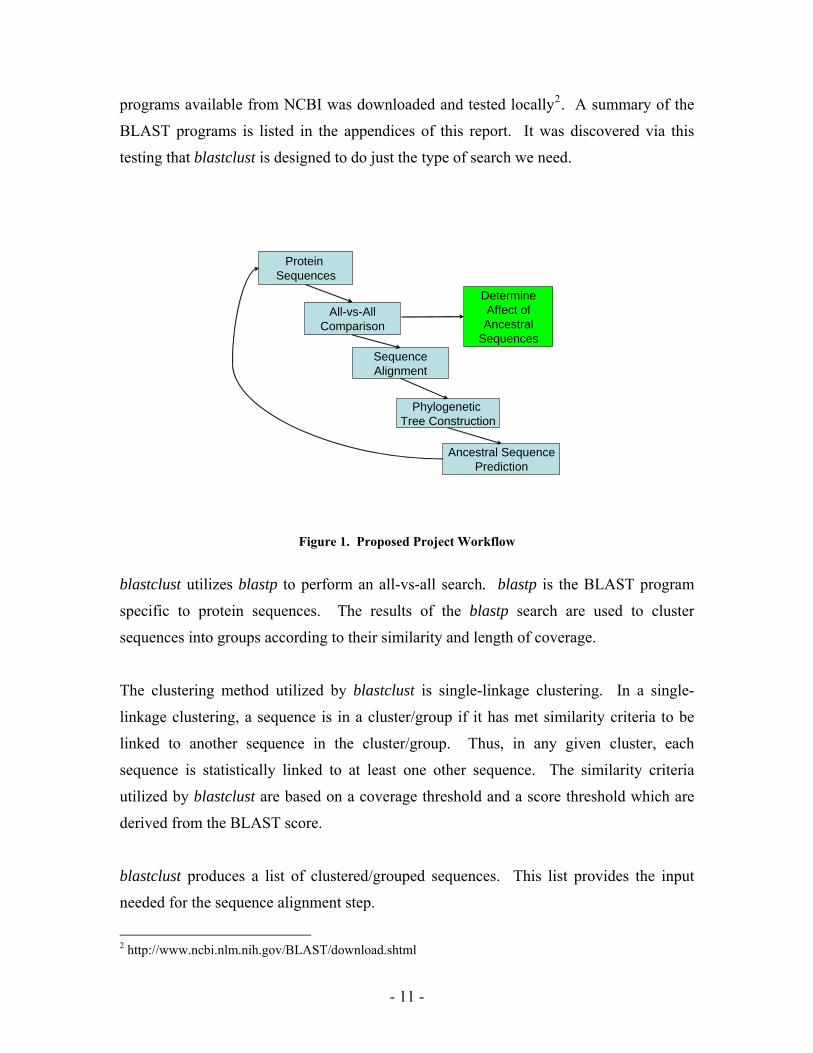
programs available from NCBI was downloaded and tested locally2. A summary of the
BLAST programs is listed in the appendices of this report. It was discovered via this
testing that blastclust is designed to do just the type of search we need.
Protein Sequences
All-vs-AllComparison
SequenceAlignment
Phylogenetic Tree Construction
Ancestral SequencePrediction
DetermineAffect ofAncestral
Sequences
Figure 1. Proposed Project Workflow
blastclust utilizes blastp to perform an all-vs-all search. blastp is the BLAST program
specific to protein sequences. The results of the blastp search are used to cluster
sequences into groups according to their similarity and length of coverage.
The clustering method utilized by blastclust is single-linkage clustering. In a single-
linkage clustering, a sequence is in a cluster/group if it has met similarity criteria to be
linked to another sequence in the cluster/group. Thus, in any given cluster, each
sequence is statistically linked to at least one other sequence. The similarity criteria
utilized by blastclust are based on a coverage threshold and a score threshold which are
derived from the BLAST score.
blastclust produces a list of clustered/grouped sequences. This list provides the input
needed for the sequence alignment step.
2 http://www.ncbi.nlm.nih.gov/BLAST/download.shtml
- 11 -
There are many algorithms/programs for performing sequence alignments. Just as
BLAST has become the most utilized program for sequence searching, CLUSTAL has
become the most utilized program for sequence alignment [Thom 94] [Pevs 03].
CLUSTAL utilizes neighbor-joining to construct a guide tree for the sequences, and then
utilizes the guide tree to perform pairwise alignments of the sequences. This approach is
referred to as a progressive multiple sequence alignment [Thom 94].
CLUSTAL can take a file of FASTA formatted sequence as input, and produce an
alignment in numerous formats. In addition to performing a sequence alignment,
CLUSTAL can also construct a phylogenetic tree for the aligned sequences. Thus, this
program may be utilized to perform two steps of our process.
The final step in the process, before returning to the top of figure 1, is to use the
phylogenetic tree to predict/reconstruct ancestral sequences. The PAML program,
Phylogenetic Analysis by Maximum Likelihood, is capable of doing this [Yang 94, 95,
97]. PAML utilizes protein specific matrices and maximum likelihood calculations to
predict the ancestral states within each phylogenetic tree [Yang 97].
The ancestral sequences produced by PAML are collected, converted to FASTA format,
and added to the database of sequences that the analysis was started with. A new all-vs-
all analysis is performed on the database which includes the ancestral sequences. The
process is completed by comparing the two set of clusters obtained from the all-vs-all
searches.
The work of Remm et. al. describes nine different approaches for determining sequence
homology within a species [Remm 00]. If this approach is successful at expanding the
number of sequences homologies found for a given set of sequences, perhaps it will
provide an additional approach that researchers can utilize for finding gene families.
- 12 -
Quite recently, researchers utilized predicted ancestral sequences to describe the probable
evolution of hormone-receptors. Their work demonstrates that improvements in
algorithms for predicting ancestral sequences and the supporting data matrices available
for these algorithms make the use of ancestral sequences in analysis a reasonable
approach [Brid 06].
- 13 -
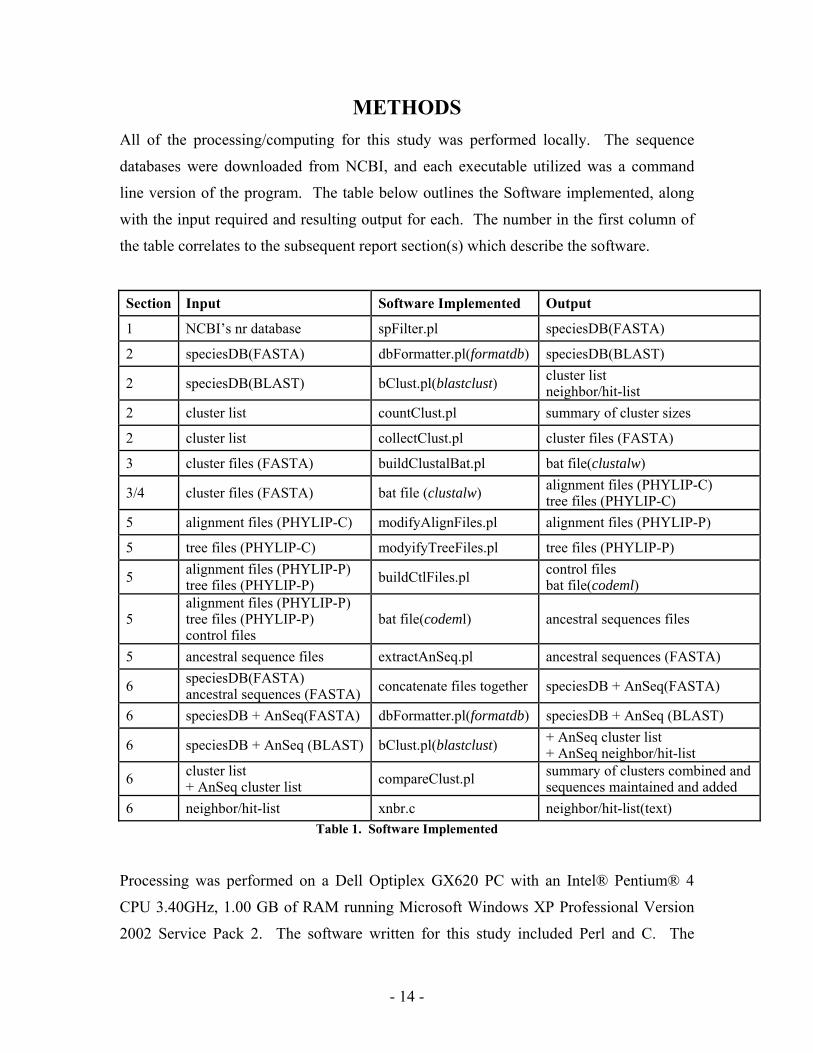
METHODS All of the processing/computing for this study was performed locally. The sequence
databases were downloaded from NCBI, and each executable utilized was a command
line version of the program. The table below outlines the Software implemented, along
with the input required and resulting output for each. The number in the first column of
the table correlates to the subsequent report section(s) which describe the software.
Section Input Software Implemented Output
1 NCBI’s nr database spFilter.pl speciesDB(FASTA)
2 speciesDB(FASTA) dbFormatter.pl(formatdb) speciesDB(BLAST)
2 speciesDB(BLAST) bClust.pl(blastclust) cluster list neighbor/hit-list
2 cluster list countClust.pl summary of cluster sizes
2 cluster list collectClust.pl cluster files (FASTA)
3 cluster files (FASTA) buildClustalBat.pl bat file(clustalw)
3/4 cluster files (FASTA) bat file (clustalw) alignment files (PHYLIP-C) tree files (PHYLIP-C)
5 alignment files (PHYLIP-C) modifyAlignFiles.pl alignment files (PHYLIP-P)
5 tree files (PHYLIP-C) modyifyTreeFiles.pl tree files (PHYLIP-P)
5 alignment files (PHYLIP-P) tree files (PHYLIP-P) buildCtlFiles.pl control files
bat file(codeml)
5 alignment files (PHYLIP-P) tree files (PHYLIP-P) control files
bat file(codeml) ancestral sequences files
5 ancestral sequence files extractAnSeq.pl ancestral sequences (FASTA)
6 speciesDB(FASTA) ancestral sequences (FASTA) concatenate files together speciesDB + AnSeq(FASTA)
6 speciesDB + AnSeq(FASTA) dbFormatter.pl(formatdb) speciesDB + AnSeq (BLAST)
6 speciesDB + AnSeq (BLAST) bClust.pl(blastclust) + AnSeq cluster list + AnSeq neighbor/hit-list
6 cluster list + AnSeq cluster list compareClust.pl summary of clusters combined and
sequences maintained and added 6 neighbor/hit-list xnbr.c neighbor/hit-list(text)
Table 1. Software Implemented Processing was performed on a Dell Optiplex GX620 PC with an Intel® Pentium® 4
CPU 3.40GHz, 1.00 GB of RAM running Microsoft Windows XP Professional Version
2002 Service Pack 2. The software written for this study included Perl and C. The
- 14 -
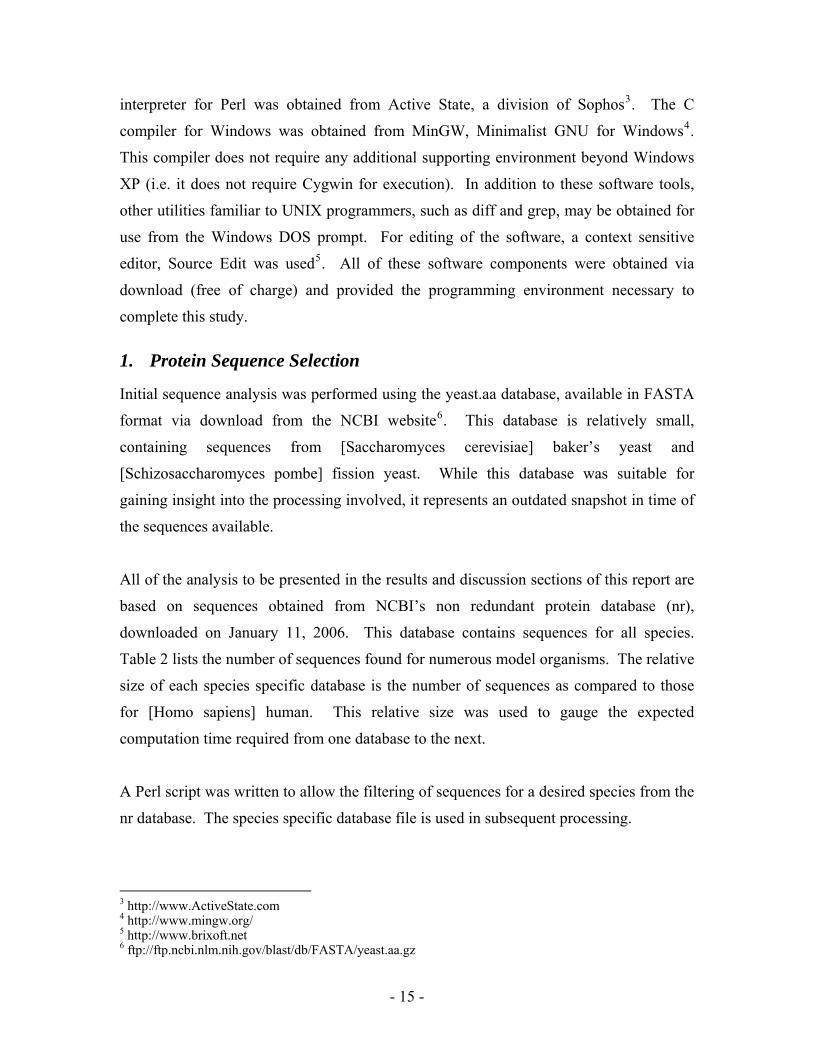
interpreter for Perl was obtained from Active State, a division of Sophos3. The C
compiler for Windows was obtained from MinGW, Minimalist GNU for Windows4.
This compiler does not require any additional supporting environment beyond Windows
XP (i.e. it does not require Cygwin for execution). In addition to these software tools,
other utilities familiar to UNIX programmers, such as diff and grep, may be obtained for
use from the Windows DOS prompt. For editing of the software, a context sensitive
editor, Source Edit was used5. All of these software components were obtained via
download (free of charge) and provided the programming environment necessary to
complete this study.
1. Protein Sequence Selection
Initial sequence analysis was performed using the yeast.aa database, available in FASTA
format via download from the NCBI website6. This database is relatively small,
containing sequences from [Saccharomyces cerevisiae] baker’s yeast and
[Schizosaccharomyces pombe] fission yeast. While this database was suitable for
gaining insight into the processing involved, it represents an outdated snapshot in time of
the sequences available.
All of the analysis to be presented in the results and discussion sections of this report are
based on sequences obtained from NCBI’s non redundant protein database (nr),
downloaded on January 11, 2006. This database contains sequences for all species.
Table 2 lists the number of sequences found for numerous model organisms. The relative
size of each species specific database is the number of sequences as compared to those
for [Homo sapiens] human. This relative size was used to gauge the expected
computation time required from one database to the next.
A Perl script was written to allow the filtering of sequences for a desired species from the
nr database. The species specific database file is used in subsequent processing.
3 http://www.ActiveState.com 4 http://www.mingw.org/ 5 http://www.brixoft.net 6 ftp://ftp.ncbi.nlm.nih.gov/blast/db/FASTA/yeast.aa.gz
- 15 -
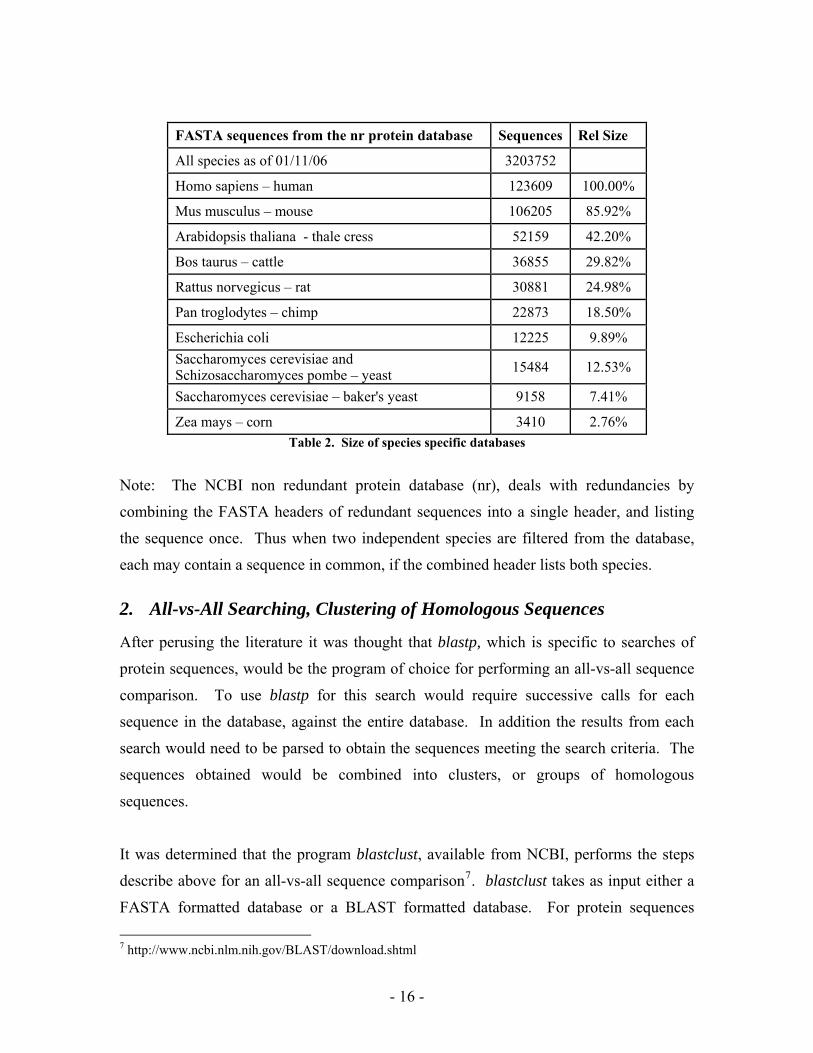
FASTA sequences from the nr protein database Sequences Rel Size
All species as of 01/11/06 3203752
Homo sapiens – human 123609 100.00%
Mus musculus – mouse 106205 85.92%
Arabidopsis thaliana - thale cress 52159 42.20%
Bos taurus – cattle 36855 29.82%
Rattus norvegicus – rat 30881 24.98%
Pan troglodytes – chimp 22873 18.50%
Escherichia coli 12225 9.89% Saccharomyces cerevisiae and Schizosaccharomyces pombe – yeast 15484 12.53%
Saccharomyces cerevisiae – baker's yeast 9158 7.41%
Zea mays – corn 3410 2.76% Table 2. Size of species specific databases
Note: The NCBI non redundant protein database (nr), deals with redundancies by
combining the FASTA headers of redundant sequences into a single header, and listing
the sequence once. Thus when two independent species are filtered from the database,
each may contain a sequence in common, if the combined header lists both species.
2. All-vs-All Searching, Clustering of Homologous Sequences
After perusing the literature it was thought that blastp, which is specific to searches of
protein sequences, would be the program of choice for performing an all-vs-all sequence
comparison. To use blastp for this search would require successive calls for each
sequence in the database, against the entire database. In addition the results from each
search would need to be parsed to obtain the sequences meeting the search criteria. The
sequences obtained would be combined into clusters, or groups of homologous
sequences.
It was determined that the program blastclust, available from NCBI, performs the steps
describe above for an all-vs-all sequence comparison7. blastclust takes as input either a
FASTA formatted database or a BLAST formatted database. For protein sequences
7 http://www.ncbi.nlm.nih.gov/BLAST/download.shtml
- 16 -
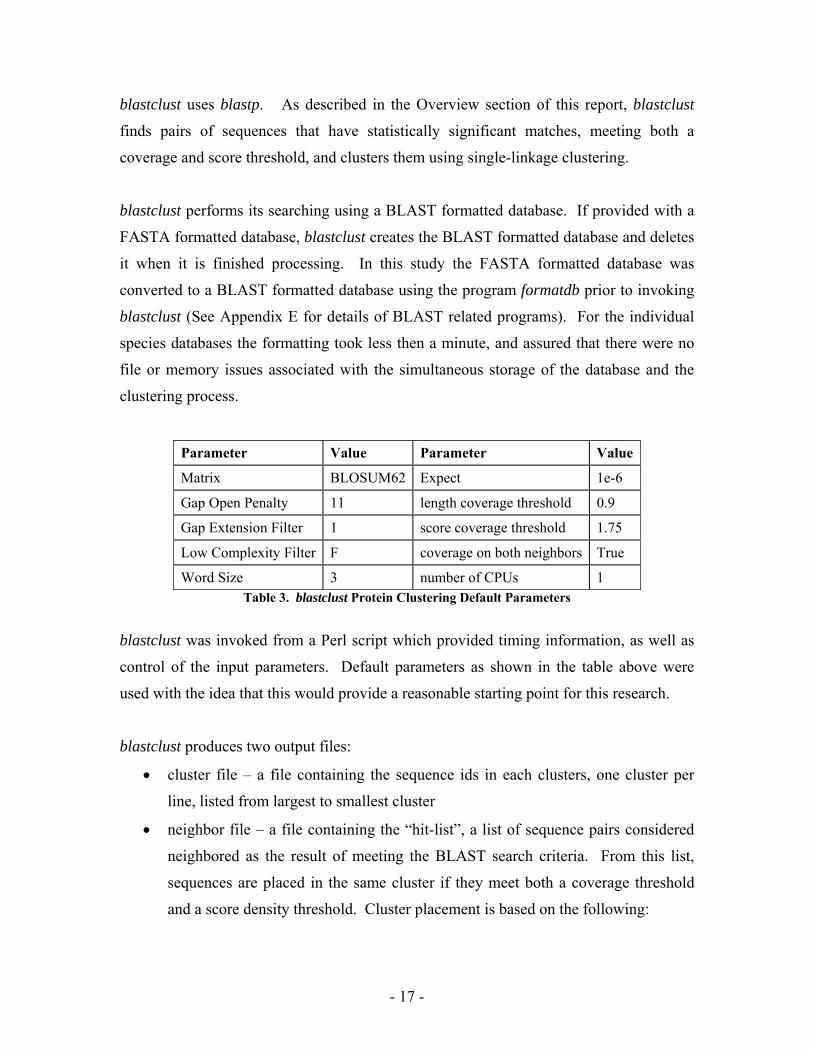
blastclust uses blastp. As described in the Overview section of this report, blastclust
finds pairs of sequences that have statistically significant matches, meeting both a
coverage and score threshold, and clusters them using single-linkage clustering.
blastclust performs its searching using a BLAST formatted database. If provided with a
FASTA formatted database, blastclust creates the BLAST formatted database and deletes
it when it is finished processing. In this study the FASTA formatted database was
converted to a BLAST formatted database using the program formatdb prior to invoking
blastclust (See Appendix E for details of BLAST related programs). For the individual
species databases the formatting took less then a minute, and assured that there were no
file or memory issues associated with the simultaneous storage of the database and the
clustering process.
Parameter Value Parameter Value
Matrix BLOSUM62 Expect 1e-6
Gap Open Penalty 11 length coverage threshold 0.9
Gap Extension Filter 1 score coverage threshold 1.75
Low Complexity Filter F coverage on both neighbors True
Word Size 3 number of CPUs 1 Table 3. blastclust Protein Clustering Default Parameters
blastclust was invoked from a Perl script which provided timing information, as well as
control of the input parameters. Default parameters as shown in the table above were
used with the idea that this would provide a reasonable starting point for this research.
blastclust produces two output files:
• cluster file – a file containing the sequence ids in each clusters, one cluster per
line, listed from largest to smallest cluster
• neighbor file – a file containing the “hit-list”, a list of sequence pairs considered
neighbored as the result of meeting the BLAST search criteria. From this list,
sequences are placed in the same cluster if they meet both a coverage threshold
and a score density threshold. Cluster placement is based on the following:
- 17 -
• the sequence IDs of the pair
• the hsp lengths of each sequence with respect to the other, this is the length
of each sequence that is encompassed in the top-scoring local alignment of
the pair
• the bit score from blastp
• the percent identity
The coverage of a sequence is: hsp length / sequence length. If the input
parameters specify that both sequences must meet the coverage threshold, the
minimum of the coverage values for the sequence pair is compared to the
threshold value, otherwise the maximum coverage value is used. The scoring
density, which is compared to a threshold, is: BLAST score / minimum hsp
length.
By storing a “hit-list” of this nature, the program allows the determination of
single-linkages (clustering) to be recomputed for a change in the scoring and
coverage thresholds, without regenerating all of the blast scores for the database.
To get a perspective on the scope of this file, rat data base of 30881 sequences,
generates the following:
1,754,576 sequence pairs in the hit-list
16,175 sequence pairs satisfy that the default criteria for clustering
7,842 sequences are included in 2869 clusters of size 2 or more.
The blastclust cluster file provides the clusters/families of homologous sequences needed
as input to the alignment step of this study. A Perl script was written to extract clusters
from this file and create individual FASTA formatted sequence files representing each
cluster. Each cluster is used to generate phylogenetic trees and ancestral sequences. The
number of ancestral sequences for a given phylogenetic tree is always two less than the
number of starting sequences. In this study clusters of size six and larger were utilized in
subsequent processing, thus assuring the construction of phylogenetic trees with multiple
generations of ancestral sequences.
- 18 -
3. Sequence Alignment
CLUSTAL is among the most widely used software packages for multiple sequence
alignment [Thom 94]. CLUSTAL like most software has been revised and improved
over the years it has been in use. Current versions of CLUSTAL use improved data
matrices, providing a better representation of evolutionary change, and alternation
between a series of matrices during the progressive multiple sequence alignment [Thom
94]. In recent years, Clustal X, a graphical version, and Clustal W, a web-based version
of CLUSTAL have gained in popularity [Jean98]. Each has extensive “help” pages
available with its graphical user interface.
This study utilized a command line version CLUSTAL, clustalw8. This program was
downloaded from the same web page that allows access to the web based version of the
program. There was some difficultly associated with getting the command line version of
this tool, to perform the desired set of computations. The program runs smoothly once
the appropriate calls to it are determined. However, the documentation for the command
line version is not well maintained, and one must wade through the “readme” files
associated with multiple releases, to find the appropriate command line options to the
program.
As with blastclust, the intent is to start by using default parameters for clustalw. The
default values used by clustalw to perform the alignment are listed in Appendix A,
section 3. For this study, the options entered on the command line did not affect the
alignment; they were used to request the output format of the alignment provided by
clustalw.
The requirements for the alignment format were driven by the input format required for
the subsequent processing steps. These steps are the phylogenetic tree construction and
the prediction of ancestral sequences. It was determined that clustalw would be used for
the phylogenetic tree construction and PAML [Yang 97] would be used for the
prediction/reconstruction of ancestral sequences. Each program requires a different
format for the alignment. For clustalw, the alignment has to be maintained as an “.aln” 8 ftp://ftp.ebi.ac.uk/pub/software/dos/clustalw/
- 19 -
file. For PAML, the alignment is needed in PHYLIP format, for which clustalw produces
a “.phy” file.
Note: The documentation for CLUSTAL hints at restrictions to the length of each
sequence name, provided in the FASTA formatted input file. The “sequence” name is
extracted from the header line of the FASTA record. NCBI concatenates multiple
headers into one, to eliminate redundancies in the nr database. It was found that clustalw
could not handle these long headers. Something in them was being translated incorrectly,
and clustalw tries to include the header information as part of the alignment. To
eliminate sequence name problems with clustalw and subsequently, PAML, the headers
in the FASTA sequence files were stripped down to “>gxxx”, where xxx is the sequence
ID of up to 8 digits. The “g” instead of “gi” is just enough to make the sequence ID non-
numeric, which was found to be a requirement for the tree file.
4. Construction of Phylogenetic Trees
To reconstruct the ancestral sequences for a cluster of homologous sequences, we need a
phylogenetic tree depicting the relationship between the sequences. The decision was
made to use the neighbor-joining method for construction of the phylogenetic trees, as
this method is faster than parsimony and likelihood methods. The program of choice for
predicting the ancestral sequences, PAML, was not designed for tree building [Yang 95]
[Yang 97]. clustalw was chosen for the construction the phylogenetic trees, as clustalw is
capable tree construction via neighbor-joining, and the input and output requirements of
clustalw had already been determined in conjunction with sequence alignment.
An attempt was made to write a Perl script, containing the necessary calls to clustalw.
For some undetermined reason, the call to clustalw could not be invoked from a system( )
call within Perl. To get around this, and to accommodate the fact that clustalw must be
called numerous times per sequence cluster, a Perl script was written which scans the test
directory for alignment and tree files, and builds a batch file containing calls to clustalw.
The details of the Perl script and batch file can be found in Appendices B and C of this
document.
- 20 -
5. Prediction of Ancestral Sequences
PAML, Phylogenetic Analysis by Maximum Likelihood, is a programming package that
contains numerous programs [Yang 94, 95, 97]. The program which reconstructs or
predicts ancestral sequences is entitled codeml. PAML programs read their execution
parameters from a control file, thus there are no “default” parameters per se. The PAML
package comes with a suite of examples, reflecting a variety of species, and DNA versus
protein analyses 9[Yang 1997]. The advice of the PAML User’s Guide is to experiment
with the parameters to determine the correct settings for your application10.
PAML relies on amino acid mutation rate matrices, which have been derived from prior
experimentation, to deduce the likelihood or probability of each possible mutation [Jone
92] [Kosi 5]. These matrices have been improved over time, as more data has
accumulated [Kosi 05]. The rate matrix utilized by codeml is one of the many parameters
defined in its control file. In a recent paper by Kosiol et. al., the performance of
numerous mutation rate matrices was evaluated [Kosi 05]. The rate matrix chosen for
use in this study is based on their recommendation. See Appendix D for the details of the
control file, the mutation rate matrix is denoted by “aaRateFile = jones-dcmut.dat”.
codeml requires an alignment file and a tree file for each ancestral reconstruction. The
PAML User’s Guide indicates that PHYLIP format would be accepted for both of these
files, and thus that is the format that was specified for clustalw output. However, the
CLUSTAL and PAML interpretations of PHYLIP format are not quite the same. In
Table 1, these formats are referred to a PHYLIP-C and PHYLIP-P for PHYLIP
CLUSTAL and PHYLIP PAML respectively. Perl scripts were written to modify both
the alignment files and tree files in between the execution of clustalw and codeml. In
addition, it was found that CLUSTAL will align characters beyond the base 20 amino
acids, which PAML cannot handle. As a result, the Perl script which modifies the
alignment file must search for B, X, and Z within each sequence and change these
characters to “?”. If these characters are changed before the alignment, then the
9 http://abacus.gene.ucl.ac.uk/software/paml.html 10 http://abacus.gene.ucl.ac.uk/software/pamlDOC.pdf
- 21 -
alignment itself may be modified, and thus the characters that are ambiguous to codeml
are removed just prior to executing codeml.
To transition from the alignment and tree files created by clustalw to the files containing
reconstructed ancestral sequence created by codeml, three Perl scripts and a batch file are
required: 1) a Perl script to modify all alignment files, 2) a Perl script to modify all tree
files, 3) a Perl script to build a control file for each alignment and tree file pair, and 4) a
batch file to call codeml with each control file.
The output from codeml includes numerous files. The only file saved and utilized was
the “.rst” file. This file contains the ancestral sequences. The unique ancestral sequences
are extracted from the “.rst” files and converted to FASTA format. The FASTA
formatted records are concatenated to the end of the species database.
Note: The ancestral sequences must be given unique identifiers, such that we can trace
them back to the cluster from which they were derived. In addition, they must be
distinguishable from the sequences obtained from NCBI. Thus far I have been able to
create an identifier starting with “9999” plus a sequential count of the ancestral
sequences, without exceeding 8 digits.
6. All-vs-All Searching, Clustering with Ancestral Sequences
At this point we have an extended species database. It contains all of the original
sequences and the unique ancestral sequences created from all clusters of six or more
sequences. Calls are made to formatdb to build a new BLAST database, followed by
blastclust to generate a new set of clusters from this extended database. As with the
original species database, clusters of size 6 or more sequences are extracted into
individual FASTA files.
Analysis of our results is based on the output provided by the two executions of
blastclust. This includes the cluster files, the neighbor/hit-list files, and all of the FASTA
files representing the individual clusters of sequences (with and without ancestral
sequences).
- 22 -
RESULTS
1. Performance/Timing
The time required to process the protein sequences for a particular species or group of
species varies tremendously with the size of sequence database being processed. The
smallest species database processed was that of corn [Zea mays], with 3410 sequences.
The largest species database processed included both mouse [Mus musculus] and rat
[Rattus norvegicus], for a total of 136,403 distinct sequences. The time required to
process the corn database, from the collection of the sequences through the comparison of
the output from two calls to blastclust, took a little more than an hour (refer to table 1. in
the Methods section for the processing steps). The same processing steps for the
combined rat and mouse database takes more than a week; the initial call to blastclust
taking more than 4 days.
The timing of the individual steps will be presented, as it is important to understand
where the limitations lie, when considering future work with respect to this study. For
the databases tested to date, the steps marked with (*) may consume hours, and steps
marked with (**) may consume days. The step marked (***) was terminated after being
allowed to run for hours on a single cluster.
1.1 Acquisition of NCBI Non-redundant Protein Data base (nr)
This database is downloaded in compressed format. The time required to download this
database took 1-2hrs, depending on network conditions at the time. Once this database is
downloaded and uncompressed, the remainder of the processing can be done locally.
1.2 Obtaining a “Species” Specific Protein Database
Using the local copy of the nr database and the Perl script spFilter.pl, it takes
approximately 2 minutes to complete this process. This database is still in FASTA
format.
1.3 Obtaining a BLAST formatted “Species” Specific Protein Database
Using the database file created in the previous step, and the Perl script dbFormatter.pl, it
- 23 -
takes approximately 1 minute to complete this step. The smallest database took
approximately 2 seconds. The largest database took approximately 1 minute.
1.4 Clustering the Sequences**
Clustering via blastclust is one of the steps for which processing time increases
dramatically with the number of sequences in the database. In addition, running
blastclust is an all or nothing process. If the clustering does not complete, there is no file
of clusters with which to work. The initial database for corn was processed in
approximately 2 minutes while the initial database for combined rat/mouse took between
4 and 5 days.
1.5 Collecting the clusters*
blastclust provides cluster information by sequence ID. For the remainder of the
processing steps, the clusters must be represented by FASTA formatted sequences. A
pass is made through the species database file for each cluster, collecting just the
sequences needed for that cluster. When the database and the number of clusters were
small, the Perl script used to collect the sequences did not need to be efficient, and still
completed in a few seconds. As the size of the species database being tested was
increased, and the number of clusters being collected increased, this step took much
longer (hours).
The Perl script collectClust.pl was modified to use a hash when processing each cluster,
this reduced the processing time by at least a factor of 4. This step took 8 seconds for the
corn database, which contained 53 clusters of size 6 or larger. However, for the
combined rat/mouse database, which generated 1815 clusters of size 6 or larger, this step
took 2 hours 17 minutes.
Based on the results found in this step, the hashes were also implemented when
comparing cluster information between calls to blastclust.
1.6 Alignment and Tree Building per cluster*
This step includes all of the calls to clustalw and produces both an alignment and a
phylogenetic tree for each cluster of sequences. The 53 clusters for the corn database
- 24 -
were processed in 9 minutes, while the 1815 clusters for the combine rat/mouse database
required 3 hours and 38 minutes to process.
The building of the batch files to call clustalw and codeml, and modifications to the
alignment and tree files in between the calls to clustalw and codeml, each took 1-2
minutes. Thus, these intermediate file manipulations to not contribute significantly to the
overall timing of the process.
1.7 Ancestral sequence Reconstruction per cluster***
The cluster sizes produced per database vary dramatically. The larger databases may
have numerous clusters with hundreds of sequences. The corn database had 53 clusters
ranging for 6 to 48 sequences. Reconstructing ancestral sequences for all of these took
29 minutes. The largest cluster for the rat database was 195 sequences, while the mouse
and human databases each had clusters with more than 1000 sequences. No attempt was
made to compute these enormous clusters. The largest cluster for which ancestral
sequences has been computed as part of this study is 406 sequences.
For the biggest databases; mouse, human and combinations including them, computing of
ancestral sequences has been halted after 3 days. We have computed ancestral sequences
starting with the smallest clusters (size 6) first, and have halted processing when it
appears that the algorithm is not converging for a large cluster.
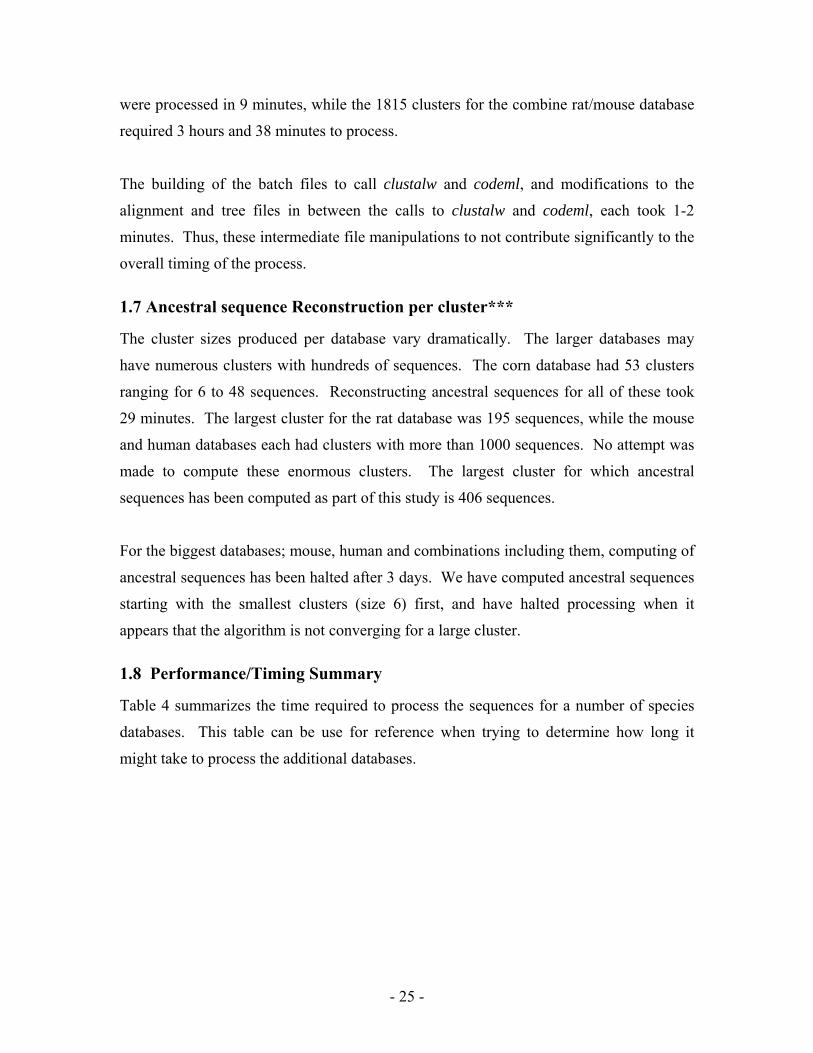
1.8 Performance/Timing Summary
Table 4 summarizes the time required to process the sequences for a number of species
databases. This table can be use for reference when trying to determine how long it
might take to process the additional databases.
- 25 -
Species Database
(nr 1/11/06)
FASTA recs
Execution of
formatdb
Execution of blastclust
Execution of
clustalw
Execution of PAML /
codeml
Ancestral Seq.
Execution of blastclust
rodents 136403 <2m 4d 8h 2m 59s 3hr 38m >4 d incomplete 7375 4d 15h 1m 3s
human 123609 46 s 3d 1h 21m 41s 3h 45m >3 d incomplete 5822 3d 10h 35m 14s
mouse 106205 41 s 2d 7h 54m 58s 1h 27m >3d incomplete 4569 2d 14h 18m 17s
thale cress 52159 22 s 10h 5m 22s <5m 9m 520 10h 00m 21s rat 30881 10 s 6h 22m 17s <5m 2h 57m 784 6h 39m 28s
chimp 22873 6 s 3h 47m 18s yeast 15484 8 s 1h 24m 39s <5m 4m 101 1h 25m 50s
baker's yeast 9158 6 s 38m 23s corn 3410 1 s 2m 06s <5 9m 157 2m 21s
Table 4. Time required per species database
In Table 4 above and the sections and Tables to follow, the species databases will be
denoted as follows:
rodents = Mus musculus and Rattus norvegicus
human = Homo sapiens
mouse = Mus musculus
thale cress = Arabidopsis thaliana
rat = Rattus norvegicus
chimp = Pan troglodytes
yeast = Saccharomyces cerevisiae and Schizosaccharomyces pombe
byeast = baker's yeast = Saccharomyces cerevisiae
corn = Zea mays
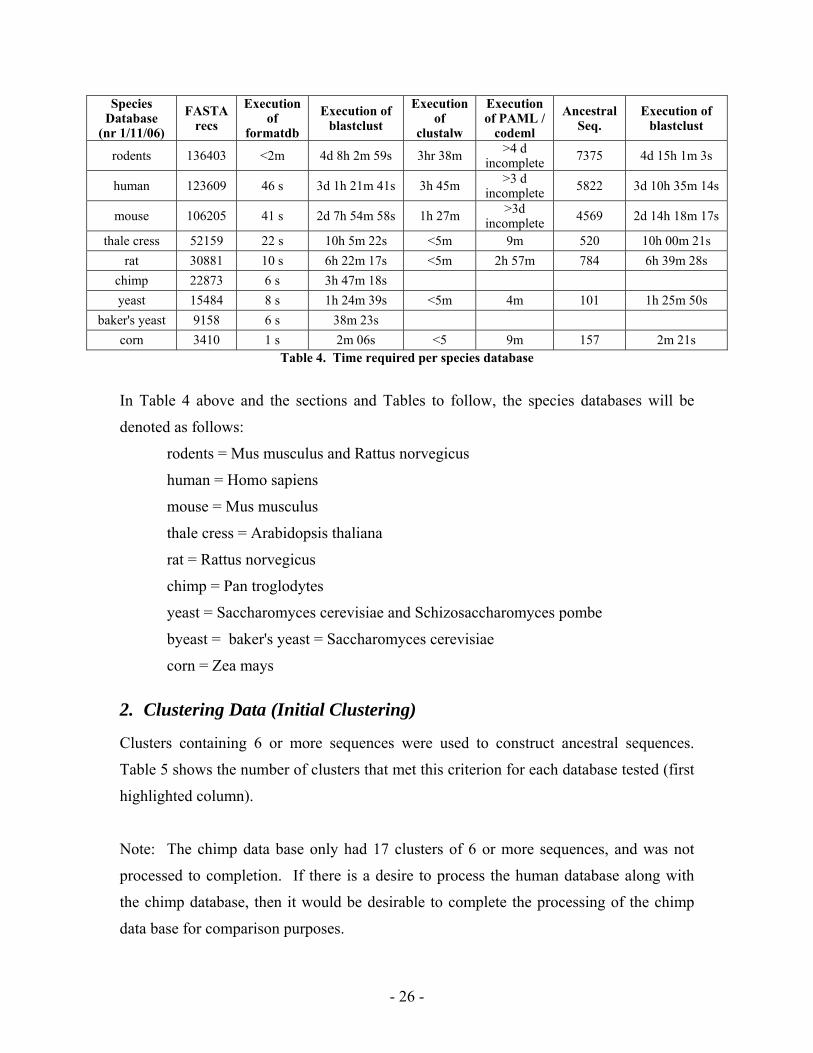
2. Clustering Data (Initial Clustering)
Clusters containing 6 or more sequences were used to construct ancestral sequences.
Table 5 shows the number of clusters that met this criterion for each database tested (first
highlighted column).
Note: The chimp data base only had 17 clusters of 6 or more sequences, and was not
processed to completion. If there is a desire to process the human database along with
the chimp database, then it would be desirable to complete the processing of the chimp
data base for comparison purposes.
- 26 -
Species Database
FASTA recs
Clusters size ≥ 2
Clusters size ≥ 6
Largest cluster
Largest cluster
processed Seq.
processed Avg. # Seq. /
cluster rodents 136403 20404 1815 4051 404 23314 13
human 123609 16584 1050 3210 406 28103 27
mouse 106205 15727 951 4049 402 15958 17
thale cress 52159 9935 183 38 38 1513 8
rat 30881 2869 112 195 195 1346 12
chimp 22873 300 17 92 NA NA NA
yeast 15484 1569 34 34 34 319 9
byeast 9158 1177 33 34 34 313 9
corn 3410 413 53 48 48 672 13 Table 5. Initial Clusters per species database
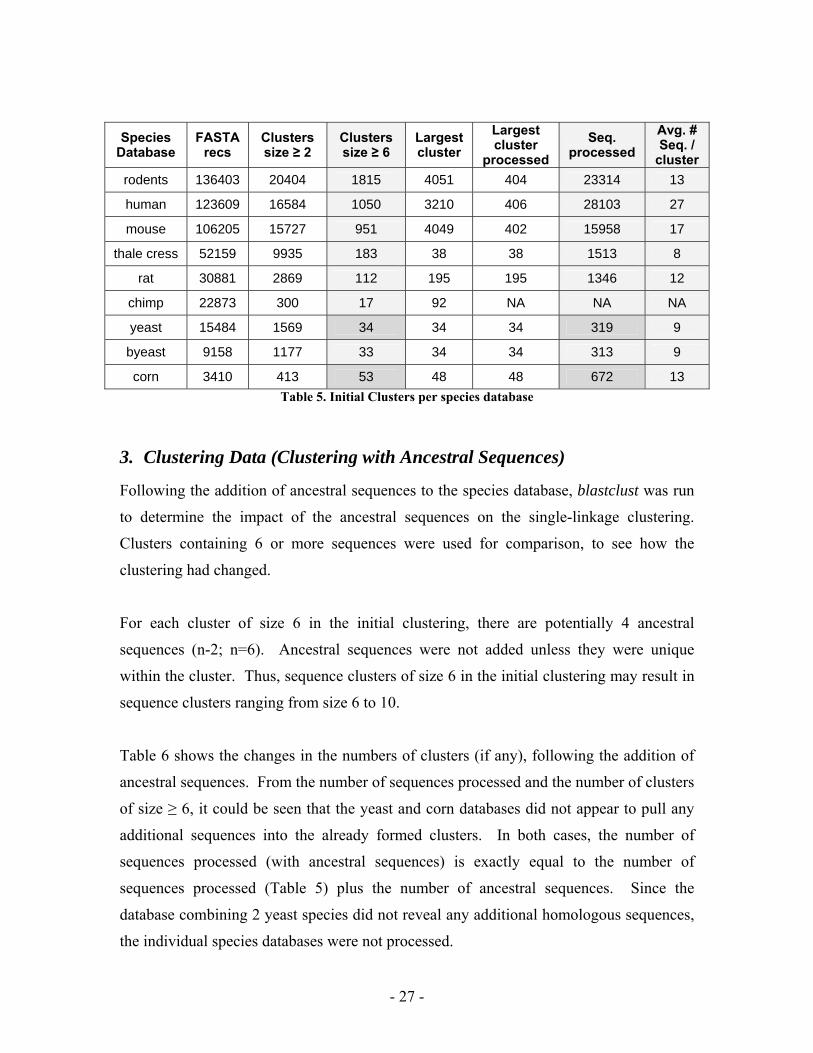
3. Clustering Data (Clustering with Ancestral Sequences)
Following the addition of ancestral sequences to the species database, blastclust was run
to determine the impact of the ancestral sequences on the single-linkage clustering.
Clusters containing 6 or more sequences were used for comparison, to see how the
clustering had changed.
For each cluster of size 6 in the initial clustering, there are potentially 4 ancestral
sequences (n-2; n=6). Ancestral sequences were not added unless they were unique
within the cluster. Thus, sequence clusters of size 6 in the initial clustering may result in
sequence clusters ranging from size 6 to 10.
Table 6 shows the changes in the numbers of clusters (if any), following the addition of
ancestral sequences. From the number of sequences processed and the number of clusters
of size ≥ 6, it could be seen that the yeast and corn databases did not appear to pull any
additional sequences into the already formed clusters. In both cases, the number of
sequences processed (with ancestral sequences) is exactly equal to the number of
sequences processed (Table 5) plus the number of ancestral sequences. Since the
database combining 2 yeast species did not reveal any additional homologous sequences,
the individual species databases were not processed.
- 27 -
The remaining databases (human. mouse, rat, and thale cress) appear to have pulled in
additional sequences and have differing numbers of clusters between the two single-
linkage clusterings. A more detailed comparison is needed to understand the impact of
the ancestral sequences.
Species Database
Ancestral Seq.
added Clusters size ≥ 2
Clusters size ≥ 6
Largest
cluster Seq.
processed Avg. # Seq. /
cluster rodents 7375 20373 1815 4051 30805 17
human 5822 16576 1051 3210 33974 32
mouse 4569 15718 956 4049 20592 22
thale cress 520 9933 183 75 2040 11
rat 784 2863 110 403 2147 20
yeast 101 1569 34 60 420 12
corn 157 413 53 52 829 16 Table 6. Clustering with Ancestral Sequences
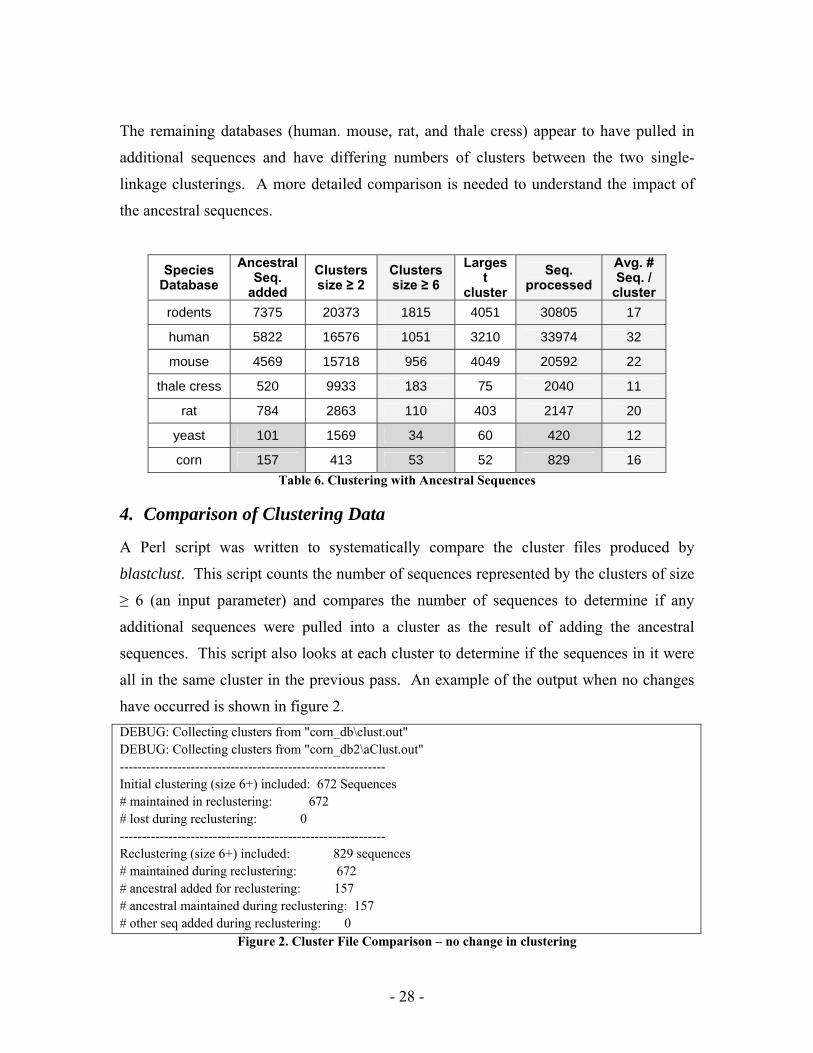
4. Comparison of Clustering Data
A Perl script was written to systematically compare the cluster files produced by
blastclust. This script counts the number of sequences represented by the clusters of size
≥ 6 (an input parameter) and compares the number of sequences to determine if any
additional sequences were pulled into a cluster as the result of adding the ancestral
sequences. This script also looks at each cluster to determine if the sequences in it were
all in the same cluster in the previous pass. An example of the output when no changes
have occurred is shown in figure 2. DEBUG: Collecting clusters from "corn_db\clust.out" DEBUG: Collecting clusters from "corn_db2\aClust.out" ------------------------------------------------------------ Initial clustering (size 6+) included: 672 Sequences # maintained in reclustering: 672 # lost during reclustering: 0 ------------------------------------------------------------ Reclustering (size 6+) included: 829 sequences # maintained during reclustering: 672 # ancestral added for reclustering: 157 # ancestral maintained during reclustering: 157 # other seq added during reclustering: 0
Figure 2. Cluster File Comparison – no change in clustering
- 28 -
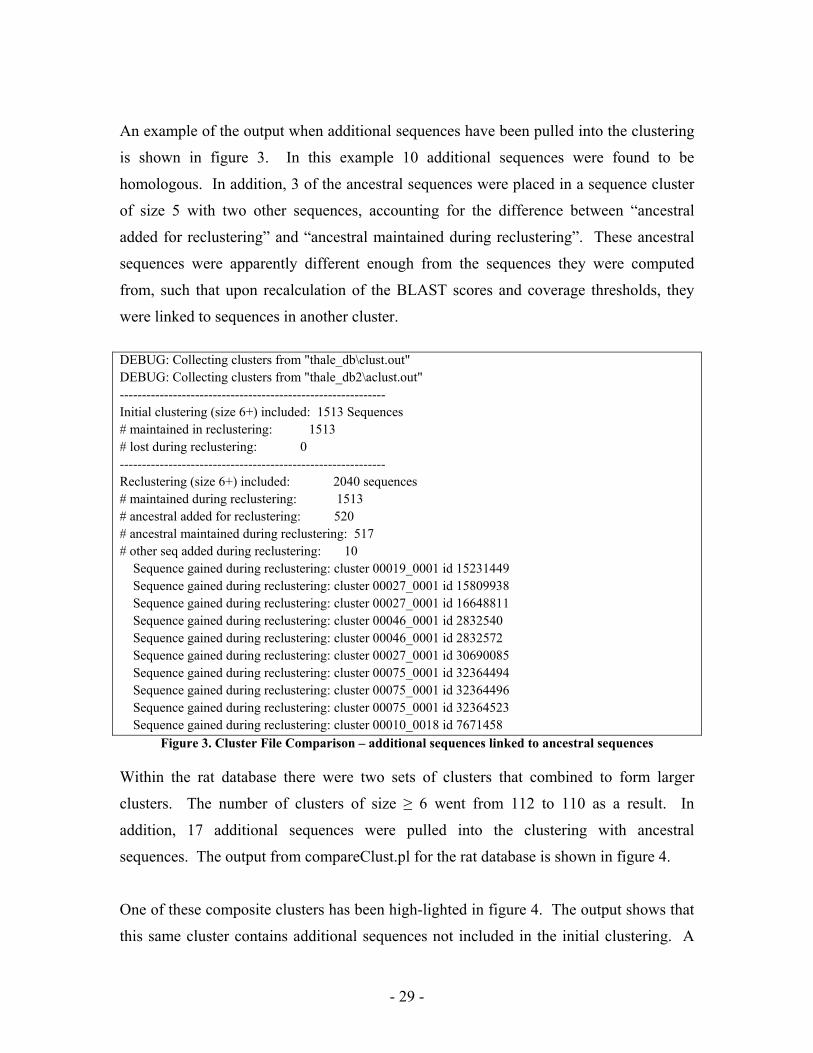
An example of the output when additional sequences have been pulled into the clustering
is shown in figure 3. In this example 10 additional sequences were found to be
homologous. In addition, 3 of the ancestral sequences were placed in a sequence cluster
of size 5 with two other sequences, accounting for the difference between “ancestral
added for reclustering” and “ancestral maintained during reclustering”. These ancestral
sequences were apparently different enough from the sequences they were computed
from, such that upon recalculation of the BLAST scores and coverage thresholds, they
were linked to sequences in another cluster.
DEBUG: Collecting clusters from "thale_db\clust.out" DEBUG: Collecting clusters from "thale_db2\aclust.out" ------------------------------------------------------------ Initial clustering (size 6+) included: 1513 Sequences # maintained in reclustering: 1513 # lost during reclustering: 0 ------------------------------------------------------------ Reclustering (size 6+) included: 2040 sequences # maintained during reclustering: 1513 # ancestral added for reclustering: 520 # ancestral maintained during reclustering: 517 # other seq added during reclustering: 10 Sequence gained during reclustering: cluster 00019_0001 id 15231449 Sequence gained during reclustering: cluster 00027_0001 id 15809938 Sequence gained during reclustering: cluster 00027_0001 id 16648811 Sequence gained during reclustering: cluster 00046_0001 id 2832540 Sequence gained during reclustering: cluster 00046_0001 id 2832572 Sequence gained during reclustering: cluster 00027_0001 id 30690085 Sequence gained during reclustering: cluster 00075_0001 id 32364494 Sequence gained during reclustering: cluster 00075_0001 id 32364496 Sequence gained during reclustering: cluster 00075_0001 id 32364523 Sequence gained during reclustering: cluster 00010_0018 id 7671458
Figure 3. Cluster File Comparison – additional sequences linked to ancestral sequences Within the rat database there were two sets of clusters that combined to form larger
clusters. The number of clusters of size ≥ 6 went from 112 to 110 as a result. In
addition, 17 additional sequences were pulled into the clustering with ancestral
sequences. The output from compareClust.pl for the rat database is shown in figure 4.
One of these composite clusters has been high-lighted in figure 4. The output shows that
this same cluster contains additional sequences not included in the initial clustering. A
- 29 -
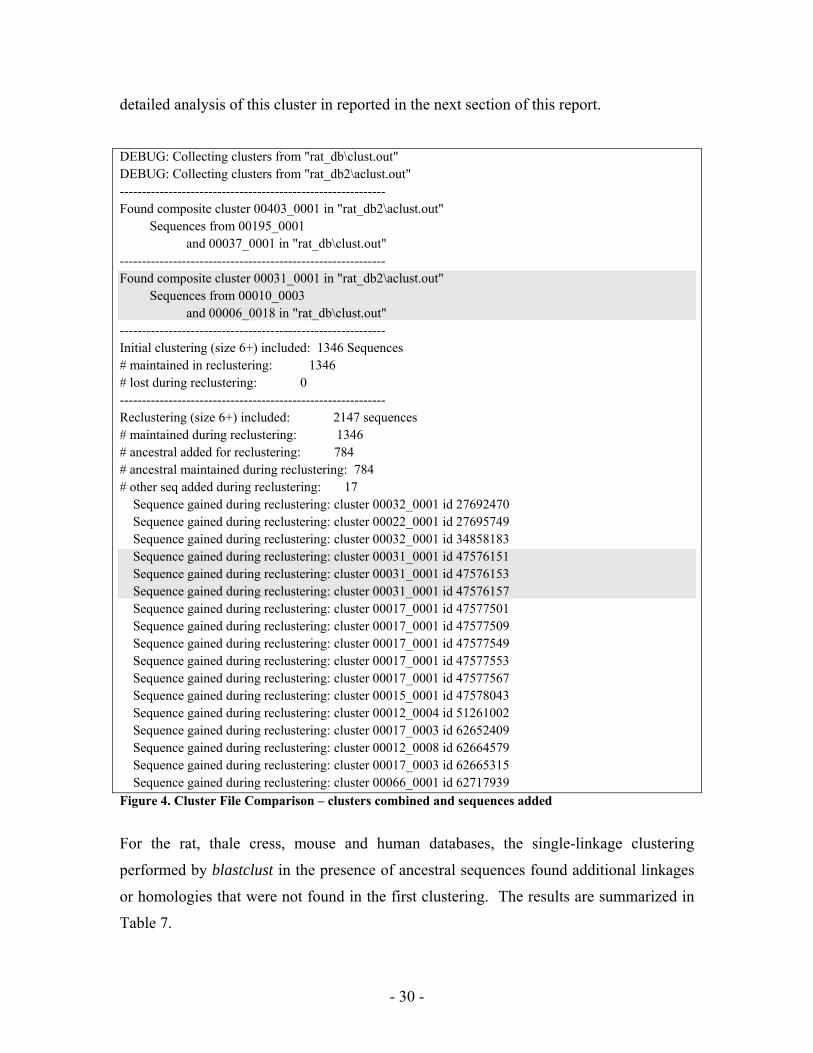
detailed analysis of this cluster in reported in the next section of this report.
DEBUG: Collecting clusters from "rat_db\clust.out" DEBUG: Collecting clusters from "rat_db2\aclust.out" ------------------------------------------------------------ Found composite cluster 00403_0001 in "rat_db2\aclust.out" Sequences from 00195_0001 and 00037_0001 in "rat_db\clust.out" ------------------------------------------------------------ Found composite cluster 00031_0001 in "rat_db2\aclust.out" Sequences from 00010_0003 and 00006_0018 in "rat_db\clust.out" ------------------------------------------------------------ Initial clustering (size 6+) included: 1346 Sequences # maintained in reclustering: 1346 # lost during reclustering: 0 ------------------------------------------------------------ Reclustering (size 6+) included: 2147 sequences # maintained during reclustering: 1346 # ancestral added for reclustering: 784 # ancestral maintained during reclustering: 784 # other seq added during reclustering: 17 Sequence gained during reclustering: cluster 00032_0001 id 27692470 Sequence gained during reclustering: cluster 00022_0001 id 27695749 Sequence gained during reclustering: cluster 00032_0001 id 34858183 Sequence gained during reclustering: cluster 00031_0001 id 47576151 Sequence gained during reclustering: cluster 00031_0001 id 47576153 Sequence gained during reclustering: cluster 00031_0001 id 47576157 Sequence gained during reclustering: cluster 00017_0001 id 47577501 Sequence gained during reclustering: cluster 00017_0001 id 47577509 Sequence gained during reclustering: cluster 00017_0001 id 47577549 Sequence gained during reclustering: cluster 00017_0001 id 47577553 Sequence gained during reclustering: cluster 00017_0001 id 47577567 Sequence gained during reclustering: cluster 00015_0001 id 47578043 Sequence gained during reclustering: cluster 00012_0004 id 51261002 Sequence gained during reclustering: cluster 00017_0003 id 62652409 Sequence gained during reclustering: cluster 00012_0008 id 62664579 Sequence gained during reclustering: cluster 00017_0003 id 62665315 Sequence gained during reclustering: cluster 00066_0001 id 62717939 Figure 4. Cluster File Comparison – clusters combined and sequences added
For the rat, thale cress, mouse and human databases, the single-linkage clustering
performed by blastclust in the presence of ancestral sequences found additional linkages
or homologies that were not found in the first clustering. The results are summarized in
Table 7.
- 30 -
Species Database
Ancestral Sequences
added
Clusters size ≥ 6
Before
Clusters size ≥ 6
After
Additional sequences collected
2 or more Clusters
Combined into one
rodents 5375 1815 1815 133 11
human 5822 1050 1051 59 7
mouse 4569 951 956 71 7
thale cress 520 183 183 10 0
rat 784 112 110 17 2 Table 7. Summary of Impacts – Clustering with Ancestral Sequences
5. A Detailed Example
Many of the large sequence clusters found in the human and mouse databases represent
immunoglobulin chains (alpha chains, beta chains, heavy chains, light chains, variable
and constant regions). Many of these sequences are short, having 100 amino acids or
less. As a result of their length and the number of them, many of the ancestral sequences
were duplicates of each other.
2
13
4
6
8
57
10
9
2
1
3
4
5
6
Olfactory Receptor ProteinsInitial Clustering
1
1
1
313 – 320amino acids
312 – 313amino acids
309 – 313amino acids
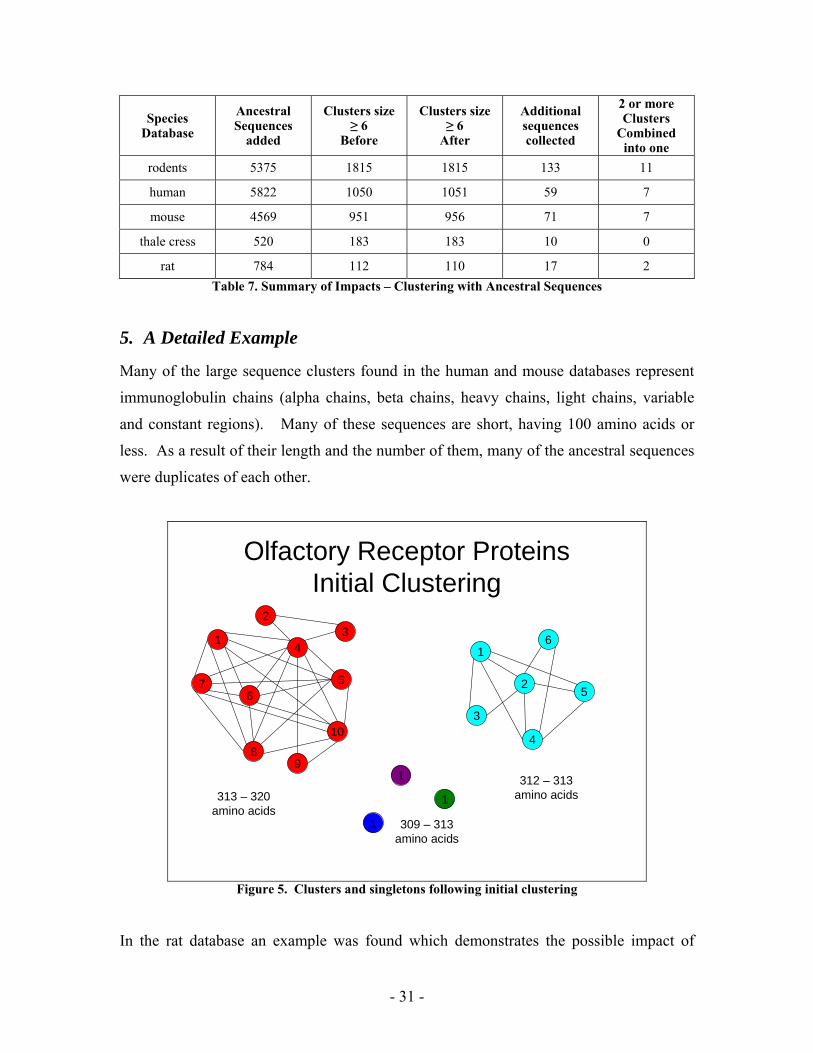
Figure 5. Clusters and singletons following initial clustering
In the rat database an example was found which demonstrates the possible impact of
- 31 -
performing a single-linkage clustering (an all-vs-all comparison) in the presence of
ancestral sequences. A group of olfactory proteins, ranging from 309-320 amino acids,
were grouped into 2 small clusters (sizes 6 and 10) plus 3 singletons during the initial
single-linkage clustering (see figure 5). The two small clusters contained sequences
perceived as homologous, but different enough that the reconstructed ancestral sequences
were all unique (4 and 8 respectively). When the second single-linkage clustering was
performed, these sequences were combined into a single cluster of size 31 (16 original +
12 ancestral + 3 singletons).
Figure 5 shows the single-linkages reported during the initial clustering. Two small
clusters were formed, the 10 sequence cluster shown in red and the 6 sequence cluster
shown in aqua. The three singletons shown in green, blue and purple, were not linked to
any other sequences during this clustering.
Olfactory Receptor Proteins +Predicted Ancestral Sequences
1
6
2
5
78
4
3 1
2 4
3
2
1
3
4
5
6
2
13
4
6
8
57
10
9
(n – 2) unique ancestral sequences
generated for each cluster
Figure 6. Clusters with their Reconstructed Ancestral Sequences, prior to reclustering
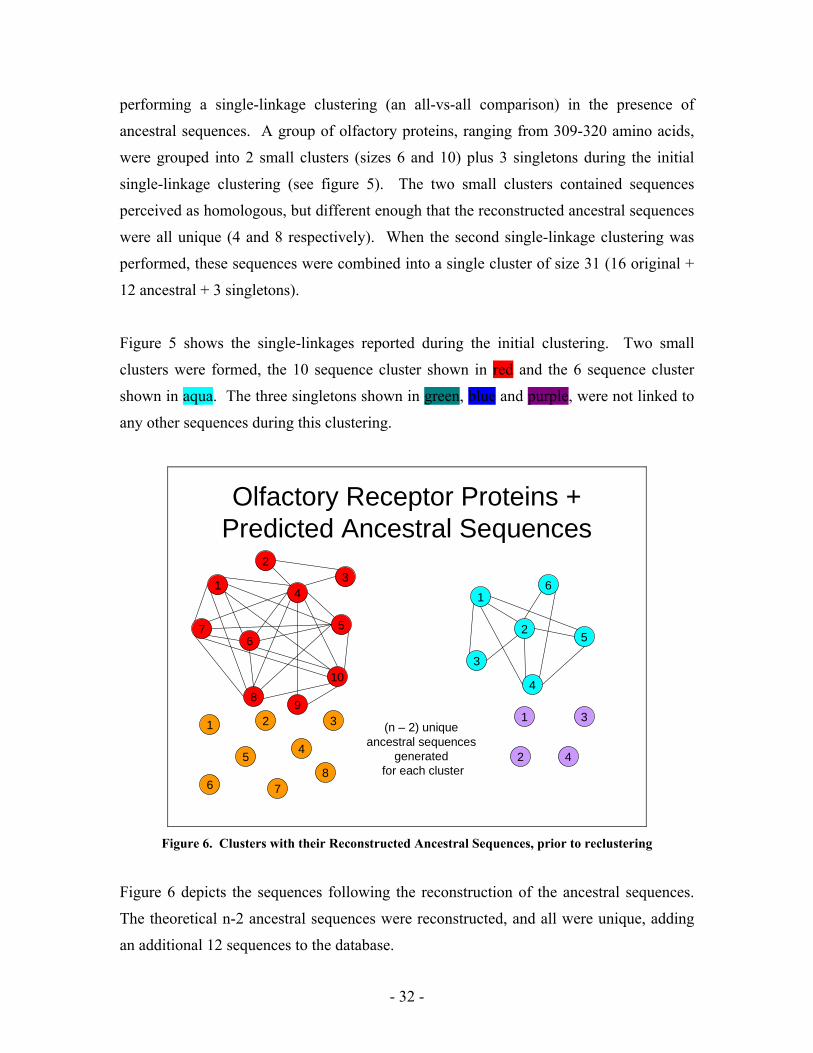
Figure 6 depicts the sequences following the reconstruction of the ancestral sequences.
The theoretical n-2 ancestral sequences were reconstructed, and all were unique, adding
an additional 12 sequences to the database.
- 32 -
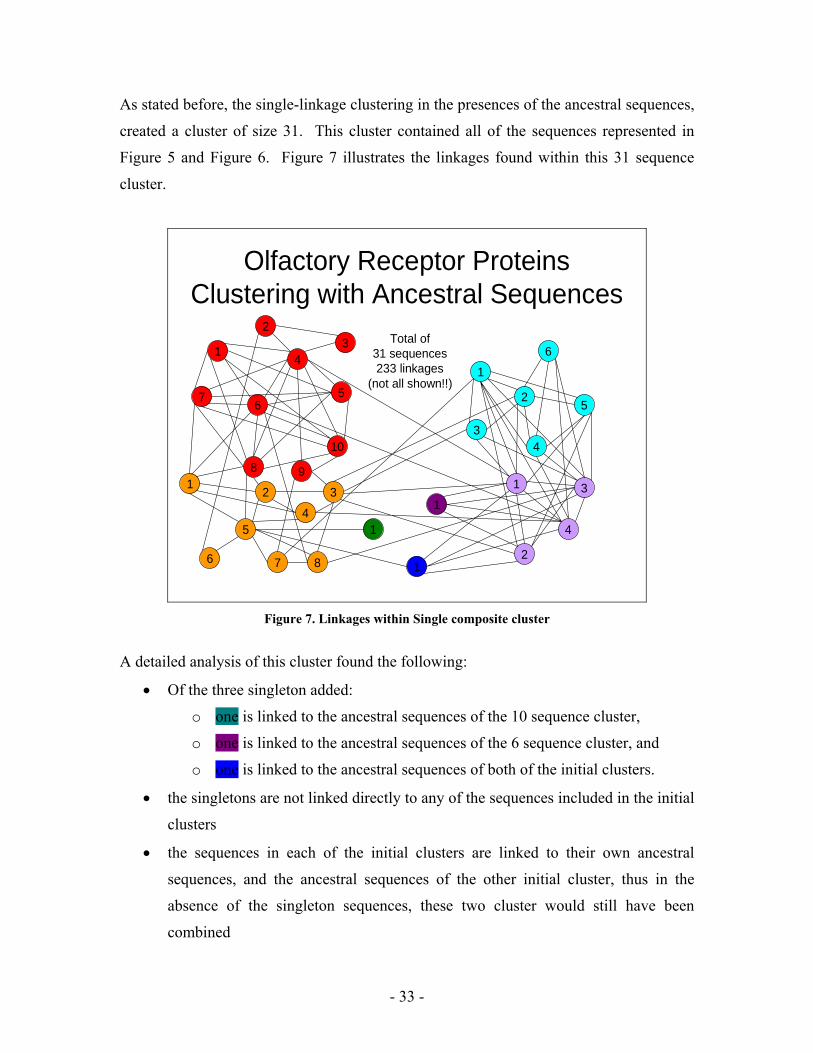
As stated before, the single-linkage clustering in the presences of the ancestral sequences,
created a cluster of size 31. This cluster contained all of the sequences represented in
Figure 5 and Figure 6. Figure 7 illustrates the linkages found within this 31 sequence
cluster.
1
1
1
Olfactory Receptor ProteinsClustering with Ancestral Sequences
1
6
2
5
7 8
4
31
2
4
3
2
1
34
5
6
2
13
4
6
8
57
10
9
Total of31 sequences233 linkages
(not all shown!!)
Figure 7. Linkages within Single composite cluster
A detailed analysis of this cluster found the following:
• Of the three singleton added:
o one is linked to the ancestral sequences of the 10 sequence cluster,
o one is linked to the ancestral sequences of the 6 sequence cluster, and
o one is linked to the ancestral sequences of both of the initial clusters.
• the singletons are not linked directly to any of the sequences included in the initial
clusters
• the sequences in each of the initial clusters are linked to their own ancestral
sequences, and the ancestral sequences of the other initial cluster, thus in the
absence of the singleton sequences, these two cluster would still have been
combined
- 33 -
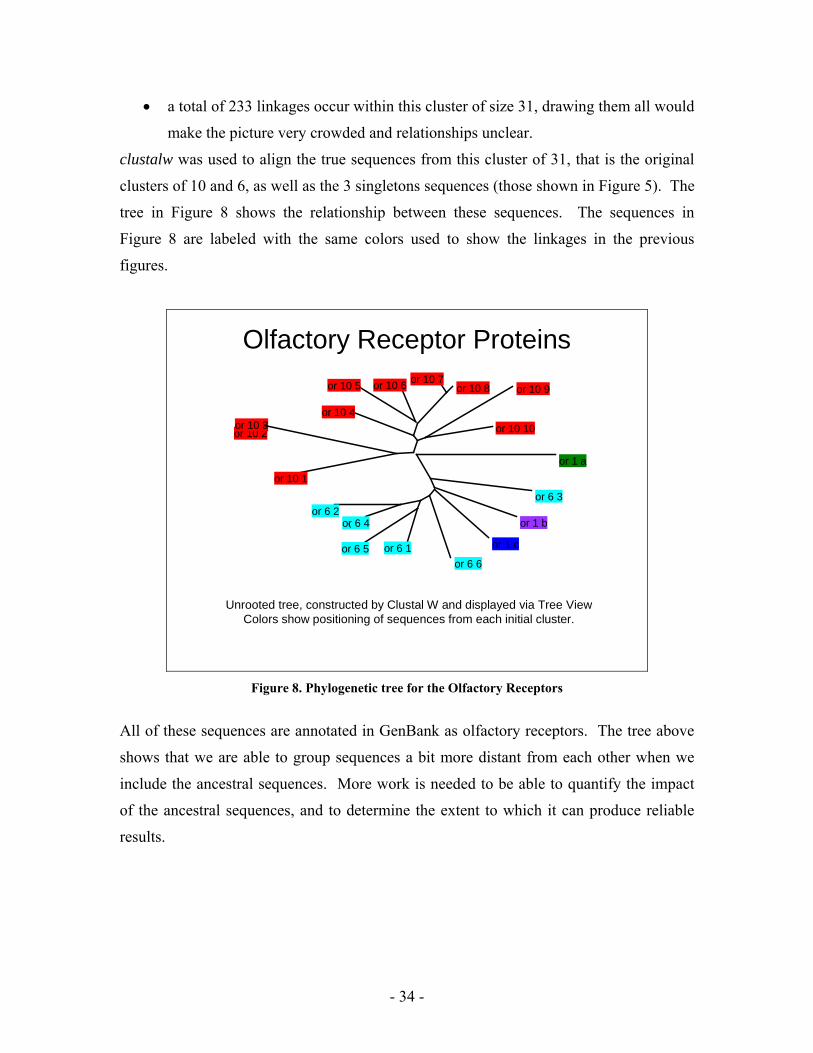
• a total of 233 linkages occur within this cluster of size 31, drawing them all would
make the picture very crowded and relationships unclear.
clustalw was used to align the true sequences from this cluster of 31, that is the original
clusters of 10 and 6, as well as the 3 singletons sequences (those shown in Figure 5). The
tree in Figure 8 shows the relationship between these sequences. The sequences in
Figure 8 are labeled with the same colors used to show the linkages in the previous
figures.
or 1 a
or 6 3
or 1 b
or 1 c
or 6 6or 6 1or 6 5
or 6 4or 6 2
or 10 1
or 10 2or 10 3
or 10 4
or 10 5 or 10 6 or 10 7or 10 8 or 10 9
or 10 10
Unrooted tree, constructed by Clustal W and displayed via Tree ViewColors show positioning of sequences from each initial cluster.
Olfactory Receptor Proteins
Figure 8. Phylogenetic tree for the Olfactory Receptors
All of these sequences are annotated in GenBank as olfactory receptors. The tree above
shows that we are able to group sequences a bit more distant from each other when we
include the ancestral sequences. More work is needed to be able to quantify the impact
of the ancestral sequences, and to determine the extent to which it can produce reliable
results.
- 34 -
CONCLUSIONS
1. Research Goals
The goal of this research was to establish proof of concept with respect to a new approach
for identifying members of gene families. We wanted to show that the inclusion of
ancestral sequences in an all-vs-all protein sequence comparison can be used to find
additional sequence homologies, without lowering the comparison criteria.
Demonstrating this, would show that our approach is suitable for identifying and
extending gene families.
Using the default settings (search and comparison criteria) of the blastclust program and
the protein sequences of numerous model organisms, we have demonstrated that we can
accomplish our goal. For experiments utilizing sequences from the rat, mouse, human
and thale cress protein sequence databases, we found homologies during an all-vs-all
sequence comparison that included ancestral sequences, which were not identified in the
absence of the ancestral sequences.
The default settings of blastclust result in fairly stringent criteria, with respect to
sequence similarity. As a result, the clusters that were combined and the additional
sequences pulled in, are sequences that have already been determined by others to be
homologous (based on database annotation). As such, this work represents a starting
point for the testing the ability of this approach to extending gene families.
In many respects this work leads to more questions than answers. Effort was made to
understand each of the programs utilized: formatdb, blastclust, clustalw and codeml;
such that they could be incorporated into our approach as intelligently and efficiently as
possible. This study has not begun to explore the options available for each of the
programs, which might be able to improve our results. Very recently code was written to
parse the neighbor/hit-file produced by blastclust. Understanding the information in this
file and using it to determine appropriate coverage and scoring density thresholds may be
the key to extending this work.
- 35 -
2. Educational Goals
My personal goals with respect to this internship project and the Computational
Biosciences Program were to bring together my existing knowledge with respect to the
biological sciences and computer programming, as well as to expand my knowledge in
this interdisciplinary field.
With respect to software, this internship project has allowed me to put my existing
programming skills to work, while improving my knowledge of Perl. Aside from small
academic projects, my previous programming experience has been primarily gained in a
UNIX or mainframe programming environment. The programs I interfaced to for this
project are also available for UNIX/Linux. I purposely chose to work in a Windows
environment as a way to force myself to “broaden” my horizons.
The program packages interfaced with in this project; BLAST, CLUSTAL and PAML
are all mainstays of Bioinformatics. This project has allowed me to increase my
knowledge with respect to the capabilities and limitations of these programming
packages.
Finally, from a biological sciences perspective I have gained a better understanding of
gene families. I have learned why they are important to understanding functionality
within the cell, and how they can help us learn about biological systems from one
organism to the next. In conjunction with gene families and determining sequence
homology, I have gained a better understanding of the evolutionary processes responsible
for creating them. It is in understanding and modeling these processes that we are able to
search for sequence homology.
- 36 -
FUTURE DIRECTIONS OF THE PROJECT
The goal of future work would be to determine the search criteria that would correctly
determine or cluster together all of the sequences corresponding to known gene families.
For example, the immunoglobulin sequences in the mouse or the olfactory receptors in
the rat. For these families we would predict the ancestral sequences and perform the
search again. The additional sequences/proteins found in this second search would be
explored to see if our homology predictions were correct.
Much of the research with respect to gene families is driven by the large percentage of
protein products, for which we have not yet determine the function. We hope to
contribute to an approach that can uncover the function of some the many protein
products for which the function is yet unknown. We want to search beyond what is
already known and develop an approach to find additional homologies.
Within the scope of this project, there is much to do to reach this final goal. We have
started our search with stringent similarity criteria, and already for the larger species
databases, we have processing that takes days to complete for each crucial step
(clustering and predicting ancestral sequences).
We need to loosen the similarity criteria in order to cluster entire gene families, but we
need to not create clusters that are so large that PAML cannot converge on the ancestral
sequences. From this perspective there are three obvious focal points; the order in which
to pursue them in is unclear:
1. blastclust: As stated in the conclusions section of this report, the neighbor/hit-list file
may be the key to improving our utilization of this program. Only recently did we
begin parsing this file to understand the data within it. This file contains all of the hits
for the specified BLAST search. My current understanding is that if I wanted to
change the coverage or scoring density thresholds, I would not have to recreate this
hit-list. I could use the existing hit-list, and produce a new cluster file for the new
thresholds. This has not yet been tested.
- 37 -
The neighbor/hit-list file produced by blastclust represents the BLAST scores for a
single set of BLAST criteria. In addition to varying the coverage and score density
threshold against BLAST scores for a single set of BLAST criteria, we would want to
vary the BLAST criteria as well. This would mean generating multiple neighbor/hit-
lift files, each representing a set of BLAST criteria, and then multiple experiments
against each of these, in which the coverage and score density thresholds are varied.
From this we would hope to determine the effect of lowering the BLAST criteria
versus lowering the coverage and score density thresholds.
To run blastclust for the combined mouse/rat species databases took 4 days 8 hours.
We do not know how much of this time is generating the hit-list, and how much is
generating the cluster list. The time investment might not seem as big if you were
producing the hit-list once and cluster lists for multiple sets of criteria.
The size of the hit-list could also become a problem. For the human database it was
4.5 GB. When the hits were extracted to a text file, the file was 13 GB. I was unable
to open this file for reading or grep information from it. I ended up deleting it, and
generating a smaller file with specific hits.
2. codeml: The prediction of the ancestral sequences is another step that takes a
dramatically increasing amount of time as the size of clusters or the lengths of
sequences within the clusters increases. The current set of parameters utilized in the
control file represents “best guesses” of the appropriate values. Perhaps there are
ways to speed this process up, without affecting the integrity of the predicted ancestral
sequences.
3. The sequence database: I saw many “predicted protein” and multiple splice products
for the same protein names – need to look at some of the gene family databases to
better understand the data we are processing – is there a way to logically pare down or
the data without missing what we are looking for.
The items described thus far are in the context of the tools/programs chosen in the
- 38 -
implementation of this project. Speed of integration was a controlling factor in many of
our implementation decisions. The tools used or how we use of them could be improved.
We do not currently know of a tool that would be better suited than blastclust to
accomplishing the all-vs-all comparison; however the alignment, phylogeny, and
ancestral reconstruction steps could all be explored for alternatives. Questions to be
answered might include:
• What is the effect of sequence alignment accuracy? If improving the alignment were
possible, would it have a large effect on our end results?
• What is the effect of phylogeny accuracy? We chose a very fast method of tree
reconstruction (neighbor joining via CLUSTAL), and we know that there are other
approaches which are much more accurate. Would using a more accurate
phylogenetic tree have a large impact on the results?
• What is the effect of alternate methods of ancestral sequence reconstruction? PAML
was chosen, even though it is known to be slow. PAML has been cited as a
reasonably good implementation of maximum likelihood prediction of ancestral
sequences. There may be other approaches (e.g. Bayesian) which might be better,
and perhaps faster as well.
The items described above all represent crucial processing steps in this project. There is
also additional work that could be done to improve the processing of the results. The
remaining items are associated with the code written to interface and process the data.
In any research project, it is hard to develop ways to process the output data, until you see
what the nature and the scope of the data is. A Perl script is needed to extract
information from the hit-list for a given cluster, or sequence not yet in a cluster. Since
the hit-list can become quite large, we may need to develop an approach for either
breaking the hit-list into pieces, or filtering information from the formatted records via C
code.
The Perl Script that extracts ancestral sequences looks for uniqueness of ancestral
sequences within a cluster, but it does not verify uniqueness across all ancestral
sequences. I don’t know if this is a problem. The ancestral sequences are given unique
- 39 -

identifiers, thus formatdb does not recognize if the actual sequences are the same.
Perhaps a script should be developed to combine headers, as is done for the NCBI non-
redundant protein database. This would make it easier to relate each ancestral sequence
to its position in the phylogenetic tree it was created from.
- 40 -
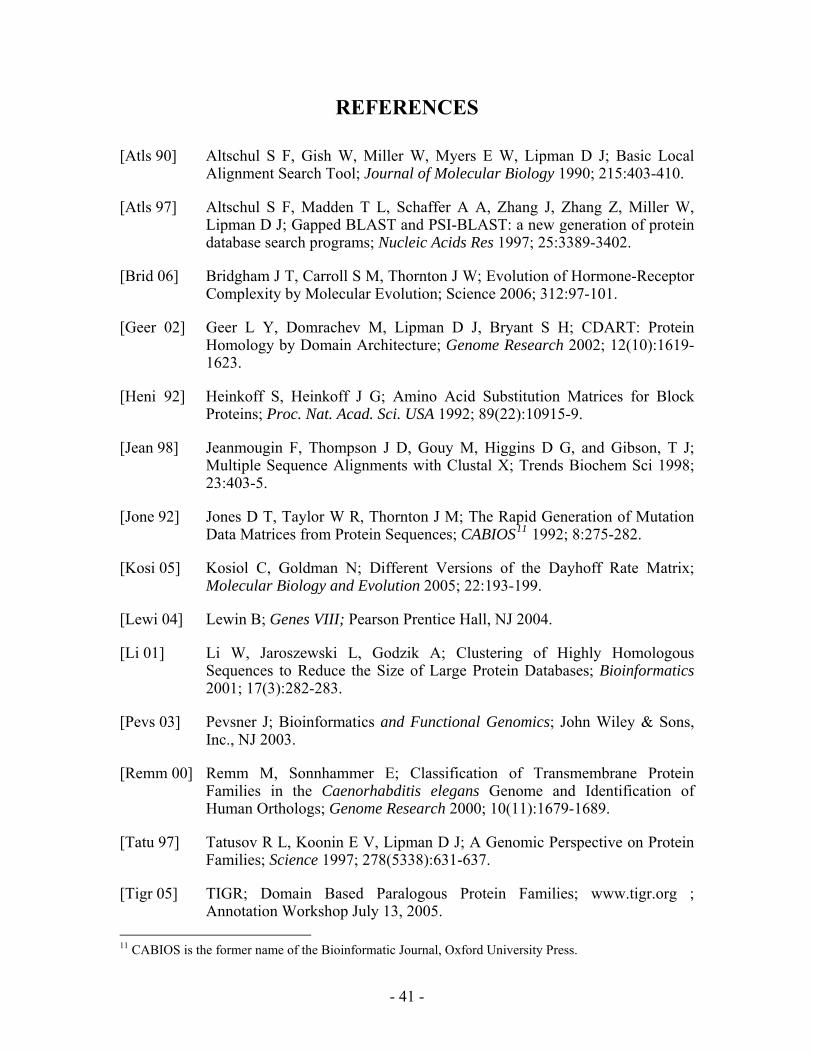
REFERENCES
[Atls 90] Altschul S F, Gish W, Miller W, Myers E W, Lipman D J; Basic Local Alignment Search Tool; Journal of Molecular Biology 1990; 215:403-410.
[Atls 97] Altschul S F, Madden T L, Schaffer A A, Zhang J, Zhang Z, Miller W, Lipman D J; Gapped BLAST and PSI-BLAST: a new generation of protein database search programs; Nucleic Acids Res 1997; 25:3389-3402.
[Brid 06] Bridgham J T, Carroll S M, Thornton J W; Evolution of Hormone-Receptor Complexity by Molecular Evolution; Science 2006; 312:97-101.
[Geer 02] Geer L Y, Domrachev M, Lipman D J, Bryant S H; CDART: Protein Homology by Domain Architecture; Genome Research 2002; 12(10):1619-1623.
[Heni 92] Heinkoff S, Heinkoff J G; Amino Acid Substitution Matrices for Block Proteins; Proc. Nat. Acad. Sci. USA 1992; 89(22):10915-9.
[Jean 98] Jeanmougin F, Thompson J D, Gouy M, Higgins D G, and Gibson, T J; Multiple Sequence Alignments with Clustal X; Trends Biochem Sci 1998; 23:403-5.
[Jone 92] Jones D T, Taylor W R, Thornton J M; The Rapid Generation of Mutation Data Matrices from Protein Sequences; CABIOS11 1992; 8:275-282.
[Kosi 05] Kosiol C, Goldman N; Different Versions of the Dayhoff Rate Matrix; Molecular Biology and Evolution 2005; 22:193-199.
[Lewi 04] Lewin B; Genes VIII; Pearson Prentice Hall, NJ 2004.
[Li 01] Li W, Jaroszewski L, Godzik A; Clustering of Highly Homologous Sequences to Reduce the Size of Large Protein Databases; Bioinformatics 2001; 17(3):282-283.
[Pevs 03] Pevsner J; Bioinformatics and Functional Genomics; John Wiley & Sons, Inc., NJ 2003.
[Remm 00] Remm M, Sonnhammer E; Classification of Transmembrane Protein Families in the Caenorhabditis elegans Genome and Identification of Human Orthologs; Genome Research 2000; 10(11):1679-1689.
[Tatu 97] Tatusov R L, Koonin E V, Lipman D J; A Genomic Perspective on Protein Families; Science 1997; 278(5338):631-637.
[Tigr 05] TIGR; Domain Based Paralogous Protein Families; www.tigr.org ; Annotation Workshop July 13, 2005.
11 CABIOS is the former name of the Bioinformatic Journal, Oxford University Press.
- 41 -
[Thom 94] Thompson J D, Higgins D G, Gibson T J; Clustal W: Improving the Sensitivity of Progressive Multiple Sequence Alignment through Sequence Weighting, Position-Specific Gap Penalties and Weight Matrix Choice; Nucleic Acids Research 1994; 22(22):4673-4680.
[Yang 94] Yang Z, Goldman N, Friday A; Comparison of Models for Nucleotide substitution used in Maximum-Likelihood Phylogenetic Estimation; Molecular Biology and Evolution 1994; 11:316-324.
[Yang 95] Yang Z, Kumar S, Nei M; A New Method of Inference of Ancestral Nucleotide and Amino Acid Sequences; Genetics 1995; 141:1641-1650.
[Yang 97] Yang Z; PAML: a Program Package for Phylogenetic Analysis by Maximum Likelihood; CABIOS 1997; 12(7):555-556.
- 42 -
APPENDIX A: SOFTWARE PACKAGES UTILIZED
1. formatdb
formatdb is a standalone program available from NCBI. formatdb translates a FASTA formatted data file into a BLAST formatted database (needed for stand-alone blast or blastclust).
This program is invoked on a per database basis. This program is invoked once for the database of sequences obtained from NCBI, and once per iteration in which ancestral sequences are added to the database.
Example usage:
formatdb -i humanDB.fasta -pT –oT
where: humanDB.fasta is a file of FASTA formatted sequences -pT indicates protein sequences -oT indicates sequence identifiers are in FASTA format and can be parsed
to create indexes within the blast database.
For this study, formatdb was invoked from within a Perl script.
2. blastclust
blastclust is a standalone program available from NCBI. blastclust is designed to cluster a set of sequence into similar groups according to their similarity and length of coverage (i.e. provide a single linkage clustering).
blastclust may take either a FASTA formatted or BLAST formatted database file as input. blastclust performs the all-vs.-all comparison of the sequences and returns two files, one containing the list of sequences clustered together and a second containing the list of neighbors found.
This program is invoked on a per species/database basis. This program is invoked once for the database of sequences obtained from NCBI, and once per iteration in which ancestral sequences are added to the database.
Example usage:
blastclust –d mouseDB –o mouseClust.out –s mouseNbr.out
where: mouseDB is the input file of FASTA formatted sequence for the species Mus
musculus. mouseClust.out is the cluster file generated by blastclust. The clusters are written
- 43 -
one per line, from largest to smallest. Each cluster is a list of sequence identifiers.
mouseNbr.out is the neighbor list generated by blastclust.
For this study, blastclust was invoked from within a Perl script.
3. clustalw
clustalw is the command line version of the Clustal W program [Thom 94]. clustalw is used to align sequences and build a neighbor-joining tree to depict the relationship between the sequences.
This program is invoked multiple times per species/database. It will be invoked for each cluster (size ≥ 6) found within a species/database. The program is invoked to align the sequences in a cluster, convert the alignment to the required format, and to build a phylogenetic tree for the sequences using neighbor-joining. Refer to appendix C for example usage.
For this study, a Perl script was written to build a batch file. The batch file invokes clustalw three times for each sequence cluster.
The options specified when invoking clustalw pertain to operations requested for the specified input file, i.e. alignment, conversion of alignment file to phylip format, and generation of a tree in phylip format. The parameters used when executing these requests, are the programs defaults. These are understood to be as follows:
• for pairwise alignment: o gapopen = 10 o gapext = 0.1 (for protein, would be 6.66 for DNA) o protein weight matrix = Gonnet series
• for multiple alignment: o gap opening penalty = 10.0 o gap extension penalty = 0.2 o delay divergent sequences = 30% o protein weight matrix = Gonnet series o residue-specific penalties = ON o hydrophilic penalties = ON o hydrophilic residues = GPSNDQEKR o gapdist = 4 (separation penalty) o end gap separation = OFF
Execution parameters used by clustalw can be displayed by invoking the program from the command line without entering any options.
- 44 -
4. codeml
codeml is a command line executable which is part of PAML package [Yang 94, 97]. codeml is used to predict ancestral protein/amino acid sequences [Yang 95], given a set of aligned protein/amino acid sequences and a phylogenetic tree for the sequences.
This program is invoked once for each cluster within a species/species database. Execution requires a control file, which specifies the alignment and tree files, and thus must be built on a per cluster basis. (See subsequent appendix for specific format of the control file.)
For this study, a Perl script was written to build a control file for each alignment and tree file pair that represent a cluster of protein sequences. The same Perl script constructs a batch file to invoke codeml for each of the control files.
- 45 -
APPENDIX B: PERL SCRIPTS
1. mySubs.pm:
Module containing user defined subroutines.
2. bClust.pl:
This script invokes “blastclust” to form clusters of protein sequences. The script takes a FASTA formatted data file as input, and invokes “blastclust” to obtain an output file containing the cluster info. “blastclust” is invoked as follows:
blastclust -d inputDB -o clustList -s neighborList
where: -d sequence database name -o file to save cluster list in (ASCII, list of sequence gi’s) -s file to save hit-list in (not ASCII, formatted records)
Script reports the time in seconds required to cluster the sequences.
input: source data file (FASTA format) output: cluster list (one cluster per line, largest to smallest) neighbor list (not utilized at this time)
Usage: perl bClust.pl dbFile clustList neighborList
3. buildClustalBat.pl:
This program will build a ".bat" file which will be uses to submit a numerous FASTA files (each representing a cluster of sequences) to Clustal W.
Assumptions: Will look for file names containing ".fas", make sure directory contains just the “.fas” files that you want to run Clustal W for.
input: directory to be searched for “.fas” files, name of batch file output: batch file, ready to be executed.
Usage: perl buildClustalBat.pl directoryPath batFile
4. buildCtlFiles.pl:
This program will perform two functions. First, it will build a ".ctl" file which will be used to provide parameters/options to PAML’s codeml program. Second, it will build a “.bat” file which will be used submit numerous calls to PAML’s
- 46 -
codeml program and save the “.rst” file generated by codeml into an appropriately named “.rst” file. (The “.rst” file contains the predicted ancestral sequences for a cluster of sequences).
The “.ctl” files are named with the same file prefix as the existing sequence (.phy) and tree (.ph) files. The sequence and tree file names are specified in the first two lines of the constructed “.ctl” file. The remainder of the file is copied from the template “.ctl” file specified in the input parameters to this program
Assumptions: Will look for file names containing ".phy", and assume there is also a like named “.ph” file. Theses filenames are concatenated with “seqfile=” and “treefile=” in each “.ctl” file.
input: directory to be searched for “.phy” files, name of template “.ctl” file, name of batch file
output: numerous “.ctl” files and batch file, ready to be executed.
Usage: perl buildCtlFiles.pl directoryPath ctlTemplate batFile
5. collectClust.pl:
This script will collect “clusters” of FASTA records into individual files (.fas). This script steps through a cluster list, produced by blastclust and creates a file of FASTA records for each cluster.
Note: clustalw needs sequence names (taken from the faster header) of 10 characters or less. PAML’s codeml needs the sequence name to be nonnumeric and be separated from the aligned sequences by at least 2 blank spaces. The combination of these requirements (without additional post processing of the alignment format) requires that the sequence names be limited to 9 characters, including at least one nonnumeric character. This script creates a sequence name that is a “g” followed by the gi number, which is up to 8 digits in length.
Assumptions: The file containing the clusters, starts with largest cluster first.
input: cluster list (one cluster per line, largest to smallest) source data file (FASTA format) string representing file name prefix size (number of sequences) in largest cluster collected size (number of sequences) in smallest cluster collected output: as many FASTA files ( .fas suffix) as there are clusters in the size range specified
Usage: perl collectClust.pl clustList db filePrefix maxSize minSize
- 47 -
6. collectClustHdr.pl:
This script follows the same logic as collectClust.pl. This script steps through a cluster list, produced by blastclust and creates a file for each cluster. This script collects the complete header and only the header from each sequence into the specified file (.fas). See collectClust.pl for details and usage information.
7. compareClust.pl:
This script will “compare” the sequence IDs for the sequences from two successive calls to blastClust (without and with reconstructed ancestral sequences).
Assumptions: File containing clusters starts with largest cluster first. The compare is one-directional, i.e. it is assumed that clustList2 contains sequences not in clusterList1, this script will list them.
input: filenames for to blastClust output files, max and min size of the clusters to be compared.
output: list of sequence IDs found in second cluster file, that aren’t in the first cluster file and the name of clusters in second list that have sequences from more than one cluster in first list
Usage: perl compareClust.pl clustList1 clustList2 minSize numAncest
8. countClust.pl:
Steps through a cluster list produced by blastclust and count the number of each size of clusters found.
input: cluster list (one cluster per line, largest to smallest) output: textual count of number of clusters and sizes.
Usage: perl countClust.pl clustList
9. dbFormatter.pl:
Translates a FASTA formatted data file into a set of BLAST database files. Invokes the executable formatdb, specifying the input data file name. The prefix to be assigned to the BLAST database files is the same as the input data file name. formatdb is invoked as follows:
formatdb -i input_dbFile -pT –oT
where: -i specifies input file to be formatted
- 48 -
-pT type of file being formatted, protein = True -oT parse options, True: parse SeqId and create indexes
Script reports the time in seconds required to format the database.
input: source data file (FASTA format) output: set of seven data files (for input file name of “db”: db.phr, db.pin,
db.pnd, db.pni, db.psd, db.psi, and db.psq)
Usage: perl dbFormatter.pl dbFile
10. extractAnSeq.pl:
This program will extract ancestral sequences from PAML’s codeml ".rst" files, determine if they are unique, convert them to FASTA format and place them in a ".fas" file, with an "a" as the first character of the filename, to designate the origin of the sequences.
The ".rst" files contain much more information than these sequences. We want the sequences resulting from marginal reconstruction, which is the first set within the file. The search will look for the string "List of extant and reconstructed sequences" to find all of the sequences.
The reconstructed sequences will be compared to the extant sequences, and the unique ones will be output 80 characters per line to the FASTA file.
Assumptions: Looking for files ending with ".rst". Each ancestral sequence will be preceded by "node #"
input: directory to be searched for “.rst” files. output: “.fas” containing the unique ancestral sequences (to be concatenated to database file).
Usage: perl extractAnSeq.pl directoryPath
11. modifyAlignFiles.pl:
This program will insert a “I” at the end of the first line of PHYLIP formatted alignment files. This value is needed by PAML’s codeml program, to indicate interleaved sequence data.
B, X, and Z within the sequences will be changed to ‘?’. PAML’s codeml program cannot process these indeterminate characters (each represents more than one possible amino acid).
Assumptions: Will look for file names containing “.phy” files that contain the aligned sequences in PHYLIP format.
- 49 -
input: directory to be searched for “.phy” files. output: all “.phy” files in the directory have a “I” on the first line. (All B, X, and Z characters within sequences changed to ‘?’)
Usage: perl buildClustalBat.pl directoryPath
12. modifyTreeFiles.pl:
This program will insert a “1” as the first line of PHYLIP formatted tree files. This value is needed by PAML’s codeml program, to indicate the number of trees in the file.
Assumptions: Will look for file names containing ".ph"; have to distinguish between these and the “.phy” files that contain the aligned sequences in PHYLIP format.
input: directory to be searched for “.ph” files. output: all “.ph” files in the directory have a “1” on the first line.
Usage: perl buildClustalBat.pl directoryPath
13. spFilter.pl :
This script allows the user to create a species specific FASTA formatted data file. It filters all of the sequences for a specified species from a FASTA formatted data file. The subset of information filtered from the data file is copied to a specified file. This script reports the time in seconds required to create the species specific data file, and the number of records collected.
input: source data file (FASTA format) output: destination data file, species specific (FASTA format)
Usage: perl spFilter.pl dbFileIn dbFileOut
14. testTiming.pl:
Tests the subroutine elapsedTime( ). Given a start time and end time in seconds, this script reports the elapsed time in seconds as well as days, hrs, min and sec.
input: start time and endtime output: textual display of elapsed time in seconds and well as days, hrs, min and sec.
Usage: testTiming.pl start_time end_time
- 50 -
APPENDIX C: BATCH FILES
1. clustalw
The name of this batch file is determined by the call to buildClustalBat.pl.
For each FASTA file (xxx.fas), representing a cluster of sequences (from blastclust), the following lines are entered in the batch file:
clustalw.exe -options -infile=xxx.fas -align -outorder=input clustalw.exe -options -infile=xxx.aln -convert -output=phylip clustalw.exe -options -infile=xxx.aln -tree -outputtree=phylip
The last two lines in the batch file removes the guide tree files and the intermediate alignment file, created by clustalw and not needed by PAML:
del *.dnd del *.aln
2. codeml
The name of this batch file is determined by the call to buildCtlFiles.pl. For each pair of alignment file (xxx.phy) and tree file (xxx.ph), representing a cluster of sequences (from blastclust), the following lines are entered in the batch file:
codeml xxx.ctl copy rst xxx.rst
- 51 -
APPENDIX D: CONTROL FILES 1. codeml The applications within the PAML: Phylogenetic Analysis by Maximum Likelihood package base their execution off of a “control file” [Yang 94, 95, 97]. When the codeml application is invoked, it will look first on the command line for the name of the control file. If the name of the control file is not provided, the application will look for a file named “codeml.ctl” in it home directory. For this project the control file is unique to each execution and thus is specified. The first two lines of the file indicate the names of the sequence and tree files. These lines are built by a Perl script, based on the sequence and tree files found in the specified directory. The control file is given the same file prefix as these files, followed by “.ctl”. The remainder of the file contents is copied from a template. This template was built from an understanding of the examples provided with the download of the PAML software12 : seqfile = xxx.phy * alignment file treefile = xxx.ph * tree file * seqfile and treefile added via script outfile = mlc * main result file noisy = 1 * 0,1,2,3,9: how much rubbish on the screen verbose = 1 * 1: detailed output, 0: concise output runmode = 0 * 0: user tree; seqtype = 2 * 1:codons; 2:AAs; 3:codons-->AAs aaRatefile = jones-dcmut.dat * only used for aa seqs with model=empirical(_F) model = 3 * 0:poisson, 1:proportional, 2:Empirical, 3:Empirical+F * 6:FromCodon, 7:AAClasses, 8:REVaa_0, 9:REVaa(nr=189) Mgene = 0 * aaml: 0:rates, 1:separate; fix_alpha = 1 * 0: estimate gamma shape parameter; 1: fix it at alpha alpha = 0.0 * initial or fixed alpha, 0:infinity (constant rate) Malpha = 0 * different alphas for genes ncatG = 2 * # of categories in the dG or AdG models of rates clock = 0 * 0: no clock, unrooted tree, 1: clock, rooted tree getSE = 0 * 0: don't want them, 1: want S.E.s of estimates RateAncestor = 1 * (1/0): rates (alpha>0) or ancestral states (alpha=0) Small_Diff = .5e-6 cleandata = 0 * remove sites with ambiguity data (1:yes, 0:no)? fix_blength = 1 * 0: ignore, -1: random, 1: initial, 2: fixed method = 0 * 0: simultaneous; 1: one branch at a time
12 http://abacus.gene.ucl.ac.uk/software/paml.html
- 52 -
The names of executables that were not considered useful for this project have been
stricken in the tables below. For example, bl2seq, is an executable specific to nucleotide
sequences.
In this study the executables of interest are those that process proteins / amino acid (aa)
sequences. The application/utilities listed below were tested using the FASTA formatted
yeast database, yeast.aa, downloaded from NCBI. For applications requiring a BLAST
formatted database, this database was processed via formatdb.
\doc includes html files with usage information for: blast, blastclust, fastacmd, formatdb,
impala, megablast, and rpsblast.
\data includes reference files that are needed by these executables. For example, the
blosum62 matrix is used for scoring within the blast algorithm.
seedtop.exe
makemat.exe megablast.exe rpsblast.exe
formatdb.exe formatrpsdb.exe impala.exe
blastpgp.exe copymat.exe fastacmd.exe
bl2seq.exe blastall.exe blastclust.exe
\bin contains the following executables:
\bin \data \doc
Extracting the files from the download, established the following directories:
Executables representing BLAST release 2.2.12 for win32-ia32 were downloaded on
8/27/2005 [Atls 90, 97].
APPENDIX E: SUMMARY OF BLAST PROGRAMS
- 53 -
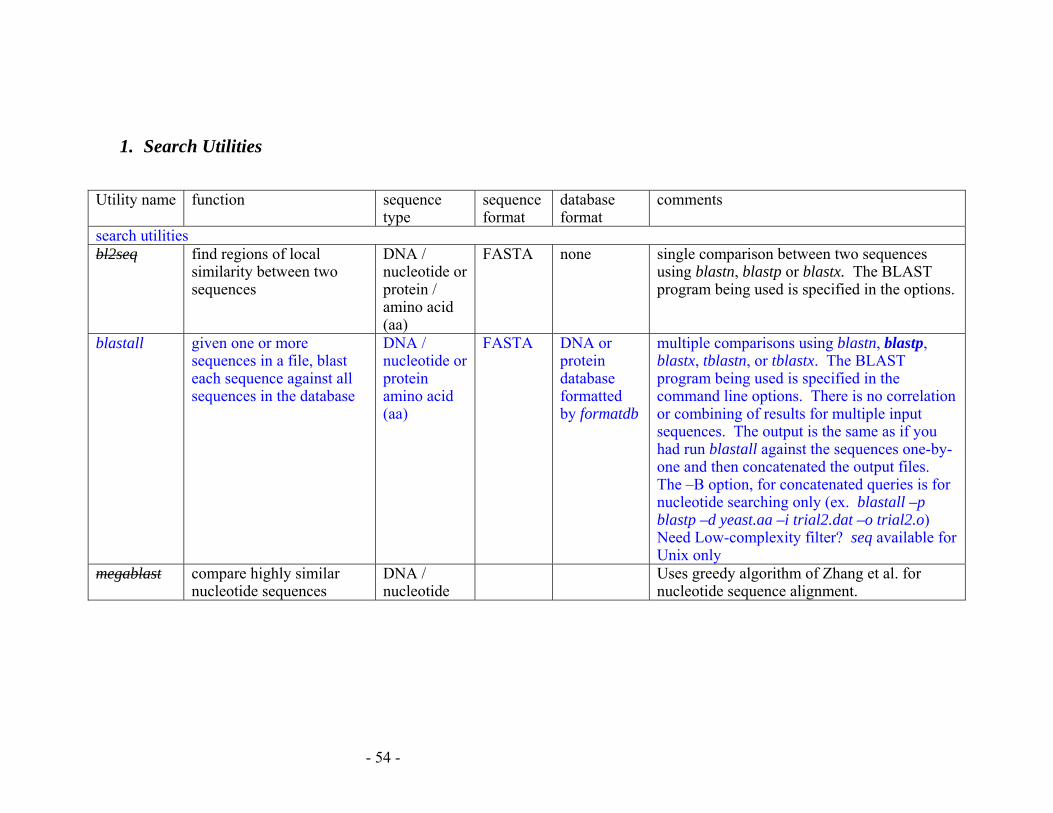
1. Search Utilities
Utility name
function sequence
type sequence format
database format
comments
search utilities bl2seq find regions of local
similarity between two sequences
DNA / nucleotide or protein / amino acid (aa)
FASTA none single comparison between two sequences using blastn, blastp or blastx. The BLAST program being used is specified in the options.
blastall given one or more sequences in a file, blast each sequence against all sequences in the database
DNA / nucleotide or protein amino acid (aa)
FASTA DNA or protein database formatted by formatdb
multiple comparisons using blastn, blastp, blastx, tblastn, or tblastx. The BLAST program being used is specified in the command line options. There is no correlation or combining of results for multiple input sequences. The output is the same as if you had run blastall against the sequences one-by-one and then concatenated the output files. The –B option, for concatenated queries is for nucleotide searching only (ex. blastall –p blastp –d yeast.aa –i trial2.dat –o trial2.o) Need Low-complexity filter? seq available for Unix only
megablast compare highly similar nucleotide sequences
DNA / nucleotide
Uses greedy algorithm of Zhang et al. for nucleotide sequence alignment.
- 54 -
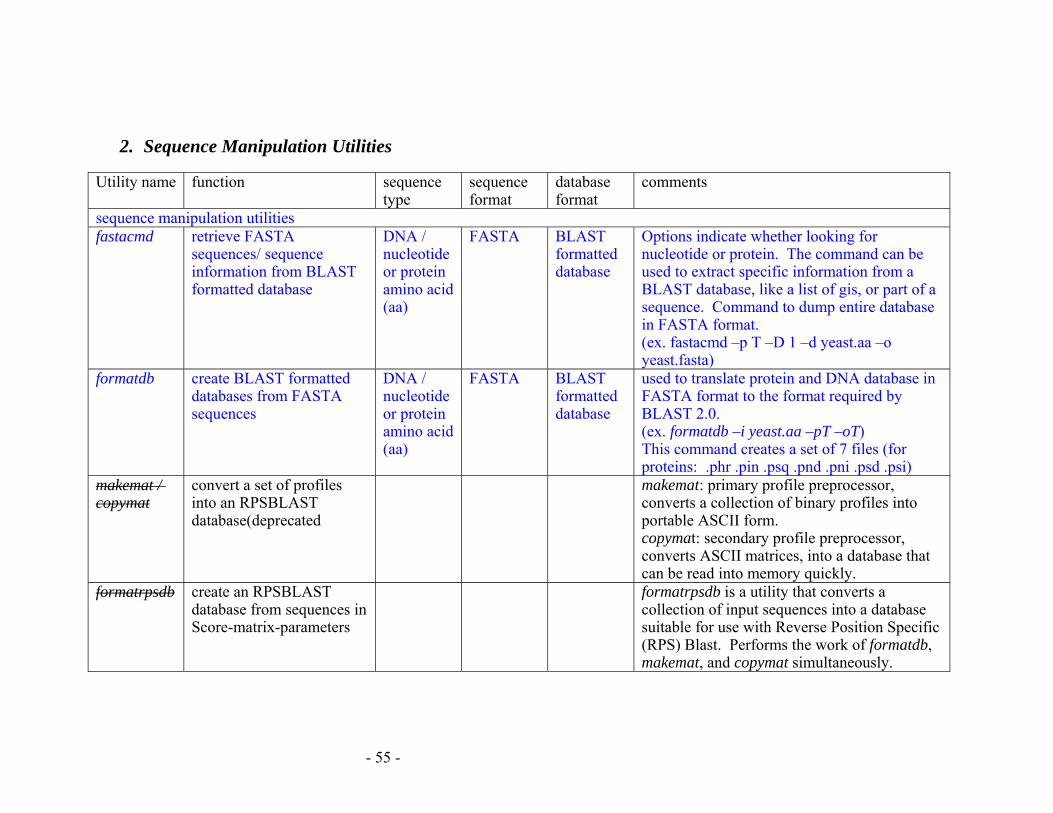
2. Sequence Manipulation Utilities
Utility name
function sequence type
sequence format
database format
comments
sequence manipulation utilities fastacmd retrieve FASTA
sequences/ sequence information from BLAST formatted database
DNA / nucleotide or protein amino acid (aa)
FASTA BLAST formatted database
Options indicate whether looking for nucleotide or protein. The command can be used to extract specific information from a BLAST database, like a list of gis, or part of a sequence. Command to dump entire database in FASTA format. (ex. fastacmd –p T –D 1 –d yeast.aa –o yeast.fasta)
formatdb create BLAST formatted databases from FASTA sequences
DNA / nucleotide or protein amino acid (aa)
FASTA BLAST formatted database
used to translate protein and DNA database in FASTA format to the format required by BLAST 2.0. (ex. formatdb –i yeast.aa –pT –oT) This command creates a set of 7 files (for proteins: .phr .pin .psq .pnd .pni .psd .psi)
makemat / copymat
convert a set of profiles into an RPSBLAST database(deprecated
makemat: primary profile preprocessor, converts a collection of binary profiles into portable ASCII form. copymat: secondary profile preprocessor, converts ASCII matrices, into a database that can be read into memory quickly.
formatrpsdb create an RPSBLAST database from sequences in Score-matrix-parameters
formatrpsdb is a utility that converts a collection of input sequences into a database suitable for use with Reverse Position Specific (RPS) Blast. Performs the work of formatdb, makemat, and copymat simultaneously.
- 55 -
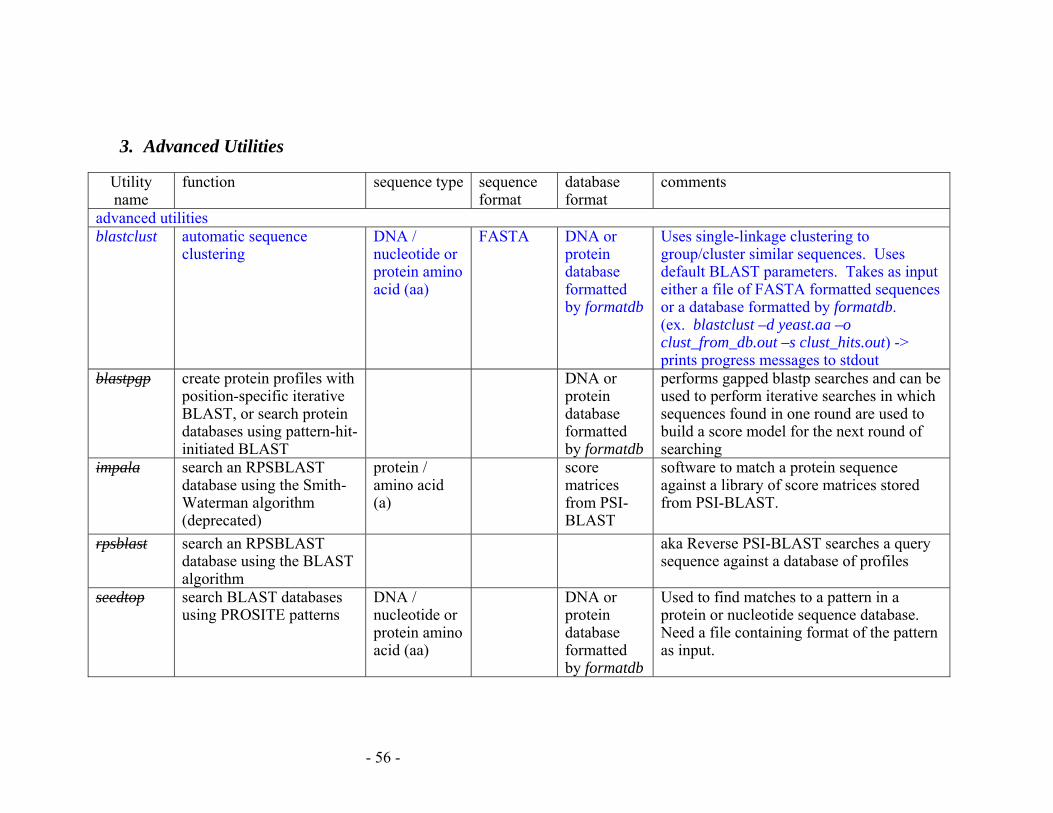
Utility name
function sequence type sequence format
database format
comments
advanced utilities blastclust automatic sequence
clustering DNA / nucleotide or protein amino acid (aa)
FASTA DNA or protein database formatted by formatdb
Uses single-linkage clustering to group/cluster similar sequences. Uses default BLAST parameters. Takes as input either a file of FASTA formatted sequences or a database formatted by formatdb. (ex. blastclust –d yeast.aa –o clust_from_db.out –s clust_hits.out) -> prints progress messages to stdout
blastpgp create protein profiles with position-specific iterative BLAST, or search protein databases using pattern-hit-initiated BLAST
DNA or protein database formatted by formatdb
performs gapped blastp searches and can be used to perform iterative searches in which sequences found in one round are used to build a score model for the next round of searching
impala search an RPSBLAST database using the Smith-Waterman algorithm (deprecated)
protein / amino acid (a)
score matrices from PSI-BLAST
software to match a protein sequence against a library of score matrices stored from PSI-BLAST.
rpsblast search an RPSBLAST database using the BLAST algorithm
aka Reverse PSI-BLAST searches a query sequence against a database of profiles
seedtop search BLAST databases using PROSITE patterns
DNA / nucleotide or protein amino acid (aa)
DNA or protein database formatted by formatdb
Used to find matches to a pattern in a protein or nucleotide sequence database. Need a file containing format of the pattern as input.
- 56 -
3. Advanced Utilities
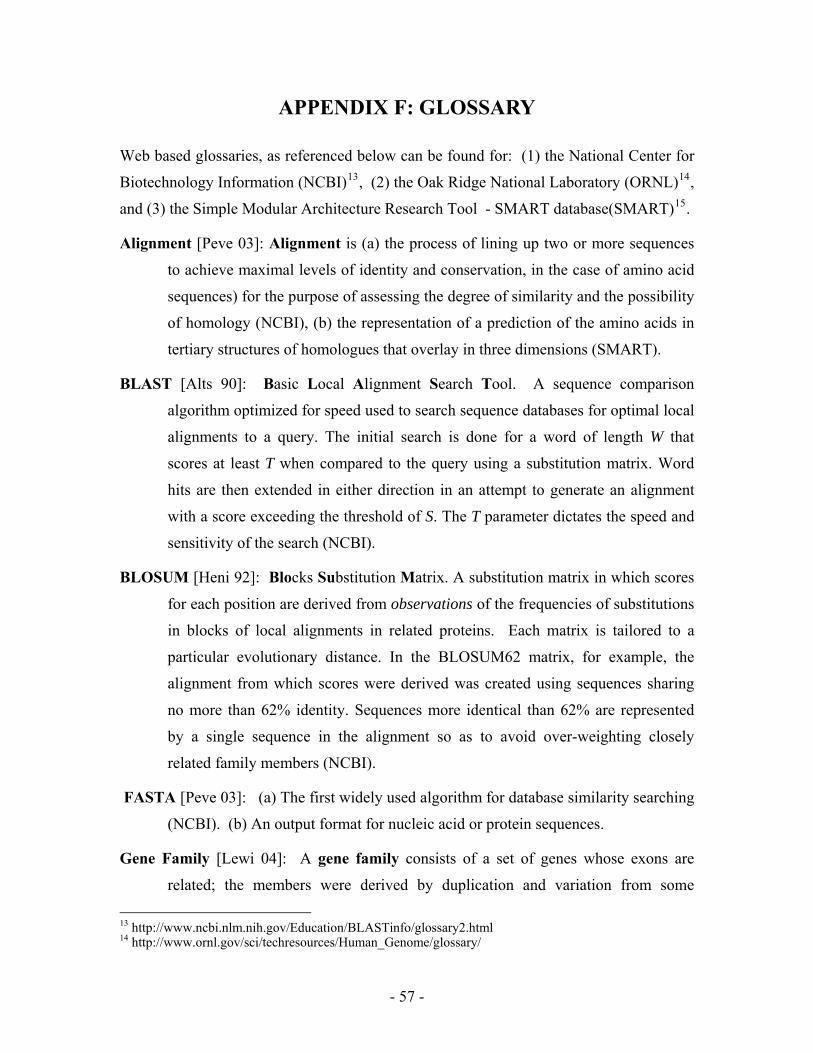
APPENDIX F: GLOSSARY
Web based glossaries, as referenced below can be found for: (1) the National Center for
Biotechnology Information (NCBI)13, (2) the Oak Ridge National Laboratory (ORNL)14,
and (3) the Simple Modular Architecture Research ToolTT
- SMART database(SMART)15.
Alignment [Peve 03]: Alignment is (a) the process of lining up two or more sequences
to achieve maximal levels of identity and conservation, in the case of amino acid
sequences) for the purpose of assessing the degree of similarity and the possibility
of homology (NCBI), (b) the representation of a prediction of the amino acids in
tertiary structures of homologues that overlay in three dimensions (SMART).
BLAST [Alts 90]: Basic Local Alignment Search Tool. A sequence comparison
algorithm optimized for speed used to search sequence databases for optimal local
alignments to a query. The initial search is done for a word of length W that
scores at least T when compared to the query using a substitution matrix. Word
hits are then extended in either direction in an attempt to generate an alignment
with a score exceeding the threshold of S. The T parameter dictates the speed and
sensitivity of the search (NCBI).
BLOSUM [Heni 92]: Blocks Substitution Matrix. A substitution matrix in which scores
for each position are derived from observations of the frequencies of substitutions
in blocks of local alignments in related proteins. Each matrix is tailored to a
particular evolutionary distance. In the BLOSUM62 matrix, for example, the
alignment from which scores were derived was created using sequences sharing
no more than 62% identity. Sequences more identical than 62% are represented
by a single sequence in the alignment so as to avoid over-weighting closely
related family members (NCBI).
FASTA [Peve 03]: (a) The first widely used algorithm for database similarity searching
(NCBI). (b) An output format for nucleic acid or protein sequences.
Gene Family [Lewi 04]: A gene family consists of a set of genes whose exons are
related; the members were derived by duplication and variation from some
13 http://www.ncbi.nlm.nih.gov/Education/BLASTinfo/glossary2.html 14 http://www.ornl.gov/sci/techresources/Human_Genome/glossary/
- 57 -
ancestral gene.
Gene Family (ORNL): A gene family is a group of closely related genes that make
similar products.
Gene Family [Tatu 97]: A gene family is a set of related genes occupying various loci
in the DNA, almost certainly formed by duplication of ancestral genes, and
having a recognizably similar sequence. The globin family is an example.
Homolog [Peve 03]: A homolog is a gene that has the same origin and functions in two
or more species (ORNL). A homolog is a gene related to a second gene by
descent from a common ancestral DNA sequence.
Homolog [Tatu 97]: The term homolog, may apply to the relationship between genes
separated by an event of speciation (ortholog) or to the relationship between genes
separated by the event of gene duplication (paralog).
Homology [Peve 03]: Homology is (a) similarity attributed to descent from a common
ancestor. (NCBI) (b) similarity in DNA or protein sequences between individuals
of the same species or among different species. (ORNL) (c) evolutionary descent
from a common ancestor due to gene duplication. (SMART)
Local Alignment [Peve 03]: The alignment of some portion of two nucleic acid or
protein sequences.
Motif [Peve 03]: (a) A short conserved region in a protein sequence. Motifs are
frequently highly conserved parts of domains. (NCBI) (b) Sequence motifs are
short conserved regions of polypeptides. Set of sequence motifs need not
represent homologs. (SMART)
Multiple Sequence Alignment [Peve 03]: An alignment of three or more sequences
with gaps inserted in the sequences such that residues with common structural
positions and/or ancestral residues are aligned in the same column. Clustal W is
one of the most widely used multiple sequence alignment programs.
Orthologous [Peve 03]: Homologous sequences in different species that arose from a
common ancestral gene during speciation; may or may not be responsible for a
15 http://smart.embl-heidelberg.de/help/smart_glossary.shtml
- 58 -
similar function. (NCBI)
Orthologs [Lewi 04]: Orthologs are corresponding proteins in two species as defined
by sequence homology. Normally, orthologs retain the same function in the
course of evolution. Identification of orthologs is critical for reliable prediction of
gene function in newly sequenced genomes [Tatu 97].
Paralogous [Peve 03]: Paralogous sequences are homologous sequences within a single
species that arose by gene duplication (NCBI).
Paralogs [Lewi 04]: Paralogs are highly similar proteins that are coded by the same
genome. Paralogs normally evolve new functions, often a function related to the
original one [Tatu 97].
Speciation [Tatu 97]: Speciation is the origin of a new species capable of making a
living in a new way from the species from which it arose. As part of this process
it has also acquired some barrier to genetic exchange with the parent species.
- 59 -