internet service provider
DESCRIPTION
ÂTRANSCRIPT
View with images and charts
Business Plan On Internet Service Provider
Company History
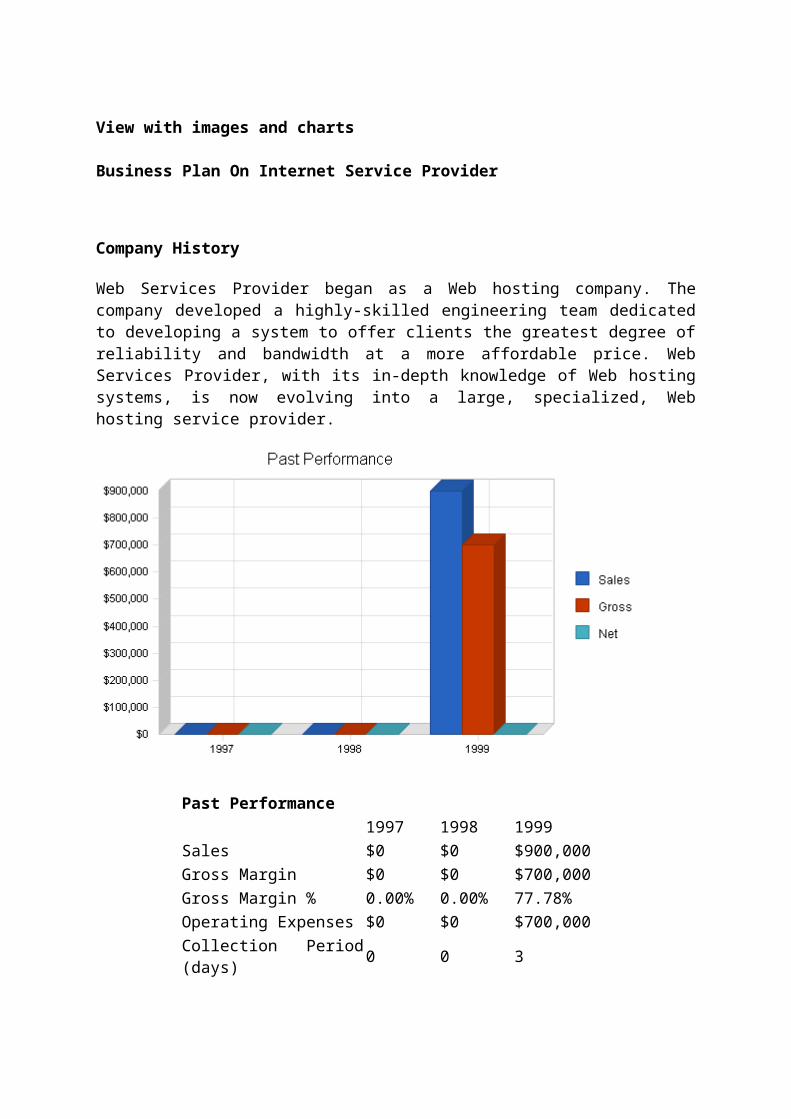
Web Services Provider began as a Web hosting company. The company developed a highly-skilled engineering team dedicated to developing a system to offer clients the greatest degree of reliability and bandwidth at a more affordable price. Web Services Provider, with its in-depth knowledge of Web hosting systems, is now evolving into a large, specialized, Web hosting service provider.
Past Performance1997 1998 1999
Sales $0 $0 $900,000Gross Margin $0 $0 $700,000Gross Margin % 0.00% 0.00% 77.78%Operating Expenses $0 $0 $700,000Collection Period (days) 0 0 3
Balance Sheet1997 1998 1999
Current AssetsCash $0 $0 $2,450Accounts Receivable $0 $0 $14,200Other Current Assets $0 $0 $1,050

Total Current Assets $0 $0 $17,700
Long-term AssetsLong-term Assets $0 $0 $5,250Accumulated Depreciation $0 $0 $1,000Total Long-term Assets $0 $0 $4,250
Total Assets $0 $0 $21,950
Current LiabilitiesAccounts Payable $0 $0 $10,000Current Borrowing $0 $0 $500Other Current Liabilities (interest free) $0 $0 $10,900
Total Current Liabilities $0 $0 $21,400
Long-term Liabilities $0 $0 $3,550Total Liabilities $0 $0 $24,950
Paid-in Capital $0 $0 $100,000Retained Earnings $0 $0 ($103,000)Earnings $0 $0 $0Total Capital $0 $0 ($3,000)
Total Capital and Liabilities $0 $0 $21,950
Other InputsPayment Days 0 0 30Sales on Credit $0 $0 $900,000Receivables Turnover 0.00 0.00 63.38
Services
Main services provided by Web Services Provider are outlined below.
1. DSL. A Digital Subscriber Line (DSL) is high-speed Internet access that is an "on all the time" connection and ranges in speed from 144k to 6Gb transfer rate.
2. Hosting. Web hosting clients generally have the company place a single, or several, website on a server in our facility and pay for the amount of disk space that they need to operate their site.
3. Dedicated Server. Clients seeking to maximize the speed of their site due to high traffic or download will lease a dedicated server from Web Services Provider, leaving the maximum capability of the server all to their own site.
4. Co-location. Co-location customers provide the hardware themselves and administer their site or sites via the Internet.

When hosting and dedicated server clients are secured, orders will be processed immediately and the customer can be up and running within a few minutes. Dedicated server clients can be online within 1-2 hours unless a special server must be built.
Future Services
Having already established the relationships and infrastructure, Web Services Provider will continue to search for emerging and existing technologies to improve and expand lines of business. As advances in technology continue, Web Services Provider will upgrade to meet specific objectives of present and future clientele.
Web Services Provider plans to respond to market needs by keeping abreast of all new technologies and updates to be first to market using its already established lines of business as a market vehicle. Web Services Provider will move quickly on plans for next generation products/services.
Market Analysis Summary
Web Services Provider's key markets for DSL are small and medium businesses, nationwide. Web Services Provider's key markets for Web hosting and resale accounts are Web design firms, individuals, and small businesses with a need for space on a server. Web Services Provider's key markets for dedicated servers are small to large companies where security and speed are necessary. Web Services Provider's key markets for co-location include medium and small businesses such as online trading, e-tailers, online information sites, and entertainment companies.
Within these markets, Web Services Provider focuses on the more lucrative dedicated server and co-location clientele because they create less overhead and more profit than equal revenue generating, smaller clients. Additionally, these markets require less service-intensive efforts and create more profit. Its' margins are 40%-80% on larger and medium size clients.
Computer telephony integration (CTI) is the convergence of the telephone and computing industries. Currently, the CTI market totals $4 billion and is growing at 30% a year, with many segments growing at a rate of over 100% a year. The Washington-based MultiMedia Telecommunications Association estimates that the CTI market will grow by nearly 70% in the next year, and triple by the year 2000.
Consumers improve their shopping experiences
In a relatively short period of time, the Internet has provided the savvy consumer with a number of benefits, particularly convenience and information. Obviously, consumers who shop online face a much different experience than they would in "real-world" retail. First and foremost, a shopper need not leave the comfort of home or office in order to make a purchase. The convenience of online shopping has proven to be a big attraction for many consumers, particularly for goods that are not needed immediately, like books, CDs, or apparel.
The information that is currently available online is another boon to consumers. It is relatively easy to conduct research on various products over the Internet, giving consumers all the information they need to help make an informed decision regarding a major purchase.
Consumers can thoroughly research big-ticket items like cars, electronics, or computers for desired features, product performance, or price. The cost of a product has become simple to research through many search engines. A consumer need only specify a product, type it in the appropriate place on a comparison-oriented website, and then examine the resulting list of prices, which contains links to the selling websites. While consumers do not always purchase the lowest-priced item, the nature of the Internet makes comparison shopping so easy that prices in many categories of goods will undoutably decline over time.
Market Segmentation
Web Services Provider is aiming to establish itself in markets that it believes will define the future of Web hosting. The company is pursuing dedicated server and co-location accounts, online trading companies, and e-entertainment companies because they need bandwidth, 24-hour access for their customers, faster connections, and other services for their clients which the company able to provide.
The company's target customers are as follows.
Online E-trading.
Market Analysis
2000 2001 2002 2003 2004Potential Customers Growth CAGR
Online E-trading 15% 200,000 230,000 264,500 304,175 349,801 15.00%
Entertainment 10% 160,000 176,000 193,600 212,960 234,256 10.00% Global Corporations 15% 95,000 109,250 125,638 144,484 166,157 15.00%
Corporations 10% 100,000 110,000 121,000 133,100 146,410 10.00% Total 12.74% 555,000 625,250 704,738 794,719 896,624 12.74%

Entertainment. Global Corporations. Corporations.
The Internet
As of year-end 1998, almost 160 million users accessed the Internet regularly, up from approximately 101 million at the end of 1997, according to IDC, an industry analysis and research company. Clearly, the Internet is in an exceptional growth phase. This growth has pushed the capacity of existing networking infrastructure to its limits, resulting in frustration by Internet users.
Still, consumers have found the Internet to be a useful tool in the research and purchase of goods and services. Corporations have found that, while the Internet is challenging traditional business models, it also offers significant advantages to companies that fully embrace the medium.
Market Trends
Exceptional growth
By any measure, the Internet is one of the fastest-growing commercial phenomena ever witnessed by society. Host computers, or servers, have exploded from 3.2 million in 1994 to roughly 56.2 million as of July 1999. During the same time period, the number of websites roared to more than 5 million from only 3,000.
A key factor in the recent growth of the Internet is the popularity of the sub-$1,000 PC. Rapidly falling component prices have allowed PC manufacturers to pass cost savings on to their customers, resulting in a more attractively priced product. Computers sold at or below the $1,000 level have appealed to first-time PC users and lower income families. Because of the more affordable prices, PC penetration in the United States is now approximately 50%, according to Dataquest, a market research firm based in San Jose, California.
As a result of the Internet's historical roots in the U.S. Department of Defense, as well as the rising penetration of PCs, the United States accounts for more than half of the world's total Internet users. The European market, by contrast, has been held back by the high cost of Internet access. Consumers are typically billed twice in these markets, once by the ISP and once by the phone company. However, the forces of telecommunications deregulation in Europe finally appear to be having an effect, as several phone companies have recently eliminated access fees and now bill only on a per-minute basis. Such moves should eventually increase the penetration of the Internet in Europe.
In the United States, less than one-third of the population is connected, leaving plenty of room for growth. In 1996, people asked colleagues and friends if they had an electronic mail address. In 1997, people were asked what their electronic mail address was. When consumers today are asked why they purchased a personal computer, the most common answer is to connect to the Internet to get their email.
Market Growth
Bandwidth bottlenecks frustrate consumers...
Today's telecommunications network infrastructure was not designed for the booming traffic created by Internet use. Ordinary telephone lines are optimized for short conversations, whereas Internet users typically stay online for ours at a time. Growing corporate use of the Internet to communicate with suppliers and customers has put additional strains on the system.
Adding to the capacity problem are the use of multimedia attachments to email, more complex multimedia websites, larger files being downloaded by users, and other bandwidth-hungry applications. Although the predicted global meltdown of the Internet has not come to pass, delays in navigating the Web and in receiving email continue to plague the industry and frustrate users.
...But solutions are on the way
The vast majority of Internet users use dial-up modems to access the Internet through their ISPs. As a result of the capacity constraints inherent in using analog modem technology over copper wires, 56 kilobits per second is the maximum capacity available today for most residential customers.
New technologies, such as cable modems and digital subscriber line (DSL) systems, promise a quantum leap in bandwidth: up to 30 megabytes per second (Mbps) and 12 Mbps, respectively. Both technologies also offer an added advantage in that they are always "on": a consumer need not physically dial into an ISP to access the Internet.
Cable modems. The nascent market for cable modems is beginning to exhibit strong growth. The number of cable Internet service subscribers numbered more than 1 million as of July 1999, up from 500,000 in 1998.
The current leaders in this burgeoning market are Excite@Home and RoadRunner, North America's No. 1 and No. 2 cable modem services, respectively. RoadRunner is provided by ServiceCo LLC-a joint venture, led by time Warner Inc. that includes MediaOne Group, Inc., Microsoft Corporation, Compaq Corporation, and Advance/Newhouse Partnership, a private firm.
Digital subscriber lines. These systems allow telephone companies to offer faster service over copper wires by reducing signal distortion. The number of DSL subscribers was approximately 20,000 in 1998.
The fastest form of DSL is asymmetric digital subscriber line, or ADSL, includes Ameritech Corporation, SBC Communications Inc., Bell Atlantic Corporation, U S. WEST Inc., Sprint Corporation, MCI World Com Inc., and GTE Corporation.
In contrast to cable modems, which have been deployed in select regions for a few years, consumer-oriented DSL service is only now being rolled out more aggressively. Cable companies have also resolved their standardization issues and have come further in preparing their networks for broadband than have the telcos.
While the number of DSL subscribers should exhibit strong growth in 1999, it appears that cable modems will still command the bulk of the broadband market. One reason is that cable

modems have an inherent speed advantage. The consumer friendly version of ADSL, known as G.Lite, offers speeds of up to 1.5 Mbps, compared with top speeds of 30 Mbps for cable modems.
Limitations
Aside from bandwidth constraints, another more serious problem has recently been brought to light, which threatens to forestall the previously explosive growth of the Internet. According to a study conducted by the Department of Commerce, significant disparities continue to exist between certain demographic groups and regions with regard to Internet access. For example, those households with incomes of $75,000 or higher are more than twenty times as likely to have Internet access than those at the lowest income level.
The presence of such disparities would seem to limit the potential growth of the Internet, and would likely impact many of the market forecasts discussed in the "Industry Profile" section of this report. However, both government and businesses are aware of the problem and are currently taking steps to close this so-called "digital divide." The U.S. government plans to use community centers to increase access to the Internet for all Americans. Meanwhile, many businesses also plan to help educate and train individuals who may otherwise be at a disadvantage in today's increasingly technological workplace.
Far-reaching benefits
Although the Internet is still evolving as a medium for communications and commerce, it has already had a substantial impact on both consumers and businesses. For consumers, the advent of online shopping has brought greater convenience, while businesses have enjoyed productivity gains.
Competition and Buying Patterns
Competitive threats come from the more established hosting companies with large amounts of operating capital. Their weaknesses are, however, even with strong brand awareness, they cannot afford to move their facilities. This ties them to their current locations, which lack adequate bandwidth, speed, and reliability due to their connections through local telco connectivity.
DSL. Web Services Provider's competitors include other XDSL resellers.
Hosting. Web Services Provider's competitors include online Web hosting companies.
Dedicated Server. Web Services Provider's competitors include companies providing single site Web servers for increased speed and reliability.
Co-location. Web Services Provider's competitors include Web hosting companies offering customer or vendor provided large server or servers housed in their facilities and usually managed over the Internet by the custome
Marketing

Web Services Provider markets its products as solutions to high traffic and bandwidth-intensive Web companies whose online reliability and speed are critical to daily business. Target companies include online stock trading companies, e-tailers, and corporations with graphics and/or streaming video.
Sales are made through Web Services Providers' national advertising campaign. The sales process involves several steps which include:
1. The first contact when the perspective customers first impression is made while viewing one the magazines in which we advertise.
2. At this point, the customer will call our sales line or go to our website. 3. The customer can then call the sales line where a trained representative will answer
questions and proceed with initiating service and billing. This approach will be used because each customer's concerns and needs will be met immediately to capture the customer at this point of contact.
The average sales cycle from first contact to closing the sale is between one and seven days.

Sales Forecast2000 2001 2002
SalesAll Services $1,500,000 $4,500,000 $7,500,000 Other $0 $0 $0 Total Sales $1,500,000 $4,500,000 $7,500,000
Direct Cost of Sales 2000 2001 2002All Services $100,000 $150,000 $200,000 Other $0 $0 $0 Subtotal Direct Cost of Sales $100,000 $150,000 $200,000
Value Proposition
Web Services Provider's products and services offer the following advantages to customers.
Bandwidth. Reliability. Service. Flexibility.
Competitive Edge
Strategic alliance with VISP - VISP is opening up two new facilities in the next three months, one in Atlanta and the other in Seattle. Web Services Provider will have access space on both sites, and with special load-balancing software, will enable the company to guarantee 100% uptime for any dedicated server and co-location client where uptime is critical to their business.
AB 299 Internet Connection--more beneficial than tier system; a tier 1 connection means that you are actually directly connected to the Internet.
Downtime-Dynamic load balancing--a large part of the problem and downtime with an Internet connection for hosting companies is due to local phone company.
Price--due to the tier 1 connection, Web Services Provider does not have to pay local phone companies connection fees and, as such, its' prices are lower than those of competitors.
Marketing Strategy
The Web Services Provider strategy is to advertise key competitive advantages in an effective advertising campaign. The company plans to develop a larger clientele and maintain a price advantage through rapid growth. The company's goal in the next year is to grow its core customer base quickly and efficiently while focusing on the most profitable sector of the market. The company's goal in the 2-5 years is to grow through acquisitions of smaller companies and separate itself from the competition by price and services.

Distribution Strategy
Web Services Provider uses a direct sales force, relationship selling, and sales/support lines to reach its markets. These channels are most appropriate because each customer has special demands and needs to be treated differently. After the initial contact, by magazine, referral, or email, the customer is assessed and assigned a sales rep and tech support person to help them and to familiarize themselves with each individual company's needs and history.
Marketing Programs
The key message associated with the company's products and services is better reliability, speed, and bandwidth for the same price. The company's promotional plan is diverse and includes a range of marketing communications:
1. Public relations. Press releases are issued to both technical trade journals and major business publications such as Wall Street Journal, Business Week, and others.
2. Trade shows. Company representatives attend and participate in several trade shows such as Apex and Comdex.
3. Industry conferences and seminars, research publishing, and print media. Web Services Provider presents its key advantages at conferences and publishes articles about its work in publications such as e-business Advisor, Wired, Microsoft Internet Developer, Web Techniques, Business 2.0, and PC Computing. Local and national public relations will be handled by Creative Garage II's marketing firm.
4. Print advertising and article publishing. The company's print advertising program includes advertisements in technical trade publications such as E-business Journal, Wired, Web Techniques, Microsoft Internet Developer, Business 2.0, PC Computing, direct mail pieces, brochures, and other print media.
5. Internet. The company currently has plans to redevelop its current website because that is a primary marketing channel.
Strategic Alliances
The company has strategic alliances with VISP. This alliance is valuable because it provides a direct connection to an AB-299 Internet connection with unlimited bandwidth. This relationship is explored more in the Competitive Advantages section.
Management Summary
The company's management philosophy is based on responsibility and mutual respect. Web Services Provider has an environment and structure that encourages productivity and respect for customers and fellow employees.
Officers and Key Employees
Web Services Provider's management is highly experienced and qualified. Key members of the management team, their backgrounds, and responsibilities are as follows.
Michael Smith, President and CEO.
James Boyd, Vice President.

Personnel Plan2000 2001 2002
Marketing and Sales $150,000 $198,000 $254,000
Technical Services $150,000 $198,000 $254,000
Accounting $60,000 $99,000 $136,000 Administrative and HR $120,000 $132,000 $194,000
Total People 15 18 22
Total Payroll $480,000 $627,000 $838,000
Financial Plan
Funding Requirements and Uses
The company is raising significant new investment for the purpose of growth and operations. This funding will cover operating expenses and product development during this period.
Important Assumptions
The company operates as a Virginia Corporation. The following financial projection is based on sales volume at the levels described in the revenue section and presents, to the best of management's knowledge and belief, the company's expected assets, liabilities, capital, revenues, and expenses. The projections reflect management's judgement of the expected conditions and its expected course of action given the hypothetical assumptions.
The table below provides significant assumptions that drive the company's financial projections.
General Assumptions2000 2001 2002
Plan Month 1 2 3Current Interest Rate 10.00% 10.00% 10.00% Long-term Interest Rate 10.00% 10.00% 10.00% Tax Rate 25.42% 25.00% 25.42% Other 0 0 0

Break-even Analysis
The following chart and table provide the Break-even Assumptions for Web Services Provider.
Break-even Analysis
Monthly Revenue Break-even $106,438
Assumptions:Average Percent Variable Cost 7% Estimated Monthly Fixed Cost $99,342
Projected Profit and Loss
Web Services Provider is in the early stage of development, thus initial projections have only been made on accounts that are believed to most drive the income statement.


Pro Forma Profit and Loss2000 2001 2002
Sales $1,500,000 $4,500,000 $7,500,000 Direct Cost of Sales $100,000 $150,000 $200,000 Other $50,000 $50,000 $50,000 Total Cost of Sales $150,000 $200,000 $250,000
Gross Margin $1,350,000 $4,300,000 $7,250,000 Gross Margin % 90.00% 95.56% 96.67%
ExpensesPayroll $480,000 $627,000 $838,000 Sales and Marketing and Other Expenses $249,500 $453,000 $675,000 Depreciation $4,200 $4,500 $5,000 Repairs and Maintenance $12,000 $18,000 $30,000 Bank Charges $2,000 $2,000 $2,000 Insurance $6,000 $7,000 $8,000 Rent $40,000 $45,000 $48,000 Depreciation $14,400 $20,000 $20,000 Software $12,000 $15,000 $24,000 Product Development $300,000 $300,000 $400,000 Payroll Taxes $72,000 $94,050 $125,700 Other $0 $0 $0
Total Operating Expenses $1,192,100 $1,585,550 $2,175,700
Profit Before Interest and Taxes $157,900 $2,714,450 $5,074,300 EBITDA $162,100 $2,718,950 $5,079,300 Interest Expense $0 $0 $0 Taxes Incurred $39,802 $678,613 $1,289,718

Net Profit $118,098 $2,035,838 $3,784,582 Net Profit/Sales 7.87% 45.24% 50.46%
Projected Cash Flow
The chart and table below depict the projected cash flow for the company.
Pro Forma Cash Flow2000 2001 2002
Cash Received
Cash from OperationsCash Sales $0 $0 $0 Cash from Receivables $1,268,367 $4,008,333 $7,008,333 Subtotal Cash from Operations $1,268,367 $4,008,333 $7,008,333
Additional Cash ReceivedSales Tax, VAT, HST/GST Received $0 $0 $0 New Current Borrowing $0 $0 $0 New Other Liabilities (interest-free) $0 $0 $0 New Long-term Liabilities $0 $0 $0 Sales of Other Current Assets $0 $0 $0 Sales of Long-term Assets $0 $0 $0 New Investment Received $1,250,000 $0 $0 Subtotal Cash Received $2,518,367 $4,008,333 $7,008,333
Expenditures 2000 2001 2002
Expenditures from OperationsCash Spending $480,000 $627,000 $838,000

Bill Payments $835,682 $1,754,052 $2,786,959 Subtotal Spent on Operations $1,315,682 $2,381,052 $3,624,959
Additional Cash SpentSales Tax, VAT, HST/GST Paid Out $0 $0 $0 Principal Repayment of Current Borrowing $500 $0 $0 Other Liabilities Principal Repayment $10,900 $0 $0 Long-term Liabilities Principal Repayment $3,550 $0 $0 Purchase Other Current Assets $0 $0 $0 Purchase Long-term Assets $600,000 $300,000 $300,000 Dividends $0 $0 $0 Subtotal Cash Spent $1,930,632 $2,681,052 $3,924,959
Net Cash Flow $587,734 $1,327,281 $3,083,375 Cash Balance $590,184 $1,917,466 $5,000,840
Projected Balance Sheet
Projected Balance Sheets for 2000 - 2002 can be found in the table below, and in the appendices.
Pro Forma Balance Sheet2000 2001 2002
Assets
Current AssetsCash $590,184 $1,917,466 $5,000,840 Accounts Receivable $245,833 $737,500 $1,229,167 Other Current Assets $1,050 $1,050 $1,050 Total Current Assets $837,068 $2,656,016 $6,231,057
Long-term AssetsLong-term Assets $605,250 $905,250 $1,205,250 Accumulated Depreciation $5,200 $9,700 $14,700 Total Long-term Assets $600,050 $895,550 $1,190,550 Total Assets $1,437,118 $3,551,566 $7,421,607
Liabilities and Capital 2000 2001 2002
Current LiabilitiesAccounts Payable $72,019 $150,630 $236,089 Current Borrowing $0 $0 $0 Other Current Liabilities $0 $0 $0 Subtotal Current Liabilities $72,019 $150,630 $236,089

Long-term Liabilities $0 $0 $0 Total Liabilities $72,019 $150,630 $236,089
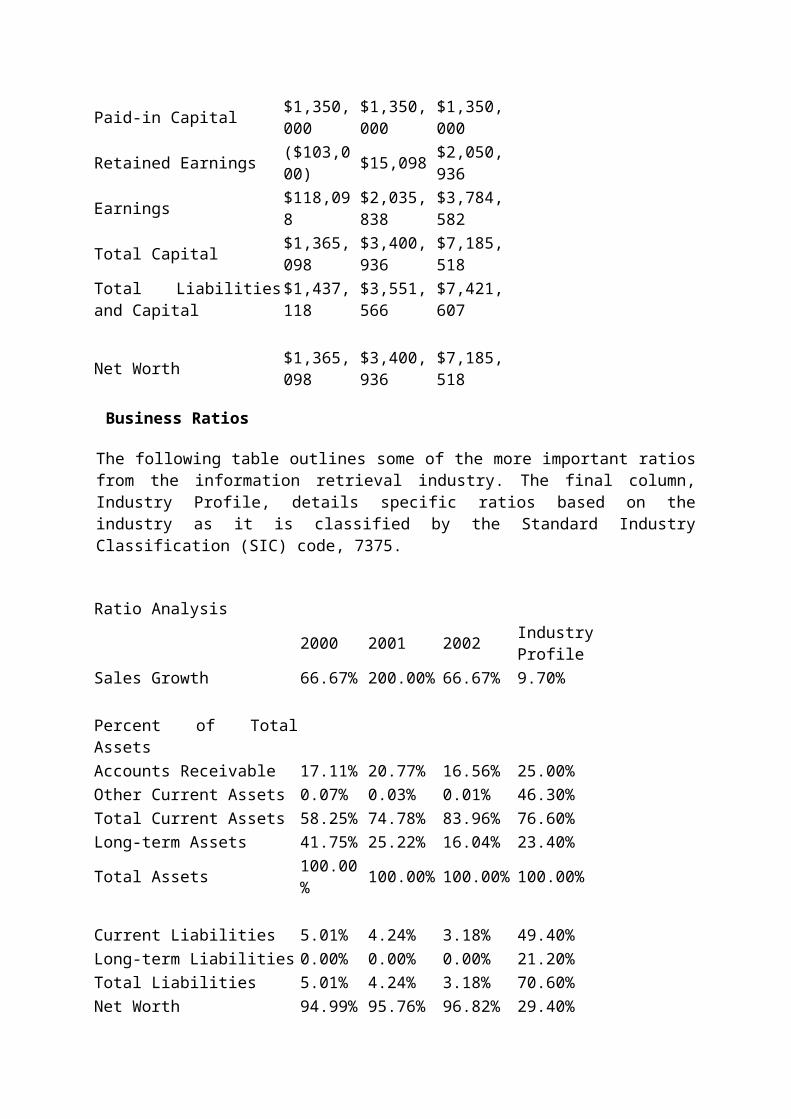
Paid-in Capital $1,350,000 $1,350,000 $1,350,000 Retained Earnings ($103,000) $15,098 $2,050,936 Earnings $118,098 $2,035,838 $3,784,582 Total Capital $1,365,098 $3,400,936 $7,185,518 Total Liabilities and Capital $1,437,118 $3,551,566 $7,421,607
Net Worth $1,365,098 $3,400,936 $7,185,518
Business Ratios
The following table outlines some of the more important ratios from the information retrieval industry. The final column, Industry Profile, details specific ratios based on the industry as it is classified by the Standard Industry Classification (SIC) code, 7375.
Ratio Analysis
2000 2001 2002 Industry Profile
Sales Growth 66.67% 200.00% 66.67% 9.70%
Percent of Total AssetsAccounts Receivable 17.11% 20.77% 16.56% 25.00% Other Current Assets 0.07% 0.03% 0.01% 46.30% Total Current Assets 58.25% 74.78% 83.96% 76.60% Long-term Assets 41.75% 25.22% 16.04% 23.40% Total Assets 100.00% 100.00% 100.00% 100.00%
Current Liabilities 5.01% 4.24% 3.18% 49.40% Long-term Liabilities 0.00% 0.00% 0.00% 21.20% Total Liabilities 5.01% 4.24% 3.18% 70.60% Net Worth 94.99% 95.76% 96.82% 29.40%
Percent of SalesSales 100.00% 100.00% 100.00% 100.00% Gross Margin 90.00% 95.56% 96.67% 0.00% Selling, General & Administrative Expenses 82.10% 50.31% 45.92% 78.10%
Advertising Expenses 14.13% 8.89% 8.00% 0.90% Profit Before Interest and Taxes 10.53% 60.32% 67.66% 1.90%
Main RatiosCurrent 11.62 17.63 26.39 1.57

Quick 11.62 17.63 26.39 1.19 Total Debt to Total Assets 5.01% 4.24% 3.18% 70.60% Pre-tax Return on Net Worth 11.57% 79.81% 70.62% 4.10% Pre-tax Return on Assets 10.99% 76.43% 68.37% 13.80%
Additional Ratios 2000 2001 2002Net Profit Margin 7.87% 45.24% 50.46% n.aReturn on Equity 8.65% 59.86% 52.67% n.a
Activity RatiosAccounts Receivable Turnover 6.10 6.10 6.10 n.aCollection Days 58 40 48 n.aAccounts Payable Turnover 12.46 12.17 12.17 n.aPayment Days 27 22 25 n.aTotal Asset Turnover 1.04 1.27 1.01 n.a
Debt RatiosDebt to Net Worth 0.05 0.04 0.03 n.aCurrent Liab. to Liab. 1.00 1.00 1.00 n.a
Liquidity RatiosNet Working Capital $765,048 $2,505,386 $5,994,968 n.aInterest Coverage 0.00 0.00 0.00 n.a
Additional RatiosAssets to Sales 0.96 0.79 0.99 n.aCurrent Debt/Total Assets 5% 4% 3% n.aAcid Test 8.21 12.74 21.19 n.aSales/Net Worth 1.10 1.32 1.04 n.aDividend Payout 0.00 0.00 0.00 n.a
Appendix
Sales ForecastJan Feb Mar Apr May Jun Jul Aug Sep Oct Nov Dec
SalesAll Services
0%
$125,000
$125,000
$125,000
$125,000
$125,000
$125,000
$125,000
$125,000
$125,000
$125,000
$125,000
$125,000
Other 0% $0 $0 $0 $0 $0 $0 $0 $0 $0 $0 $0 $0
Total Sales
$125,000
$125,000
$125,000
$125,000
$125,000
$125,000
$125,000
$125,000
$125,000
$125,000
$125,000
$125,000
Direct Jan Feb Mar Apr May Jun Jul Aug Sep Oct Nov Dec

Cost of SalesAll Services
$8,333
$8,333
$8,333
$8,333
$8,333
$8,333
$8,333
$8,333
$8,333
$8,333
$8,333 $8,337
Other $0 $0 $0 $0 $0 $0 $0 $0 $0 $0 $0 $0 Subtotal Direct Cost of Sales
$8,333
$8,333
$8,333
$8,333
$8,333
$8,333
$8,333
$8,333
$8,333
$8,333
$8,333 $8,337
Personnel PlanJan Feb Mar Apr May Jun Jul Aug Sep Oct Nov Dec
Marketing and Sales
0%
$12,500
$12,500
$12,500
$12,500
$12,500
$12,500
$12,500
$12,500
$12,500
$12,500
$12,500
$12,500
Technical Services
0%
$12,500
$12,500
$12,500
$12,500
$12,500
$12,500
$12,500
$12,500
$12,500
$12,500
$12,500
$12,500
Accounting
0%
$5,000
$5,000
$5,000
$5,000
$5,000
$5,000
$5,000
$5,000
$5,000
$5,000
$5,000
$5,000
Administrative and HR
0%
$10,000
$10,000
$10,000
$10,000
$10,000
$10,000
$10,000
$10,000
$10,000
$10,000
$10,000
$10,000
Total People 15 15 15 15 15 15 15 15 15 15 15 15
Total Payroll
$40,000
$40,000
$40,000
$40,000
$40,000
$40,000
$40,000
$40,000
$40,000
$40,000
$40,000
$40,000
General AssumptionsJan Feb Mar Apr May Jun Jul Aug Sep Oct Nov Dec
Plan Month 1 2 3 4 5 6 7 8 9 10 11 12
Current Interest Rate
10.00%
10.00%
10.00%
10.00%
10.00%
10.00%
10.00%
10.00%
10.00%
10.00%
10.00%
10.00%
Long-term Interest Rate
10.00%
10.00%
10.00%
10.00%
10.00%
10.00%
10.00%
10.00%
10.00%
10.00%
10.00%
10.00%
Tax Rate
30.00%
25.00%
25.00%
25.00%
25.00%
25.00%
25.00%
25.00%
25.00%
25.00%
25.00%
25.00%
Other 0 0 0 0 0 0 0 0 0 0 0 0
Pro Forma Profit and Loss

Jan Feb Mar Apr May Jun Jul Aug Sep Oct Nov Dec
Sales $125,000
$125,000
$125,000
$125,000
$125,000
$125,000
$125,000
$125,000
$125,000
$125,000
$125,000
$125,000
Direct Cost of Sales
$8,333
$8,333
$8,333
$8,333
$8,333
$8,333
$8,333
$8,333
$8,333
$8,333
$8,333
$8,337
Other $4,167
$4,167
$4,167
$4,167
$4,167
$4,167
$4,167
$4,167
$4,167
$4,167
$4,167
$4,167
Total Cost of Sales
$12,500
$12,500
$12,500
$12,500
$12,500
$12,500
$12,500
$12,500
$12,500
$12,500
$12,500
$12,504
Gross Margin
$112,500
$112,500
$112,500
$112,500
$112,500
$112,500
$112,500
$112,500
$112,500
$112,500
$112,500
$112,496
Gross Margin %
90.00%
90.00%
90.00%
90.00%
90.00%
90.00%
90.00%
90.00%
90.00%
90.00%
90.00%
90.00%
Expenses
Payroll $40,000
$40,000
$40,000
$40,000
$40,000
$40,000
$40,000
$40,000
$40,000
$40,000
$40,000
$40,000
Sales and Marketing and Other Expenses
$29,500
$20,000
$20,000
$20,000
$20,000
$20,000
$20,000
$20,000
$20,000
$20,000
$20,000
$20,000
Depreciation $350 $350 $350 $350 $350 $350 $350 $350 $350 $350 $350 $350
Repairs and Maintenance
$1,000
$1,000
$1,000
$1,000
$1,000
$1,000
$1,000
$1,000
$1,000
$1,000
$1,000
$1,000
Bank Charges $167 $167 $167 $167 $167 $167 $167 $167 $167 $167 $167 $167
Insurance $500 $500 $500 $500 $500 $500 $500 $500 $500 $500 $500 $500
Rent $1,250
$2,500
$2,500
$3,750
$3,750
$3,750
$3,750
$3,750
$3,750
$3,750
$3,750
$3,750
Depreciation
$1,200
$1,200
$1,200
$1,200
$1,200
$1,200
$1,200
$1,200
$1,200
$1,200
$1,200
$1,200
Software $1,000
$1,000
$1,000
$1,000
$1,000
$1,000
$1,000
$1,000
$1,000
$1,000
$1,000
$1,000
Product Develop
$25,000
$25,000
$25,000
$25,000
$25,000
$25,000
$25,000
$25,000
$25,000
$25,000
$25,000
$25,000

mentPayroll Taxes
15%
$6,000
$6,000
$6,000
$6,000
$6,000
$6,000
$6,000
$6,000
$6,000
$6,000
$6,000
$6,000
Other $0 $0 $0 $0 $0 $0 $0 $0 $0 $0 $0 $0
Total Operating Expenses
$105,967
$97,717
$97,717
$98,967
$98,967
$98,967
$98,967
$98,967
$98,967
$98,967
$98,967
$98,967
Profit Before Interest and Taxes
$6,534
$14,784
$14,784
$13,534
$13,534
$13,534
$13,534
$13,534
$13,534
$13,534
$13,534
$13,530
EBITDA $6,884
$15,134
$15,134
$13,884
$13,884
$13,884
$13,884
$13,884
$13,884
$13,884
$13,884
$13,880
Interest Expense $0 $0 $0 $0 $0 $0 $0 $0 $0 $0 $0 $0
Taxes Incurred
$1,960
$3,696
$3,696
$3,383
$3,383
$3,383
$3,383
$3,383
$3,383
$3,383
$3,383
$3,382
Net Profit
$4,574
$11,088
$11,088
$10,150
$10,150
$10,150
$10,150
$10,150
$10,150
$10,150
$10,150
$10,147
Net Profit/Sales
3.66% 8.87% 8.87% 8.12% 8.12% 8.12% 8.12% 8.12% 8.12% 8.12% 8.12% 8.12%
Pro Forma Cash FlowJan Feb Mar Apr May Jun Jul Aug Sep Oct Nov Dec
Cash Received
Cash from OperationsCash Sales $0 $0 $0 $0 $0 $0 $0 $0 $0 $0 $0 $0
Cash from Receivables
$7,100 $11,267
$125,000
$125,000
$125,000
$125,000
$125,000
$125,000
$125,000
$125,000
$125,000
$125,000
Subtotal Cash from
$7,100 $11,267
$125,000
$125,000
$125,000
$125,000
$125,000
$125,000
$125,000
$125,000
$125,000
$125,000

Operations
Additional Cash ReceivedSales Tax, VAT, HST/GST Received
0.00% $0 $0 $0 $0 $0 $0 $0 $0 $0 $0 $0 $0
New Current Borrowing
$0 $0 $0 $0 $0 $0 $0 $0 $0 $0 $0 $0
New Other Liabilities (interest-free)
$0 $0 $0 $0 $0 $0 $0 $0 $0 $0 $0 $0
New Long-term Liabilities
$0 $0 $0 $0 $0 $0 $0 $0 $0 $0 $0 $0
Sales of Other Current Assets
$0 $0 $0 $0 $0 $0 $0 $0 $0 $0 $0 $0
Sales of Long-term Assets
$0 $0 $0 $0 $0 $0 $0 $0 $0 $0 $0 $0
New Investment Received
$1,250,000 $0 $0 $0 $0 $0 $0 $0 $0 $0 $0 $0
Subtotal Cash Received
$1,257,100
$11,267
$125,000
$125,000
$125,000
$125,000
$125,000
$125,000
$125,000
$125,000
$125,000
$125,000
Expendi Jan Feb Mar Apr May Jun Jul Aug Sep Oct Nov Dec
tures
Expenditures from OperationsCash Spending
$40,000
$40,000
$40,000
$40,000
$40,000
$40,000
$40,000
$40,000
$40,000
$40,000
$40,000
$40,000
Bill Payments
$12,669
$79,859
$73,562
$73,594
$74,500
$74,500
$74,500
$74,500
$74,500
$74,500
$74,500
$74,500
Subtotal Spent on Operations
$52,669
$119,859
$113,562
$113,594
$114,500
$114,500
$114,500
$114,500
$114,500
$114,500
$114,500
$114,500
Additional Cash SpentSales Tax, VAT, HST/GST Paid Out
$0 $0 $0 $0 $0 $0 $0 $0 $0 $0 $0 $0
Principal Repayment of Current Borrowing
$500 $0 $0 $0 $0 $0 $0 $0 $0 $0 $0 $0
Other Liabilities Principal Repayment
$10,900 $0 $0 $0 $0 $0 $0 $0 $0 $0 $0 $0
Long-term Liabilities Principal
$3,550 $0 $0 $0 $0 $0 $0 $0 $0 $0 $0 $0

RepaymentPurchase Other Current Assets
$0 $0 $0 $0 $0 $0 $0 $0 $0 $0 $0 $0
Purchase Long-term Assets
$150,000
$30,000
$30,000
$150,000
$30,000
$30,000
$30,000
$30,000
$30,000
$30,000
$30,000
$30,000
Dividends $0 $0 $0 $0 $0 $0 $0 $0 $0 $0 $0 $0
Subtotal Cash Spent
$217,619
$149,859
$143,562
$263,594
$144,500
$144,500
$144,500
$144,500
$144,500
$144,500
$144,500
$144,500
Net Cash Flow
$1,039,481
($138,593)
($18,562)
($138,594)
($19,500)
($19,500)
($19,500)
($19,500)
($19,500)
($19,500)
($19,500)
($19,500)
Cash Balance
$1,041,931
$903,338
$884,776
$746,182
$726,683
$707,183
$687,683
$668,183
$648,684
$629,184
$609,684
$590,184
Pro Forma Balance SheetJan Feb Mar Apr May Jun Jul Aug Sep Oct Nov Dec
Assets
Starting Balances
Current Assets
Cash $2,450
$1,041,931
$903,338
$884,776
$746,182
$726,683
$707,183
$687,683
$668,183
$648,684
$629,184
$609,684
$590,184
Accounts Receivable
$14,200
$132,100
$245,833
$245,833
$245,833
$245,833
$245,833
$245,833
$245,833
$245,833
$245,833
$245,833
$245,833
Other Current Assets
$1,050
$1,050
$1,050
$1,050
$1,050
$1,050
$1,050
$1,050
$1,050
$1,050
$1,050
$1,050
$1,050
Total Current Assets
$17,700
$1,175,081
$1,150,221
$1,131,659
$993,066
$973,566
$954,066
$934,566
$915,067
$895,567
$876,067
$856,567
$837,068
Long-term AssetsLong- $5,25 $155, $185, $215, $365, $395, $425, $455, $485, $515, $545, $575, $605,

term Assets 0 250 250 250 250 250 250 250 250 250 250 250 250
Accumulated Depreciation
$1,000
$1,350
$1,700
$2,050
$2,400
$2,750
$3,100
$3,450
$3,800
$4,150
$4,500
$4,850
$5,200
Total Long-term Assets
$4,250
$153,900
$183,550
$213,200
$362,850
$392,500
$422,150
$451,800
$481,450
$511,100
$540,750
$570,400
$600,050
Total Assets
$21,950
$1,328,981
$1,333,771
$1,344,859
$1,355,916
$1,366,066
$1,376,216
$1,386,366
$1,396,517
$1,406,667
$1,416,817
$1,426,967
$1,437,118
Liabilities and Capital
Jan Feb Mar Apr May Jun Jul Aug Sep Oct Nov Dec
Current LiabilitiesAccounts Payable
$10,000
$77,407
$71,110
$71,110
$72,016
$72,016
$72,016
$72,016
$72,016
$72,016
$72,016
$72,016
$72,019
Current Borrowing
$500 $0 $0 $0 $0 $0 $0 $0 $0 $0 $0 $0 $0
Other Current Liabilities
$10,900 $0 $0 $0 $0 $0 $0 $0 $0 $0 $0 $0 $0
Subtotal Current Liabilities
$21,400
$77,407
$71,110
$71,110
$72,016
$72,016
$72,016
$72,016
$72,016
$72,016
$72,016
$72,016
$72,019
Long-term Liabilities
$3,550 $0 $0 $0 $0 $0 $0 $0 $0 $0 $0 $0 $0
Total Liabilities
$24,950
$77,407
$71,110
$71,110
$72,016
$72,016
$72,016
$72,016
$72,016
$72,016
$72,016
$72,016
$72,019
Paid-in Capital
$100,000
$1,350,000
$1,350,000
$1,350,000
$1,350,000
$1,350,000
$1,350,000
$1,350,000
$1,350,000
$1,350,000
$1,350,000
$1,350,000
$1,350,000
Retaine ($103 ($103 ($103 ($103 ($103 ($103 ($103 ($103 ($103 ($103 ($103 ($103 ($103,

d Earnings
,000) ,000) ,000) ,000) ,000) ,000) ,000) ,000) ,000) ,000) ,000) ,000) 000)
Earnings $0 $4,57
4 $15,661
$26,749
$36,899
$47,050
$57,200
$67,350
$77,500
$87,651
$97,801
$107,951
$118,098
Total Capital
($3,000)
$1,251,574
$1,262,661
$1,273,749
$1,283,899
$1,294,050
$1,304,200
$1,314,350
$1,324,500
$1,334,651
$1,344,801
$1,354,951
$1,365,098
Total Liabilities and Capital
$21,950
$1,328,981
$1,333,771
$1,344,859
$1,355,916
$1,366,066
$1,376,216
$1,386,366
$1,396,517
$1,406,667
$1,416,817
$1,426,967
$1,437,118
Net Worth
($3,000)
$1,251,574
$1,262,661
$1,273,749
$1,283,899
$1,294,050
$1,304,200
$1,314,350
$1,324,500
$1,334,651
$1,344,801
$1,354,951
$1,365,098