internet exchanges for used books - heinz collegertelang/used_book_paper.pdf · internet exchanges...
TRANSCRIPT

Internet Exchanges for Used Books: A and Welfare Impact
An ith,† and Rahul Telang†
mds, [email protected]
This Version: September 2005
Available from http://ssrn.com/abstract=584401
n Empirical Analysis of Product Cannibalization
indya Ghose, Michael D. Sm‡
Acknowledgements: The authors thank Al Greco, Paul Kattuman, Otto KoppiIvan Png, Susan Siegel, Hal Varian, Bruce Weber, Andy Whinston, and particiInternational Industrial Organization Conference, the 2004 International Confertion Systems, the 2004 INFORMS Annual Conference, the 2004 MISRC/CRITOthe Digital Divide, the 2003 International Conference on Information Systems,sity’s Kelley School of Business, the University of California at Davis, the Ne
us, Hank Lucas, pants at the 2005 ence on Informa-
Symposium on Indiana Univer-w York Univer-
sity’s Stern School of Business, and the Tepper School of Business and H. John Heinz School of P ents on this r stry Study Group, MIT Press, Pren-t luable information on the book industry. We also thank David Dewey, Samita Dhanasobhon, Steve Gee, Stoyan Arabadjiyski, Sumiko Hossain, Jae Hong Park, Nat Luengnaruemitchai, and Sriram Gollapalli for outstanding research assistance. Michael Smith acknowledges the generous financial support of the National Science Foundation through CAREER Award IIS-0448516. † H. John Heinz III School of Public Policy and Management, Carnegie Mellon University,
ublic Policy and Management at Carnegie Mellon University for valuable commesearch. The authors thank representatives of the Book Induice Hall Publishing, and various other publishers for providing va
Pittsburgh, PA, 15213. (Smith: 412-268-5978; Telang: 412-268-1155) ‡ Stern School, New York University, New York, NY, 10012. (212-998-0807)

Internet Exchanges for Used Books: An Empirical Analysis of Product Cannibalization and Welfare Impact
uct markets that n their brick-and-s caused concern
ong content creators and distributors, notably the Association of American Publishers and Au-ize new product
sed to empirical ucts cannibalize
roduct sales for books — one of the most prominent used product categories sold online. To do this, we use a unique dataset collected from Amazon.com’s new and used book market-
les. We then use re and consumer
ost of Amazon’s d book prices is book purchases. t Amazon’s new
book prices. Further, our estimates suggest that this increase in book readership from Amazon’s used book marketplace increases consumer surplus by approximately $67.21 million annually. This increase in consumer surplus, together with an estimated $45.05 million loss in publisher welfare and a $65.76 million increase in Amazon’s profits, leads to an increase in total welfare to
sed book markets at
Keywords: Publisher Welfare, Retailer welfare, Consumer Surplus, Price competition, Used Books Sales, Electronic Markets
ABSTRACT
Information systems and the Internet have facilitated the creation of used prodfeature a dramatically wider selection, lower search costs, and lower prices thamortar counterparts do. The increased viability of these used product markets haamthor’s Guild, who believe that used product markets will significantly cannibalsales.
This proposition, while theoretically possible, is based on speculation as oppoevidence. In this paper, we empirically analyze the degree to which used prodnew p
places to measure the degree to which used products cannibalize new product sathese estimates to measure the resulting first-order changes in publisher welfasurplus.
Our analysis suggests that used books are poor substitutes for new books for mcustomers. The cross-price elasticity of new book demand with respect to useonly 0.088. As a result only 16% of used book sales at Amazon cannibalize newThe remaining 84% of used book sales apparently would not have occurred a
society of approximately $87.92 million annually from the introduction of uAmazon.com.

1. Introduction
es practices can have r aggressive promotion of used
ill cut signifi-les, directly harming authors and publishers.”
Jeff Bezos (CEO
ay from the sale of wer-priced option
to higher sales of new y may not have other-
wise tried. In addition, when a customer sells used books, it gives them a budget to buy more new books.”
, 2002.
Globally networked Information Systems can reduce the search and transaction costs for buyers
), and can thereby facilitate the creation of
technology-mediated electronic exchanges (Malone, Yates, and Benjamin 1987). These ex-
changes allow sellers to easily reach a worldwide market, and allow buyers to easily locate items
Several papers in the literature have empirically analyzed the impact of lower search costs on
Brynjolfsson 2001,
Chevalier and Goolsbee 2003). In this paper, we empirically analyze the impact of lower con-
sumer search costs on product-level competition — specifically competition between new and
used books. The Internet facilitates the creation of side-by-side new and used product markets,
allowing consumers shopping for new products to easily locate competing used product offers.
“…as a leader in the bookselling industry, Amazon’s [used book] sala significantly deleterious effect on new book sales. If youbook sales becomes popular among Amazon’s customers, this service wcantly into sales of new titAuthor’s Guild and Association of American Publishers, Open Letter toAmazon.com), dated April 9, 2002
“We’ve found that our used books business does not take business awnew books. In fact, the opposite has happened. Offering customers a locauses them to visit our site more frequently, which in turn leadsbooks while encouraging customers to try authors and genres the
Jeff Bezos, open letter to Amazon.com’s used booksellers, dated April 14
and sellers to locate and trade products (Bakos 1997
that frequently would be unavailable in traditional physical stores.
retailer-level competition (e.g., Brynjolfsson and Smith 2000, Smith and
1
There is, of course, nothing new about the sale of used products. In the United States, the First
h as books, and
s alter the scale,
ucts. Thus, while
brick-and-mortar bookstores have high search costs, limited inventory capacity, limited geo-
graphical coverage, and relatively high prices, IT-enabled markets for used books offer low
— through com-
clearly attractive
ed book sales in
2004 (Wyatt 2005). This represents the highest Internet penetration for any physical product
Internet sales of
ers and authors.
can Publishers reason that since
search costs, in-
new book sales
and cut significantly into both publisher revenues and author royalty payments.
re the degree to
unobservable in
online markets. For example, Tedeschi (2004) quotes Paul Aiken, the Executive Director of the
Author’s Guild as saying “[t]here has always been used-book sales, but it’s always been a back-
ground noise sort of thing. Now it’s right there next to the new book on Amazon…We think it’s
not good for the industry and it has an effect, but we can’t measure it” (emphasis ours). Like-
Sale Doctrine (17 U.S.C. §109) allows for the resale of copyrighted works suc
used bookstores are common in physical settings. Rather, electronic exchange
scope, and efficiency of what is possible with regard to the sale of used prod
search costs, nearly unlimited (virtual) inventory capacity, global coverage, and
petition among sellers — relatively low prices. These market characteristics are
for consumers. Internet sales of used books made up an estimated 67% of all us
category that we are aware of, and compares to a penetration of only 12.7% for
new books.
These changes in used book sales have also raised concerns among publish
Groups such as the Author’s Guild and the Association of Ameri
authors and publishers are only paid for the initial sale of a product, the lower
creased selection, and lower prices of online used book markets will cannibalize
However, to date, the publishing industry has been unable to precisely measu
which used books cannibalize new book sales because key sales data have been
2

wise, Kelly Gallagher, chairperson of the Book Industry Study Group’s Research Committee ob-
ibalization of new books,
but we don’t have any accurate numbers” (emphasis ours, Publishing Trends 2004).
of the degree to
which used books cannibalize new book sales, and analysis of the resulting impact on publisher
welfare, consumer surplus, and social welfare. Our paper contributes to the literature in that,
sales from used
e the elasticity of
nges in new and
used product sales and overall surplus. This analysis also contributes to the literature by provid-
ing publishers and industry analysts with a methodology to conduct similar analyses based on
data that can be readily collected from Internet markets, which as noted above, is a capability
publishers and content creators have been lacking.
because it is one
of the most prominent used and new book marketplaces online (Brynjolfsson, Hu, and Smith
2003, Brynjolfsson and Smith 2000) and it lists new and used products side-by-side on their
cur as new book
eting used product offers. We use this market to
collect a unique dataset from Amazon.com’s new and used marketplaces documenting prices and
quantities sold for new and used books. Our data cover two samples: one collected from Septem-
ber 2002 to March 2003 and one collected from April to July 2004. Together these samples in-
clude 41,994 observations for 393 individual book titles.
serves “everybody has anecdotal evidence to show used books’ cann
Therefore, the motivation of this study is to provide direct empirical estimates
while a variety of analytic models have analyzed competition to new product
product markets, ours is the only paper we are aware of to empirically analyz
new product demand with respect to used product prices and the resulting cha
We use Amazon.com’s used book market as our setting to answer this question
product pages. This creates a setting where cannibalization is most likely to oc
purchasers can easily become aware of comp
3

Our data suggest that used books are not a strong substitute to new books for most of Amazon’s
used book prices
e new book pur-
emaining 84% of used book sales apparently would not have occurred at Amazon’s
This increased access to low priced (used) book titles increases consumer surplus by $67.21 mil-
nsumers has re-
und lower prices, consumers’ benefit from access to used book markets is nearly as
olfsson, Hu, and
With respect to retailer losses, our results show that without raising prices, book publishers lose
zon’s used book
2003.2 It is also
t any secondary revenue that might
ake into account
consumer resale
opportunities in the used marketplace (Ghose, Telang and Krishnan 2005).
overwhelmingly
positive. The consumer surplus gains and producer surplus losses, together with an estimated
customers. The cross-price elasticity of demand for new books with respect to
is only 0.088. As a result only 16% of used book sales at Amazon cannibaliz
chases. The r
new book prices.
lion annually. While much of the discussion of the value of the Internet to co
volved aro
large as consumers’ benefit from access to lower prices on new books (Brynj
Smith 2003).1
approximately $45.05 million annually in gross profit from the presence of Ama
markets. This represents approximately 0.3% of total publisher gross profits in
important to note that this figure does not take into accoun
accrue to authors from increased readership. Moreover, this number does not t
the possibility that publishers could raise their prices on new books as a result of
We also note that the overall impact of used book markets on social welfare is
1 Brynjolfsson, Hu, and Smith (2003) find that the consumer surplus gain from access to low new book prices on the Internet (versus brick-and-mortar stores) is between $100.5 million and $103.3 million annually. 2 The Book Industry Study Group (2004) places publisher revenue at $26.0 billion dollars and Brynjolfsson, Hu, and Smith (2003) place publisher gross margins at 60%.
4

$65.76 million increase in Amazon.com’s gross profit from the used book exchanges, suggests a
net welfare gain to society of approximately $87.92 million from these used book exchanges.
literature relevant
t markets to high-
light the importance of empirical measurements in determining the degree to which used prod-
ucts cannibalize new product sales. In Section 4, we compare the characteristics of the brick-and-
at the Internet may have a
significant effect on used book sales. We describe our data in Section 5 and present our empirical
ction 7.
2. Literature
Our research is related to different streams of extant work. The first stream of relevant literature
e difficulty of main-
e-inconsistency
it its residual
demand in future periods, then rational consumers would anticipate this behavior and price
would rapidly fall to the competitive level. The interrelationship between the markets for new
witz (1982). They
arket. Using the
dary markets
will force publishers to increase new good prices in order to extract the maximum possible profit
from the onetime sale of a new good. Further research in this area has shown that a monopolist
can avoid the commitment problem by leasing as opposed to selling (Bulow 1982), and that de-
preciation reduces the monopolist's incentive to cut price (Bond and Samuelson 1984). The main
The remainder of this paper proceeds as follows. In Section 2, we discuss the
to our present work. In Section 3, we develop an analytic model of used produc
mortar used book market to the Internet used book market to show th
model and results in Section 6. We discuss the implications of our results in Se
relates to implications of concurrent availability of new and used goods. Th
taining monopoly power on durable goods is due in part to the problem of tim
first pointed out by Coase (1972). Coase conjectured that if a firm were to explo
and used goods was pointed out by Benjamin and Kormendi (1974) and Liebo
argued that a monopolist can maintain market power by restricting the used m
textbook market as an example, Miller (1974) suggests that the opening of secon
5

argument of these papers is that second-hand markets need not hurt the manufacturer because
anticipate the resale value of their product and will increase the price of the
new good accordingly.
ndary markets also
create a substitution effect since new goods face competition from used goods (Anderson and
Ginsburgh 1994, Hendel and Lizzeri 1999). When considering the impact of used good markets
in competitive new good markets, upstream suppliers such as book publishers can benefit from
secondary markets under some conditions as shown by Ghose, Telang and Krishnan (2005).
to show that text-
book sell-through — new sales as a proportion of total sales — declines radically from 90% in
the first year of a textbook’s publication to 45% in the second year and 10% in the third year
2005). A more recent study also uses textbook data to
show that students are forward looking when making their purchases — and that their value of a
arket for a new
iques to estimate
hows that if the
is given by how
much the consumer would pay, or would need to be paid, to be just as well off after the price
change as they were before the price change. This measure corresponds to Hicks’ (1942) com-
pensating variation measure. To measure the welfare change from the introduction of a new
good, Hausman (1997a) modifies Hick’s measure by using the product’s “virtual price” — the
manufacturers will
A more recent stream of the literature uses analytic models to show that seco
Recent empirical work in the context of used goods has used aggregate data
(Greco 2005, p. 185-186 and Greco et al.
textbook declines when the release of a new edition will foreclose on the resale m
textbook purchase (Chevalier and Goolsbee 2005).
A third stream of literature relevant to our study is research developing techn
welfare effects from the introduction of new goods. Classic economic theory s
price of an existing good changes from p0 to p1, the resulting change in welfare
6

price that would set demand to zero — as p0 and the introductory price as p1. This technique has
Cheerios (Haus-
mith 2003). Re-
een used to analyze the welfare impact from online auction sites
Finally, our research draws on the literature relating to competition on the Internet (e.g., Bryn-
Scholten 2004),
in this literature
tion from Ama-
zon.com than Amazon does from Barnes & Noble (Chevalier and Goolsbee 2003). Various pa-
pers in this literature have also analyzed the own price elasticity for offers listed at shopbots,
njolfsson, Dick,
to -50 for a shopbot
l otherboards and memory modules sold by undifferentiated sellers. Elasticity
f information at
market place.
ets on welfare to
of a single pub-
lisher, S selling a new good through a retailer at a wholesale price of w, to a unit mass of con-
sumers. The book is new when it is marketed in period 1 and can be sold as used in period 2
when it undergoes some degradation in quality. The retailer opens a secondary (used book) mar-
ket where consumers can buy and sell used goods. Whenever a consumer sells the used book, the
been applied to measure welfare gains for new goods ranging from Honeynut
man 1997b) to increased product variety on the Internet (Brynjolffson, Hu and S
lated techniques have also b
(Bapna, Gank and Shumueli 2005).
jolfsson and Smith 2000; Clay, Krishnan and Wolff 2001; Baye, Morgan, and
and specifically the direct measurement of consumer price sensitivity. Papers
have shown that BarnesandNoble.com seems to face much stronger competi
finding elasticity measures ranging from -6 to -10 for shopbots listing books (Bry
and Smith 2004) and PDAs (Baye et al. 2004) sold by differentiated sellers
isting computer m
measures at Internet shopbots are relevant for our study because the display o
these services is comparable to the information display in Amazon’s used book
3. Theoretic Analysis
In this section, we develop a model to analyze the impact of secondary mark
publishers, retailers, and consumers. Our model spans two periods and consists
7

retailer gets a commission k per used good sold while the rest (1-k) is the gain to the consumer.
ok sale price) to
each used book seller while the remaining 85% of the used book sale price goes to the consumer.
For example, Amazon charges a 15% commission (as a fraction of the used bo
Further, let q be a consumer's valuation for a good, where ]1,0[~ Uθ . The type
ity, let 1 denote the quality of the new good and q deno
parameter q in-
dicates a consumer's marginal valuation for quality. For any given quality, a consumer with a
higher q is willing to pay more for the product than one with a lower q. Without loss of general-
te the quality of the used good, where 0 <
q < 1; thus q can be interpreted as the degree of quality degradation of new book. If a consumer
The game is modeled as a multi-stage process across a single period. First the retailer chooses an
optimal new good price given the per unit wholesale price w of the supplier. Then market forces
nsumers demand
ward induction.
3.1. No Secondary Electronic Market
We begin by modeling the case where only new goods are sold in the marketplace. We denote
the price of the new good in the absence of a used good market as PN. Thus, consumers buy a
they get positive surplus; i.e., as long as q - PN > 0. Hence, the demand for a
new book is DN (PN) =
purchases a book of quality q at price p, her utility is U(q) = qq - p.
determine the optimal price of used goods from clearance conditions. Finally, co
is realized. We consider a Subgame Perfect Equilibrium of this game using back
N−=− 11 θ
new book as long as
P . Under these conditions the profit of the publishe
))(1()(* wPPwPD NNNNR −−=−=π . (2)
r is,
pS = (1)
and profit to the retailer is
wPwD NN )1(* −=
8
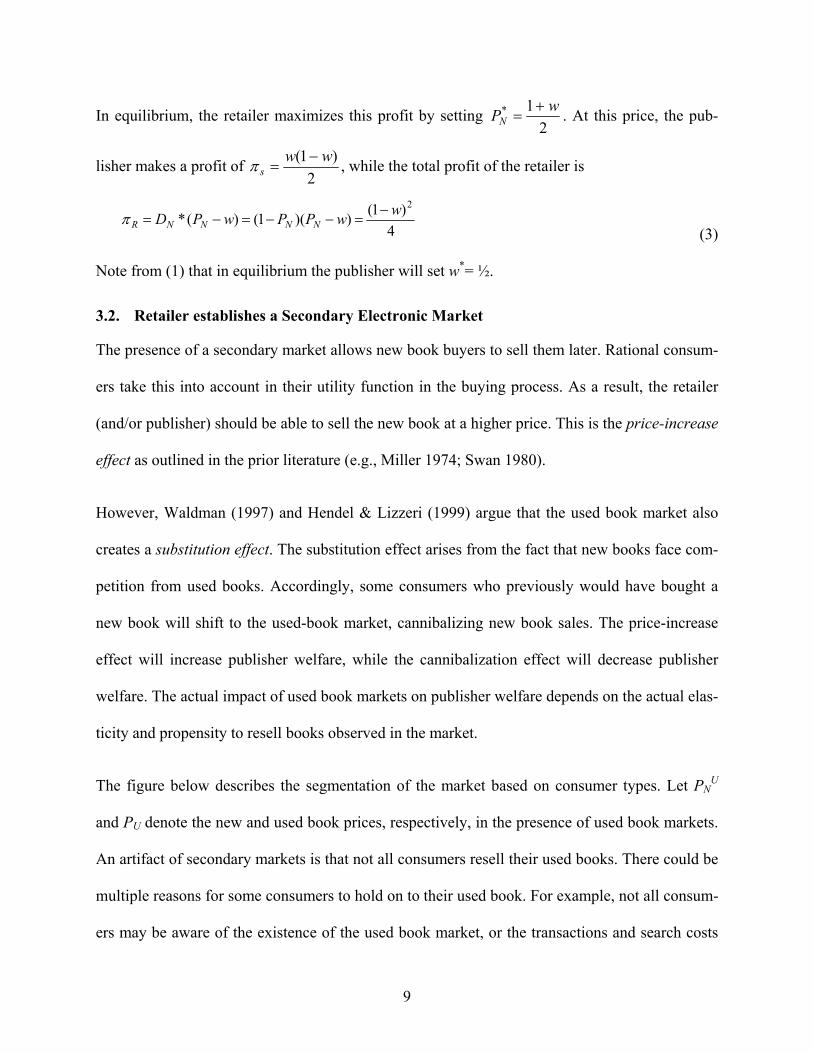
In equilibrium, the retailer maximizes this profit by setting 2
*PN1 w+
= . At this price, the pub-
lisher makes a profit of 2s =π )1( ww − , while the total profit of the retailer is
)1( w− 2
4))(1()(* wPPwPD NNNNR =−−=−=π
(3)
Note from (1) that in equilibrium the publisher will set w*= ½.
ational consum-
uying process. As a result, the retailer
e price-increase
ook market also
books face com-
ld have bought a
nnibalizing new book sales. The price-increase
ase publisher
n the actual elas-
ticity and propensity to resell books observed in the market.
PNU
and PU denote the new and used book prices, respectively, in the presence of used book markets.
An artifact of secondary markets is that not all consumers resell their used books. There could be
multiple reasons for some consumers to hold on to their used book. For example, not all consum-
ers may be aware of the existence of the used book market, or the transactions and search costs
3.2. Retailer establishes a Secondary Electronic Market
The presence of a secondary market allows new book buyers to sell them later. R
ers take this into account in their utility function in the b
(and/or publisher) should be able to sell the new book at a higher price. This is th
effect as outlined in the prior literature (e.g., Miller 1974; Swan 1980).
However, Waldman (1997) and Hendel & Lizzeri (1999) argue that the used b
creates a substitution effect. The substitution effect arises from the fact that new
petition from used books. Accordingly, some consumers who previously wou
new book will shift to the used-book market, ca
effect will increase publisher welfare, while the cannibalization effect will decre
welfare. The actual impact of used book markets on publisher welfare depends o
The figure below describes the segmentation of the market based on consumer types. Let
9

faced by some consumers could be sufficiently large that they don’t have an incentive to partici-
proportion a of
ected revenue from a used
book sale quivale k)PU) realized by consumers is a(1-k)PU, where )1,0(∈
pate in the used book markets. In short, the net utility to some consumers from keeping the book
might exceed that from selling it. To account for this fact, we assume that only a
new good buyers eventually sell their used goods.3 Hence, the exp
(which is e nt to (1- α .
ding expected utilities derived from various strategies are as follows:
(i) Buy new good and sell it: q - PNU + a(1-k) PU
U
(iii) Buy nothing: 0
ers wait and buy
used goods later. It is important to recognize that, in our model, the number of consumers in
equalize demand
and supply of used goods at all times. The new profit of the publisher is given by
pSU = DN
U wU = (1-θ1)wU (4)
where DNU denotes the demand for new books in the presence of used books. Similarly, profits
for retailer can be written as
. (5)
1 q1 q2 0
Buy New and SellBuy Used Buy Nothing
Hence, the correspon
(ii) Buy used good: q q- P
Thus, higher valuation consumers buy new goods and lower valuation consum
these groups emerges endogenously. This ensures that clearance conditions will
kPwPkPDwPD UUU
NUUUU
NU
NU
R )())(1()( 211 θθθπ −+−−=+−=
3 We do not model flows within the used book markets, i.e. used book consumers who resell their used books.
10

Here the DU is demand for the used books. Note that retailers, like Amazon, also enjoy the bene-
to publishers. Thus, in general,
By comparing (1) and (4), we get the publisher’s loss/gains from the establishment of used book
market as:
pSU- pS = DN
U wU – DN w = (DNU – DN) w + (wU- w) DN
U (6)
S
substituting RU for (PNU – wU
R R N N
publisher welfare. On one ha
lisher welfare. On the other
effects dominates depends on
elasticities of demand obser
studied in the analytic literat
fits of increased used book sales on its marketplace through the commission k that it charges to
used-book sellers. This used book demand effect is not available
retailers are more likely to benefit from used book markets than publishers are.
t
imilarly, for the retailer, th
p U - p = D U RU – D R
Thus, consistent with the pri
consumer willingness to pay
sitivity of consumers to used
4 There may be other potential effemarket may provide more incentiveual effects (like customer heterogenlimitation of our study.
Substitution effec
)
U U N
nd, used books cann
hand, the presence o
the actual behavior
ved in the market.4
ure, we are aware of
e loss/gain from the
and R for (PN – w) a
+ D kP = (D U – D
or literature, used bo
for new books, and
book prices, which
cts which can impinge ups for users to buy other neity) is not possible in ou
11
Price increase effect
et (after
aring (2) and (5)) is given by
N N U PU (7)
establishment of the used book mark
nd comp
) R + (RU - R) D U + D k
t Used-book demand
Substitution effecibali
f the
of cu
Howe
no p
ok m
as a
can b
on theew bor setti
Price increase effect
ailing effects on
ze the sales of new books, reducing pub-
used book market may lead to increased
ich of these two
stomers in the market — notably the sen-
n- and cross-price
ver, while these effects have been well
apers in the empirical literature that have
arkets have two counterv
result higher prices. Wh
effect
e measured by the ow
outcome as well (for example, the secondary oks). However, identifying disaggregate individ-ng, due to lack of appropriate data and this is a

directly measured them. Moreover, as noted above, direct estimates of the cannibalization of new
asure for publish-
contribution of our research is to develop and implement a method-
5
To do this we note that the relevant prices and margins in (6) and (7) can typically be observed
through secondary sources. Likewise, recent research results (Brynjolfsson, Hu, and Smith 2003)
can shed light on Amazon’s used book sales (DU). However, the substitution effect cannot be
measured directly. To measure this effect we note that under the standard definition of elasticity
∆Q
books by used markets is a very important — and currently unavailable — me
ers and authors. Thus, a key
ology for creating these measures.
(η =∆P
PQ
), the substitution effect can be measured as:
DNU − DN = ∆Q = DN ×η × N U
PU
This shows that measuring the cross-price elasticity
PU − P
N
(8)
of new book demand with respect to used
book prices (η) is critical to being able to measure the substitution effect, and therefore the
menting a meth-
cally depends on
rease effect, and
theoretical model
provides us with key measures that need to be quantified in order to assess the benefits of used
book markets to different parties involved in these transactions. Hence, in our empirical analysis
change in publisher and retailer surplus. One contribution of our work is imple
odology to measure this elasticity in the context of Internet sales.
Thus, the key insight from this model is that the extent of gains (and losses) criti
the effects outlined in (6) and (7). However, the substitution effect, price inc
used book demand effects are inherently empirical in nature. Therefore, the
5 In the Appendix, we calculate optimal values of PU, PN and the profits of the retailer and publisher. This shows that for a wide range of parameter values retailers tend to benefit from the used book markets while the publishers tend to lose. Our model does not consider competition between retailers and assumes specific functional forms for differ-ent parameters in the utility function and the results should be interpreted in the context of these assumptions.
12

we estimate the extent of substitution effect (or cannibalization effect) and extent of used book
the gains (and losses) to publishers and
retailers based on real-world data from an Internet used book market.
As noted above, there is nothing new about the sale of used books. Rather, what changes on the
Internet is a radical increase in the variety of used books offered for sale, a radical decrease in
osts for consum-
in June 2004 we
r Books in Print
listings, and 30 randomly selected books from the 2002 New York Times bestseller lists. These
ly be available in
physical bookstores, and they contain a mix of popular and less popular titles.
py was available
t of print and did
not have new copies available from Amazon itself. Moreover, there were an average of 22.6
competing used book offers for each random book, and an average of 241.3 competing offers for
lers. These multiple offers create competition among sellers
to lower their prices. As a result, the random books have an average 40.1% discount off the new
book list price and the former bestsellers have an average 84.5% discount off list price. As a
point of comparison, Amazon’s new books had an average 9.1% and 30% discount off list price
for these random and former bestselling titles.
demand effect. With this information, we then quantify
4. Analysis of Brick-and-Mortar versus Internet Used Book Markets
the prices of these used books, and a radical decrease in the associated search c
ers to locate these used books. To illustrate the magnitude of these changes,
generated a list of 30 randomly selected books from the October 2002 Bowke
lists are useful because they are old enough to include books that would general
We searched for these books at Amazon.com and found that at least one used co
for each of the 60 books we sampled — even though 13 of the books were ou
each former New York Times bestsel
13

To understand how the used title selection at Amazon would compare to the selection of a typical
ortar used book-
n.” Three of the
d Books, carried
none of the random books and only six of the former bestsellers. Moreover, Amazon’s used price
s.
bookstore in the
gs the inventory
listings, Powell’s
Books of Portland, Oregon had the best selection of any of these 7,680 booksellers for the books
in our sample — but still only carried 11 of the 30 random titles and 29 of the 30 former best-
sellers. Moreover, the used price at Amazon averaged 38% ($4.93) lower than the Powell’s price
on the random books and 67% ($7.03) lower than the Powell’s price on the former bestsellers.
cate a book, sig-
nificantly larger selection (both in terms of availability and the number of competing offers), and
dramatically lower prices than they are likely to find at their local used bookstore (even if they
ecause new and
used books are listed side-by-side in many Internet markets, new book shoppers can more easily
of used book offerings than they could in a typical brick-and-mortar bookstore,
and might be tempted by the wide selection and low prices to buy a used book instead of a new
book. Together, these factors may be what is driving the penetration of used book sales through
brick-and-mortar used bookstore, we searched the catalogs of four brick-and-m
stores in the Pittsburgh area advertising themselves as having a “general selectio
four stores did not carry any of the 60 books on our list. The fourth, Eljay’s Use
was an average of 75% ($8.16) lower than the price at Eljay’s for these six book
As another point of comparison, we used ABEbooks.com to search for the used
United States with the widest selection of titles in our sample. ABEbooks catalo
of 7,680 used booksellers in the United States.6 According to ABEbooks’
Thus, a used book shopper at Amazon.com would have lower search costs to lo
are fortunate enough to live close to Powell’s Books in Portland). Moreover, b
become aware
6 As a point of comparison, Siegel and Siegel (2004) estimate that there are between 8,000 to 10,000 used booksell-ers in the United States.
14

the Internet channel: used book sales are growing at a rate of 30% per year (Wyatt 2005) and ac-
67% of all used
ison, new book sales on the Internet ac-
counted for only 12.7% of total book sales in 2003 (Rappaport 2004).
5. Data
Our data are compiled from publicly available information on new and used book prices and
ated Perl scripts
collected in two
r 2002 to March
2003 and includes 273 individual book titles. This panel of books includes an equal number of
books from each of five major categories — New York Times best sellers, former New York
d “New and Up-
the current New
re removed from
the list. Former bestsellers were selected at random from the full list of books appearing in New
York Times bestseller listi Computer bestsellers and new and upcoming
, bestselling text-
[Insert Figures 2 and 3]
In early 2004 Amazon.com added a new variable to their XML data feed to developers, allowing
us to obtain accurate measures of their used book sales (which we describe in more detail be-
low). At this point, we created a similar sample of books, drawing 40 books from each of four
counted for 54.4% of all used book sales in 2003 (Siegel and Siegel 2004) and
book sales in 2004 (Wyatt 2005). As a point of compar
sales ranks at Amazon.com (Figures 2 and 3). The data are gathered using autom
to access and parse HTML pages downloaded from the retailer. The data were
separate samples. The first was collected over a 180-day period from Septembe
Times best sellers, Amazon Computer best sellers, best selling Text Books, an
coming Books.” New York Times bestsellers were selected at random from
York Times list at the beginning of the sample, and were replaced as they we
ngs in the year 1999.
books were selected at random from the respective list at Amazon.com. Finally
books were selected from the facultyonline.com bestseller list.
15

categories: current bestsellers, former bestsellers, new and upcoming, and random. New and up-
ormer bestsellers
selling books in
titles listed in the
“browse” section (which we believe includes all titles offered for sale by Amazon). In this sam-
ple, we dropped 15 books (10 random titles and 5 former bestsellers) that were out of print and
therefore did not have new Amazon prices. These data were collected over an 85-day period
from April to July 2004. Our total data sample includes 41,994 observations of 393 titles.
ok price, and the
book prices charged by Amazon.com marketplace sellers. Our marketplace data include the
price, condition, and seller rating for each used book listed for sale. Book condition is self-
reported by the seller and can be either “like new,” “very good,” “good,” or “acceptable.” We
also collect the seller rating for each used bookseller, which is a 1-5 star measure of the reported
In addition to these variables, in the second sample we were able to use Amazon’s XML data
feed to collect the number of used books sold. We do this by using the unique product identifier
ded to the XML
the second half
hen an identifier
that appeared in the previous collection period does not appear in the current collection period’s
XML listings. We collected this data once every 2 hours for books with a sales rank lower than
10,000, and every 6 hours for all other titles. In our empirical estimates below, for sessions
where multiple sales are observed in between two collection periods (11% of the sessions in our
coming books were selected in the same way as the first sample. Current and f
were drawn from the current list of Amazon bestselling books and Amazon’s top
2002. Finally, random books were selected at random from all Amazon.com
For each sample, we collect data on the Amazon.com sales rank and new bo
experiences of prior buyers with each seller.
for each product listed in the used book market. This unique identifier was ad
feed sometime between March 2003 and April 2004, making it only available in
of our sample. Using this product identifier, we infer that a sale has occurred w
16

sample), we assume that the books were sold in order of price. This is consistent with the strong
assumption is in-
emand and mean
that our consumer surplus r bound on the true consumer surplus gain.
: a istics
ach seller at the
te two additional
variables: a dummy variable identifying when a particular seller has zero lifetime ratings, and a
dummy variable for the top ten sellers in our sample on the basis of the most lifetime ratings.8
Table 1 lists summary statistics for our data. All prices represent the lowest price for each ISBN.
preference we observe in our data for low priced books. To the extent that this
correct, it will inflate our estimates of the own price elasticity of used book d
estimates represent a lowe
Table 1 Summ ry Stat
Mea St Min Amazon Rank 4 69 8,2 1 2,556,35
641,99 74,1 23 83
List Price 41,994 60 30 5.99 299.9930. .05Amazon Price 41,994 04 26 1.95 209.9924. .47Best “Like New” Used Price 2 16 21 0.01 194.25 41,49 15. .32Best “Very Good” Used Pric 33,517 26 18.41 0.01 207.60e 11.Best “Good” Used Price 9 24 16 0.01 200.0031,93 11. .42
Finally, for the second sample, we collect the number of lifetime ratings for e
start of our data collection.7 From the number of lifetime ratings, we genera
Seller Rating 41,994 3.97 1.65 1
Days Since Release 41,994 717.87 1,336.94 1 21,235
7 This variable was constructed on April 13, 2005, one year after the start of the collection of the second sample, by subtracting the number of seller ratings over the most recent 365 days from their lifetime number of seller ratings. 8 These were exclusively large, professional, used booksellers. Powells.com and ABEBooks.com were the top two booksellers in our list in terms of the most lifetime ratings.
Variable Obs. n . Dev. Max
Best “Acceptable” Used Price 20,368 7.86 15.70 0.01 222.35Best Used Price (All Conditions) 41,994 13.14 19.16 0.01 151.95
5Count of Used Books 41,994 81.15 131.78 1 753
17

6. Results
n the Internet be-
y sold was gener-
map the observ-
able Amazon.com sales rank to the corresponding number of books sold. In both cases, the au-
thors find on a stable relationship between the ordinal sales rank of a book and the cardinal num-
ber of sales, using roughly the following Pareto relationship:
6.1. Sales Rank to Quantity Calibration
Until recently it was difficult to calculate the price elasticity for products sold o
cause, while the price of individual items could be readily observed, the quantit
ally unobservable. Two recent papers address this problem, providing a way to
Quantity = δ ⋅ Rankβ (9)
Chevalier and Goolsbee (2003) calibrate this relationship using a creative and easily executed
experiment where the authors obtain a book with a known number of weekly sales, purchase
several copies of the book in rapid succession from Amazon.com, and track the Amazon sales
rank before and shortly after their purchase. Using these two points, they estimate β=-0.855.9
ted by Weingar-
Brynjolfsson, Hu and Smith (2003) calibrate this relationship using data from a publisher map-
ping the Amazon sales rank to the number of copies the publisher sold to Amazon in the summer
of 2001. The data include weekly sales and rank observations for 321 books with sales ranks
y estimate β = -0.871.
They also estimated this parameter from similar sales-rank experiments conduc
ten (2001) and Poynter (2000) as -0.952 and -0.834 respectively.
ranging from 238 to 961,367. Using these data the
9 Note that the θ reported by Chevalier and Goolsbee corresponds to –1/β.
18

For the purposes of this paper, we will use Brynjolfsson, Hu, and Smith’s estimate because is
owever, our results are
not particularly sensitive to this choice versus one of the other estimated parameter values.
tastes for popu-
lar and obscure books do not change. Increases in sales over time (holding tastes constant) will
only shift the δ parameter, a scaling parameter that does not impact our elasticity calculations.
om the introduc-
r estimate as the sales-
and Smith (2003)
We also empirically confirmed that during the time of our study Amazon’s sales rank was calcu-
10 To do this, we
course of several
een 596,625 and
606,439, and based on the movement of the rank, the book appeared to have 1 sale every 2
weeks. Having established the initial rank of the book, we then listed five used books for this ti-
r 23, 2002 using
5 different Amazon.com buyer accounts. The sales rank before we made the purchase was
0 when it increased to 601,457. On October 30, we
purchased 5 copies of the new book using the same Amazon accounts and the next morning the
sales rank was 4,647. We infer from this marketplace sales were not included in Amazon’s sales
based on 861 data points as opposed to 2 data points in the experiments; h
Note that the β parameter will be stable over time as long as customers’ relative
Also note that any shifts in customer preferences for new books that resulted fr
tion of used book marketplaces would be incorporated into our paramete
rank data used by both Chevalier and Goolsbee (2003) and Brynjolfsson, Hu,
were gathered well after the December 2000 introduction of Amazon’s used marketplace.
lated based only on new book sales as opposed to new and marketplace sales.
located a book with a high sales rank and observed the rank of this title over the
weeks. During our observation period, the sales rank of the book varied betw
tle in Amazon’s used book marketplace and purchased them on Monday, Octobe
599,352 and it remained stable until October 3
10 On or about October 14, 2004 Amazon changed the way it calculates sales rank, and now appears to include both new and marketplace (e.g., used) sales in the sales rank calculation.
19
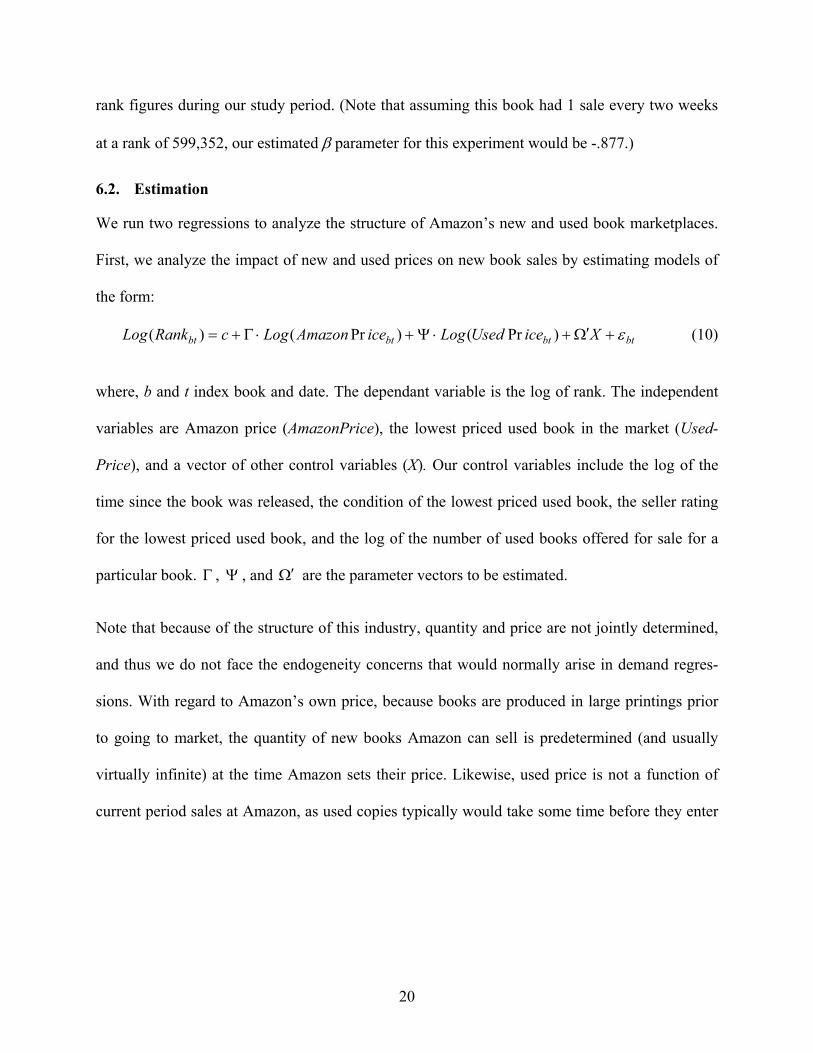
rank figures during our study period. (Note that assuming this book had 1 sale every two weeks
at a rank of 599,352, our estimated β parameter for this experiment would be -.877.)
ok marketplaces.
First, we analyze the impact of new and used prices on new book sales by estimating models of
the form:
6.2. Estimation
We run two regressions to analyze the structure of Amazon’s new and used bo
btbtbtbt εXiceUsedLogiceAmazonLogcRankLog +Ω′+⋅Ψ+⋅Γ+= )Pr()Pr()(
where, b and t index book and date. The dependant variable is the log of rank.
variables are Amazon price (AmazonPrice), the lowest priced used book in th
(10)
The independent
e market (Used-
Price), and a vector of other control variables (X). Our control variables include the log of the
time since the book was released, the condition of the lowest priced used book, the seller rating
for the lowest priced used book, and the log of the number of used books offered for sale for a
particular book. Γ , Ψ , and Ω′ are the parameter vectors to be estimated.
ntly determined,
and thus we do not face the endogeneity concerns that would normally arise in demand regres-
sions. With regard to Amazon’s own price, because books are produced in large printings prior
to going to market, the quantity of new books Amazon can sell is predetermined (and usually
virtually infinite) at the time Amazon sets their price. Likewise, used price is not a function of
current period sales at Amazon, as used copies typically would take some time before they enter
Note that because of the structure of this industry, quantity and price are not joi
20

the used book market. This follows the standard approach taken in the literature for demand
estimation of Internet book sales (see for example Chevalier and Goolsbee (2003)).
lace offers shown
to purchase. Be-
cause of this, we can use the multinomial logit model (Ben-Akiva and Lerman 1985, Guadagni
and Little 1983) to determine the sensitivity of customers to the parameters of the offered prod-
ucts. Speci customers
maximize an indirect utility function of the form:
11
For the second regression, we use the fact that we observe each of the marketp
to Amazon’s used book customers along with the offer each customer chose
fically, under the multinomial logit model we assume that used book
u = z θ + εij j ij (11)
where uij represents the utility of user i for offer j, which is a linear combination of the observed
product characteristics (z) and their associated parameters (θ) and a mean zero random distur-
bance (εij). Under the assumption that ε follows a type-I extreme value distribution, if consum-
ers select the offer that maximizes their utility, then the conditional probability that offer j will be
ij
Pj = j
r=1
selected is given by a standard multinomial logit equation:
exp(z θ)
exp(zrθ)J∑
(12)
Table 2 presents regression results of the impact of new and used price on sales rank (equation
odel, we use OLS with book-level fixed effects. Models 1-4 in Table 2
progressively add control variables to check the stability of our parameters of interest. Note that
the parameters of interest (Amazon and used prices) have the expected signs (recall that an in-
10). To estimate this m 12
11 Note that observation of book-level price changes for both new and used titles suggests that prices changes are uncorrelated with demand factors. Note also that we also include count of used book to control for the supply of used books across time and books. 12 The use of book-level fixed effects is equivalent to a first differences approach.
21

crease in sales rank implies a decrease in sales), are precisely estimated, and the parameter esti-
suggesting that the esti-
mates are robust and th ant problem in the model. 13
Ta e N M
mates and associated standard errors are stable across specifications,
at multi-collinearity is not a signific
ble 2: R sults for ew Book arket
Ind 1 2 3
(0.161) -2.067*(0.161)
-2.078(0.161
(0.048) 1.347**(0.048)
1.347(0.04
Ln(Min. Used Price) -0.105** *
** 0)
-0.102** (0.010) (0.010)
- *0.105(0.010)
-0.10(0.01
5
Ln(Days Since Release)
1.142**(0.015)
0** 5)
1.120** (0.015)
1.140** (0.015)
1.14(0.01
Condition Rating 0.009* (0.004)
008 4)
0.008 (0.004)
0.(0.00
Seller Rating 03 )
0.003 (0.003)
0.0
ep. Vars. 4 Constant -2.059** *
** )
-2.161** (0.162)
Ln(Amazon Price) 1.347**
** 8)
1.345** (0.048)
(0.003Ln(Number of Used for Sale) 0.057**
(0.011) No. of Observations 41,994 41,994 41,994
The dependent variable is ln(sales rank). Standard errors are listed in parenthesis;note significance at 0.01 and 0.05, respectively. All models use book-level fixed e
41,994 Pseudo R2 0.229 0.229 0.229 0.228
** and * de-ffects.
The other control variables suggest that, as expected, sales of new books decrease over time and
older books and books with more used copies for sale have higher rank. It might be initially sur-
prisingly that both seller rating and condition are insignificant in our regressions. However, it is
or rating are unimpor-
ndition and rating of the lowest priced book
aren’t what is driving the cannibalization of new book sales.
important to realize that this does not necessarily mean that condition and/
tant to used book purchasers, but rather that the co
13 We selected the minimum used price across all conditions because this is the only used price shown on Amazon’s new book pages (see Figure 2). We are unable to include separate price coefficients for each book condition because of collinearity among these variables. Including a price coefficient for the lowest priced “like new” condition book— arguably the closest substitute to a new book — would result in a coefficient estimate of -0.069, lower than the -0.102 we obtain for the minimum used price across all conditions. Using this coefficient instead of minimum price, would reduce the loss faced by publishers in our welfare calculations.
22
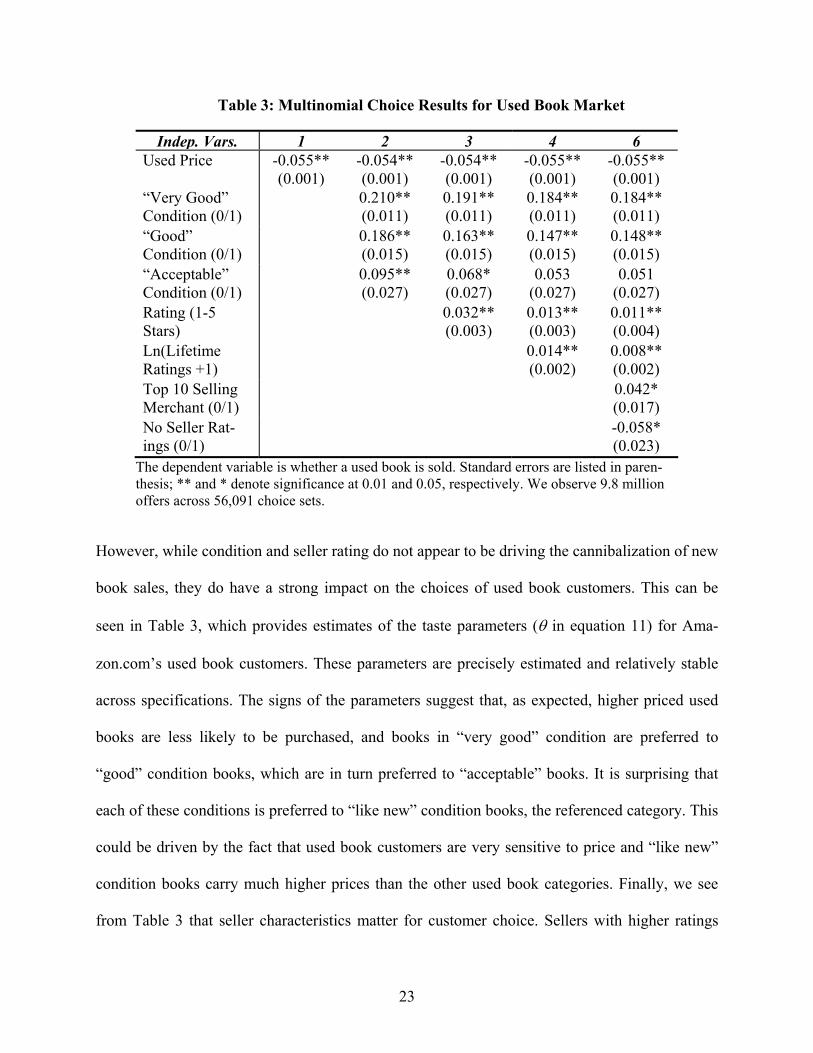
Table 3: Multinomial Choice Results for Used Book Market
Inde s. 1 2 3 4Used Price -0.0
(0.0-0(0
** 1)
-0.055** (0.001)
55** 01)
.054** .001)
-0.054**(0.001)
-0.055(0.00
“VerCondition
y Good” (0/1)
0(0
** 1)
0.184** (0.011)
.210** .011)
0.191**(0.011)
0.184(0.01
“Good” Condition (0/1)
0.(
** 5)
0.148** (0.015)
186** 0.015)
0.163**(0.015)
0.147(0.01
“Acceptable” on (0/1)
0.(0.027)
3 7)
0.051 (0.027) Conditi
095** 0.068*(0.027)
0.05(0.02
Rating (1-5 (0.003)
** 3)
0.011** (0.004) Stars)
0.032** 0.013(0.00
Ln(LifetRatin
ime gs +1)
** 2)
0.008** (0.002)
0.014(0.00
p. Var 6
Top 10 Selling Merchant (0/1)
0.042* (0.017)
No Seller Rat-ings (0/1)
-0.058* (0.023)
The dependent variable is whether a used book is sold. Standard errors are listed in paren-thesis; ** and * denote significance at 0.01 and 0.05, respectively. We observe 9.offers across 56,091 choice sets.
However, while condition and seller rating do not appear to be driving the cannib
book sales, they do have a strong impact on the choices of used book custom
seen in Table 3, which provides estimates of the taste parameters (θ in equatio
across specifications. The signs of the parameters suggest that, as expected, hi
books are less likely to be purchased, and books in “very good” condition are preferred
“good” condition books, which are in turn preferred to “acceptable” books. It
8 million
alization of new
ers. This can be
n 11) for Ama-
zon.com’s used book customers. These parameters are precisely estimated and relatively stable
gher priced used
to
is surprising that
each of these conditions is preferred to “like new” condition books, the referenced category. This
could be driven by the fact that used book customers are very sensitive to price and “like new”
condition books carry much higher prices than the other used book categories. Finally, we see
from Table 3 that seller characteristics matter for customer choice. Sellers with higher ratings
23

and more lifetime ratings are preferred to other sellers, sellers with at least one rating are
p 10 sellers in our sample (who are exclu-
sively large professional book sellers) are preferred to other sellers.
- and cross-price
elasticities in the new and used markets. With respect to the new market, one can easily show
from (9) and (10) that own- and cross-price elasticity are given by βΓ and βΨ respectively. Thus,
-1.17, while the
0.088.14 Both re-
ich is consistent
with what one might expect from a firm with significant market power. The cross-price elasticity
r new books for
most of Amazon’s customers.
To calculate th
logit model, the own price elasticity of demand for an individual offer is given by (Ben-Akiva
strongly preferred to sellers with no ratings, and the to
We can use the results of these two regressions to calculate the relevant own
using β = -0.871, we see that Amazon’s own price elasticity is approximately
cross price elasticity of new book sales to used books prices is approximately
sults have the expected signs. Amazon’s own price elasticity is close to -1, wh
estimates are quite low, suggesting that used books are not a strong substitute fo
e own price elasticity of used book offers, we note that under the multinomial
η jk = α k pk 1− Pj( )
and Lerman 1985, p. 111):
(13)
where αk is the estimated parameter of used price, pk is used price itself, and Pj is the conditional
on (11). Using (13), we can calculate the average own price
choice probability defined in equati
14 Cross price elasticities for the old and new samples are .089 and .079 respectively. Own price elasticities for the old and new samples are -1.16 and -1.40 respectively.
24

elasticity imputed for offers in each session and take the average of this across sessions to obtain
an own price elasticity of -4.87.15
ce is competitive
. Similar, though
generally larger, estimates for demand elasticities are also found by other researchers in the con-
text of shopbots — settings where the layout of offers is very similar to Amazon’s used book
16 egree of differen-
sellers (ratings)
asticity were conducted in the context of ei-
products (Brynjolfsson, Dick, and Smith 2004) or both undifferentiated
sellers and undifferentiated products (Ellison and Ellison 2004).
k marketplace if
there is no increase in the price of new books after the introduction of the used book markets.
Conversations with representatives of three major publishers revealed no changes in the whole-
ces. Al Greco, the
and a Professor at
nificant changes in
wholesale prices” in recent years as a result of the introduction of used book markets on the
This elasticity, as expected, is high — suggesting that the used book market pla
and small price changes have large impact on the probability of book being sold
marketplace. The fact that our elasticity is slightly lower is likely due to the d
tiation in offerings across the studies: In our study both products (quality) and
are differentiated, while prior studies of shopbot el
ther undifferentiated
6.3. Welfare Estimations
6.3.1. Publisher Welfare
As noted in Section 3, publishers are worse off in the presence of a used boo
sale prices of books following the introduction of Internet used book marketpla
author of the Book Industry Study Group’s annual Book Industry Trends
Fordham University confirmed that in his research there have been “no sig
15 Calculating elasticity at the session level as opposed to the offer level is common in the literature and we believe is appropriate in our case because it imputes less weight to sessions with a large number of offers. The offer level elasticity in our data is -4.14. Using the offer level elasticity instead of the session level elasticity would increase both the resulting consumer surplus and total welfare in our results. 16 For example, Brynjolfsson, Dick, and Smith (2004) find elasticities of between -6.75 and -9.77 for a shopbot list-ing new books; Baye et al. (2005) find elasticity of approximately -6 in a market for PDAs listed at a shopbot and Ellison and Ellison (2001) estimate the elasticity of -50 for DRAM memory modules.
25

Internet. Because of this, we assume in our welfare calculations that publisher prices have not
.18 Under this as-
quation (8) above to estimate the loss in pub-
Brynjolfsson, Hu, and Smith (2003) calculate that, after the introduction of the used marketplace
Amazon sold approximately 99.4 million books per year. However, this represents sales after the
introduction of the used book marketplace (DNU) not before (DN). Thus, we must rewrite (8) in
terms of observed variables (specifically DNU), which gives us:
17
changed as a result of the introduction of Internet exchanges for used books
sumption, we can use our elasticity estimates and e
lisher profit from the presence of Amazon’s used book market.
∆Q = (DN − DN ) = DN (1−η ⋅ ∆P%) where UP%
P∆ =
U U η ⋅ ∆P% UN u
N
P P
− (14)
From our calculations above, the cross price elasticity of new book sales to used books prices (η)
is approximately 0.088. Finally, used books in our sample are sold at an average discount of
50.6% off Amazon’s new price (∆P%=.506). From these figures, equation (14) shows that Ama-
We can use (6) to characterize the loss in publisher profit from this change in sales by noting that
according to Brynjolfsson, Hu, and Smith (2003) the wholesale cost of adult trade books is be-
tween 43-51% off the book’s list price and publisher gross margins on sales are typically 56-
e for whole-
zon lost 4.63 million sales (∆Q) due to the presence of used book markets.
64%. The taking 60% as the typical margin, 47% as the typical discount off list pric
17 Source: Al Greco, Fordham University, May 12, 2005, conversation. 18 This is a conservative assumption. If it is incorrect, we will overstate the publisher loss, and our resulting total welfare estimates will represent a lower bound on the true welfare gains.
26

sale prices, and noting the average list price in our sample is $30.60, we calculate that publisher
lost gross profit from Amazon.com’s used book market is approximately $45.05 million.19
n the quantity of
new books sold, which may be mitigated by an increase in revenue from used book marketplace
sales that otherwise would not have occurred at the new book prices. Since we observe Qn, Pn,
iler welfare from
margins on new
ks, Wingfield (2003) places Amazon’s gross margins on new book
w books, gives a
ice on their used
imburses sellers
iven that the av-
erage price of used books in our sample that are sold is $8.76,21 the dollar contribution margin on
used book sales is approximately $3.04 (35%).22 Thus, Amazon’s losses on cannibalized new
roximately ($2.25
6.3.2. Retailer Welfare
With regard to retailer welfare, Amazon.com incurs a loss from the decrease i
and the relevant cross-price elasticities, we can measure the net change in reta
these two effects. To do this, we first calculate Amazon’s dollar contribution
and used books. For new boo
sales at approximately 22% which, given Amazon’s average price $24.04 for ne
dollar contribution margin of $5.29.
For used books, Amazon also earns revenue of $0.99 plus 15% of the sale pr
book sales.20 In addition, Amazon charges buyers $3.49 for shipping and re
$2.26 for their shipping costs, and thus earns $1.23 on shipping per unit sold. G
book sales net their gains on the corresponding used book sale work out to app
19 $45.05 million = 4.63 million * $30.60 * (1-.47) * .60 20 Amazon.com waives the $0.99 fee for “Pro Merchant Subscribers.” Pro Merchant Subscribers are charged $19.99 per month for membership. While we have no way of knowing how many of Amazon’s sales come from these Pro Merchant Subscribers, we assume it to be 50%. We believe this is a conservative assumption, and it also ignores any additional revenue gains to Amazon from Pro Merchant membership fees. 21 Note that the average used price that leads to a sale ($8.76) is less than the average price of all used books listed in the marketplace (Table 1) as one would expect. Also note that Amazon never takes possession of the product, and thus revenue is approximately equal to gross profit. 22 $3.04 = $8.76 * .15 + $0.99 * .5 + $1.23
27

= $5.29 - $3.04) for each cannibalized new book: or a total of $10.42 million for the 4.63 million
cannibalized new book sales.
presence of their
quite substantial.
Milliot (2002) notes that across all product categories sold at Amazon.com, used products ac-
counted for 23% of Amazon’s sales. Moreover, used sales in the book category were one of the
strongest of any product category according to Jeffrey Bezos. Thus, 23% may be an underesti-
mate of the actual proportion of used sales in the book category.
h 2003) and used
book sales made up 23% of total book sales (both new and used), then approximately 29.69 mil-
lion used books are sold through Amazon’s marketplace annually. Recalling that only 4.63 mil-
ld approximately
on the site. Said
ales directly can-
nibalize new book sales. The remaining 84% of used book sales apparently would not have oc-
curred at the new book prices on Amazon’s site. Using our figures above, these additional 25.06
bility (25.06 mil-
ook market added
However, as noted above, Amazon also gains incremental customers from the
used marketplaces. Our results suggest these incremental customers could be
If Amazon sells 99.4 million new books annually (Brynjolfsson, Hu, and Smit
lion of these sales cannibalized new book sales, we estimate that Amazon so
25.06 million used book copies that would not otherwise have been sold new
another way, only 16% (4.63 million / 29.69 million) of Amazon’s used book s
million used book sales add approximately $76.18 million to Amazon’s profita
lion * $3.04 / used sale). Thus, on balance, the presence of Amazon’s used b
$65.76 million to the company’s profitability.23
23 It is important to note that this calculation of retailer surplus does not include surplus that may accrue to used booksellers. While Amazon takes a commission of 15% of the sale price on products sold through their marketplace, the remaining 85% of the sale goes to the seller. Under the assumptions that 50% of marketplace sellers are “Pro Merchant Subscribers” and thus do not pay $0.99 to Amazon per sale), and that Amazon’s $2.26 payment to sellers exactly covers their shipping costs, marketplace sellers make approximately $206.4 million (29.69 million used books * ($8.76 * 85% - $0.99 * 50%) on the sale of used books through Amazon’s site. This almost certainly over-estimates of the true marketplace seller surplus since many sellers would have a residual value of retaining the prod-
28

6.3.3. Consumer Surplus
d book markets,
mer surplus gain
sticity can be ig-
nored for consumer products that represent a small proportion of overall consumer expenditures
(e.g., Brynjolfsson (1995) in the context of computer purchases, Hausman (1997a) in the context
n, Hu, and Smith (2003) in the context of Inter-
net book sales). Ignoring income elasticity, the consumer surplus gain from the introduction of
the used book market at Amazon.com should be given by: 24
To calculate the consumer surplus gain from the introduction of Amazon’s use
we apply Hausman and Leonard’s (2002) methodology with respect to the consu
from the introduction of new goods. Prior research has shown that income ela
of telecommunications services, and Brynjolfsso
CV = − u up q(1+ ηu)
(15)
u u old and ηu is the
own price elasticity of used book demand.
the average sale price of used books ($8.76),
mer surplus gain
7. Discussion
zed the character-
old in electronic markets (e.g., Brynjolfsson and Smith 2000; Clay, Krish-
nan, and Wolff 2001; Pan, Ratchford, and Shankar 2002; Baye, Morgan, and Scholten 2004),
where p is the average price of used book sold, q is the number of used books s
Given the used book own price elasticity of -4.87,
and the quantity of used books sold (29.69 million), we estimate that the consu
from the introduction of Amazon.com’s used book market is $67.21 million.
While many papers in the IT, economics, and marketing literatures have analy
istics of new books s
uct. However, whatever the actual seller surplus might be, it likely represents another large source of social surplus from these transactions. We thank Paul Kattuman for making this observation. 24 Note that, if income elasticity were positive for books, as seems likely, including income elasticity would increase our consumer surplus estimates.
29

used books — and other used products — sold in IT-enabled exchanges may have an even larger
impact on both electronic and physical markets.
nd over a global
yers. Because of
this, these markets have significant advantages in terms of price, search costs, and selection over
physical markets. As noted above, while Amazon’s used book marketplace features at least one
al physical used
s of used books
s in physical stores.25 Because of
les (Wyatt 2005),
sales and result-
arkets may pose
music, and mov-
ies — where there is relatively little degradation in the quality of the good over time and where
artists and publishers are only compensated for the initial sale of the product. In these product
online used prod-
uct markets may attract customers who would have otherwise purchased a new copy of the prod-
lization of new product sales were to become widespread, it could undermine the
profitability of the publishing business and reduce authors’ and artists’ creative incentives. Be-
cause of this, the Association of American Publishers and the Authors’ Guild have asked Ama-
IT-enabled markets for used products are able to aggregate supply and dema
marketplace, making it easier for buyers to find sellers and for sellers to find bu
used book for almost every book in print and many out of print books, a typic
bookstores carries only between 5,000 to 30,000 unique titles. Likewise, price
sold on the Internet are 38-75% lower than comparable price
these advantages, the Internet makes up an estimated 67% of all used book sa
versus only 12.7% of new book sales in the same channel (Rappaport 2004).
The question remains: how will these IT-enabled exchanges impact new product
ing social welfare? The increased viability of used product sales in electronic m
a significant threat for many categories of information goods — such as books,
categories, the increased variety, low prices, and low search costs available in
uct. If canniba
25 As a point of comparison Brynjolfsson and Smith (2000) find that new book prices are only 15.5% lower online than in physical stores.
30

zon to create artificial search costs for new book shoppers to locate used book copies by separat-
ing the two markets on Amazon’s site.
at Amazon.com.
s with respect to
used book prices is rather low (0.088). This means that only 16% of Amazon’s used book sales
directly cannibalize new book purchases; the remaining 84% of sales represent purchases that
d sales result in
tal welfare gain to society from
6 million gain in
The implication of this finding for publishers is that, at least at present, used books do not appear
y lost publisher
ays the Internet
wholesale prices
constant) (Brynjolfsson and Smith 2000), increasing product variety (Brynjolfsson, Hu, and
al access to large
bookstores (Brynjolfsson and Smith 2000). Finally, it is significant to note that the estimated
$45.05 million loss in annual gross profits, represents only 0.3% of total publisher gross profits.
For authors, while the observed levels cannibalization will lead to somewhat lower royalty pay-
ments, authors may experience an additional, indirect gain through additional readership from
the 84% of used book sales that otherwise would not have occurred. For example, authors may
accrue some added income from these additional readers through speaking fees, licensing deals,
In this research, we analyze the impact of used book markets on new book sales
Using a unique dataset, we find that the cross-price elasticity of new book sale
otherwise would not have occurred at new book prices. Thus, while cannibalize
an estimated $45.05 million loss to publishers annually, the to
this IT-enabled market is $87.92 million annually after considering the $65.7
Amazon.com’s gross profits and the $67.21 million gain in consumer surplus.
to be a strong substitute to new book purchases for most consumers. Further, an
revenue from these used markets must be viewed in the context of the many w
has helped to increase new book sales: by lowering retail prices (while holding
Smith 2003), and providing a sales channel to customers who do not have loc
31

or advances on future books. These new readers may also buy new versions of subsequent re-
ew book sales due to an
increase in valuation from the possibility of resale (Ghose, Telang and Krishnan 2005).
s, should remain
attentive to potential changes in customer sensitivity toward used products. In the book category,
customer sensitivity to used books may change over time as customers gain comfort with the
products with a
lization by used
al products, such
as CDs and DVDs. Higher cannibalization levels might arise on the demand side because digital
content typically does not degrade from use, reducing the importance of quality differentiation.
sily copied (and
g them more likely to be intro-
her key contribu-
ers and academic
lishers and con-
ng or eliminating
esale of some prod-
ucts purchased digitally (e.g., eBooks and music purchased through online music stores) and can
create rental markets under more direct industry control (e.g., the older Divx and more recent
Flexplay movie formats). Issues surrounding the viability and effectiveness of technology-
enabled control over used product markets would make an important area for future research.
leases by the same author(s). Further, used book markets could spur n
However, book publishers, and producers of other comparable information good
quality and reliability of products sold in used markets. Likewise, producers of
stronger digital component than books should analyze the impact of canniba
products. We speculate that cannibalization may be particularly acute for digit
On the supply-side, most digital content (including CDs and DVDs) can be ea
thus effectively retained) before they are resold, potentially makin
duced for resale by (unscrupulous) sellers. In this regard, we believe that anot
tion of our work is in providing an easily executed methodology for product sell
researchers to analyze the impact of cannibalization in other product categories.
It is also important to note that while cannibalization can reduce revenue to pub
tent creators, Information Technology can also provide new tools for controlli
used product markets. For example, licensing restrictions can prohibit the r
32

Finally, there are several limitations of our study deserving mention. First, our data come from a
uch as abebooks
epresents only a
snapshot in the evolution of the online used book marketplace. Consumer sensitivity may change
over time as consumers gain more familiarity with used products sold through online markets.
single retailer. Future research could include data from other used booksellers s
or half.com. Second, our study focused only on used books. Future studies may wish to look at
other similar product categories, such as CDs and DVDs. Finally, our study r
33
References
Anderson, S., V. Ginsburgh. 1994. Price Discrimination by Second-hand Markets. European
Bakos, J. Y. 1997. Reducing buyer search costs: Implications for electronic marketplaces. Man-
. Working Paper,
in the Large: Evi-dence from an Internet Price Comparison Site. Journal of Industrial Economics 52(4) 463-496.
e Analysis: Theory and Application to Travel Demand. The MIT Press, Cambridge, MA.
nship between the markets for used and new
Bond, E., L. Samuelson. 1984. Durable good monopolies with rational expectations and re-
y Group, New
gy to consumer welfare. In-formation Systems Research 7(3) 281-300.
ison of Internet and Con-ventional Retailers, Management Science 46, 563-585.
nomy: Estimating e 49(11) 1580-1596.
uct Differentiation burgh, PA.
314-322.
Chevalier, J., A. Goolsbee. 2003. Measuring Prices and Price Competition Online: Amazon and Barnes and Noble. Quantitative Marketing and Economics 1(2) 203-222.
Chevalier, J., A. Goolsbee. 2005. Are Durable Goods Consumers Forward Looking? Evidence from College Textbooks. Working Paper, Yale School of Management, New Haven, CT.
Clay, K., R. Krishnan, E. Wolff. 2001. Price Strategies on The Web: Evidence From The Online Book Industry. Journal of Industrial Economics 49(4) 521-540.
Economic Review 38 23-44.
agement Science 43(12) 1613-1630.
Bapna, R.,W. Gank, G. Shmueli. 2005. Consumer Surplus in Online AuctionsUniversity of Connecticut
Baye, M. R., J. Morgan, P. Scholten. 2004. Price Dispersion in the Small and
Ben-Akiva, M., S.Lerman. 1985. Discrete Choic
Benjamin, D.,R. Kormendi. 1974. The interrelatiodurable goods. Journal of Law and Economics 17 381-401.
placement sales. RAND Journal of Economics 15(3) 336-345.
Book Industry Study Group. 2004. Book Industry Trends. Book Industry StudYork, NY. (ISBN 0-940-016-842.)
Brynjolfsson, Erik. 1995. The contribution of information technolo
Brynjolfsson, E., M. Smith, 2000. Frictionless Commerce? A Compar
Brynjolfsson, E., Y. Hu, M. Smith. 2003. Consumer Surplus in the Digital Ecothe Value of Increased Product Variety. Management Scienc
Brynjolfsson, Erik, Astrid A. Dick, Michael D. Smith. 2004. Search and Prodat an Internet Shopbot. Working Paper, Carnegie Mellon University, Pitts
Bulow, J. 1982. Durable-goods monopolist. Journal of Political Economy 90(2)
34

Coase, R. 1972. Durability and monopoly. Journal of Law Economics 15 143–149.
nd Price Elasticities on the Internet. Working
Ghose, A., R. Telang, R. Krishnan. 2005. Effect of Electronic Secondary Markets on Supply
Greco, A. 2005. The Book Publishing Industry. Lawrence Erlbaum Associates, Mahwah, N.J.
n, H. Estalemi. 2005. Journal of Scholarly Publishing, 36(2), July.
anner Data. Mar-keting Science 2(3) 203-238.
communications. mic Activity: Microeconomics Vol. 1997 1-38.
ompetition. Bresna-han, Timothy F., Robert J. Gordon, eds. The Economics of New Goods. The University of Chi-
troduction: A
nal of Economics
Studies 9(2) 126-137.
odels. American
87. Electronic Markets and Electronic
onship Between (3) 612-619.
Milliot, J. 2002. Amazon focused on unit growth. Publishers Weekly 249(44) 15.
Poynter, D. 2000. Publishing Poynters. April-June 2000, (Available at http://parapub.com/getpage.cfm?file=newsletter/News0400.html), accessed March 21, 2005.
Publishing Trends. 2004. Used Blues: Used Books Become Newer Everyday, To Many Publish-ers Dismay.” Publishing Trends Newsletter 11(7), Market Partners International, New York, NY (July 2004).
Ellison, G., S. Ellison. 2004. Search, Obfuscation, apaper, Massachusetts Institute of Technology, Cambridge, MA.
Chain., Journal of Management Information Systems, 22(2), 91-120.
Greco, A, R.M. Wharto
Guadagni, P., J. Little. 1983. A Logit Model of Brand Choice Calibrated on Sc
Hausman, J.A. 1997a. Valuing the effect of regulation on new services in teleBrookings Papers on Econo
Hausman, J.A. 1997b. Valuation of new goods under perfect and imperfect c
cago Press, Chicago, IL, 209-237.
Hausman, J.A., G. Leonard. 2002.The Competitive Effects of a New Product InCase Study. Journal of Industrial Economics 50(3) 237-263.
Hendel, I., A. Lizzeri. 1999. Interfering with Secondary Markets. Rand Jour30(1) 1-21.
Hicks, J.R. 1942. Consumers’ surplus and index numbers. Review of Economic
Liebowitz, S. J. 1982. Durability, Market Structure and New-used Goods MEconomic Review 72(9) 816–824.
Malone, Thomas, JoAnne Yates and Robert Benjamin. 19Hierarchies. Communications of the ACM 30(6) 484-497.
Miller, L.H. 1974. On Killing off the Market for Used Textbooks and the RelatiMarkets for New and Secondhand Goods. The Journal of Political Economy 82
35

Rappaport, B. 2004. Ipsos BookTrends 2004. Ipsos-Insight, Chicago, IL.
iegel. 2004. A Portrait of the U.S. Used Book Market. Book Hunter Press, York-
Smith, Michael, Erik Brynjolfsson. 2001. Customer Decision Making at an Internet Shopbot:
Power. The Journal of Politi-cal Economy 88(1) 76–99.
Books. New York Times (July 12).
Waldman, M. 1997. Eliminating the market for secondhand goods: An alternative explanation
Weingarten, Gene. 2001. Below the beltway. Washington Post. (June 17).
ld, N. 2003. New Chapter: In Latest Strategy Shift, Amazon Is Offering a Home to Re-tailers. The Wall Street Journal (September 24) A1.
Wyatt, Edward. 2005. Internet Grows as a Factor in Used-Book Business. New York Times (Sep-tember 29).
Siegel, S., D. Stown Heights, NY.
Brand Still Matters. The Journal of Industrial Economics 49(4) 541-558.
Swan, P.L. 1980. Alcoa: The Influence of Recycling on Monopoly
Tedeschi, B. 2004. Online Battle of Low-Cost
for leasing. Journal of Law and Economics 40(1) 61-92.
Wingfie
36

Figure 2: Sample New Book Listing at Amazon.com
Figure 3: Sample Used Book Listing at Amazon.com
37

Appendix
tility functions 1. ii), we derive the Recall the consumer u on Page 1 By equating (i), (ii) and (ii), (i
two indifference points q1 = q−
PkP UN
1α and q2 =
qwhich define t e P h consumer market
segments. By equating the demand of used goods (q1 - q2) with the supply of used goods α(1- q1),
we get the market clearing used-good price,
U−+− ))1(1(
( )2)1(1))
−−+−−
ααα kqqU 1()1(( −+
=ααPq
P NU
.
The retailer’s profit is then
.
Substituting PU in the retailer’s profit equation and optimizing with respect to PN, we get the op-
timal new good price,
=
kwUU )() 21 θθ −+PNR )(1( 1θπ −−=
PN
qkkwqkk U
)2)1(21(1)))
+−++++
α
(1+ wU )(1+ αq(α − k)) + αq 3 + α 2q(1− k) + 2wU + α(2q − k(2q + wU −1))[ ]2 + (6 + 4α )q
and the used good price
PU = q 1(1(( −+α .
These expressions enable us to derive the relevant profits expressions as follows:
pSU = (1- q1) w =
( ))2(1)1(
21
αα ++ qwwqα −+ UU
and pRU =
( ))2(1)1(
41 2
ααα
++−+
qwq U
.
The publisher can optimize its profit with respect to wU and can set wU = ½ (1+αq).
38

39
Without the used book market, the publisher makes a profit of 2
)1( wwS
−=π and the retailer
makes a profit of 4R
< 0 nd q and w is set at optimal w = 1/2. On the other h
for all
)1( w−=π
of wU, α a
2. Comparing these respective profits it is easy to see that pS
U- pS
for all values and, pRU- pR > 0
qaaaqwU )2(111 ++−+< . Thus, as long as th2
e publisher does not increase its whole-
sale price, the retailer always benefits and the publisher always loses.