international transportation management benchmark … · international transportation management...
TRANSCRIPT
International Transportation Management Benchmark Study—Winners See Strategic Value of VisibilityWritten By: James Blaeser Publisher
Published November 2011
Sponsored by:
In partnership with
International Transportation Management | Benchmark Report: 2011
ii
Welcome to American Shipper’s third annual International Transportation Management Benchmark Study.
During the third quarter of 2011, American Shipper surveyed more than 200 supply chain managers on their international transportation management practices, processes, and the tech-nologies that support them.
Each year this report takes a hard look at the “nitty-gritty” aspects of international transportation management (ITM) including planning, booking, tendering, order management, event manage-ment and visibility.
American Shipper’s benchmarking initiatives seek to parse out companies that are succeeding at any particular function and examine why they are successful. These “winners” are the top tier of respondents based on their answers to a set of questions that are seeded in the questionnaire.
With respect to this survey the winners meet three key criteria:
•Reportthattheyarecapableofsendinganelectronicpurchaseorder (PO) (such as an EDI 850 file) to a logistics service provider (LSP).
•Havevisibilitytoshipmentspecificsfiveormoredaysinadvance of shipping. These details include the number of containers, cartons, weight and dimensions of the shipment.
•Meetorexceedthetargetsprovidedtothembytheir transportation procurement function.
Using these measures, there were roughly 30 respondents who could be categorized as “winners.” This is the head of the class, so to speak. Similar to previous years, winners tend to be larger companies ($1 billion or more in annual sales) and include heavy representation from the retail/wholesale segment.
Executive Summary
Ex
Ec
tu
tIv
E S
um
ma
ry

International Transportation Management | Benchmark Report: 2011
iii
connectivity and Data Quality
In many ways the state of ITM systems in 2011 has changed little in the last year. The majority of companies still rely on a mix-and-match of systems, third party service providers, and manual processes. Only 5 percent of respondents claim they leverage systems to support their whole ITM process.
The average respondent to this year’s survey is using one fewer ITM system or platform than they were a year prior. This “patch-work” of systems and manual processes has been documented for the past three years by this report, and evidence that things may be getting less complex is a good thing for many who struggle with integration headaches.
However,thistechnologymarketremainshighlyfragmented,andit’s unlikely that shippers or 3PLs will be able to automate more of their ITM effectively without tapping multiple systems, and ultimatelymorevendors.Rememberthatoursurveyrespondentsare managing multimodal transportation. Processes and require-ments vary widely across transportation modes, creating a need for specific systems to meet those demands.
Like last year, our winners still have more technology than the average although that gap is shrinking as winners have been the most aggressive in cutting back on the number of unique systems they are using. Winners reduced their systems from 5.7 in 2010 to 3.9 in 2011.
International transportation is an inherently collaborative exercise that demands electronic connectivity to logistics providers and other suppliers. On average shippers and 3PLs have 8.2 unique integrations, while winners average 9.2. Naturally 3PLs have considerably more integrations (13.1) due to their role as hubs in the international transportation network.
Those connections are only going to be as useful as the data that they transmit. Survey respondents were asked to rate the quality of data provided by various providers in terms of timeliness, accuracy and completeness. The results are surprisingly good if you believe the conventional wisdom that carriers, in particular, do a terrible job providing quality data.
multitude of Itm Systems
Ex
Ec
tu
tIv
E S
um
ma
ry
Ex
Ec
tu
tIv
E S
um
ma
ry
International Transportation Management | Benchmark Report: 2011
iv
Data quality is the cornerstone of visibility. If data related to an international shipment is late, inaccurate, incomplete, or otherwise unavailable, shippers and 3PLs have no chance to make the adjustments that can save time, money or both.
Survey respondents are split when it comes to running ITM centrally, regionally or locally. Winners appear to favor a central-ized approach, particularly in terms of planning. Systems are of key importance to centralizing a large, complex operation like those our survey respondents are tasked with, and centralization directly supports visibility.
Surprisingly, visibility is getting worse when measured by how many days prior to shipment a company knows the specifics, suchasthenumberofpieces,weight,etc.However,winnersareactually getting better. Bear in mind winners only needed five days notice to qualify as a winner, and here the average winner has 16 days.
Here’swheretheROIcomesintoplay.Companiesthathavevisibility to shipment specifics can optimize their transportation plans. Goods that are needed faster can be expedited to market. Costscanbetakenoutthroughmodeshiftstolowercostoptionswhere applicable. Destinations might be changed altogether to take advantage of other opportunities that have arisen, or to overcome unforeseen disruptions that have come up since the PO was cut. There are many scenarios that can play out; the point is none of them exist without visibility.
centralization vs. Localization
visibility

ta
bL
E o
f c
on
tE
nt
S
International Transportation Management | Benchmark Report: 2011
1
Table of Contents
Executive Summary .............................................................................................................................................................. ii
Section I: Introduction ..........................................................................................................................................................3
> Background ..................................................................................................................................................................3
> Winners .........................................................................................................................................................................4
> Terminology ..................................................................................................................................................................4
> Hypothesis ....................................................................................................................................................................5
Section II: Demographics ....................................................................................................................................................5
Section III: The State of ITM ................................................................................................................................................8
Section IV: The Benefits of Automation............................................................................................................................18
Section V: The Future of ITMS ...........................................................................................................................................22
Section VI: Winners ............................................................................................................................................................26
Appendix B: About Our Sponsors .....................................................................................................................................27
> BravoSolution .............................................................................................................................................................27
> CH Robinson ..............................................................................................................................................................27
> Descartes ...................................................................................................................................................................28
> GT Nexus ....................................................................................................................................................................28
> SAP .............................................................................................................................................................................29
Appendix A: About Our Partner .........................................................................................................................................30
> Retail Industry Leaders Association (RILA) ...............................................................................................................30
appendix c: About American Shipper Research .............................................................................................................31

ta
bL
E o
f c
on
tE
nt
S
International Transportation Management | Benchmark Report: 2011
2
Figures
f I g u r E 1 : Industries Surveyed...................................................................................................................................5
f I g u r E 2 : Company Sizes Surveyed .........................................................................................................................5
f I g u r E 3 : Percentage of Revenue Spend on IT .......................................................................................................6
f I g u r E 4 : Job Titles Surveyed ...................................................................................................................................6
f I g u r E 5 : Transportation Modes Managed ..............................................................................................................7
f I g u r E 6 : Current International Transportation Management (ITM) Process .......................................................8
f I g u r E 7 : Last ITM System Update or Implementation ..........................................................................................8
f I g u r E 8 : Percent of IT Budget Spent on ITM Systems ..........................................................................................9
f I g u r E 9 : ROI from ITM Systems ............................................................................................................................10
f I g u r E 1 0 : Satisfaction with Current ITM Systems .............................................................................................11
f I g u r E 1 1 : The State of ITM—Study Average .......................................................................................................12
f I g u r E 1 2 : The State of ITM—Winners ..................................................................................................................12
f I g u r E 1 3 : Number of ITM Systems ......................................................................................................................13
f I g u r E 1 4 : Number of Unique Integrations to Carriers, 3PLs, Portals, etc. ......................................................14
f I g u r E 1 5 : Quality of Data Provided by Partners .................................................................................................14
f I g u r E 1 6 : Use of Systems Integrators and Consultants ....................................................................................15
f I g u r E 1 7 : Current Functionality—Winners vs. Average .....................................................................................16
f I g u r E 1 8 : Current Functionality—Shippers vs. 3PLs ..........................................................................................17
f I g u r E 1 9 : Visibility—Days Prior to Shipment ......................................................................................................18
f I g u r E 2 0 : Productivity—PO per Year per FTE .....................................................................................................19
f I g u r E 2 1 : Central vs. Local Logistics Management—Study Average ...............................................................20
f I g u r E 2 2 : Central vs. Local Logistics Management—Winners .........................................................................20
f I g u r E 2 3 : Has Your Procurement Department Established Metrics for Measuring Savings Targets? ..........21
f I g u r E 2 4 : How Effectively Did Your Department Performance Against Those Targets? ................................21
f I g u r E 2 5 : Plans to Buy/Replace/Upgrade ITM Systems ....................................................................................22
f I g u r E 2 6 : Inhibitors to Investment in ITM Systems ............................................................................................22
f I g u r E 2 7 : Drivers to Systems Adoption ...............................................................................................................23
f I g u r E 2 8 : Drivers to Systems Adoption—Shippers vs. 3PLs .............................................................................24
f I g u r E 2 9 : Future ITM Systems Delivery Model—‘09 to ‘11 ................................................................................25
f I g u r E 3 0 : Future ITM Systems Delivery Model—Shippers vs. 3PLs .................................................................25
SE
ct
Ion
I:
Int
ro
Du
ct
Ion
International Transportation Management | Benchmark Report: 2011
3
Section I: Introduction
b a c k g r o u n D
During the third quarter of 2011, American Shipper surveyed more than 200 supply chain managers on their international transportation management practices, processes, and the technologies that support them. This report is the third annual study on this subject produced inconjunctionwiththeRetailIndustryLeadersAssociation(RILA—www.RILA.org).
For many, a transportation management system (TMS) is an encompassing term that covers the full cycle of transportation activity; including procurement, planning, order management, tendering, event management, and financial settlement. For the purposes of this study, the focus is placed specifically on the stages involving planning through event management and the visibility into each leg of the process. Procurement and settlement are purposely set aside to focus on the “blockingandtackling”ofinternationallogisticsmanagement—plan-ning, order management, tendering and event management. This year’s study also includes a closer look at connectivity to vendors and part-ners in addition to central versus local management practices.
It is also critical to understand that this benchmarking initiative strictly pertains to international and cross-border transportation management; what American Shipper refers to as International Transportation Manage-ment or ITM. Qualified respondents represent a variety of industry segments, including retail, manufacturing, materials, and third party logistics. Likewise, these respondents run the gamut of size based on annualsales.(Responsesfromcarriers,consultants,technologyvendorsand other unqualified respondents are not included in the aggregate data presented in this report.)
Distribution channels for the 31-question benchmarking survey included American Shipper’s Website, e-mail list, and newsletters. In addition,membersofRILAwereinvitedtoparticipateviae-mailpromotionsdirectlyfromRILA.Asapolicy,American Shipper does notshareanyindividualsurveyresponses.Alldataisdisplayedinaggregate form only.
SE
ct
Ion
I:
Int
ro
Du
ct
Ion
International Transportation Management | Benchmark Report: 2011
4
W I n n E r S
American Shipper’s benchmarking initiatives seek to parse out companies that are succeeding at any particular function and examine why they are successful. These “winners” are the top tier of respondents based on their answers to a set of questions that are seeded in the questionnaire.
With respect to this survey the winners meet three key criteria:
1. Reportthattheyarecapableofsendinganelectronicpurchaseorder(PO) (such as an EDI 850 file) to a logistics service provider (LSP).
2. Havevisibilitytoshipmentspecificsfiveormoredaysinadvanceofshipping. These details include the number of containers, cartons, weight and dimensions of the shipment.
3. Meet or exceed the targets provided to them by their transporta-tion procurement function. Using these measures, there were roughly 30 respondents who could be categorized as “winners.” This is the top 15 percent of the class, so to speak. Similar to previous years, winners tend to be larger companies ($1 billion or more in annual sales) and include heavy representation from the retail/ wholesale segment.
t E r m I n o L o g y
In the interest of being succinct and direct, this study uses several terms or acronyms. These explanations and definitions should be kept in mind when reviewing the results that follow.
Logistics service providers (LSPs) are companies that charge a fee for supply chain services, including but not limited to transportation, distribution,warehousingandcustomsclearanceservices.Athird-partylogistics provider (3PL) is a non-asset-based LSP.
This survey uses many segments that are straightforward, but some are less clear. Small companies are those firms with less than $100 million in annual sales, medium-size companies are $100 million to $1 billion, and large companies have more than $1 billion.
Many of the data points illustrated in these pages break down the differ-ences between companies that “automate” international transportation management versus those that handle this “manually.” In the context of this study “automated” companies are those that employ at least one software application to support their international transportation func-tion.However,“automated”doesnotmeanhumaninteractionhasbeenentirely eliminated. Likewise, “manual” does not mean these firms do not use e-mail, faxes, and other technologies. The study assumes that basic computing power is ubiquitous in the transportation management field.

SE
ct
Ion
II:
DE
mo
gr
ap
hIc
S
International Transportation Management | Benchmark Report: 2011
5
h y p o t h E S I S
Based on the previous year’s study results, transportation industry trends, and events that have occurred since that time, a number of hypotheses were tested in this study. These include:
1. Systems supporting international transportation processes would be more prevalent than last year’s study showed. Figure six shows this is not the case.
2. Shippers and 3PLs will reduce the number of applications they use to manage international transportation in order to reduce complexity, among other benefits. Figure 13 suggests this is happening.
3. Visibility to shipment specifics prior to shipment will improve compared to last year. Figure 19 shows that this is incorrect in general, but there are some exceptions.
Section II: DemographicsOverall,thedemographicsfromthisstudyareveryclose—insomecasesidentical—tothoseoflastyear’sreport.Surveyrespondentsrepresentallmajor categories tracked by American Shipper, including manufacturers (38 percent), retailers (26 percent), and 3PLs (28 percent).
Likewise, company sizes represented are nearly identical to last year’s study. There are slightly more respondents from large companies, as measured in terms of annual sales.
Manufacturers
Retail/Wholesale
3PL
Other Shippers
38%
26%
28%
8%
Less than $100 million
$100 million to $1 billion
Greater than $1billion
30%
29%
41%
f I g u r E 1 : Industries Surveyed f I g u r E 2 : Company Sizes Surveyed
220 total respondents

SE
ct
Ion
II:
DE
mo
gr
ap
hIc
S
International Transportation Management | Benchmark Report: 2011
6
The large majority of respondents report that their companies spend at least 1 percent of annual revenue on information technology investments including hardware, software, and maintenance. 10 percent spend very aggressively on IT, setting aside 10 percent of sales for these investments.
International transportation remains a manager- or director-level function. Nearly three out of four survey respondents come from this segment.C-levelandexecutive-levelresponses—representing18percentofthepopulation—arealmostentirelyfromthe3PLindustry.
157 total respondents144 total respondents
None
Less than 1 percent
1 to 2 percent
3 to 5 percent
More than 5 percent
17%
3%
35%
34%
10%
C-Level (CEO,CIO,CFO, etc)
Executive (SVP, VP, GM, etc.)
Director
Manager
Staff
12%
25%
48%
6%8%
f I g u r E 3 : Percentage of Revenue
Spend on IT f I g u r E 4 : Job Titles Surveyed
SE
ct
Ion
II:
DE
mo
gr
ap
hIc
S
International Transportation Management | Benchmark Report: 2011
7
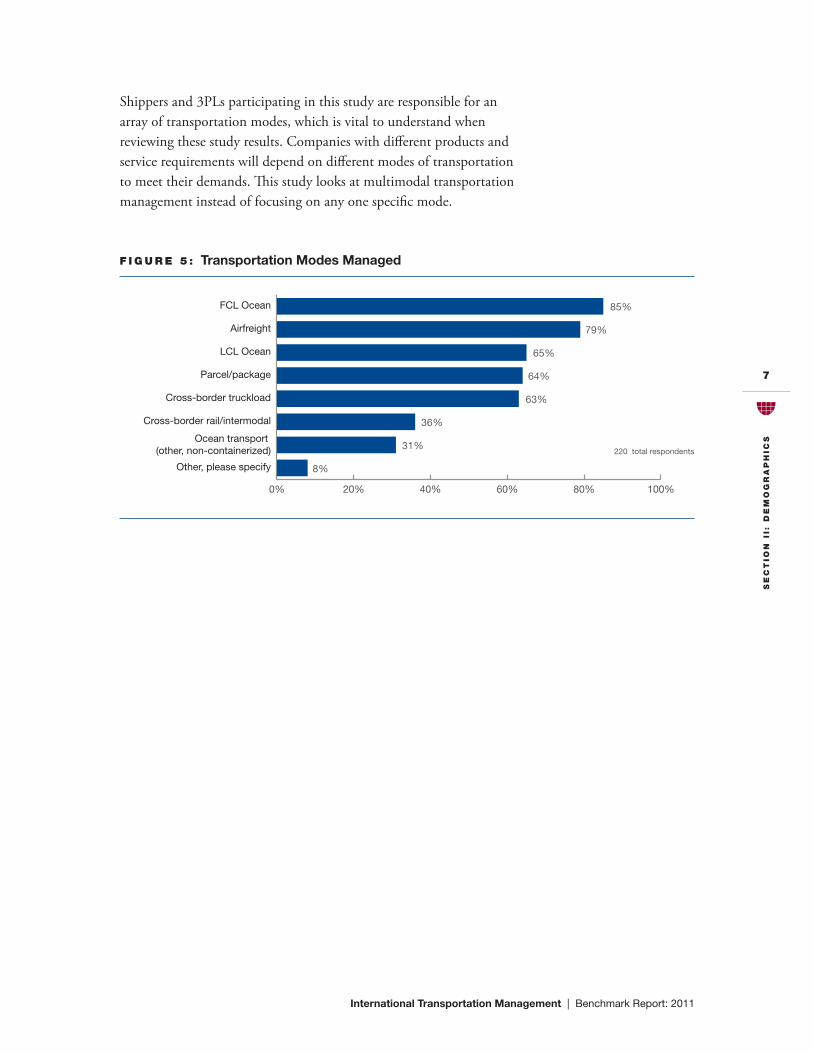
Shippers and 3PLs participating in this study are responsible for an array of transportation modes, which is vital to understand when reviewingthesestudyresults.Companieswithdifferentproductsandservice requirements will depend on different modes of transportation to meet their demands. This study looks at multimodal transportation management instead of focusing on any one specific mode.
f I g u r E 5 : Transportation Modes Managed
220 total respondents
0% 20% 40% 60% 80% 100%
Other, please specify
Ocean transport (other, non-containerized)
Cross-border rail/intermodal
Cross-border truckload
Parcel/package
LCL Ocean
Airfreight
FCL Ocean 85%
79%
65%
64%
63%
36%
31%
8%
SE
ct
Ion
III
: t
hE
St
at
E o
f I
tm
International Transportation Management | Benchmark Report: 2011
8
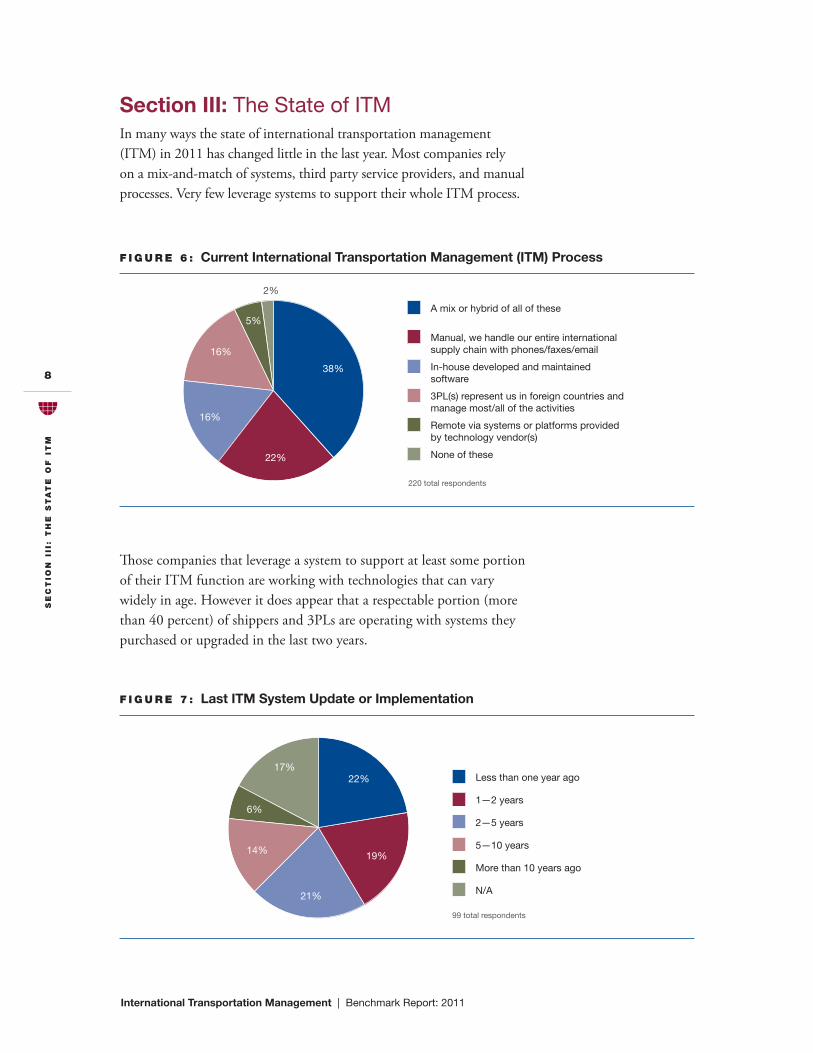
Those companies that leverage a system to support at least some portion of their ITM function are working with technologies that can vary widelyinage.Howeveritdoesappearthatarespectableportion(morethan 40 percent) of shippers and 3PLs are operating with systems they purchased or upgraded in the last two years.
f I g u r E 7 : Last ITM System Update or Implementation
99 total respondents
Less than one year ago
1—2 years
2—5 years
5—10 years
More than 10 years ago
N/A
22%
21%
19%14%
6%
17%
Section III: The State of ITMIn many ways the state of international transportation management (ITM) in 2011 has changed little in the last year. Most companies rely on a mix-and-match of systems, third party service providers, and manual processes. Very few leverage systems to support their whole ITM process.
A mix or hybrid of all of these
Manual, we handle our entire internationalsupply chain with phones/faxes/email
In-house developed and maintained software
3PL(s) represent us in foreign countries andmanage most/all of the activities
Remote via systems or platforms providedby technology vendor(s)
None of these
5%
16%
16%
2%
22%
38%
f I g u r E 6 : Current International Transportation Management (ITM) Process
220 total respondents
SE
ct
Ion
III
: t
hE
St
at
E o
f I
tm
International Transportation Management | Benchmark Report: 2011
9
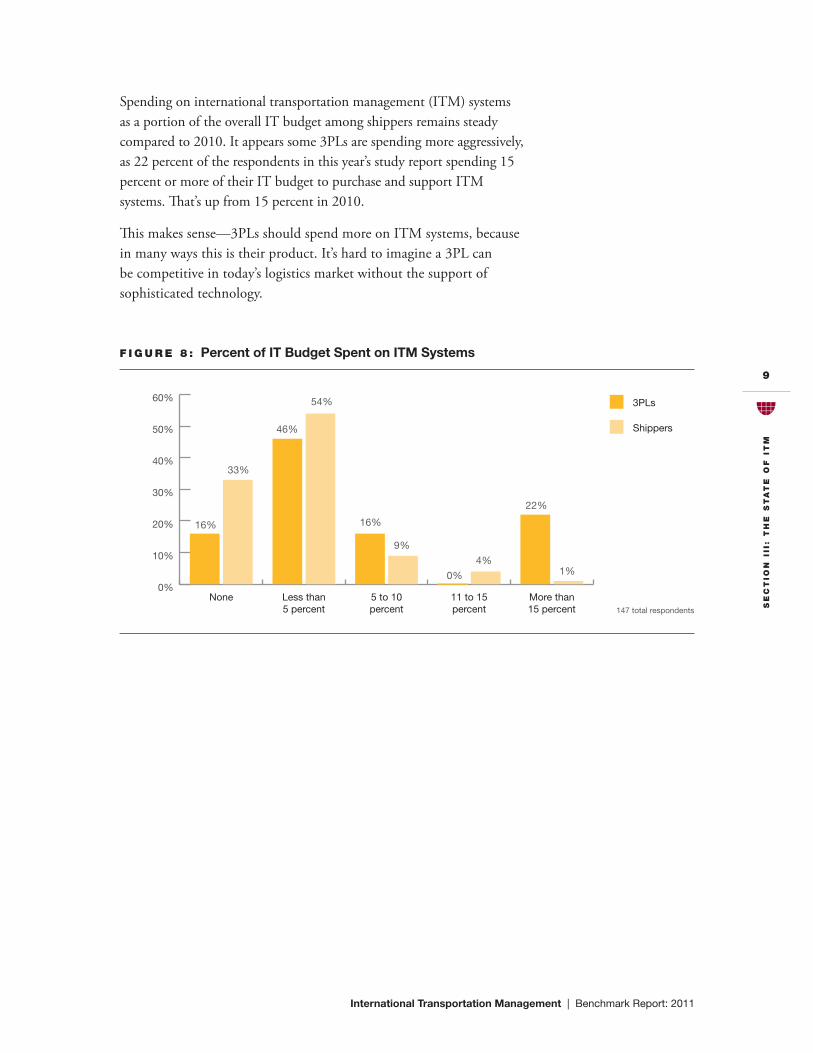
Spending on international transportation management (ITM) systems as a portion of the overall IT budget among shippers remains steady compared to 2010. It appears some 3PLs are spending more aggressively, as 22 percent of the respondents in this year’s study report spending 15 percent or more of their IT budget to purchase and support ITM systems. That’s up from 15 percent in 2010.
Thismakessense—3PLsshouldspendmoreonITMsystems,because in many ways this is their product. It’s hard to imagine a 3PL can be competitive in today’s logistics market without the support of sophisticated technology.
0%
10%
20%
30%
40%
50%
60%
More than15 percent
11 to 15percent
5 to 10percent
Less than5 percent
None
3PLs
Shippers
16%
33%
46%
54%
16%
9%
4%
22%
1%0%
f I g u r E 8 : Percent of IT Budget Spent on ITM Systems
147 total respondents

SE
ct
Ion
III
: t
hE
St
at
E o
f I
tm
International Transportation Management | Benchmark Report: 2011
10
Respondentswereaskedtoratetheperceivedreturnoninvestmenttheircompany has seen from investments in ITM systems managing inbound transportation,outbound,orboth.Almostallrespondentsratedboththeir inbound and outbound transportation processes, but the differ-ences between the two were negligible.
Overall ratings rose noticeably from 2010, where 70 percent of respon-dentsratedtheirROIaverageorbetter.Thisyearmorethatnumberstands closer to 85 percent, suggesting that the new technology shippers and 3PLs are buying or upgrading is working.
Excellent
Good
Fair
Poor
Very Poor
0%
20%
40%
60%
80%
100%
OutboundInbound
22%16%
34%42%
29%32%
14% 1%11%
f I g u r E 9 : ROI from ITM Systems
99 total respondents
SE
ct
Ion
III
: t
hE
St
at
E o
f I
tm
International Transportation Management | Benchmark Report: 2011
11
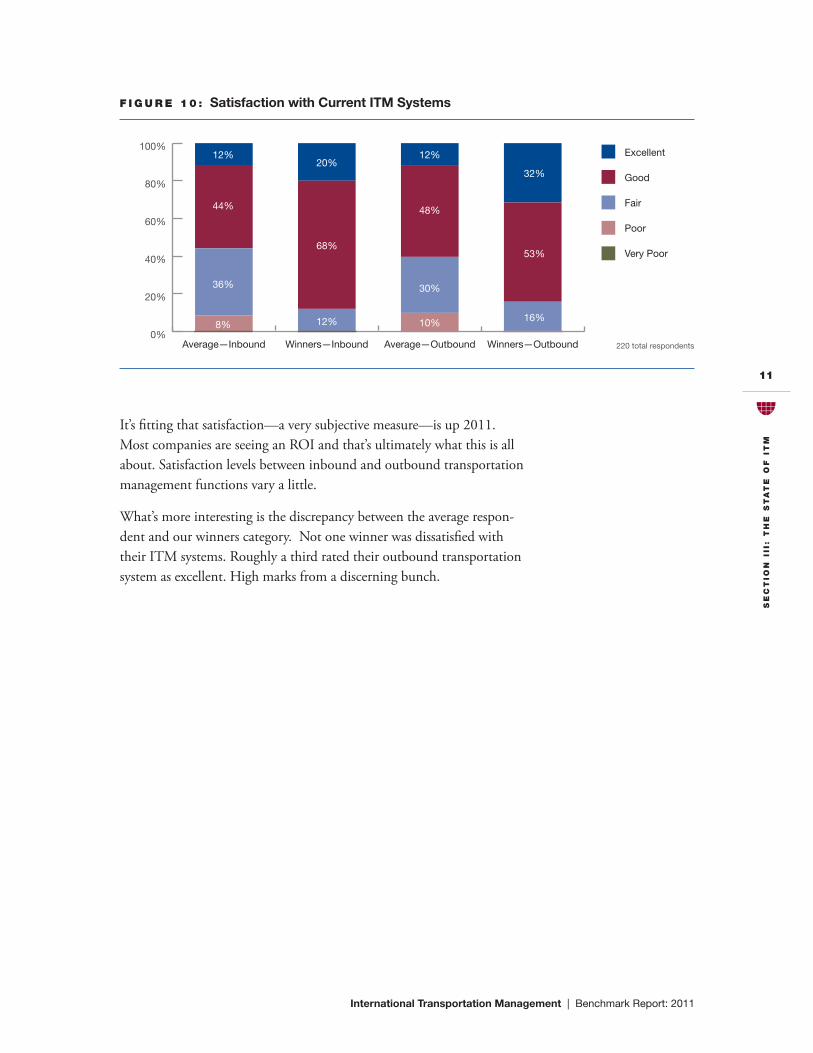
It’sfittingthatsatisfaction—averysubjectivemeasure—isup2011.MostcompaniesareseeinganROIandthat’sultimatelywhatthisisallabout. Satisfaction levels between inbound and outbound transportation management functions vary a little.
What’s more interesting is the discrepancy between the average respon-dent and our winners category. Not one winner was dissatisfied with theirITMsystems.Roughlyathirdratedtheiroutboundtransportationsystemasexcellent.Highmarksfromadiscerningbunch.
0%
20%
40%
60%
80%
100%
Winners—OutboundAverage—OutboundWinners—InboundAverage—Inbound
Excellent
Good
Fair
Poor
Very Poor
32%
53%
16%
12%
36%
44%
8%
20%
68%
12%
12%
48%
30%
10%
f I g u r E 1 0 : Satisfaction with Current ITM Systems
220 total respondents
SE
ct
Ion
III
: t
hE
St
at
E o
f I
tm
International Transportation Management | Benchmark Report: 2011
12
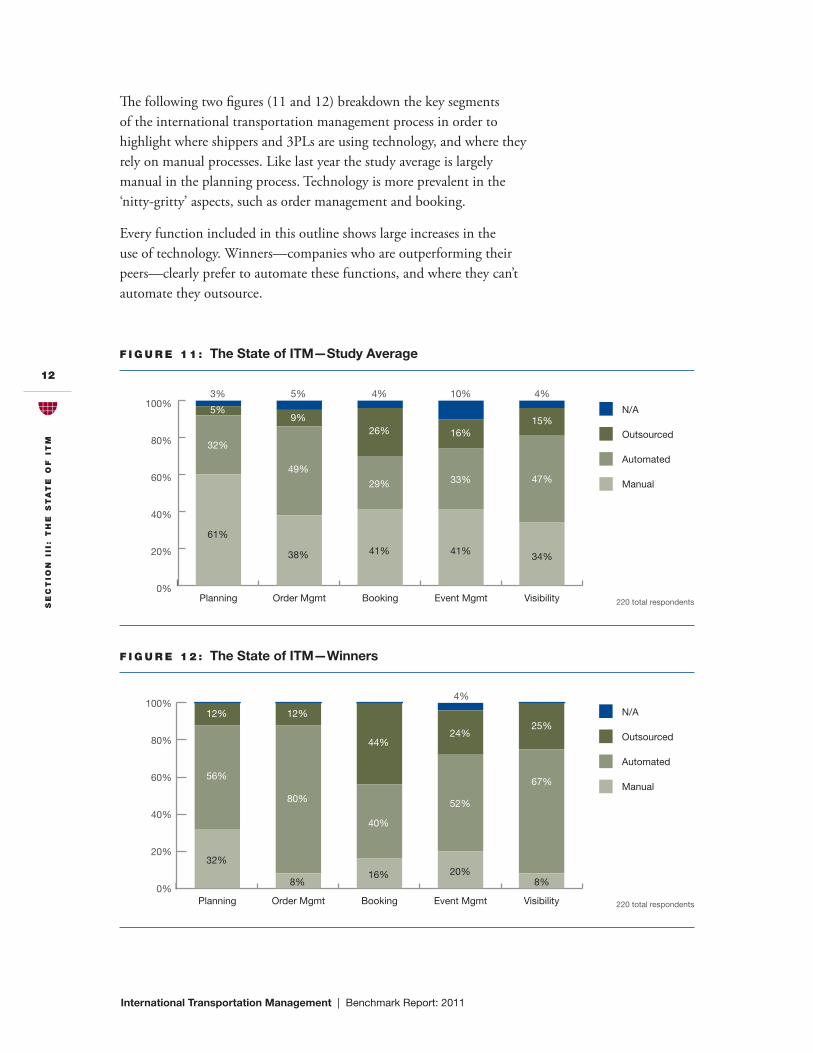
The following two figures (11 and 12) breakdown the key segments of the international transportation management process in order to highlight where shippers and 3PLs are using technology, and where they rely on manual processes. Like last year the study average is largely manual in the planning process. Technology is more prevalent in the ‘nitty-gritty’ aspects, such as order management and booking.
Every function included in this outline shows large increases in the useoftechnology.Winners—companieswhoareoutperformingtheirpeers—clearlyprefertoautomatethesefunctions,andwheretheycan’tautomate they outsource.
0%
20%
40%
60%
80%
100%
VisibilityEvent MgmtBookingOrder MgmtPlanning
N/A
Outsourced
Automated
Manual
16%
10%
33%
41%
15%
4%
47%
34%
3%
32%
5%
61%
9%
5%
49%
38%
4%
26%
29%
41%
0%
20%
40%
60%
80%
100%
VisibilityEvent MgmtBookingOrder MgmtPlanning
N/A
Outsourced
Automated
Manual
24%
52%
20%
25%
67%
8%
56%
12%
32%
12%
80%
8%
4%
44%
40%
16%
f I g u r E 1 1 : The State of ITM—Study Average
f I g u r E 1 2 : The State of ITM—Winners
220 total respondents
220 total respondents

SE
ct
Ion
III
: t
hE
St
at
E o
f I
tm
International Transportation Management | Benchmark Report: 2011
13
The average respondent to this year’s survey is using one fewer ITM system or platform than they were a year prior. This “patchwork” of systems and manual processes has been documented for the past three years by this report, and evidence that things may be getting less complex is a good thing for many who struggle with integration headaches.
However,thistechnologymarketremainshighlyfragmented,andit’sunlikely that shippers or 3PLs will be able to automate more of their ITM effectively without tapping multiple systems, and ultimately more vendors.Rememberthatoursurveyrespondentsaremanagingmulti-modal transportation. Processes and requirements vary widely across transportation modes, creating a need for specific systems to meet those demands.
Like last year, our winners still have more technology than the average. However,itappearstheyhavebeenthemostaggressiveincuttingbackon the number of unique systems they are using.
0 1 2 3 4 5 6
Winners '11
Winners '10
Retailers '11
Retailers '10
Manufacturers '11
Manufacturers '10
Average '11
Average '10
3PLs '11
3PLs '10 5.2
4.6
4.6
3.6
4.3
3.7
4.1
3.3
5.7
3.9
f I g u r E 1 3 : Number of ITM Systems
99 total respondents

SE
ct
Ion
III
: t
hE
St
at
E o
f I
tm
International Transportation Management | Benchmark Report: 2011
14
International transportation is an inherently collaborative exercise that demands electronic connectivity to logistics providers and other suppliers. On average shippers and 3PLs have 8.2 unique integrations, while winners average 9.2. Naturally 3PLs have considerably more integrations due to their role as hubs of the international transportation network.
Those connections are only going to be as useful as the data that they transmit. Survey respondents rated the quality of data provided by various providers in terms of timeliness, accuracy and completeness. The results are surprisingly good if you believe the conventional wisdom that carriers, in particular, do a terrible job providing quality data.
Data quality is the cornerstone of visibility. If data related to an interna-tional shipment is late, inaccurate, incomplete or otherwise unavailable, shippers and 3PLs have no chance to make the adjustments that can save time, money or both.
0%
20%
40%
60%
80%
100%
3PLsOceanCarriers
AirCarriers
MotorCarriers
CustomersRail/Intermodal
Suppliers
Excellent
Good
Fair
Poor
Very Poor
41%
41%
3%10%
6%
46%
39%
9%
5%
49%
35%
10%
15%
45%
32%
7%
41%
33%
5%
2% 1% 1% 1%
20%
7%
33%
15%
38%
7%
5%2%
36%
38%
5%
19%
f I g u r E 1 5 : Quality of Data Provided by Partners
175 total respondents
0 3 6 9 12 15
Manufacturers
Retailers
Study Average
Winners
3PLS 13.1
9.2
8.2
7.3
6.1
f I g u r E 1 4 : Number of Unique Integrations to Carriers, 3PLs, Portals, etc.
180 total respondents

SE
ct
Ion
III
: t
hE
St
at
E o
f I
tm
International Transportation Management | Benchmark Report: 2011
15
Roughlyoneinthreeleveragetheirexpertisetoshapeuptheirprocessesand technology, down from more than 40 percent in 2010. Most notably, 3PLs showed a drop from above 50 percent to 32 percent. Bear in mind Fig. 7 showed that 22 percent of the respondents implemented or updated an ITM system within the last year. Perhaps the winding down of those projects accounts for some of the drop off.
f I g u r E 1 6 : Use of Systems Integrators and Consultants
154 total respondents0%
20%
40%
60%
80%
100%
3PLsManufacturersRetail/WholesaleWinners
No
Yes
68%
32%
64%
36%
63%
37%
68%
32%
SE
ct
Ion
III
: t
hE
St
at
E o
f I
tm
International Transportation Management | Benchmark Report: 2011
16
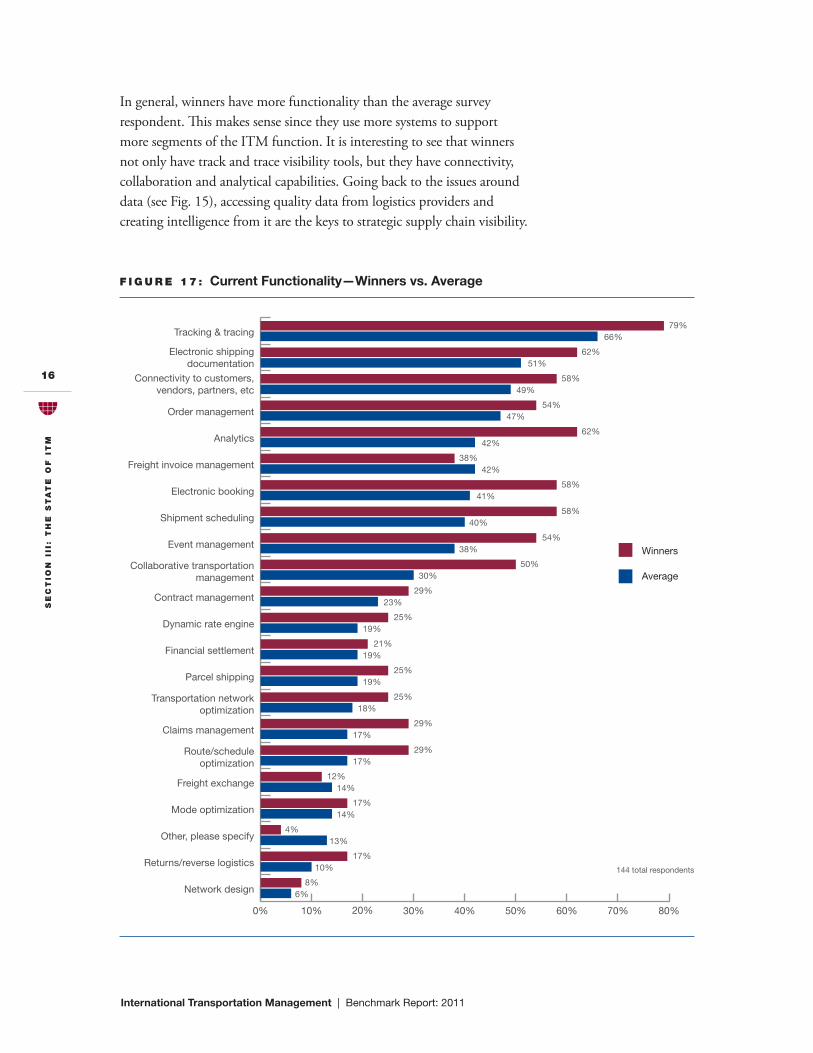
In general, winners have more functionality than the average survey respondent. This makes sense since they use more systems to support more segments of the ITM function. It is interesting to see that winners not only have track and trace visibility tools, but they have connectivity, collaboration and analytical capabilities. Going back to the issues around data (see Fig. 15), accessing quality data from logistics providers and creating intelligence from it are the keys to strategic supply chain visibility.
0% 10% 20% 30% 40% 50% 60% 70% 80%
Network design
Returns/reverse logistics
Other, please specify
Mode optimization
Freight exchange
Route/scheduleoptimization
Claims management
Transportation networkoptimization
Parcel shipping
Financial settlement
Dynamic rate engine
Contract management
Collaborative transportationmanagement
Event management
Shipment scheduling
Electronic booking
Freight invoice management
Analytics
Order management
Connectivity to customers,vendors, partners, etc
Electronic shippingdocumentation
Tracking & tracing
Winners
Average
79% 66%
62% 51%
58% 49%
54% 47%
62% 42%
38% 42%
58% 41%
58% 40%
54% 38%
50% 30%
29% 23%
25% 19%
21% 19%
25% 19%
25% 18%
29% 17%
29% 17%
12% 14%
17% 14%
4% 13%
17% 10%
8% 6%
f I g u r E 1 7 : Current Functionality—Winners vs. Average
144 total respondents
SE
ct
Ion
III
: t
hE
St
at
E o
f I
tm
International Transportation Management | Benchmark Report: 2011
17
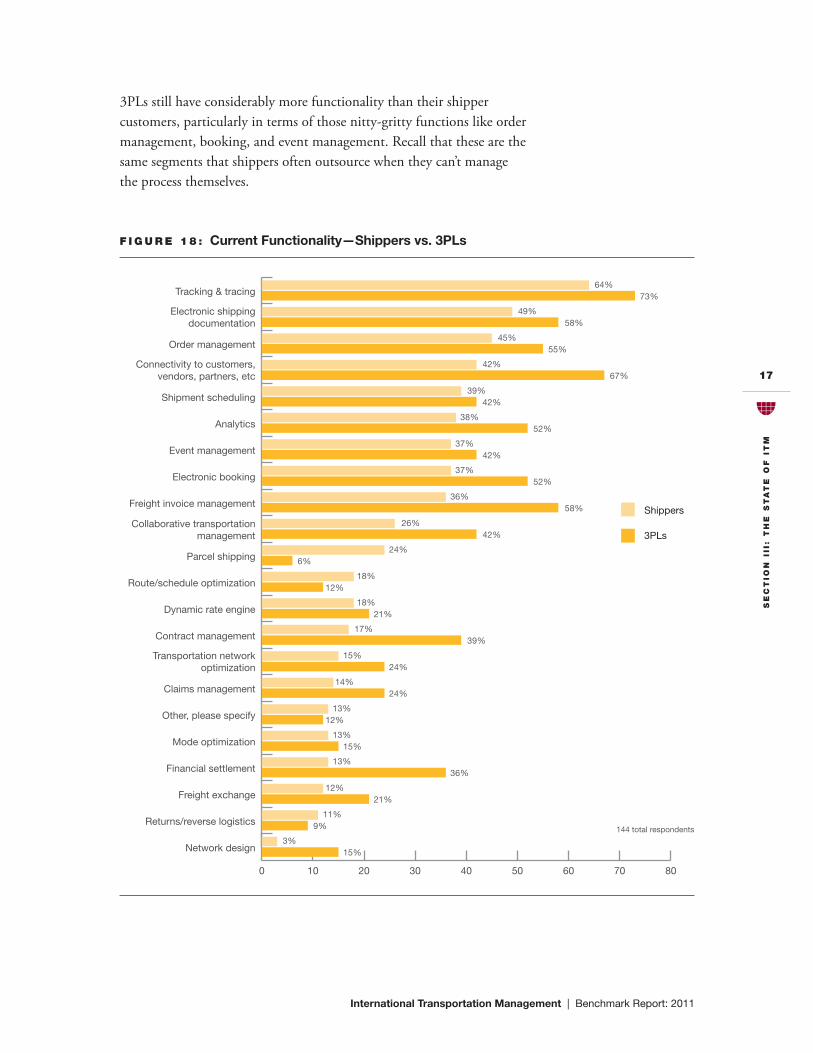
3PLs still have considerably more functionality than their shipper customers, particularly in terms of those nitty-gritty functions like order management,booking,andeventmanagement.Recallthatthesearethesame segments that shippers often outsource when they can’t manage the process themselves.
0 10 20 30 40 50 60 70 80
Network design
Returns/reverse logistics
Freight exchange
Financial settlement
Mode optimization
Other, please specify
Claims management
Transportation networkoptimization
Contract management
Dynamic rate engine
Route/schedule optimization
Parcel shipping
Collaborative transportationmanagement
Freight invoice management
Electronic booking
Event management
Analytics
Shipment scheduling
Connectivity to customers,vendors, partners, etc
Order management
Electronic shippingdocumentation
Tracking & tracing 64% 73%
49% 58%
45% 55%
42% 67%
39% 42%
38% 52%
37% 42%
37% 52%
36% 58%
26% 42%
24% 6%
18% 12%
18% 21%
17% 39%
15% 24%
14% 24%
13% 12%
13% 15%
13% 36%
12% 21%
11% 9%
3% 15%
Shippers
3PLs
f I g u r E 1 8 : Current Functionality—Shippers vs. 3PLs
144 total respondents
SE
ct
Ion
Iv
: t
hE
bE
nE
fIt
S o
f a
ut
om
at
Ion
International Transportation Management | Benchmark Report: 2011
18
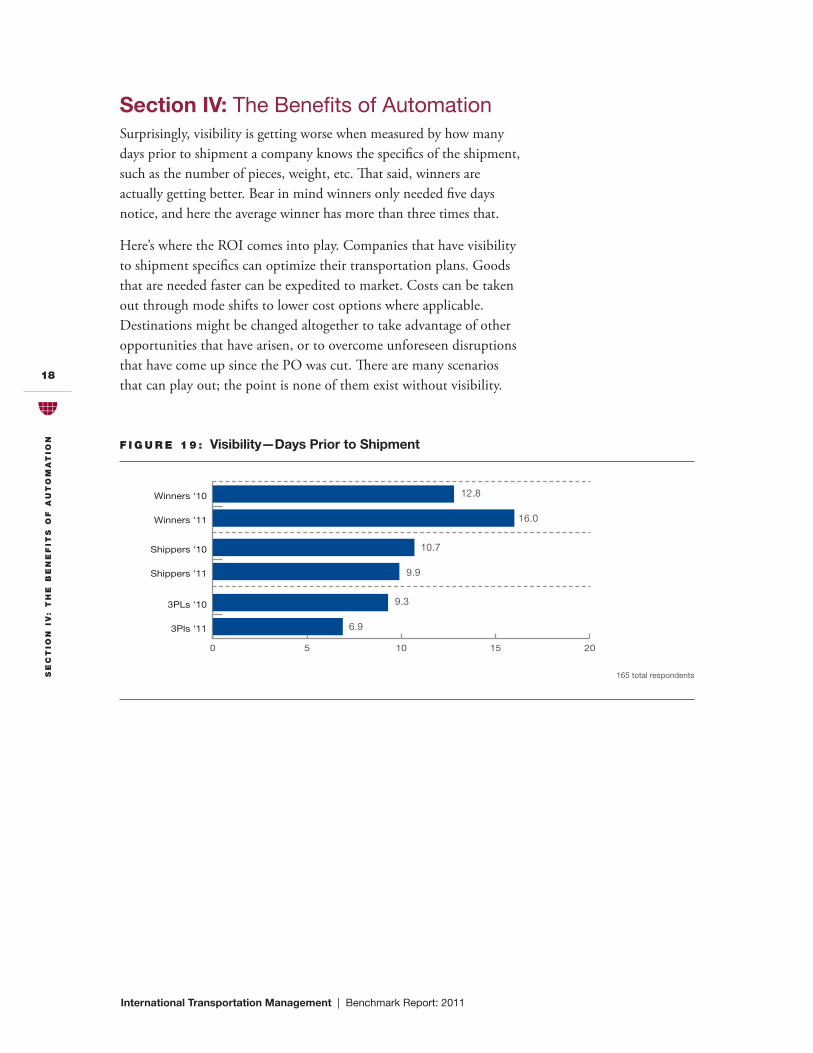
Section IV: The Benefits of AutomationSurprisingly, visibility is getting worse when measured by how many days prior to shipment a company knows the specifics of the shipment, such as the number of pieces, weight, etc. That said, winners are actually getting better. Bear in mind winners only needed five days notice, and here the average winner has more than three times that.
Here’swheretheROIcomesintoplay.Companiesthathavevisibilityto shipment specifics can optimize their transportation plans. Goods thatareneededfastercanbeexpeditedtomarket.Costscanbetakenout through mode shifts to lower cost options where applicable. Destinations might be changed altogether to take advantage of other opportunities that have arisen, or to overcome unforeseen disruptions that have come up since the PO was cut. There are many scenarios that can play out; the point is none of them exist without visibility.
0 5 10 15 20
3Pls '11
3PLs '10
Shippers '11
Shippers '10
Winners '11
Winners '10 12.8
16.0
10.7
9.9
9.3
6.9
f I g u r E 1 9 : Visibility—Days Prior to Shipment
165 total respondents

SE
ct
Ion
Iv
: t
hE
bE
nE
fIt
S o
f a
ut
om
at
Ion
International Transportation Management | Benchmark Report: 2011
19
Productivity levels have remained relatively steady from 2010. Freight volumesacrossthetradescoveredbyAmericanShipperremainflatwhilefirms have continued to hold off adding more staff to support what we believe are historically lean international transportation departments. 3PLs saw further increases in productivity as they continue to handle more and more international freight volumes and their role in the supply chain becomes more significant.
2009
2010
2011
0 300 600 900 1,200 1,500
3PLs
Manual(excluding 3PL)
Automated(excluding 3PL)
Winners
1,244 1,299 1,230
1,235 1,362 1,288
295 321 244
83 207 246
f I g u r E 2 0 : Productivity—PO per Year per FTE
220 total respondents
SE
ct
Ion
Iv
: t
hE
bE
nE
fIt
S o
f a
ut
om
at
Ion
International Transportation Management | Benchmark Report: 2011
20
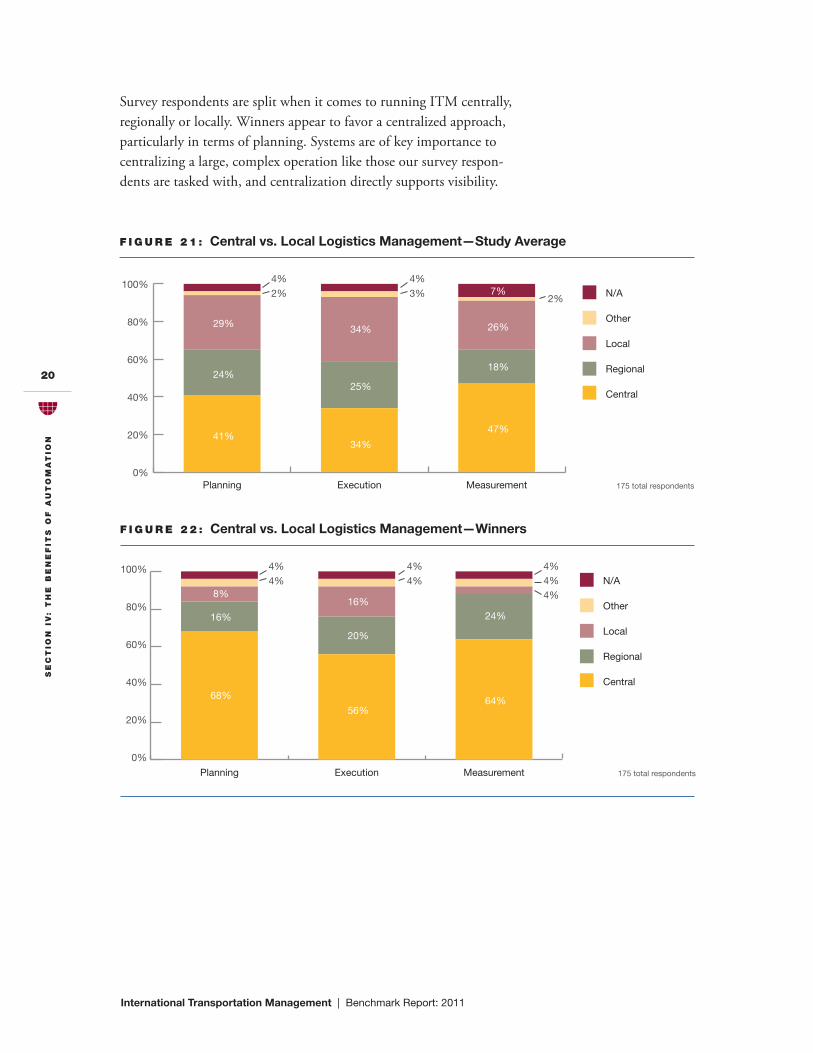
Survey respondents are split when it comes to running ITM centrally, regionally or locally. Winners appear to favor a centralized approach, particularly in terms of planning. Systems are of key importance to centralizing a large, complex operation like those our survey respon-dents are tasked with, and centralization directly supports visibility.
0%
20%
40%
60%
80%
100%
MeasurementExecutionPlanning
N/A
Other
Local
Regional
Central
4%
4%
16%
8%
68%
16%
20%
56%
24%
64%
4%
4%4%4%
4%
f I g u r E 2 2 : Central vs. Local Logistics Management—Winners
175 total respondents
0%
20%
40%
60%
80%
100%
MeasurementExecutionPlanning
N/A
Other
Local
Regional
Central
2%
4%
24%
29%
41%
34%
25%
34%
7%
18%
26%
47%
3%
4%
2%
f I g u r E 2 1 : Central vs. Local Logistics Management—Study Average
175 total respondents
SE
ct
Ion
Iv
: t
hE
bE
nE
fIt
S o
f a
ut
om
at
Ion
International Transportation Management | Benchmark Report: 2011
21
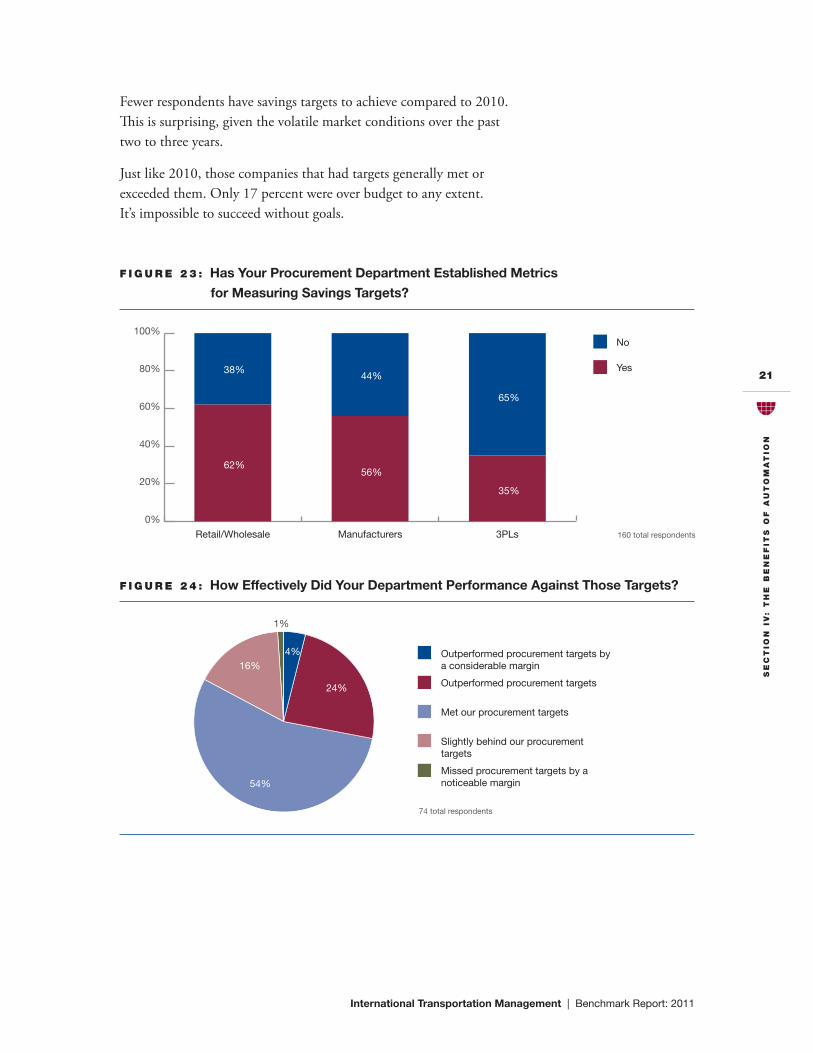
Fewer respondents have savings targets to achieve compared to 2010. This is surprising, given the volatile market conditions over the past two to three years.
Just like 2010, those companies that had targets generally met or exceeded them. Only 17 percent were over budget to any extent. It’s impossible to succeed without goals.
0%
20%
40%
60%
80%
100%
3PLsManufacturersRetail/Wholesale
No
Yes38%
62%
44%
56%
65%
35%
f I g u r E 2 3 : Has Your Procurement Department Established Metrics
for Measuring Savings Targets?
160 total respondents
Outperformed procurement targets by a considerable margin
Outperformed procurement targets
Met our procurement targets
Slightly behind our procurement targets
Missed procurement targets by a noticeable margin
4%
24%
1%
54%
16%
f I g u r E 2 4 : How Effectively Did Your Department Performance Against Those Targets?
74 total respondents

SE
ct
Ion
v:
th
E f
ut
ur
E o
f I
tm
S
International Transportation Management | Benchmark Report: 2011
22
Section V: The Future of ITMSThemarketforITMsystemslooksnearlyidenticaltolastyear.About20 percent of survey respondents are budgeted to make some addition to their portfolio in the next two years, while another 16 percent are considering the idea.
Satisfactionwiththecurrentprocess—manual,automatedor otherwise—remainsthenumberonereasonshippersand3PLsare notinvestinginnewITMsystems.Alackofresources,duetorecentinvestments in ITM systems, ranks third with 12 percent.
2009
2010
2011
0% 10% 20% 30% 40% 50% 60% 70% 80%
Budgeted within the next 12 months
Budgeted within the next
12–24 months
On our company’s 5-year plan
No plans to replace 50% 66% 64%
28% 15% 16%
14% 10% 12%
9% 9%8%
f I g u r E 2 5 : Plans to Buy/Replace/Upgrade ITM Systems
156 total respondents
Available systems do not provide the functionality we require
We do not have the technical expertise to make a change
We’re in the process of upgrading or replacing our system
Organizational resistance to change
Lacks return on investment
We recently upgraded or replaced our system
None of these
Current system meets our needs
4% 5%5%
8%
9%
12%
17%
39%
f I g u r E 2 6 : Inhibitors to Investment in ITM Systems
99 total respondents
SE
ct
Ion
v:
th
E f
ut
ur
E o
f I
tm
S
International Transportation Management | Benchmark Report: 2011
23
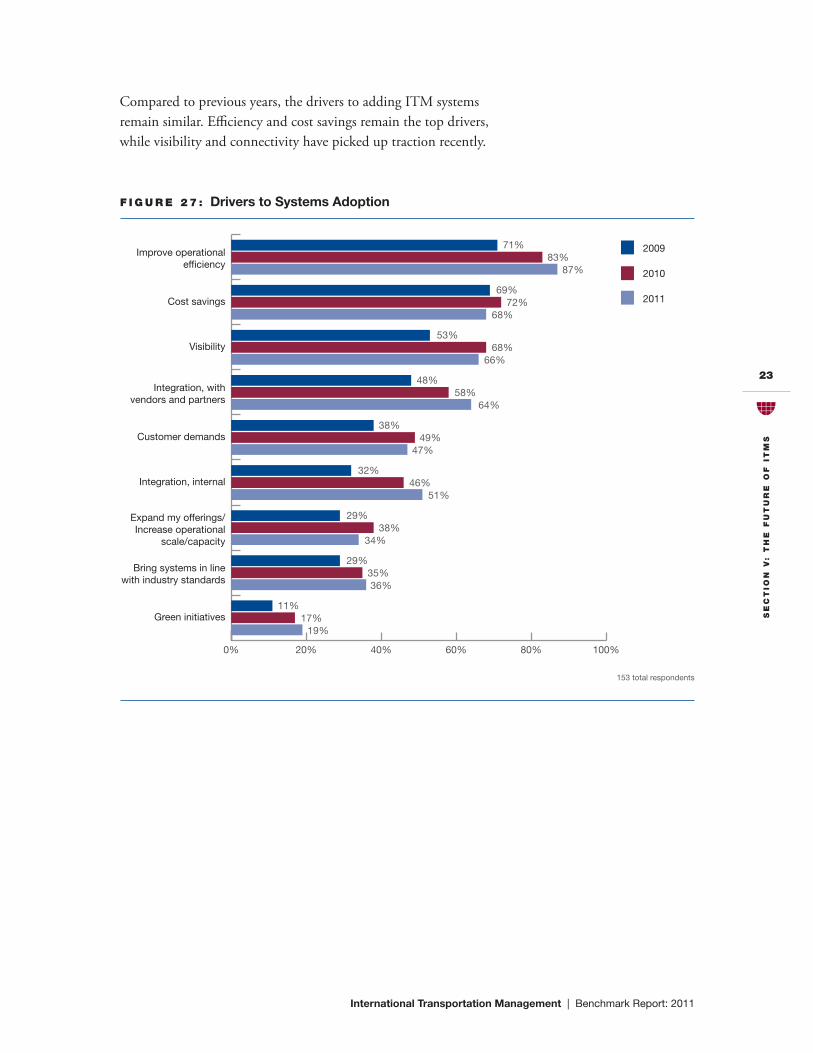
Comparedtopreviousyears,thedriverstoaddingITMsystems remain similar. Efficiency and cost savings remain the top drivers, while visibility and connectivity have picked up traction recently.
0% 20% 40% 60% 80% 100%
Green initiatives
Bring systems in line with industry standards
Expand my offerings/Increase operational
scale/capacity
Integration, internal
Customer demands
Integration, with vendors and partners
Visibility
Cost savings
Improve operationalefficiency
2009
2010
2011
71% 83% 87%
69% 72% 68%
53% 68% 66%
48% 58% 64%
38% 49% 47%
32% 46% 51%
29% 38% 34%
29% 35% 36%
11% 17% 19%
f I g u r E 2 7 : Drivers to Systems Adoption
153 total respondents
SE
ct
Ion
v:
th
E f
ut
ur
E o
f I
tm
S
International Transportation Management | Benchmark Report: 2011
24
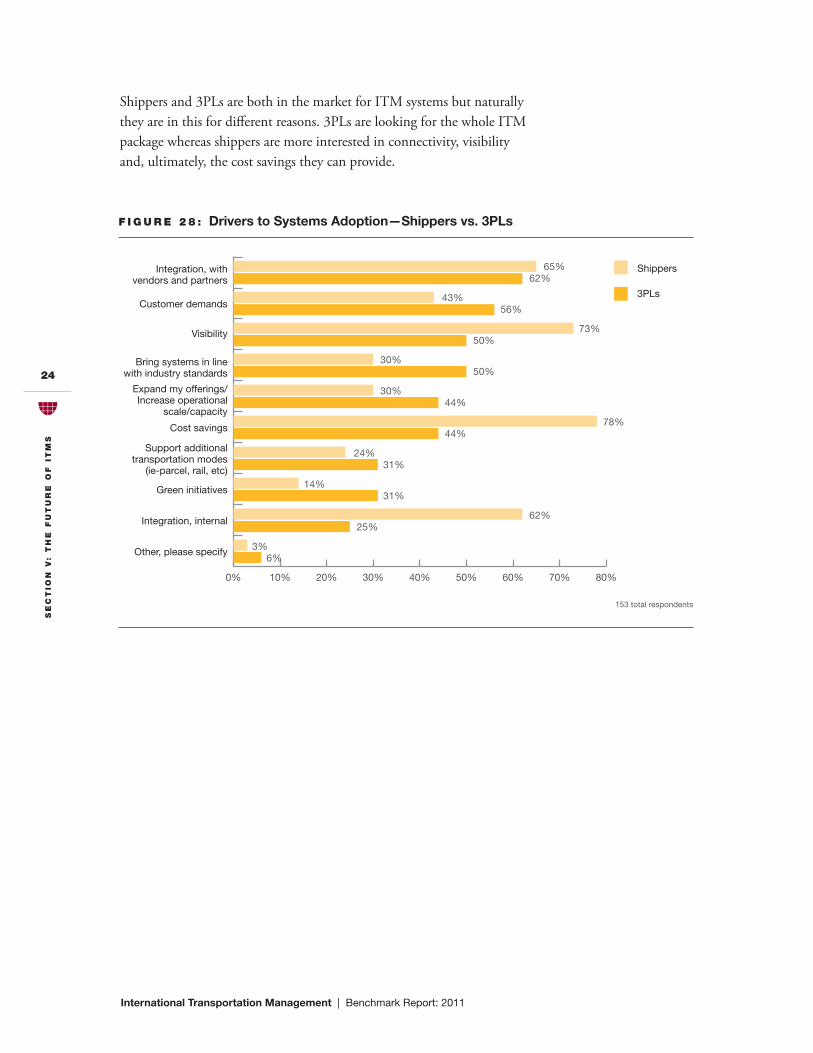
Shippers and 3PLs are both in the market for ITM systems but naturally they are in this for different reasons. 3PLs are looking for the whole ITM package whereas shippers are more interested in connectivity, visibility and, ultimately, the cost savings they can provide.
0% 10% 20% 30% 40% 50% 60% 70% 80%
Other, please specify
Integration, internal
Green initiatives
Support additionaltransportation modes
(ie-parcel, rail, etc)
Cost savings
Expand my offerings/Increase operational
scale/capacity
Bring systems in linewith industry standards
Visibility
Customer demands
Integration, withvendors and partners
Shippers
3PLs
65% 62%
43% 56%
73% 50%
30% 50%
30% 44%
78% 44%
24% 31%
14% 31%
62% 25%
3% 6%
f I g u r E 2 8 : Drivers to Systems Adoption—Shippers vs. 3PLs
153 total respondents
SE
ct
Ion
v:
th
E f
ut
ur
E o
f I
tm
S
International Transportation Management | Benchmark Report: 2011
25
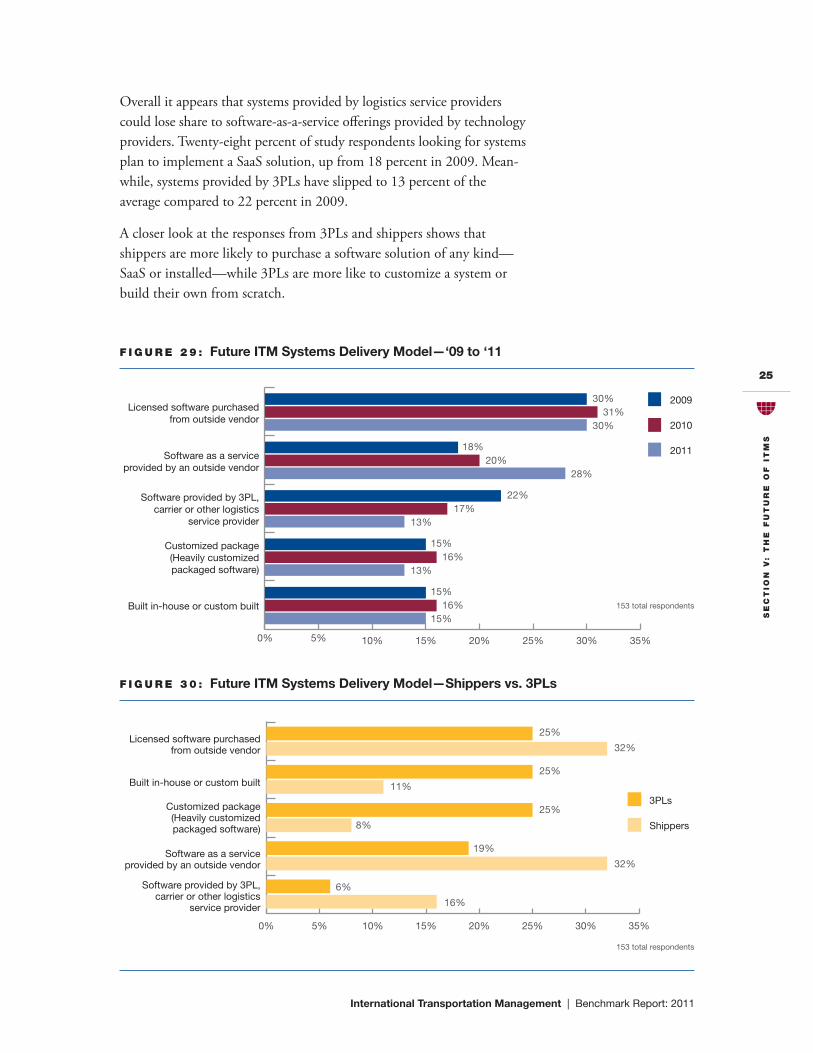
Overall it appears that systems provided by logistics service providers could lose share to software-as-a-service offerings provided by technology providers. Twenty-eight percent of study respondents looking for systems plan to implement a SaaS solution, up from 18 percent in 2009. Mean-while, systems provided by 3PLs have slipped to 13 percent of the average compared to 22 percent in 2009.
Acloserlookattheresponsesfrom3PLsandshippersshowsthatshippersaremorelikelytopurchaseasoftwaresolutionofanykind—SaaSorinstalled—while3PLsaremoreliketocustomizeasystemorbuild their own from scratch.
2009
2010
2011
0% 5% 10% 15% 20% 25% 30% 35%
Built in-house or custom built
Customized package(Heavily customizedpackaged software)
Software provided by 3PL,carrier or other logistics
service provider
Software as a serviceprovided by an outside vendor
Licensed software purchasedfrom outside vendor
30% 31% 30%
18% 20% 28%
22% 17%13%
15% 16%13%
15% 16% 15%
f I g u r E 2 9 : Future ITM Systems Delivery Model—‘09 to ‘11
153 total respondents
3PLs
Shippers
0% 5% 10% 15% 20% 25% 30% 35%
Software provided by 3PL,carrier or other logistics
service provider
Software as a serviceprovided by an outside vendor
Customized package(Heavily customizedpackaged software)
Built in-house or custom built
Licensed software purchasedfrom outside vendor
25%
32%
25%
11%
25%
8%
19%
32%
6%
16%
f I g u r E 3 0 : Future ITM Systems Delivery Model—Shippers vs. 3PLs
153 total respondents

SE
ct
Ion
vI:
WIn
nE
rS
International Transportation Management | Benchmark Report: 2011
26
Section VI: WinnersWinners appear to be breaking away from the pack in terms of results in2011.Herearesomeofthebestpracticeshighlightedinthisreportthat have a strong correlation to this group’s performance.
•WinnersembracetechnologyandexpectstrongROIinterms of cost savings and increased capabilities.
•Winnerssqueezevaluefromtheirsystems.Theygetfarmorefunctionality from only slightly more technology.
•WinnerscentralizetheirITMprocesseswherepossibletoachievescale, control and, ultimately, higher visibility.
•Winnersfocusonimprovingsupplychainvisibilitytounlock the strategic value of their systems investments.
•Winnersseektolimitthenumberofsystemstheyuse,wherepossible, but continue to embrace a network of applications to support strategic functions.
•Winnersdemandqualitydatafrominternationaltransportationvendors and partners to support visibility initiatives.

ap
pE
nD
Ix b
: a
bo
ut
ou
r S
po
nS
or
S
International Transportation Management | Benchmark Report: 2011
27
Appendix B: About Our Sponsors
b r av o S o L u t I o n
BravoSolution offers leading software and services to fit the needs of today’s sophisticated supply management organisations. Our services organization, one of the world’s largest teams of professionals dedicated exclusively to sourcing and procurement consulting, delivers lean, targeted services to support strategic sourcing and procurement initiatives. Our industry leading software toolkit supports the full supply manage-ment lifecycle across myriad industries, geographies and business models.
Asoftoday,over40,000procurementprofessionalsin60differentcountries are benefiting from BravoSolution’s technology and services, unlocking tangible benefits including of increased process efficiency, decision support, cost reduction, improved process governance, greater quality relationships with vendors and the ability to share, understand and act upon the wealth of sourcing-related data held within their organization.
c h r o b I n S o n
Foundedin1905,C.H.RobinsonWorldwide,Inc.isoneoftheworld’slargest third party logistics companies, providing global freight services and the world’s first global Managed TMS® solution, as well as logistics outsourcesolutions,freshproducesourcing,andpaymentservices.C.H.Robinson’s36,000-pluscustomersrangefromFortune500companiestosmall businesses in a variety of industries. For more information, visit our website at www.chrobinson.com.

ap
pE
nD
Ix b
: a
bo
ut
ou
r S
po
nS
or
S
International Transportation Management | Benchmark Report: 2011
28
D E S c a rt E S
Descartes(TSX:DSG)(NASDAQ:DSGX)isthepremierprovider ofGlobalTradeCompliance,SupplyChainExecutionandMobileResourceManagementservices.Descartes’GlobalLogisticsNetwork(GLN) unites global businesses and trading partners, allowing them to collaborate in a cost effective way and maximize productivity and efficiency. Trading partners that connect to the GLN join Descartes’ Federated Network, the world’s most extensive multi-modal business network with over 35,000 trading partners connected, including ground carriers, airlines, ocean carriers, freight forwarders, third-party providers of logistics services customs house brokers, freight payment agencies, manufacturers, retailers, distributors, mobile services providers and regulatory agencies.
DescartesisheadquarteredinWaterloo,Ontario,CanadaandhasofficesinNorthAmerica,EMEAandAsia-Pacific.Moreinformationand industry updates are available at www.descartes.com and http://blog.descartes.com.
g t n E x u S
GT Nexus offers a cloud-based platform that the world’s biggest companies use to drive efficiency and agility across the global supply chain. Leaders in manufacturing, retail and logistics services all share GT Nexus as their standard, multi-enterprise collaboration platform. Users operate against a core set of information across multiple supply chainfunctionstooptimizetheflowofgoodsandtradeinformation,fromorderpointtofinalpayment.CustomersincludeXerox,Williams-Sonoma,Nestlé,DHL,Sears,Caterpillar,KraftFoods andTheHomeDepot.Forinformation,visitwww.gtnexus.com.
ap
pE
nD
Ix b
: a
bo
ut
ou
r S
po
nS
or
S
International Transportation Management | Benchmark Report: 2011
29
S a p
Asmarketleaderinenterpriseapplicationsoftware,SAP(NYSE:SAP)helps companies of all sizes and industries run better. From back office to boardroom, warehouse to storefront, desktop to mobile device—SAPempowerspeopleandorganizationstoworktogethermore efficiently and use business insight more effectively to stay ahead ofthecompetition.SAPapplicationsandservicesenablemorethan172,000 customers (includes customers from the acquisition of Sybase) to operate profitably, adapt continuously, and grow sustainably. For more information, visit www.sap.com.
Transform your linear supply chain into a responsive supply network, and quickly adapt to ever-changing markets. Our supply chain management software can help you synchronize your planning, distribution,transportation,andlogistics—foran‘alwayson’24/7operation.Recognizedbykeyindustryanalystsasoneofthemarket-leadingsupplychainmanagement(SCM)softwaresolutions,SAPSCMcanalsohelpmaintainyourrelationshipswithsuppliers,customers,andcontractmanufacturers—facilitatingyourconnectionsand collaboration around the globe.
LearnmoreaboutourSCMsolutions

ap
pE
nD
Ix a
: a
bo
ut
ou
r p
ar
tn
Er
International Transportation Management | Benchmark Report: 2011
30
Appendix A: About Our Partner
r E ta I L I n D u S t ry L E a D E r S a S S o c I at I o n ( r I L a )
RILAisthetradeassociationoftheworld’slargestandmostinnovativeretailcompanies.RILAmembersincludemorethan200retailers,product manufacturers, and service suppliers, which together account formorethan$1.5trillioninannualsales,millionsofAmerican jobs and operate more than 100,000 stores, manufacturing facilities and distribution centers domestically and abroad. For additional information visit www.rila.org

ap
pE
nD
Ix c
: a
bo
ut
am
Er
Ica
n S
hIp
pE
r r
ES
Ea
rc
h
International Transportation Management | Benchmark Report: 2011
31
appendix c: About American Shipper Research
backgrounD
Since our first edition in May 1974, American Shipper has provided U.S.-based logistics practitioners with accurate, timely and actionable news and analysis. The company is widely recognized as the voice of the international transportation community.
In 2008 American Shipper launched its first formal, independent research initiative focused on the state of transportation management systems in the logistics service provider market. Since that time the company has published more than a dozen reports on subjects ranging from regulatory compliance to sustainability.
ScopE
American Shipper research initiatives typically address international or global supply chain issues from a U.S.-centric point of view. The research will be most relevant to those readers managing large volumes of airfreight, containerized ocean and domestic intermodal freight. American Shipper readers are tasked withmanaginglargevolumesoffreightmovingintoandoutofthecountrysotheresearchscopereflectsthose interests.
mEthoDoLogy
American Shipper benchmark studies are based upon responses from a pool of approximately 30,000 readers accessible by e-mail invitation. Generally each benchmarking project is based on 200-500 qualified responses to a 25-35 question survey depending on the nature and complexity of the topic.
American Shipper reports compare readers from key market segments defined by industry vertical, company size, and other variables, in an effort to call out trends and ultimate best practices. Segments created for comparisons always consist of more than 50 responses to keep the potential margin of error to a minimum.
LIbrary
American Shipper’s complete library of research is available on our Website: AmericanShipper.com/Research.
Annual studies include:• EnvironmentalSustainability
• ExportCompliance
• ImportCompliance
• InternationalTransportationManagement
• TransportationInvoicePayment
• TransportationProcurement
contact
Jim Blaeser Publisher American Shipper [email protected]
International Transportation Management | Benchmark Report: 2011
32
copyright© 2011 by howard publications, Inc. all rights reserved.
No part of the contents of this document may be reproduced or transmitted
in any form or by any means without the permission of the publisher.