international space station operational experience and its
TRANSCRIPT

48th International Conference on Environmental Systems ICES-2018-198 8-12 July 2018, Albuquerque, New Mexico
Copyright © 2018 MIT
International Space Station Operational Experience and its
Impacts on Future Mission Supportability
Andrew C. Owens1 and Olivier L. de Weck2
Massachusetts Institute of Technology, Cambridge, MA 02139, USA
Operational experience gained on the International Space Station (ISS) has enabled
significant improvements in failure rate estimates for various Orbital Replacement Units
(ORUs). These improved estimates, in turn, allow more efficient and accurate spare parts
allocations for future missions, enabling significant reductions in both logistics mass and risk.
This paper examines the value of ISS experience to date in terms of its impact on
supportability for future missions. A supportability model is presented that assesses the spares
required as a function of mission endurance and risk, taking into account uncertainty in
failure rate estimates. Changes in ISS Environmental Control and Life Support (ECLSS)
ORU failure rate estimates are described and discussed, both in terms of the overall
population of ORUs and the evolution of failure rate estimates over time for a particular item.
The value of those updated failure rate estimates is assessed by calculating the estimated
spares mass requirements for two cases, using the initial, pre-ISS estimates and using the
estimates informed by on-orbit experience. Hidden risk resulting from underestimated failure
rates is also assessed. These results indicate that, for a 1,200-day Mars mission, ISS experience
has enabled a 3.9 t to 6.0 t reduction in ECLSS spares mass required and uncovered failure
rate underestimates that would have resulted in an order of magnitude increase in risk had
they not been discovered and corrected. The implications of these results for system
development and mission planning are discussed, including approaches to accelerate the rate
of failure rate refinement and the risks associated with making changes or introducing new
systems. Overall, test time is a critical factor that must be carefully considered in system
development, and new systems must budget appropriate time for testing in a relevant
environment or accept higher risk and logistics requirements on future missions.
Nomenclature
ℝ = Set of real numbers
𝛼 = Gamma shape parameter
𝛽 = Gamma scale parameter
𝜅 = K-factor
Λ = Failure rate (random variable)
𝜆 = Failure rate
𝜆̅ = Mean failure rate
𝜆𝐸𝐹 = Error factor
𝜇 = Lognormal scale parameter
𝜎 = Lognormal shape parameter
𝜏 = Mission endurance
Υ = Poisson parameter for a gamma-Poisson distribution (random variable)
𝜐 = Poisson parameter for a gamma-Poisson distribution
𝑁 = Number of failures (random variable)
𝑚 = Mass
1 PhD Candidate and NASA Space Technology Research Fellow, Department of Aeronautics and Astronautics,
Building 33-409. 2 Professor of Aeronautics and Astronautics and Engineering Systems, Department of Aeronautics and Astronautics,
Building 33-410.

International Conference on Environmental Systems
2
𝑛 = Number of spares
𝑞 = Quantity
CCAA Common Cabin Air Assembly
CDF Cumulative Distribution Function
CDRA Carbon Dioxide Removal Assembly
CFR Constant Failure Rate
ECLSS Environmental Control and Life Support Systems
FCPA Fluids Control and Pump Assembly
ISM In-Space Manufacturing
ISS International Space Station
L&M Logistics and Maintenance
LEO Low Earth Orbit
MADS Maintenance and Analysis Data Set
MCMC Markov Chain Monte Carlo
MTBF Mean Time Between Failures
NASA National Aeronautics and Space Administration
OGS Oxygen Generation System
ORU Orbital Replacement Unit
PDF Probability Density Function
POS Probability of Sufficiency
TCCS Trace Contaminant Control System
UPA Urine Processor Assembly
WPA Water Processor Assembly
I. Introduction
HE International Space Station (ISS) is a critical and valuable platform for gaining operational experience with
key systems for future human spaceflight in order to reduce risk and inform mission planning. On-orbit operations
are particularly important from the perspective of supportability, a metric which describes the ease with which a
system can be supported in a given mission context, particularly with regard to logistics and maintenance
requirements.1,2 Uncertainty in failure rates can significantly increase risk for future missions, thereby increasing the
amount of spare parts that must be carried in order to mitigate that risk.3–5 Operational data can and have been used to
reduce uncertainty in system behavior by validating, correcting, and refining failure rate estimates. These updated
failure rate estimates enable a reduction in spares mass requirements, and correction of underestimated failure rates
can uncover and help mitigate a significant amount of previously unknown risk for future missions.
This paper examines changes in ISS Environmental Control and Life Support System (ECLSS) Orbital
Replacement Unit (ORU) failure rate estimates and the resulting impact of those changes on spares mass and risk for
future missions. Initial failure rate estimates, made before systems were activated aboard the ISS, are compared to
current estimates which have been updated based upon ISS experience. A supportability model is described which
calculates spares requirements as a function of risk, including the impact of uncertainty in failure rate estimates. Spare
parts requirements are calculated using both initial and current estimates are compared in order to determine the
amount of spares mass savings and the level of risk reduction that has resulted from improved failure rate estimates.
In particular, this analysis shows that, for a 1,200-day Mars mission, the refinement of failure rate estimates based on
ISS operational experience enables an approximately 3.9 t to 6.0 t reduction in spares mass for ECLSS alone,
depending upon the desired level of risk coverage. This equates to a mass savings of 2.9 to 4.4 times the mass of the
ECLSS itself. In addition, ISS experience revealed hidden risk, in the form of underestimated failure rates, that would
have resulted in an order of magnitude higher risk than expected for future missions had they not been detected and
corrected.
These results have significant implications for future system development and mission planning. In particular, test
time in a safe, relevant environment – i.e. one that emulates the conditions of future missions but has contingency
options such as abort and regular resupply that protect the crew from risks arising from system uncertainty – is a
critical part of system development, especially for long-endurance missions. Not only does the knowledge gained
through operational experience uncover unknown risks, but it also allows estimates of key system parameters to be
refined based on operational data, which enables more precise and efficient logistics planning. Significant changes to
T

International Conference on Environmental Systems
3
existing systems or the introduction of new systems likely increase uncertainty, and these changes should be
undertaken with careful consideration of their supportability impacts. Appropriate time in a relevant test environment
is critical, and must be included in planning schedules, or else the higher risk and/or logistics cost associated with
uncertainty in system performance must be taken into account.
The remainder of this paper is organized as follows. Section II discusses supportability analysis and presents a
model for assessing risk and spares requirements that considers both aleatory and epistemic uncertainty. Section III
describes changes in ISS ECLSS ORU failure rate estimates, including an in-depth look at the evolution of the failure
rate estimates for one particular ORU over time. Section IV applies the model described in Section II to assess the
spares mass requirements for missions ranging from 0 to 1,200 days at various levels of risk, using both initial and
current failure rate estimates. The results for both sets of failure rate estimates are compared in order to characterize
the impact of ISS experience on spares mass and risk. Section V discusses the implications of these results, and Section
VI presents conclusions.
II. Supportability Analysis with Epistemic Uncertainty
One of the core goals of supportability analysis is to understand the relationship between the number of spares
allocated to each ORU and the associated risk, typically expressed as the Probability of Sufficiency (POS), defined as
the probability that the spares provided are sufficient to recover from all failures that occur in a given system during
a given mission.6,7 POS depends upon a range of factors, including system characteristics such as ORU failure rates
(which have uncertain values), mission endurance (defined as the amount of time that the system must sustain the
crew without resupply8), and the spares allocation. As more spares are added for a particular item, the POS for that
item, and therefore the POS for the entire system, increases. Discrete optimization allows analysts and mission
planners to determine the allocation of spare parts that achieves a desired POS value while minimizing the total mass
of spares.
This section describes the supportability modeling and optimization technique applied in this paper. This technique
accounts for both aleatory and epistemic uncertainty, which are defined and discussed in Section A. Section B
describes the basic model linking system characteristics, mission characteristics, and spares allocations to POS under
the assumption of deterministically-known failure rates (i.e. neglecting epistemic uncertainty), and Section C expands
that model to account for epistemic uncertainty in those failure rates. Finally, Section D describes the algorithm used
to find the optimal spares allocation for a given system, mission, and POS requirement.
A. Aleatory and Epistemic Uncertainty
Supportability analysis is, at its core, an assessment of the trade between risk and resources, where risk is driven
by uncertainty in the demands for those resources. Both aleatory and epistemic uncertainty are present in the problem,
and must be accounted for in the analysis. Aleatory uncertainty is the natural randomness inherent to a process, such
as the outcome of a coin flip when the bias of the coin is known. Epistemic uncertainty, on the other hand, is
uncertainty arising from lack of knowledge about the process, such as the bias of a particular coin.9 When a coin of
an unknown bias is flipped, the outcome depends upon both epistemic uncertainty (e.g. the distribution of likely biases
for the coin, or some other description of the state of knowledge about the coin) and aleatory uncertainty (e.g. the
probability of the outcome being heads or tails, given a particular coin bias).
In the context of supportability analysis, aleatory uncertainty is related to the distribution of the number of failures
that a given ORU will experience during the mission, given a known failure rate. Epistemic uncertainty describes the
uncertainty in the value of the failure rate itself. Both have a strong impact on the number of spares required to achieve
a desired POS. Analyses that neglect epistemic uncertainty tend to significantly underestimate risk, and as a result
underestimate the amount of resources required to achieve a desired level of POS for a given mission; therefore, it is
critical that supportability analysis include epistemic uncertainty when informing system design and mission
planning.3–5
Unlike aleatory uncertainty, epistemic uncertainty can be reduced through observation and experience. Unlike
other system parameters such as the mass or dimensions of particular components, failure rates cannot be observed
directly; they must be estimated based upon comparison to similar items and/or statistical analysis of observed system
behavior. The accuracy and precision of failure rate estimates are therefore strongly dependent upon the data behind
them. As more data are gathered – for example, as more time is spent operating a system and the number of failures
(or lack of failures) is observed for various ORUs – estimates of key parameters such as failure rates can be updated
and refined to reduce epistemic uncertainty. For example, the ISS has provided a critical testbed for understanding the
behavior of ECLSS in flight conditions. In addition to facilitating validation of ECLSS performance and operational

International Conference on Environmental Systems
4
characteristics in a microgravity environment, ISS operations provide data (i.e. the number of failures observed for a
particular item in a given period of operation) that analysts can use to update failure rate estimates to reduce uncertainty
and more closely match real-world behavior. The ISS Logistics and Maintenance (L&M) office uses a Bayesian
approach to update failure rate estimates based on observed failure counts, discussed in greater detail in Section III.B.
B. Modeling Spares and POS Using Deterministic Failure Rates
Conceptually, it is valuable to consider the case where failure rates are deterministically-known values in order to
understand the relationships between various factors linking system characteristics, mission characteristics, and spares
allocations to POS. This section describes the Constant Failure Rate (CFR) model, a common model for random
failures that assumes that each item has an exponentially-distributed lifetime defined by a known parameter.10 This
model will be expanded in Section C to include epistemic uncertainty in failure rates.
The key parameters for this analysis are:
Failure rate 𝜆𝑖: the average rate at which failures occur for a given item 𝑖, in failures per hour. This
is sometimes expressed as the Mean Time Between Failures (MTBF), which is equal to 𝜆𝑖−1.
Quantity 𝑞𝑖: the number of instances of item 𝑖 in the system.
K-factor 𝜅𝑖: a multiplier on failure rate for item 𝑖 to account for external influences on maintenance
demands such as environmental effects, crew error, or false alarms.7,11
Mission endurance 𝜏: the amount of time, in hours, that the system must support the crew without
resupply.8 This is the planning time horizon for supportability analysis; POS will be calculated as
the probability that the number of spares provided is sufficient for this period of time.
Number of spares 𝑛𝑖: the number of spares provided for item 𝑖 Under the CFR model, where time to failure is assumed to follow an exponential distribution, the distribution of 𝑁𝑖,
the number of failures (or the number of spares required) for item 𝑖, follows a Poisson distribution with a parameter
equal to the expected number of failures (i.e. 𝑁𝑖 ∼ Poisson(𝜆𝑖𝑞𝑖𝜅𝑖𝜏)).* The POS for item 𝑖, as a function of the number
of spares provided, is given by the Cumulative Distribution Function (CDF) of the Poisson distribution:12
𝑃𝑂𝑆𝑖(𝑛𝑖) = ∑ 𝑒−𝜆𝑖𝑞𝑖𝜅𝑖𝜏 ((𝜆𝑖𝑞𝑖𝜅𝑖𝜏)𝑘
𝑘!)
𝑛𝑖
𝑘=0
(1)
The POS for the overall system is equal to the product of the POS for each individual item. Thus, given an allocation
of spares 𝑛 = {𝑛1, 𝑛2, 𝑛3, … },
𝑃𝑂𝑆(𝑛) = ∏ 𝑃𝑂𝑆𝑖(𝑛𝑖)
𝑖
(2)
C. Accounting for Epistemic Uncertainty in Failure Rates
Epistemic uncertainty in failure rates is typically represented by a lognormal distribution;13 this is, for example,
the distribution used by ISS L&M to model ORU failure rates.7,14 Under this model, the deterministic failure rate 𝜆𝑖
used in Section B is replaced by a lognormally-distributed random variable Λ𝑖 ∼ Logn(𝜇, 𝜎) with Probability Density
Function (PDF)
𝑓Λi(𝜆𝑖) =
1
√2𝜋𝜎𝑖𝜆𝑖
𝑒−
(ln 𝜆𝑖−𝜇𝑖)2
2𝜎𝑖2
(3)
where 𝜆𝑖 ≥ 0. The parameters 𝜇𝑖 ∈ ℝ and 𝜎𝑖 > 0 are known as the scale and shape parameters of the lognormal
distribution, respectively. The mean and variance of Λ𝑖 are, respectively,
𝐸[Λ𝑖] = 𝑒𝜇𝑖+𝜎𝑖
2
2 (4)
* This paper follows the convention that deterministic values are represented by lower-case symbols, while random
variables are represented by upper-case symbols.

International Conference on Environmental Systems
5
𝑉𝑎𝑟[Λ𝑖] = 𝑒2𝜇𝑖+𝜎𝑖2
(𝑒𝜎𝑖2
− 1) (5)
As was the case with 𝜆𝑖 in Section B, under this model each ORU has its own failure rate distribution Λ𝑖 , with
parameters 𝜇𝑖 and 𝜎𝑖.7,9,12–15
An alternate parameterization, which is typically used in the context of failure rate uncertainty, specifies the mean
failure rate 𝜆̅𝑖 and error factor 𝜆𝐸𝐹,𝑖. The former is simply the expected value of the distribution, while the latter is
defined as the ratio of the 95th and 50th percentiles. The error factor is an indicator of the level of uncertainty in the
failure rate value; an error factor equal to one indicates that there is no uncertainty, and larger values indicate greater
uncertainty. Note that, by definition, the error factor cannot be less than one. The error factor is a function of the shape
parameter,9,13
𝜆𝐸𝐹,𝑖 = 𝑒1.645𝜎𝑖 (6)
and therefore 𝜇𝑖 and 𝜎𝑖 can be determined based on 𝜆̅𝑖 and 𝜆𝐸𝐹,𝑖 by rearranging equations 4 and 6:
𝜎𝑖 =ln 𝜆𝐸𝐹,𝑖
1.645(7)
𝜇𝑖 = ln 𝜆̅𝑖 −
𝜎𝑖2
2(8)
As discussed in Section B, given a specific failure rate value, the number of failures is assumed to follow a Poisson
distribution. When the failure rate is itself a random variable, the number of failures follows what is called a mixed
Poisson distribution, or a Poisson distribution whose parameter is given by another distribution.12,16 The POS for items
with uncertain failure rates can be calculated using the CDF of the relevant mixed Poisson distribution. When Λ𝑖 is
lognormal, the number of failures follows a Poisson-lognormal distribution, denoted as
𝑁𝑖 ∼ Poisson(Λ𝑖𝑞𝑖𝜅𝑖𝜏) ∧ Λ𝑖 ∼ Logn(𝜇𝑖 , 𝜎𝑖) (9)
In this application, 𝑞𝑖, 𝜅𝑖, and 𝜏 are simply linear scaling factors on Λ𝑖 that result in a new lognormal distribution that
is scaled according to the relevant quantity, k-factor, and mission endurance. Specifically, given a lognormal random
variable 𝑋 ∼ Logn(𝜇, 𝜎), a linear scaling of that random variable by a constant factor 𝑎 is another lognormal random
variable, 𝑎𝑋 ∼ Logn(𝜇 + ln 𝑎 , 𝜎). Unfortunately, there is no closed-form representation of the CDF of a Poisson-
lognormal distribution.17 While there are methods for numerical approximation, and Monte Carlo simulation could be
applied, the lack of a closed-form representation means that there is no rapid, accurate means to evaluate POS using
the Poisson-lognormal model.
However, a lognormal distribution can be approximated using a gamma distribution, and the resulting mixed
Poisson distribution 𝑁𝑖 ∼ Poisson(Υ𝑖) ∧ Υ𝑖 ∼ Gamma(𝛼𝑖 , 𝛽𝑖), known as a gamma-Poisson distribution, does have a
closed-form representation that enables rapid calculation of POS values. Here Υ𝑖 is a gamma-distributed random
variable defined to approximate the Poisson parameter Λ𝑖𝑞𝑖𝜅𝑖𝜏 from equation 9 for each ORU by matching its mean
and variance. The PDF of Υ𝑖 is
𝑓Υ𝑖(𝜐𝑖) =
𝜐𝑖𝛼−1𝛽𝛼𝑒−𝛽𝜐𝑖
Γ(𝛼)(10)
where the parameters 𝛼 ≥ 0 and 𝛽 ≥ 0 are known as the shape and scale parameters, respectively, and Γ(⋅) is the
gamma function. The mean and variance are, respectively,
𝐸[Υ𝑖] =𝛼𝑖
𝛽𝑖
(11)

International Conference on Environmental Systems
6
𝑉𝑎𝑟[Υ𝑖] =𝛼𝑖
𝛽𝑖2
(12)
The value of the gamma-Poisson approximation is that the resulting distribution is equivalent to a negative binomial
distribution with parameters derived from 𝛼 and 𝛽,
𝑁𝑖 ∼ Poisson(Υ𝑖) ∧ Υ𝑖 ∼ Gamma(𝛼𝑖 , 𝛽𝑖) ⇒ 𝑁𝑖 ∼ 𝑁𝐵 (𝛼,𝛽
𝛽 + 1) (13)
and therefore POS can be calculated using the negative binomial CDF, given in equation 14.12,16,18
𝑃𝑂𝑆𝑖(𝑛𝑖) = ∑ (𝑘 + 𝛼𝑖 − 1
𝑘) (
𝛽𝑖
𝛽𝑖 + 1)
𝛼𝑖
(1 − 𝛽𝑖
𝛽𝑖 + 1)
𝑘𝑛𝑖
𝑘=0
(14)
The POS formula in equation 14 can be used in the same manner as equation 1 in Section B, but now epistemic
uncertainty is accounted for in the calculation.
D. Finding the Optimal Allocation of Spares
The methodology described in Section C provides a way to calculate the POS associated with a given spares
allocation while accounting for epistemic uncertainty. Many different allocations will provide enough spares to meet
a POS requirement, 𝑃𝑂𝑆𝑅; however, only one will do so while minimizing the total mass of spares. The optimal
allocation is found by solving the discrete optimization problem below,
Minimize ∑ 𝑚𝑖𝑛𝑖
𝑖
s. t. ∏ 𝑃𝑂𝑆𝑖(𝑛𝑖)
𝑖
≥ 𝑃𝑂𝑆𝑅
(15)
where 𝑚𝑖 is the mass of ORU 𝑖. Exact solutions can be obtained by combining marginal analysis19 (also known as the
greedy algorithm) with a branch-and-bound search algorithm.20 This approach is described in detail by Owens and de
Weck21 for a case in which epistemic uncertainty is neglected and the Poisson CDF is used to calculated POS. The
same algorithm can be applied when the negative binomial CDF is used while preserving guarantees on optimality.
III. ISS Experience and ECLSS ORU Failure Rate Estimates
Data regarding ISS ORUs, including mean and error factor parameters for initial and current failure rate estimates,
are collected in the ISS Maintenance and Analysis Data Set (MADS). The initial failure rate estimate captures the
state of knowledge of the item’s failure characteristics prior to gaining experience through on-orbit operations. As
experience is gained, this initial estimate is updated by ISS L&M using a Bayesian approach. When an ORU
experiences a failure during operations – or when an ORU operates for a specified period of time (e.g. half of its
MTBF) without failure – the current failure rate estimate (captured as a mean and error factor) in MADS is updated.
As more experience is gained, more data are gathered, and the failure rate estimate is further refined. In general, this
update process tends to decrease the amount of uncertainty present in the estimate over time, as well as shift the value
of the estimated mean to more closely match observed system behavior. With sufficient data, the failure rate estimates
will eventually converge to their true values.7,13,14
This section examines the evolution of failure rate estimates for ISS ECLSS ORUs from the time that they were
first installed on station to their current values.† Section III.A presents and discusses the changes in mean failure rate
and error factor estimates for the 50 ECLSS ORUs in MADS that have both an initial and current failure rate estimate.
The set of 50 ORUs examined here includes the major components of the Water Processor Assembly (WPA), Urine
Processor Assembly (UPA), Oxygen Generation System (OGS), Carbon Dioxide Removal Assembly (CDRA),
Common Cabin Air Assembly (CCAA), and Trace Contaminant Control System (TCCS). Section III.B presents a
† MADS data discussed in this paper, including failure rate estimates, are current as of February 5, 2018.

International Conference on Environmental Systems
7
detailed look at the evolution of failure rate estimates for the UPA Fluids Control and Pump Assembly (FCPA), which
has experienced the largest increase in mean failure rate estimate among the 50 ORUs examined here. This significant
increase in mean failure rate (i.e. decrease in reliability estimate) is the result of the fact that the FCPA has experienced
a significantly higher number of failures than would be expected under the initial estimate, and provides an illustrative
example of how failure rate estimates change in response to observed on-orbit behavior.
A. Initial vs. Current ISS ECLSS ORU Failure Rate Estimates
Figure 1 shows the distribution of the ratio of the initial and current estimates of mean failure rate and error factor
for 50 ISS ECLSS ORUs. A ratio less than 1 indicates that the current estimate of mean failure rate or error factor has
decreased from the initial estimate; this means that operational experience has indicated that the ORU is likely more
reliable (i.e. has a lower mean failure rate) and/or that there is lower uncertainty in the failure rate estimate than was
initially predicted. Conversely, a ratio greater than 1 (which only occurs for mean failure rate estimates) indicates that
the current estimate is higher than the initial estimate, meaning that the ORU is less reliable than was initially
predicted. A ratio equal to 1 indicates that an ORU’s failure rate estimate has not been updated, typically because no
failures have been observed for that ORU and the amount of accumulated operating time is small relative to the ORU’s
estimated MTBF.
Of the ORUs examined here, 50% have current mean failure rate estimates that are lower than their initial values.
26% of current mean failure rate estimates are less than half of the initial estimate, meaning that approximately one
quarter of the ECLSS ORUs examined here have proven to be twice as reliable as was initially predicted. The UPA
Firmware Controller Assembly has the lowest ratio of current to initial mean failure rate estimate, at 0.22, indicating
that the initial mean failure rate estimate was an overestimate by a factor of 4.5. On the other side of the spectrum,
18% of the ORUs have current mean failure rate estimates that are higher than their initial values. 12% have more
than doubled the initial estimate, and 6% have exceeded the initial estimate by more than a factor of 4. The ORU with
the largest increase in mean failure rate is the UPA FCPA, which has a current mean failure rate estimate nearly 7.8
times the initial estimate. The evolution of the FCPA failure rate estimate is examined in greater detail in Section
III.B.
32% of the ORUs have current failure rate estimates that are the same as the initial values, indicating that they
have not yet been updated. These are typically items that have relatively low failure rates, and the estimate has not
been updated because no failures have been observed and the cumulative operating time on that ORU is short relative
to the MTBF – i.e. the condition defined by ISS L&M as triggering a Bayesian update has not occurred. That is not to
say that these items could not be updated, given sufficient information; it simply means that in the MADS database
they have not yet been updated. It is likely that, if an update were carried out, these items would see a decrease in the
mean failure rate estimate since they have not experienced a failure in their operating time to date. However, the
magnitude of that change would depend upon the initial mean failure rate estimate and the amount of operating time
Figure 1: CDF of the ratio of current to initial mean failure rate (left) and error factor (right) estimates for ISS
ECLSS ORUs. Note that the x-axis for the failure rate ratio (left) is displayed using a logarithmic scale.

International Conference on Environmental Systems
8
accumulated for that ORU. For ORUs with very low initial mean failure rate estimates, the results of a Bayesian update
based on a relatively short amount of operating time with no failures may be negligible.
While mean failure rate estimates have both increased and decreased – indicating that both higher-than-expected
and lower-than-expected reliability have been experienced during operations – the error factor for all failure rate
estimates examined here has either decreased or remained the same. The previously-mentioned 32% of the ORUs with
unchanged failure rate estimates have the same error factor as was initially estimated. 68% of the ORUs have a current
error factor estimate lower than the initial value, indicating a reduction of epistemic uncertainty. For 8% of the ORUs,
the current error factor estimate is less than half of its initial value. The ORU with the greatest reduction in uncertainty
is the CDRA Selector Valve, for which the ratio of current to initial error factor estimates is 0.282. This reduction in
uncertainty is likely related to the fact that there are several instances of this item within the system, providing a larger
test population and more cumulative operating time. However, it is important to note that while the error factor
estimate has gone down for this ORU, the mean failure rate estimate has increased by a factor of 4.24. Reduction in
mean failure rate and reduction in uncertainty are two separate considerations.
B. Evolution of the FCPA Failure Rate Estimate
This section examines the evolution of the FCPA failure rate estimate over time in order to illustrate the impact of
observed data on ORU failure rate estimates. The FCPA is a peristaltic pump within the UPA designed to transfer
urine from the Wastewater Storage Tank Assembly into the Distillation Assembly, and it has presented a significant
challenge from a supportability perspective, with significantly more random failures occurring than was initially
expected. Specifically, since the activation of the UPA on ISS in November 2008 the FCPA has experienced 9 failures,
all of which occurred during an operating period shorter than the initial estimated MTBF.22–24 As a result, the FCPA
has experienced the largest increase in mean failure rate estimate of the 50 ECLSS ORUs examined here, with the
current estimate nearly 7.8 times the initial estimated value. In addition, uncertainty in the FCPA failure rate estimate
has decreased significantly, with the current error factor estimate just over 0.37 times its initial value.
Figure 2 shows the initial and current failure rate estimates for the FCPA, with the x-axis normalized by the initial
mean failure rate estimate. The blue dotted curve is the PDF of the failure rate distribution based on the mean and
error factor estimated before the UPA was activated on ISS. The red, solid curve is the PDF of the current failure rate
estimate, which is the current MADS failure rate estimate, the result of performing a Bayesian update on the initial
estimate using the observed failures between UPA activation in November 2008 and the time that the current estimate
was computed in February 2018. This update is based on operational time, not calendar time, since the FCPA operates
on a duty cycle less than one. As expected, the large number of failures experienced by the FCPA have shifted the
failure rate distribution to the right significantly. It is important to note that while the current distribution is wider, the
Figure 2: Initial (blue, dotted) and current (red, solid) FCPA failure rate
estimates. Mean values are indicated by vertical lines, and the x-axis has
been normalized by the initial mean value.

International Conference on Environmental Systems
9
error factor has gone down from its initial value since it is defined as the ratio of the 95th and 50th percentiles; when
the median is higher, the same error factor results in a wider distribution of values.
Figure 3 shows the evolution of the FCPA mean failure rate and error factor estimates as a function of operational
time (i.e. calendar time multiplied by the duty cycle). These values are the result of applying a Bayesian update to the
initial failure rate estimate at 10 points in time: each of the 9 FCPA failures (indicated by Xs in Figure 3), as well as
one additional update (indicated by an O) at the end of the time period examined here in order to bring the estimate to
its current value. The x-axis is normalized by the initial MTBF estimate, and the mean failure rate and error factor
values shown are normalized by their initial estimates.
The lognormal distribution is not a conjugate prior for a Poisson process, and therefore this Bayesian update must
be executed numerically.13 A Markov Chain Monte Carlo (MCMC) model25 is used to draw 250,000 samples from
the posterior failure rate distribution, using a thinning factor of 2 and a 1000-sample burn-in period. A lognormal
distribution is fit to these samples to determine the updated values of 𝜇 and 𝜎, and equations 4 and 6 are used to
calculate the updated mean and error factor. The end values of this MCMC Bayesian analysis are a normalized mean
error factor estimate of 7.8 and a normalized error factor of 0.35, which are very close to the MADS-derived values
of 7.8 and 0.37 discussed above. Given that the MADS updates are based upon more detailed knowledge about the
number of FCPA operating hours, this small discrepancy is not unexpected. The initial and current failure rate
distributions shown in Figure 2 correspond to the mean failure rate and error factor estimates shown at the far left and
far right of Figure 3, respectively.
The first FCPA failure occurred after an operating time period equal to just under 12% of the initial MTBF
estimate. As a result, estimates of both the mean failure rate and error factor are increased significantly from their
initial values. Effectively, the evidence observed (an FCPA failure in that short of an amount of time) is a strong
indicator that the initial failure rate estimate is an underestimate, and as a result the value shifts upwards. The mean
failure rate estimate increases and decreases as additional failures are observed, depending upon the time to failure;
when an update is performed due to time that has passed without a failure, the mean failure rate estimate is decreased.
In terms of error factor, after the first update – when the strong mismatch between expected and observed behavior
indicate that the level of error in the initial estimate may be higher than predicted – the error factor decreases as more
Figure 3: Evolution of the FCPA failure rate estimate, characterized by
mean failure rate (top) and error factor (bottom). The x-axis shows FCPA
operational time normalized by the initial MTBF estimate, and y-axes
show the ratio of current to initial estimates of mean failure rate and error
factor. Updates due to failure events are indicated by Xs, and the final
update (based on time spent without a failure) is indicated by an O.

International Conference on Environmental Systems
10
data are gathered, regardless of whether updates are based on failures or lack of failures, as the failure rate estimate
converges to one that more closely matches the observed behavior. However, the rate of uncertainty reduction
decreases over time.
These results are meant to be illustrative, and it is important to keep in mind that they represent the worst-case
increase in failure rate estimate within the set of 50 ECLSS ORUs examined here. Other ORUs have experienced less
drastic adjustments in failure rate estimates, and their estimates will have evolved in different ways. However, the
high-level trends shown in the FCPA failure rate evolution are expected to be generally true of all items. Specifically,
Updates based on failures occurring earlier than expected tend to increase the estimated mean failure
rate, while updates based on failures occurring later than expected tend to decrease the estimated
mean failure rate;
Updates based upon observing the ORU survive a relatively long period time without experiencing
a failure tend to decrease the estimated mean failure rate;
Additional evidence, whether a failure or lack of a failure, tends to decrease the amount of
uncertainty in a failure rate estimate (indicated by the error factor) unless that evidence is so different
from the expected result that the error factor increases, as was the case with the first FCPA update;
and
The rate of uncertainty reduction tends to decrease over time, indicating that there are diminishing
returns to continued testing.
With the appropriate data – namely, an initial failure rate estimate and an operational history indicating which failures
occurred, and the operating time accumulated at the time of failure – failure rate estimate evolution curves such as the
ones shown in Figure 3 could be generated for any ORU. The information from these curves could then potentially be
used to forecast future changes in failure rate estimates as a function of test time, with the caveat that the actual changes
will depend on observed test results, which cannot be known ahead of time.
IV. Impact of ISS Experience on Future Mission Supportability
The changes in failure rate estimates described in Section III have a powerful impact on the supportability
characteristics of future missions, related to two primary drivers:
Lower failure rate uncertainty enables more precise assessment of spare parts requirements,
reducing the amount of spares that need to be supplied in order to cover potential maintenance
demands during the mission to a given POS
Improved failure rate estimate accuracy enables more accurate assessment of spare parts
requirements, ensuring that the allocation of spare parts is appropriate and matched to demand, and
that the achieved POS is actually what was desired
This section examines these two effects by assessing the spares requirements associated with a notional ECLSS
system, consisting of the 50 ECLSS ORUs described in Section III, operating in a range of potential mission profiles.
Specifically, the total spares mass required to cover these ORUs to a POS of 0.99, 0.995, or 0.999 is calculated for
mission endurances ranging from 0 to 1,200 days (the required endurance of a Mars-class mission26) in increments of
30 days, using the methodology described in Section II. This assessment is performed using both the initial failure
rate estimates and the current estimates, and the resulting spares mass requirements are compared in order to determine
the spares mass savings that has resulted from experience gained from ISS operations to date. These results are
presented in Section A. In addition, for the same ORUs and range of mission profiles, the impact of ISS operations on
risk is assessed by taking the spares allocation obtained using initial failure rate estimates and calculating the POS
associated with this allocation when current, updated failure rate estimates are used. Effectively, this analysis examines
what the POS would actually have been on a notional mission if initial failure rate estimates were used for spares
planning as opposed to the current, more refined estimates. These results are presented in Section B.
A. Reduced Spares Mass Requirements
Figure 4 shows the total spares mass required for the 50 ISS ECLSS ORUs examined here to achieve a POS of
0.99, 0.995, or 0.999 as a function of mission endurance. These results are calculated using both the initial failure rate
estimates and the current estimates in order to compare the two and assess the impact that ISS experience has had on
future mission supportability. Each point on the curves in Figure 4 represents a specific allocation of spare parts to the
50 ECLSS ORUs, found using the methodology described in Section II. Each allocation is optimal, meaning that it is
the combination of spares that achieves the desired POS requirement while minimizing mass, given the set of failure
rate estimates (initial or current) for each ORU and the mission endurance.

International Conference on Environmental Systems
11
The left axis of Figure 4, which shows results of calculations based on initial failure rate estimates, indicates the
spares mass that would be required if no on-orbit experience had been gained and failure rate estimates were not
refined. The right axis, in contrast, shows the results when current failure rates – which have been refined and updated
based on ISS experience – are used. The total mass required increases as either the desired POS or the mission
endurance increase, but in all cases refined failure rate estimates reduce the amount of spares mass required. For a
1,200-day Mars-class mission, for example, the spares mass required for these 50 ECLSS ORUs to achieve a POS of
0.995 is 14,335 kg when initial failure rate estimates are used, and 9,748 kg when those estimates are updated based
on observed on-orbit system behavior.
Figure 4: Total ECLSS spares mass required as a function of mission endurance when initial (left) and
current (right) failure rate estimates are used. Results are shown for required POS levels of 0.99 (black
circles), 0.995 (blue triangles), and 0.999 (red plus signs).
Figure 5: ECLSS spares mass savings resulting from updated failure rate
estimates as a function of mission endurance for required POS levels of
0.99 (black circles), 0.995 (blue triangles), and 0.999 (red plus signs).

International Conference on Environmental Systems
12
Figure 5 shows the spares mass savings for these 50 ECLSS ORUs that result from updating failure rate estimates,
calculated by subtracting the spares mass calculated using current estimates from that calculated using initial estimates.
The amount of spares mass saved increases as a function of both mission endurance and POS. Put another way, the
value of refined failure rate estimates (in terms of spares mass reduction) is higher when missions are longer or the
desired probability of success is higher. The spares mass savings for a 1,200-day mission with a POS of 0.99, 0.995,
or 0.999 are 3,946 kg, 4,587 kg, and 6,037 kg, respectively. For context, the mass of the system itself – that is, the
mass of each ORU multiplied by the number of instances of that ORU in the system – is approximately 1,377 kg.
Thus, for a 1,200-day mission with a POS requirement of 0.995 (that is, a 1 in 200 chance of not having enough
spares), the updating of failure rates based on ISS experience has enabled a reduction in ECLSS spares mass equivalent
to approximately 3.3 times the mass of the ECLSS system itself.
These changes in spares mass requirements are the results of the changes in failure rate estimates discussed in
Section III. Two major factors are at work. The first is changes in the mean failure rate estimates, indicating general
shifts in the magnitude of the failure rate for each ORU. As shown on the left side of Figure 1, 50% of the ORUs
examined here have current mean failure rate estimates lower than their initial values, indicating that experience has
shown them to be more reliable than was initially predicted. A lower failure rate means that fewer spares are required
to achieve a desired POS value for that item, and therefore these items typically require fewer spares in the allocations
determined using the current (i.e. updated) estimates compared to the allocations determined using the initial estimates.
However, it is important to note that more spares are typically required for the 18% of spares that saw their mean
failure rate estimate revised upwards due to lower-than-expected observed reliability, since a higher failure rate means
that more spares are required to achieve a desired POS value for that item. The effect of a combination of increased
and decreased failure rate estimates is a complex interaction within the spares optimization algorithm, since the value
of interest is not the POS of any individual item, but rather the overall system POS, which is the product of the POS
of each item (see Section II for further discussion).
The second factor is the overall decrease in uncertainty surrounding failure rate estimates that comes from on-orbit
experience, regardless of whether the mean failure rate estimate is adjusted upwards or downwards. When failure rates
are uncertain, that lack of precision requires more conservative spares allocation in order to ensure that the desired
POS is achieved. As uncertainty in failure rates is decreased, a lower number of spares can be used to achieve the
same POS, since there is less of a chance that the failure rate will be significantly higher than the mean value.4
B. More Accurate Assessment of Risk
One of the major benefits of on-orbit experience is the decrease in risk that results from verifying initial failure
rate estimates and refining/updating those estimates based on observed behavior during actual operations. In particular,
ISS experience has enabled the identification and correction of initial failure rate estimates that were significantly
lower than what would be suggested by the number of failures observed during on-orbit operations. Had these issues
not been identified, the number of spares required for those items would have been underestimated, and the overall
POS would have been lower than expected, meaning that risk would be higher than expected. Improved accuracy in
failure rate estimates corrects these underestimates and increases confidence that the correct number of spares are
provided for each item.
To investigate this effect, the spares allocations found using initial failure rate estimates – that is, the set of
solutions to the optimization problem described in equation 15 when the initial, pre-ISS-operations mean failure rate
and error factor estimates are used – are assessed to find the associated POS when the current, updated failure rate
estimates are used. The resulting POS value is, based on the current best knowledge of ORU failure rates, the actual
POS that would have been achieved if initial failure rate estimates had been used to plan the spares allocation. Figure
6 shows the results of this assessment as a function of mission endurance for target POS values of 0.99 (black), 0.995
(blue), and 0.999 (red). The target POS value itself is shown as a horizontal dotted line, and the actual POS achieved,
based on current failure rate estimates, is shown by the solid line of the same color. Points along the line indicate
specific spares allocations associated with missions of up to 1,200 days, in 30-day increments; these correspond to the
spares allocations associated with the points on the line of the same color on the left side of Figure 4, which shows the
total mass of that allocation.
International Conference on Environmental Systems
13
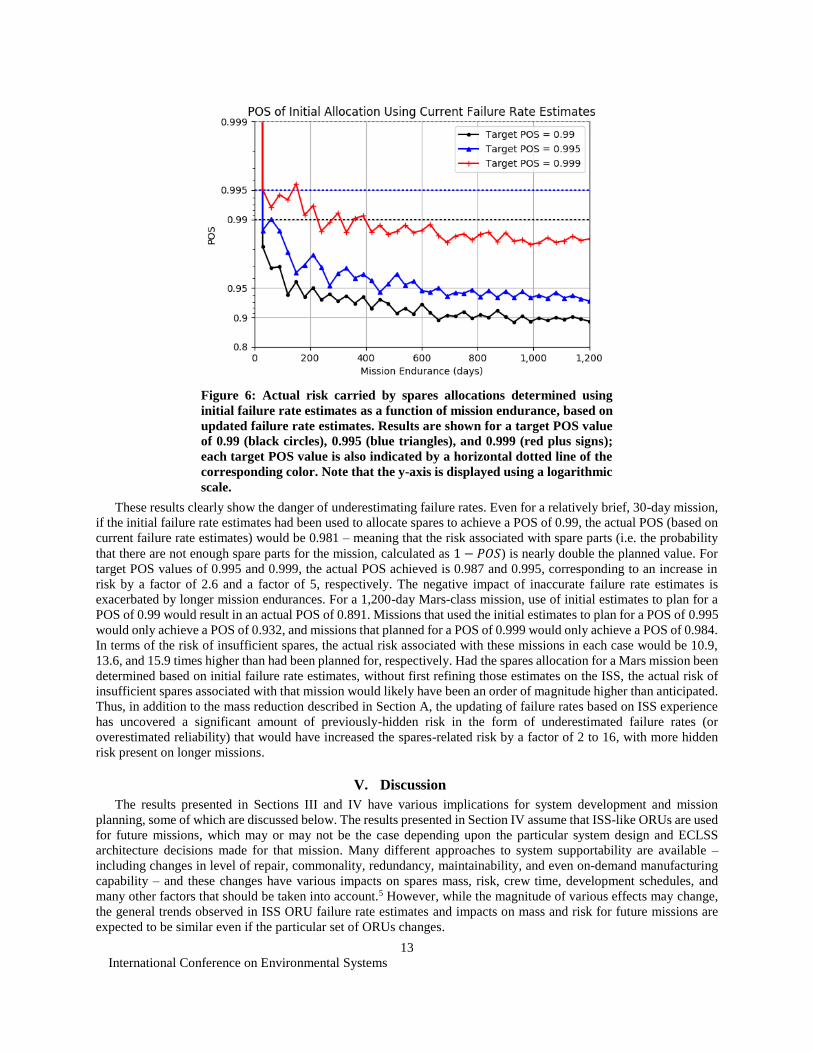
These results clearly show the danger of underestimating failure rates. Even for a relatively brief, 30-day mission,
if the initial failure rate estimates had been used to allocate spares to achieve a POS of 0.99, the actual POS (based on
current failure rate estimates) would be 0.981 – meaning that the risk associated with spare parts (i.e. the probability
that there are not enough spare parts for the mission, calculated as 1 − 𝑃𝑂𝑆) is nearly double the planned value. For
target POS values of 0.995 and 0.999, the actual POS achieved is 0.987 and 0.995, corresponding to an increase in
risk by a factor of 2.6 and a factor of 5, respectively. The negative impact of inaccurate failure rate estimates is
exacerbated by longer mission endurances. For a 1,200-day Mars-class mission, use of initial estimates to plan for a
POS of 0.99 would result in an actual POS of 0.891. Missions that used the initial estimates to plan for a POS of 0.995
would only achieve a POS of 0.932, and missions that planned for a POS of 0.999 would only achieve a POS of 0.984.
In terms of the risk of insufficient spares, the actual risk associated with these missions in each case would be 10.9,
13.6, and 15.9 times higher than had been planned for, respectively. Had the spares allocation for a Mars mission been
determined based on initial failure rate estimates, without first refining those estimates on the ISS, the actual risk of
insufficient spares associated with that mission would likely have been an order of magnitude higher than anticipated.
Thus, in addition to the mass reduction described in Section A, the updating of failure rates based on ISS experience
has uncovered a significant amount of previously-hidden risk in the form of underestimated failure rates (or
overestimated reliability) that would have increased the spares-related risk by a factor of 2 to 16, with more hidden
risk present on longer missions.
V. Discussion
The results presented in Sections III and IV have various implications for system development and mission
planning, some of which are discussed below. The results presented in Section IV assume that ISS-like ORUs are used
for future missions, which may or may not be the case depending upon the particular system design and ECLSS
architecture decisions made for that mission. Many different approaches to system supportability are available –
including changes in level of repair, commonality, redundancy, maintainability, and even on-demand manufacturing
capability – and these changes have various impacts on spares mass, risk, crew time, development schedules, and
many other factors that should be taken into account.5 However, while the magnitude of various effects may change,
the general trends observed in ISS ORU failure rate estimates and impacts on mass and risk for future missions are
expected to be similar even if the particular set of ORUs changes.
Figure 6: Actual risk carried by spares allocations determined using
initial failure rate estimates as a function of mission endurance, based on
updated failure rate estimates. Results are shown for a target POS value
of 0.99 (black circles), 0.995 (blue triangles), and 0.999 (red plus signs);
each target POS value is also indicated by a horizontal dotted line of the
corresponding color. Note that the y-axis is displayed using a logarithmic
scale.

International Conference on Environmental Systems
14
A. Refining Failure Rate Estimates Takes Time, but Can Be Accelerated
ISS experience shows that a significant amount of operational time is required to reduce uncertainty and verify
failure rate estimates. This paper demonstrates the positive impact that ISS experience to date has had on system
supportability for future missions. However, even after years of operation, a significant amount of uncertainty still
remains in the failure rate estimates of ISS ECLSS ORUs, which has a correspondingly significant impact on logistics
and risk for future missions.7,8
A major driver of this challenge is the fact that it can take a large amount of operating time to gather sufficient
data to significantly reduce uncertainty in failure rate estimates. Many ORUs have relatively low failure rates and
correspondingly high MTBFs, on the order of years. These long MTBFs can be misleading, and it is important to keep
in mind that they are a parameter used to characterize a probability distribution, and not a deterministic description of
ORU lifetime. An ORU may fail before it reaches its MTBF, or it may fail afterwards (though the former is more
likely). Under the CFR model, for example, the probability that a component will fail before reaching its MTBF is
0.63, and the probability that it will fail before reaching half of its MTBF is 0.39.9 However, long MTBFs are an
indication that, on average, a significant amount of time may be required before a failure is observed.
Parallel operation of multiple copies of a given system can greatly accelerate the process of gathering data on that
system. Each additional operating instance of an ORU is a multiplier on the number of operational hours gained in a
given period of time, the amount of data collected on that ORU, and the rate at which failure rate estimates are refined.
Currently, there is only one orbital platform that enables operational experience with these systems in the space
environment – the ISS. However, within the ISS it may be possible to operate additional copies of key systems simply
for the purpose of gathering operational data; the potential value of further refinement of failure rates for those systems
should be weighed against the cost and other impacts of operating multiple copies.
In addition, ground test facilities are cheaper and easier to operate than a space station, and allow system designers
more direct access to the equipment being tested for monitoring and characterization. In addition, particularly in the
case of ECLSS, a ground test facility is likely not as dependent upon the function of the system being tested, and
therefore test managers may have more flexibility with regard to the operating conditions that they will be able to
investigate. Though there are likely failure modes and various operational effects due to the microgravity environment
that cannot be emulated for long periods of time on the ground, there are also likely many failure modes that are
unrelated to the microgravity environment, and the failure rates associated with these failure modes can be investigated
on the ground. Other aspects of the space environment, such as radiation, could also be emulated on the ground.
Ideally, data would be gathered from multiple system instances operating in a relevant environment, such as
multiple space stations. This approach is likely not within the budget of a single organization or agency such as NASA,
but NASA could facilitate conditions that encourage other entities to operate stations and share reliability data in order
to build an understanding of the failure characteristics of various ORUs. This information would be valuable to all
participants in such a database, since it would decrease their risk and logistics requirements at a rate faster than any
could achieve individually. For example, the development of a commercial human spaceflight economy in Low Earth
Orbit (LEO), consisting of multiple stations and/or spacecraft operating multiple ECLSS (which may be copies or
variants of current systems, or entirely new systems) would result in a data-rich environment that would enable much
more rapid reduction of failure rate uncertainty and greater knowledge and understanding of system behavior. The
lessons learned by operating these systems could be very valuable to future exploration as well as continued
commercial operations in LEO or elsewhere. There may even be an economic argument to be made for dedicated
long-duration testing missions or commercial on-orbit testing services – dedicated platforms designed to gather data
regarding long-duration operations of key spacecraft systems in order to buy down risk and improve logistics
forecasting for future missions.
B. Underestimated Failure Rates Drive Risk
It may seem strange that the risk for future missions discussed in Section IV.B would be significantly higher than
the desired values when initial failure rate estimates are used, given that most of the ORUs examined here (82%) either
experienced no change in failure rate estimates or saw the initial failure rate estimate lowered. In general, based on
ISS experience, most of the ECLSS ORUs have turned out to be more reliable than expected. As a result, the spares
that were provided for those ORUs based on initial, overestimated failure rates will be more than sufficient, and the
resulting POS for those ORUs will be higher than expected.
However, 18% of ORUs that were not as reliable as expected, and it is these ORUs that drive the overall system
POS. Since POS for the system is the product of the POS for each individual item (see equation 2), and POS is by
definition always between 0 and 1, system-level POS is always limited by the lowest POS of its constituent items. The
amount of spares provided based on the initial failure rate estimates for ORUs whose initial failure rate was

International Conference on Environmental Systems
15
underestimated will not be sufficient to the same probability that was initially targeted, and the resulting reduction in
POS for that item will reduce the system-level POS significantly. Overall, unexpectedly low reliability is a typically
stronger driver of system POS than unexpectedly high reliability.3,27
As a result, for the purposes of systems development and mission planning, it is more important in the near term
to identify items for which failure rates are underestimated than it is to identify overestimates, since it is the
underestimated failure rates that will drive increases in risk. Conveniently, an underestimated failure rate (i.e. an
overestimated reliability) will be indicated by an earlier-than-expected failure, and therefore evidence that an initial
failure rate may be an underestimate will typically appear earlier rather than later, relative to evidence suggesting that
a failure rate is lower than the current estimate. While additional time and data may be required to refine the new
failure rate estimate, it is likely that an ORU can at least be flagged as potentially needing attention relatively early.
One possible approach to identifying potential underestimated failure rates is to examine the probability that a
failure would occur for that item in that amount of time, given the initial estimates. For example, in the FCPA case
described in Section III.B, it is apparent that the first ORU installed likely had significantly lower reliability than was
predicted, since the operational time to failure was approximately 12% of the initial MTBF. Under the CFR model, if
the initial mean failure rate estimate were correct, the probability of observing a failure in that time period (i.e. the
complement of the probability of observing 0 failures in that time period), including the K-factor, is approximately
0.15. Including epistemic uncertainty via the negative binomial model described in Section II.C, the probability of
observing a failure in that time is approximately 0.14. While this probability is not vanishingly small, it does indicate
that it is unlikely that the initial model matches the evidence, and therefore flags the FCPA as an item that may merit
further investigation.
This approach does not provide a new failure rate estimate – that would require a Bayesian update, similar to the
ones described in Section III.B. However, it provides an indicator that system developers can use to identify items that
may require more attention. Additional resources can then be applied to accelerate the rate of uncertainty reduction
for that item. For example, as discussed in Section A, parallel testing of additional copies of that item could be initiated
on the ground or on orbit in order to gather operational data more quickly and accelerate both reduction in uncertainty
and the rate at which failure modes are discovered and can be corrected.
C. Sufficient Spares Mass is Not the Same as Sufficient Spares
One of the interesting results of Section IV is the combination of the effects of updated failure rate estimates on
both mass and risk. When initial failure rate estimates are used, the total spares mass required is higher than it would
be if current estimates are used; however, the risk is also higher. Carrying more spares mass does not necessarily drive
down risk – it matters which spares are carried. In the initial case, many spares would be carried that were not needed
(based on current failure rate estimates), but there were also spares that were needed that were not carried and as a
result risk was increased. Spare parts are specialized objects, designed to address a specific type of failure. It is
important that missions not just account for the amount of spares mass that will need to be carried, but also ensure that
the right set of spares are allocated.
One possible approach to address this issue would be to use commonality. Commonality between different ORUs
can enable spares that are able to address a set of failures, thus allowing risk pooling between different failure modes.
While helpful, commonality of design is limited; it is unlikely that a pump and a particulate filter will share the same
design and have interchangeable spares. In-Space Manufacturing (ISM), however, can enable commonality of material
by allowing required spares to be manufactured from a common pool of undifferentiated raw feedstock when they are
needed. Even if various different materials (metals, plastics, etc.) are required, the fact that these materials are not
necessarily as specialized to a particular failure type means that they enable a more adaptable approach to spares
logistics than traditional spare parts. If one item experiences fewer failures than expected, and another item
experiences more failures than expected, resources that would have been used to manufacture spares for the first item
can be used to manufacture spares for the second.
There are of course limitations on this approach – namely, that the set of spares to be covered this way must share
the same raw materials, and that the crew must have the ability to manufacture the required items on demand during
the mission. However, previous work has shown that, if such a capability could be developed and implemented on
even a subset of ORUs within the system, ISM could enable significant reductions in spares mass requirements for
long-endurance missions while simultaneously mitigating the negative effects of failure rate uncertainty by enabling
adaptive spares logistics.5,28,29

International Conference on Environmental Systems
16
D. Changes to System Design Impact Supportability and May Introduce New Uncertainty
There are two factors underlying the differences between the initial and current failure rate estimates, both of
which need to be taken into account when considering these results. On the one hand, observation of system behavior
and updating of failure rate estimates shifts those estimates and reduces uncertainty such that, as more and more data
are gathered, they eventually converge to the actual failure rate of the system. On the other hand, however, ISS ECLSS
system designers have made changes to systems during their operational lifetimes, sometimes in order to increase
reliability. The first factor relates to reduction of epistemic uncertainty; the second relates to changes in the aleatory
uncertainty of the system itself. Both can reduce spares requirements.8 However, the data examined here are not
sufficiently detailed to differentiate between these two effects. With more detailed information regarding when
changes were made to ORU designs or operational conditions, further analysis could identify the extent to which
changes in the system itself are the cause of changes in failure rate estimates, as opposed to changes in our knowledge
of the system.
More detailed assessment of the timing of intentional changes to system design and concurrent changes in failure
rate estimates could also help characterize risks associated with making changes to the system. The reductions in
spares mass and risk described in Section IV are the result of years of accumulated knowledge about the ISS ECLSS
system, derived from on-orbit experience with that particular system. When changes are made to the design of that
system, some of that previous operational experience may no longer be relevant, and additional uncertainty will be
introduced. This is true both for system elements that have been redesigned and the elements that they interact closely
with, since the operating conditions of those elements may have changed. In the extreme, radical changes – such as
the adoption of entirely new ECLSS systems – may significantly reset the state of knowledge about the system’s
failure characteristics. The additional uncertainty introduced by new system designs, and the resulting increase in risk
and spares mass requirements, should be carefully balanced against the potential benefit that may be gained by these
new systems in terms of reduced system mass, lower consumable requirements, increased reliability, increased
maintainability, or any other relevant factor.
This is not to say that system upgrades should always be avoided. One of the most valuable aspects of on-orbit
operational experience is that it provides system designers with the opportunity to identify and correct design issues.
However, system designers, mission planners, and program managers must be cognizant of the implications of system
design changes with regard to risk, reliability, and supportability, and weigh those implications against the potential
benefits resulting from the proposed change. Potential increased uncertainty must be accounted for, either by accepting
higher risk, carrying more spare parts, or allowing for more test time to reduce that uncertainty, or some combination
of these approaches.
E. Operational Experience Has a Nonlinear Effect on Uncertainty
This paper examined only the differences between the initial failure rate estimates and their current values, and the
resulting impacts of those differences on future mission spares mass and risk. With the exception of the FCPA example
in Section III.B, it did not examine intermediate failure rate estimates, or the evolution of those estimates over time.
However, the FCPA example (figure 3) does show that reduction in failure rate uncertainty is a nonlinear process, and
the rate of refinement in failure rate estimates tends to decrease over time. This makes sense, as the Bayesian failure
rate update process incrementally incorporates new evidence to update failure rate estimates, and as more evidence is
incorporated the failure estimate is expected to approach the true value. As a result, time spent gathering operational
experience has diminishing returns.
This trend is similar to that seen in reliability growth efforts (which are discussed in greater detail in previous
work27), where reliability may increase relatively quickly during early testing periods, as “low-hanging fruit” failure
modes are identified and corrected. However, as the system improves, it becomes more difficult and time-consuming
to observe, identify, and correct additional failure modes. Similarly, it is expected that – past a certain point – each
additional year of data-gathering and operational experience will have less of an effect on failure rate estimates once
they have begun to stabilize around true values.
As a result, it is not reasonable to extrapolate linearly from the results of this study in order to project potential
spares mass or risk benefits that continued years of testing on ISS might yield in the future. The results presented here
are simply the start and end points of some nonlinear curve relating operational and test time to mass and risk
reduction. However, this curve can be characterized, given sufficient data regarding the failure history of each ORU.
Specifically, the evolution of failure rate estimates for each ORU can be calculated at a series of intermediate points
in time using the MCMC Bayesian approach described in Section III.B, and the resulting intermediate updated
estimates can be used to assess spares mass and risk, as was done in Section IV. The results of that analysis could then
be used to forecast the potential value of additional test time for these systems, on the ISS or some other platform,

International Conference on Environmental Systems
17
assuming that past trends hold. In addition, subsystem- and ORU-level assessment of the rate of change in failure rate
estimates can identify the parts of the system for which additional test time has the potential to provide the most value.
These results can then guide investments in testing efforts, as well as inform estimations of what level of uncertainty
reduction may be reasonably achievable and how much operational time may be required.
VI. Conclusions
Operational experience aboard the ISS provides valuable data that has allowed refinement of ORU failure rate
estimates, increasing their accuracy and reducing uncertainty. These refined failure rate estimates have significant
impacts on future mission supportability by reducing both spares mass requirements and risk. Specifically, updating
failure rate estimates from initial (pre-ISS experience) values to their current values (which are informed by observed
on-orbit system behavior) has resulted in a 3.9 t to 6.0 t reduction in estimated spares mass requirements for a future
1,200-day Mars mission for ECLSS spares alone, a mass savings equivalent to several times the mass of the ECLSS
itself. The amount of spares mass saved increases both as a function of mission endurance and desired POS. In
addition, ISS data has allowed analysts to identify and correct underestimated failure rates; if these underestimates
had not been corrected, future missions would have experienced an order of magnitude higher risk than expected for
a given spares allocation.
These results point to the critical importance of test time and operational experience for mission supportability,
and the value that such testing can have for future missions both in terms of spares mass reduction and risk mitigation.
System development efforts must carefully consider the impacts of changes to existing systems or introduction of new
systems in terms of their potential for increased uncertainty, and ensure that sufficient time and resources are budgeted
to gather the data required to refine failure rate estimates, carry additional logistics, or accept higher risk.
This analysis examined failure rate estimates at only two points: before and after ISS experience. More detailed
examination of the failure histories of ISS ORUs can enable the characterization of the rate at which failure rate
estimates are refined, and the corresponding rate of improvement of system supportability characteristics. This
information could then allow analysts to forecast the potential value of additional test time on a current system, or the
relationship of test time to supportability characteristics for future systems, in order to inform development schedules.
Acknowledgments
This research was supported by a NASA Space Technology Research Fellowship (grant number NNX14AM42H).
The authors would like to thank Bill Cirillo, Kandyce Goodliff, and Kevin Earle of NASA Langley Research Center
and Chel Stromgren of Binera, Inc. for their thoughts and input on this work.
References 1 National Aeronautics and Space Administration, NASA Systems Engineering Handbook, National Aeronautics and
Space Administration, 2007. 2 Cirillo, W., Aaseng, G., Goodliff, K., Stromgren, C., and Maxwell, A., “Supportability for Beyond Low Earth Orbit
Missions,” AIAA SPACE 2011 Conference & Exposition, Long Beach, CA: American Institute of Aeronautics and
Astronautics, 2011. 3 Stromgren, C., Goodliff, K. E., Cirillo, W., and Owens, A., “The Threat of Uncertainty - Why Using Traditional
Approaches for Evaluating Spacecraft Reliability Are Insufficient for Future Human Mars Missions,” AIAA SPACE
2016, Long Beach, CA: American Institute of Aeronautics and Astronautics, 2016. 4 Owens, A. C., de Weck, O. L., Stromgren, C., Goodliff, K., and Cirillo, W., “Accounting for Epistemic Uncertainty
in Mission Supportability Assessment: A Necessary Step in Understanding Risk and Logistics Requirements,” 47th
International Conference on Environmental Systems, Charleston, SC: International Conference on Environmental
Systems, 2017. 5 Owens, A., De Weck, O., Stromgren, C., Goodliff, K. E., and Cirillo, W., “Supportability Challenges, Metrics, and
Key Decisions for Future Human Spaceflight,” American Institute of Aeronautics and Astronautics, 2017. 6 Sherbrooke, C. C., Optimal inventory modeling of systems: multi-echelon techniques, Boston: Kluwer Academic,
2004. 7 Anderson, L., Carter-Journet, K., Box, N., DiFilippo, D., Harrington, S., Jackson, D., and Lutomski, M.,
“Challenges of Sustaining the International Space Station through 2020 and Beyond: Including Epistemic
Uncertainty in Reassessing Confidence Targets,” AIAA SPACE 2012 Conference & Exposition, Pasadena, CA:
American Institute of Aeronautics and Astronautics, 2012.

International Conference on Environmental Systems
18
8 Do, S., “Towards Earth Independence - Tradespace Exploration of Long-Duration Crewed Mars Surface System
Architectures,” Doctoral Thesis, Massachusetts Institute of Technology, 2016. 9 Stamatelatos, M., and Dezfuli, H., Probabilistic Risk Assessment Procedures Guide for NASA Managers and
Practitioners, Washington, DC: National Aeronautics and Space Administration, 2011. 10 Ebeling, C. E., An introduction to reliability and maintainability engineering, Long Grove, Ill: Waveland Press,
2010. 11 Fisher, W. F., and Price, C. R., Space Station Freedom External Maintenance Task Team Final Report, Houston,
TX: National Aeronautics and Space Administration, 1990. 12 Shynk, J. J., Probability, random variables, and random processes: theory and signal processing applications,
Hoboken, NJ: Wiley, 2013. 13 Dezfuli, H., Kelly, D., Smith, C., Vedros, K., and Galyean, W., Bayesian Inference for NASA Probabilistic Risk and
Reliability Analysis, Washington, DC: National Aeronautics and Space Administration, 2009. 14 Vitali, R., and Lutomski, M. G., “Derivation of Failure Rates and Probability of Failures for the International Space
Station Probabilistic Risk Assessment Study,” International Conference on Probabilistic Safety Assessment and
Management, Berlin: 2004. 15 Shimizu, K., and Crow, E. L., “History, Genesis, and Properties,” Lognormal distributions: theory and applications,
E.L. Crow and K. Shimizu, eds., New York: M. Dekker, 1988, pp. 1–26. 16 Karlis, D., and Xekalaki, E., “Mixed Poisson Distributions,” International Statistical Review, vol. 73, Jan. 2007,
pp. 35–58. 17 Shaban, S. A., “Poisson-Lognormal Distributions,” Lognormal distributions: theory and applications, E.L. Crow
and K. Shimizu, eds., New York: M. Dekker, 1988, pp. 195–210. 18 McLachlan, G. J., and Peel, D., Finite mixture models, New York: Wiley, 2000. 19 Fox, B., “Discrete Optimization Via Marginal Analysis,” Management Science, vol. 13, Nov. 1966, pp. 210–216. 20 Hillier, F. S., and Lieberman, G. J., Introduction to Operations Research, Boston: McGraw-Hill, 2001. 21 Owens, A., and de Weck, O., “Increasing the Fidelity of Maintenance Logistics Representation in Breakeven Plots,”
46th International Conference on Environmental Systems, Vienna, Austria: International Conference on
Environmental Systems, 2016. 22 Carter, L., Takada, K., Brown, C. A., Bazley, J., Gazda, D., Schaezler, R., and Thomas, F., “Status of ISS Water
Management and Recovery,” 47th International Conference on Environmental Systems, Charleston, SC:
International Conference on Environmental Systems, 2017. 23 Carter, L., Pruitt, J., Brown, C. A., Schaezler, R., and Bankers, L., “Status of ISS Water Management and Recovery,”
45th International Conference on Environmental Systems, Bellevue, WA: International Conference on
Environmental Systems, 2015. 24 Bagdigian, R. M., Dake, J., Gentry, G., and Gault, M., “International Space Station Environmental Control and Life
Support System Mass and Crewtime Utilization In Comparison to a Long Duration Human Space Exploration
Mission,” 45th International Conference on Environmental Systems, Bellevue, WA: International Conference on
Environmental Systems, 2015. 25 Hamada, M. S., Wilson, A. G., Reese, C. S., and Martz, H. F., eds., Bayesian reliability, New York, NY: Springer,
2008. 26 Goodliff, K., Stromgren, C., Ewert, M., Hill, J., and Moore, C., “Logistics Needs for Future Human Exploration
Beyond Low Earth Orbit,” AIAA SPACE 2017, Orlando, FL: American Institute of Aeronautics and Astronautics,
2017. 27 Owens, A., and de Weck, O., “Limitations of Reliability for Long-Endurance Human Spaceflight,” AIAA SPACE
2016, Long Beach, CA: American Institute of Aeronautics and Astronautics, 2016. 28 Owens, A., and de Weck, O., “Systems Analysis of In-Space Manufacturing Applications for the International Space
Station and the Evolvable Mars Campaign,” AIAA SPACE 2016, Long Beach, CA: American Institute of
Aeronautics and Astronautics, 2016. 29 Owens, A., Do, S., Kurtz, A., and de Weck, O., “Benefits of Additive Manufacturing for Human Exploration of
Mars,” 45th International Conference on Environmental Systems, Bellevue, WA: International Conference on
Environmental Systems, 2015.