international petroleum corp.ncf00151 p03 10.19 international petroleum corp. q3 2019 highlights q3...
TRANSCRIPT
NCF
0015
1 p
01 1
0.19
Operations and Financial UpdateThird Quarter 2019
Mike Nicholson, CEOChristophe Nerguararian, CFO
November 5, 2019
Q3 2019
International Petroleum Corp.
NCF
0015
1 p
02 1
0.19
International Petroleum Corp.Corporate Strategy
Deliver operational excellence
Maintain financial resilience
Maximize the value of our resource base
Grow through M&A
2
NCF
0015
1 p
03 1
0.19
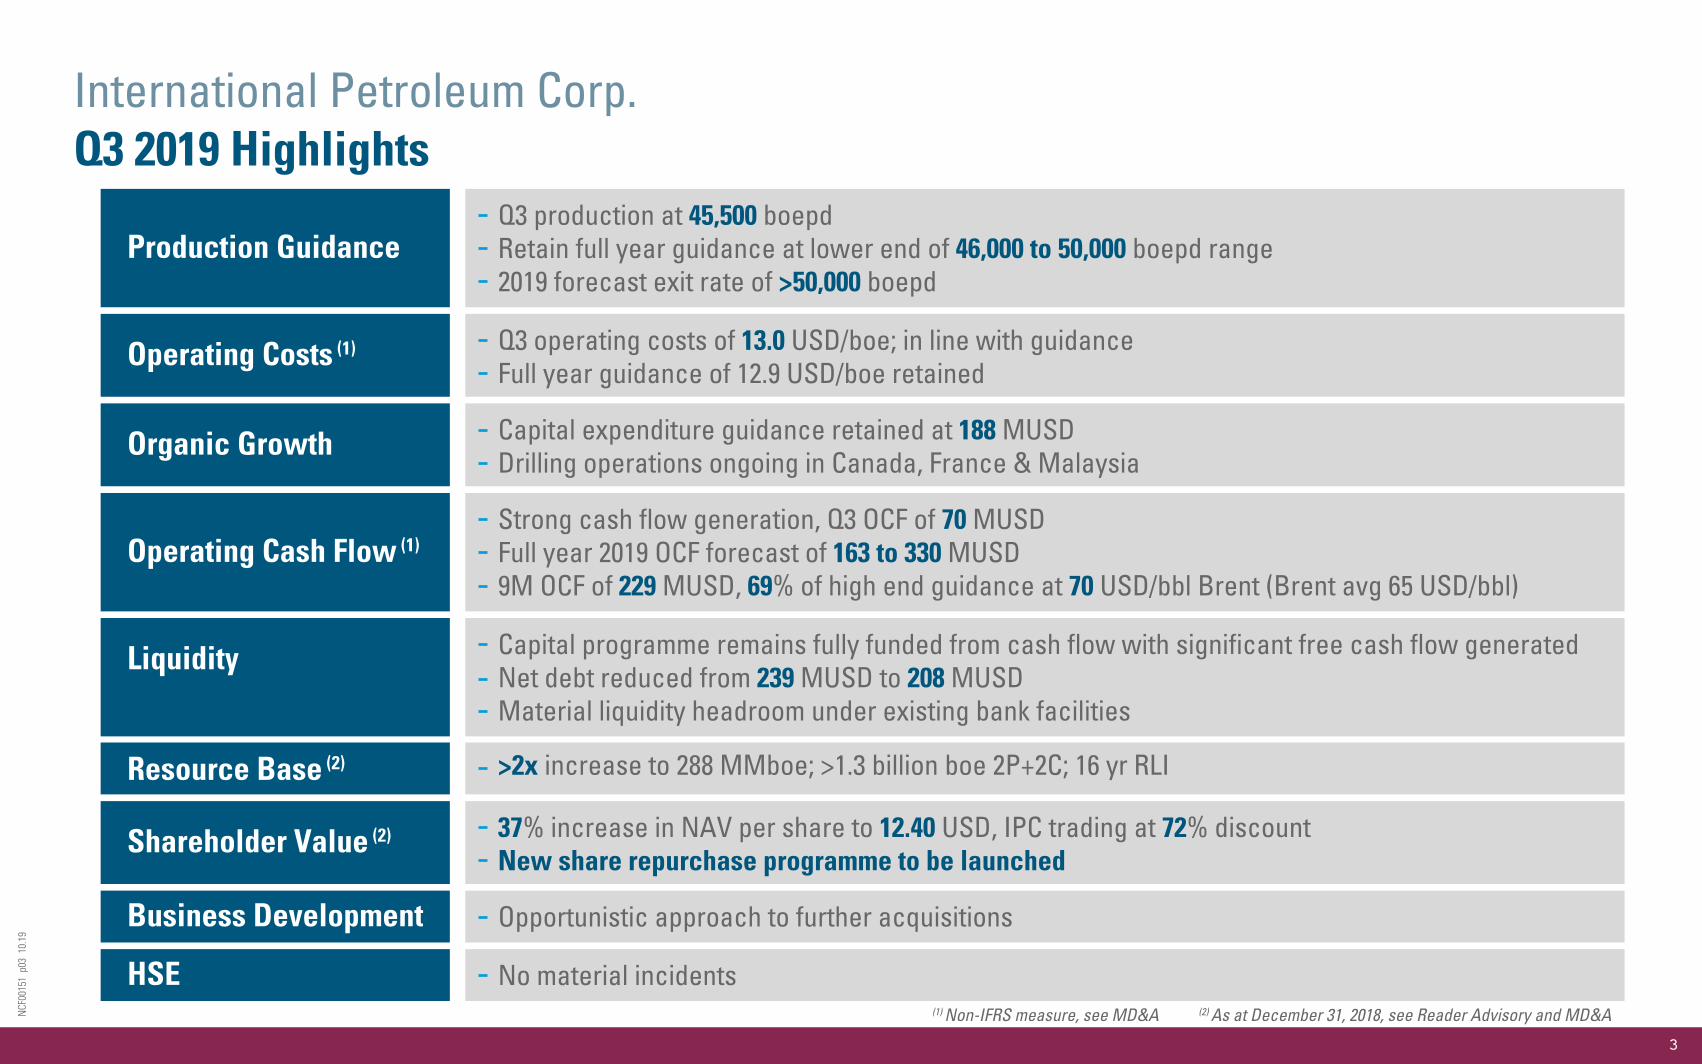
International Petroleum Corp.Q3 2019 Highlights
Q3 operating costs of 13.0 USD/boe; in line with guidanceFull year guidance of 12.9 USD/boe retained
Q3 production at 45,500 boepdRetain full year guidance at lower end of 46,000 to 50,000 boepd range2019 forecast exit rate of >50,000 boepd
Production Guidance
Operating Costs (1)
Capital expenditure guidance retained at 188 MUSDDrilling operations ongoing in Canada, France & Malaysia
Organic Growth
Strong cash flow generation, Q3 OCF of 70 MUSDFull year 2019 OCF forecast of 163 to 330 MUSD9M OCF of 229 MUSD, 69% of high end guidance at 70 USD/bbl Brent (Brent avg 65 USD/bbl)
Operating Cash Flow (1)
Capital programme remains fully funded from cash flow with significant free cash flow generatedNet debt reduced from 239 MUSD to 208 MUSDMaterial liquidity headroom under existing bank facilities
Liquidity
Opportunistic approach to further acquisitionsBusiness Development
>2x increase to 288 MMboe; >1.3 billion boe 2P+2C; 16 yr RLIResource Base (2)
37% increase in NAV per share to 12.40 USD, IPC trading at 72% discountNew share repurchase programme to be launched
Shareholder Value (2)
No material incidentsHSE(1) Non-IFRS measure, see MD&A (2) As at December 31, 2018, see Reader Advisory and MD&A
3
NCF
0015
1 p
04 1
0.19
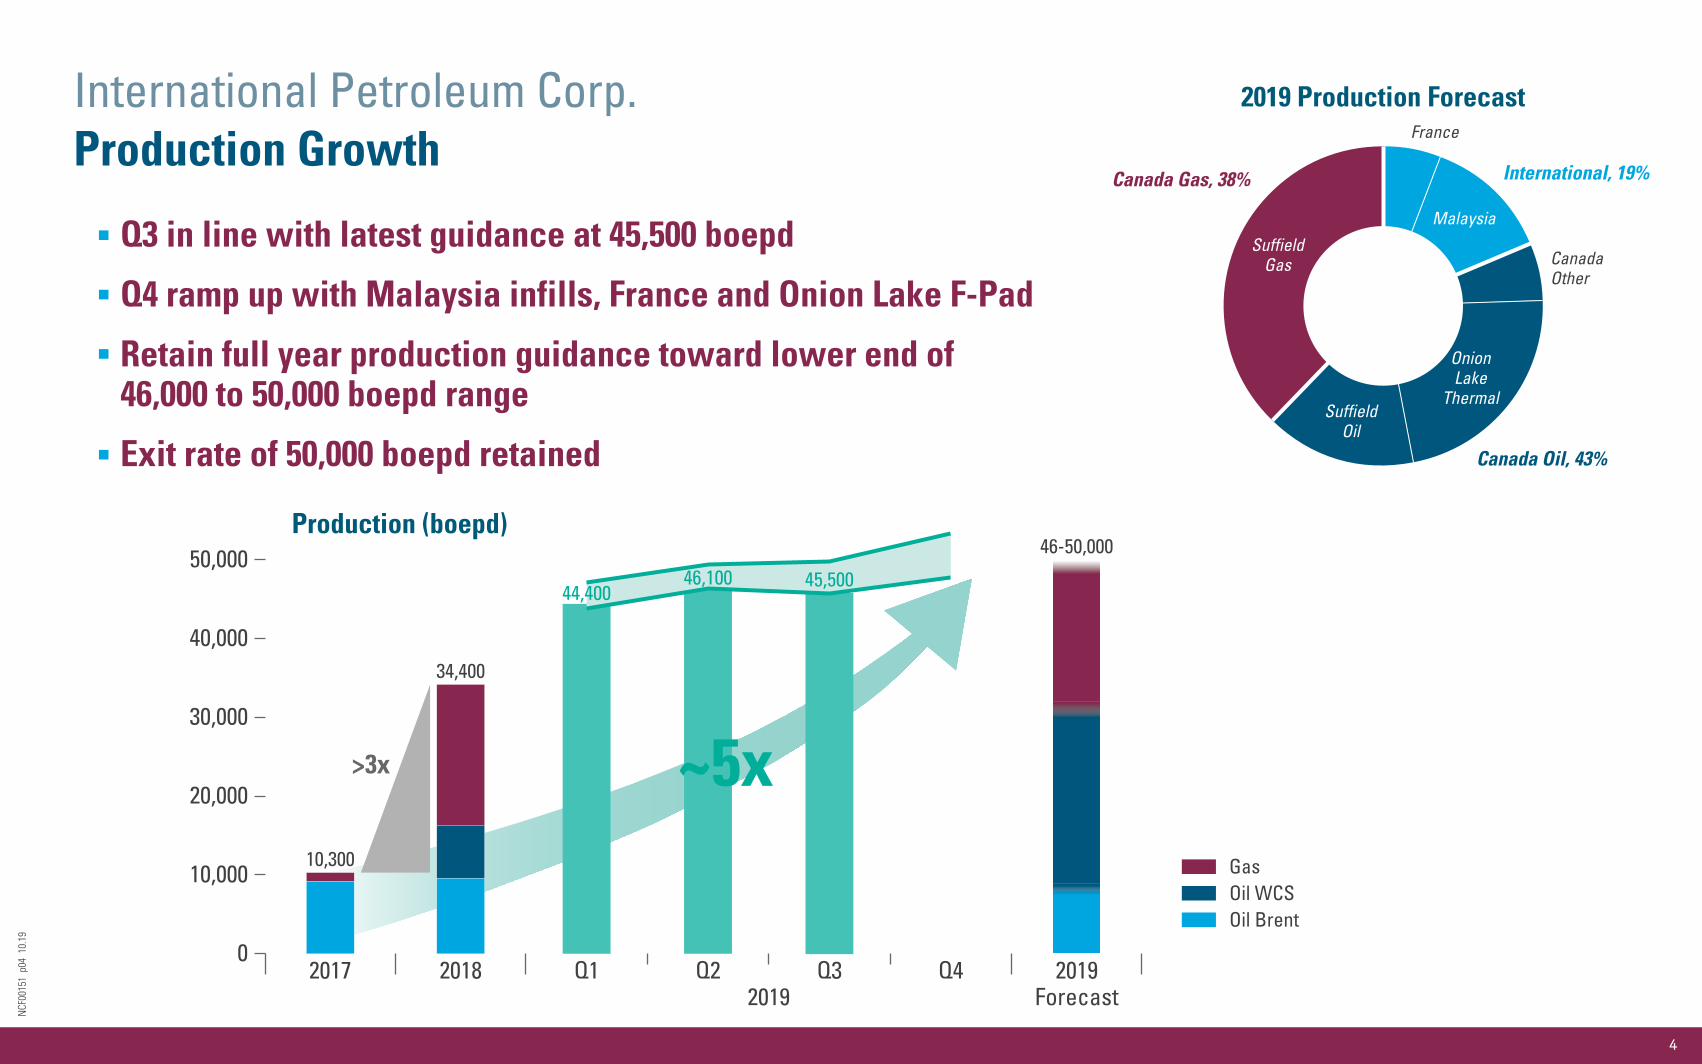
International Petroleum Corp.Production Growth
Q3 in line with latest guidance at 45,500 boepd
Q4 ramp up with Malaysia infills, France and Onion Lake F-Pad
Retain full year production guidance toward lower end of46,000 to 50,000 boepd range
Exit rate of 50,000 boepd retained
Canada Gas, 38%
Canada Oil, 43%
2019 Production Forecast
International, 19%
Production (boepd)
0
10,000
20,000
30,000
40,000
50,000
Q1 Q2 Q3 Q4 2019Forecast2019
20182017
34,400
10,300
46-50,000
>3x ~5x
44,40046,100 45,500
GasOil WCSOil Brent
SuffieldGas
SuffieldOil
OnionLake
Thermal
Malaysia
CanadaOther
France
4

NCF
0015
1 p
05 1
0.19
International Petroleum Corp.2019 Capital Programme – Canada
Onion Lake Thermal Facility optimisation - 4th boiler installed on Phase 1 facility - 2 direct intake hoses installed (June) - Produced water recycling skid installed (July) - Construction of permanent water offtake system completed (October) - Redundancy in place to cope with extreme cold weather
F-Pad ramp up Steam injection commenced Q3 Production start up in September Expect year end rates to reach ~12,000 bopd
0
2,000
4,000
6,000
8,000
10,000
12,000
14,000
16,000
2015 2016 2017 2018 2019
Bar
rels
Per
Day
Historical Production
Onion Lake Thermal ProductionFacility Nameplate Capacity
Phase 1 designcapacity
Extremecold weather
Facilityoptimisation
Low WCSpricing
F-Padonline
Phase 2 designcapacity
Onion Lake recycling skid
Onion Lake steam boilers
5
NCF
0015
1 p
06 1
0.19
International Petroleum Corp.2019 Capital Programme – Canada
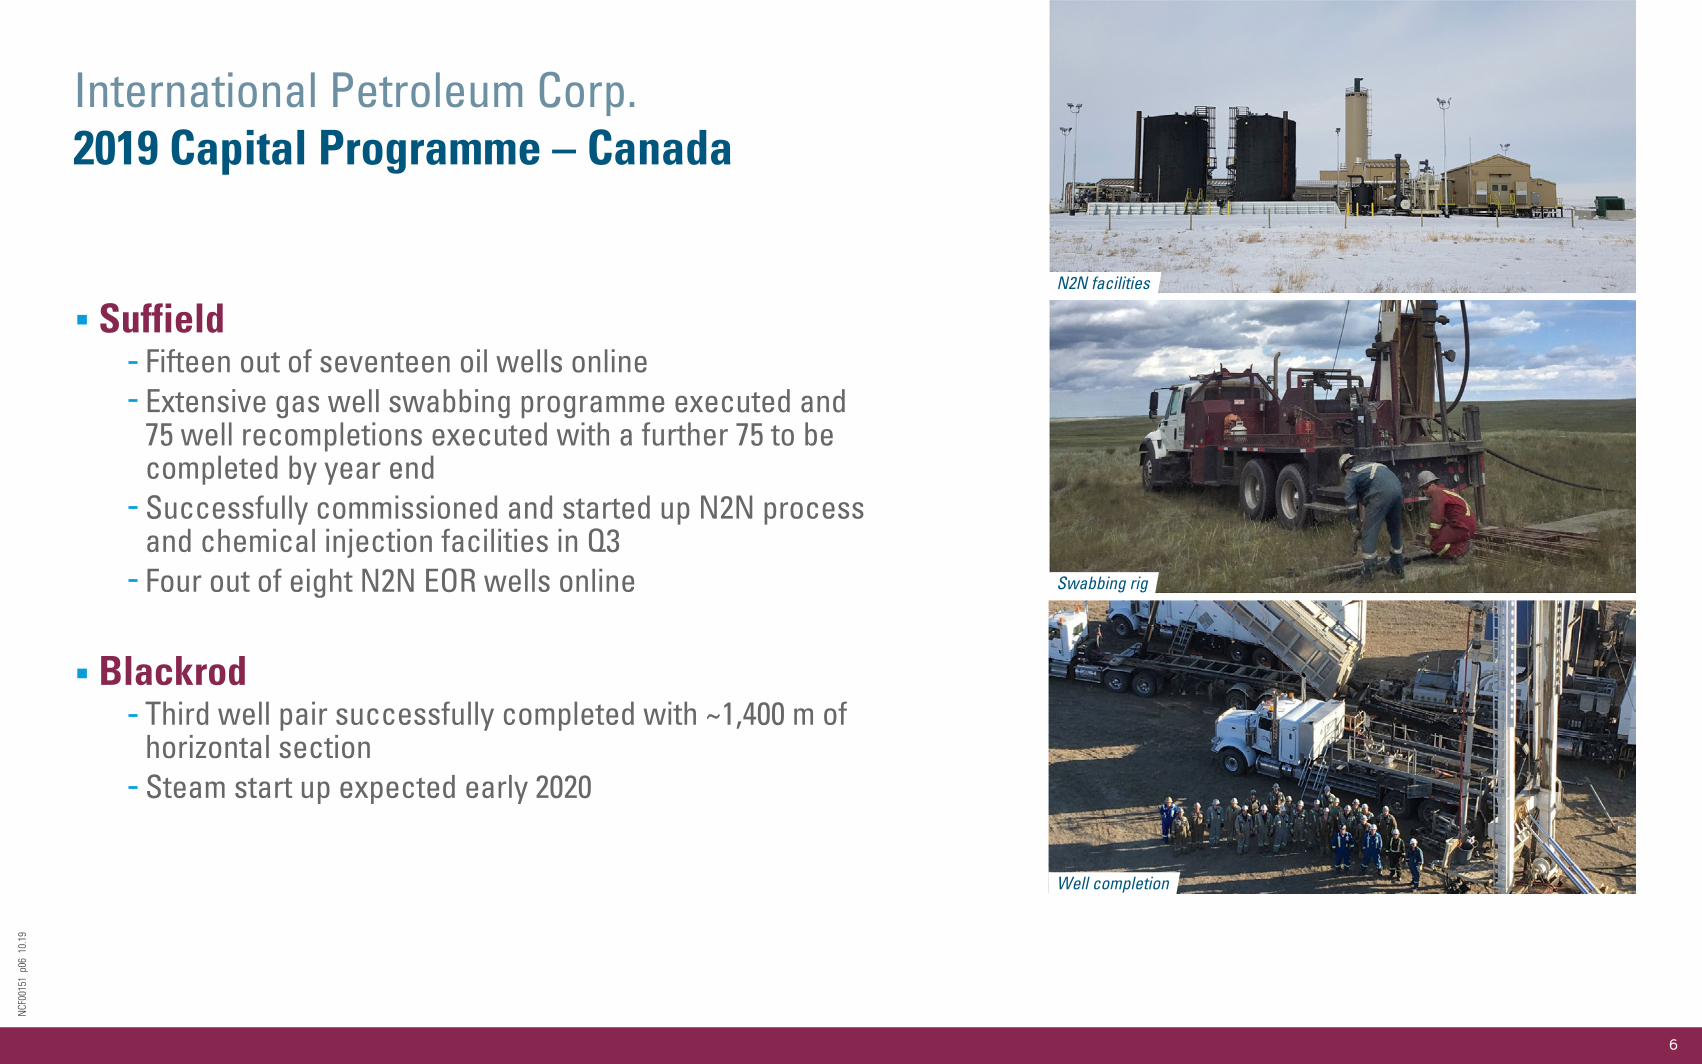
Suffield Fifteen out of seventeen oil wells online Extensive gas well swabbing programme executed and 75 well recompletions executed with a further 75 to be completed by year end Successfully commissioned and started up N2N process and chemical injection facilities in Q3 Four out of eight N2N EOR wells online
Blackrod Third well pair successfully completed with ~1,400 m of horizontal section Steam start up expected early 2020
N2N facilities
Swabbing rig
Well completion
6
NCF
0015
1 p
07 1
0.19
International Petroleum Corp.2019 Capital Programme – Malaysia
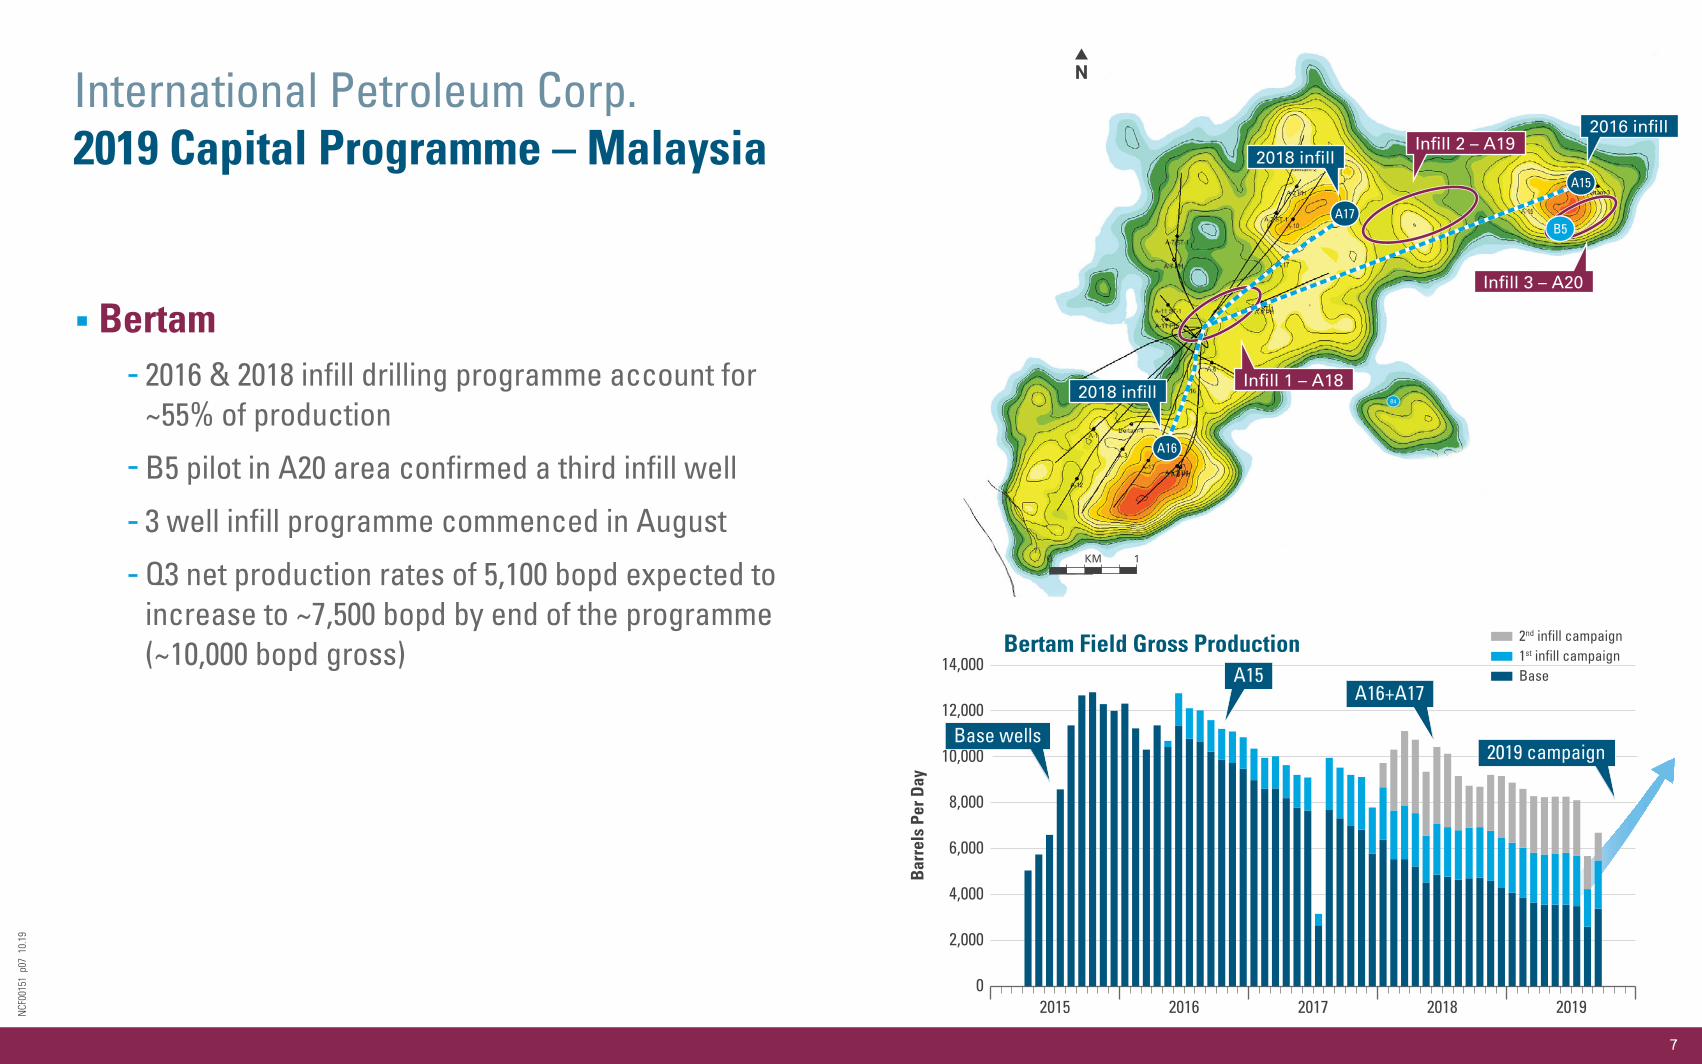
Bertam 2016 & 2018 infill drilling programme account for ~55% of production
B5 pilot in A20 area confirmed a third infill well
3 well infill programme commenced in August
Q3 net production rates of 5,100 bopd expected to increase to ~7,500 bopd by end of the programme (~10,000 bopd gross)
A16
A17
A15
B5
N
0 1KM
Infill 1 – A18
Infill 3 – A20
Infill 2 – A192016 infill
2018 infill
2018 infill
0
2,000
4,000
6,000
8,000
10,000
12,000
14,000
2015 2016 2017 2018 2019
Bar
rels
Per
Day
Bertam Field Gross Production 2nd infill campaign1st infill campaignBase
Base wells
A15
2019 campaign
A16+A17
B4
7

NCF
0015
1 p
08 1
0.19
International Petroleum Corp.2019 Capital Programme – France
Vert-La-Gravelle redevelopment Q3 production in France average 2,500 boepd
Completed first horizontal well in Triassic (VGR113) with 360m of horizontal section
Initial results ahead of expectations - Current production at >1,000 bopd - Material increase in French production currently >3,000 bopd.
VGR10 drilling ongoing – top structure shallow to prognosis may be positive for Phase 2 development
Vert-La-Gravelle Hydrocarbon Saturation
VGR7
VGR4
VGR8
VGR113H
VGR1
VGR5VGR6
VGR10
VGR109H
Existing wells
New water injectorsNew producers
Drilling ongoing
360m horizontal section completed
0
1,000
500
1,500
2,000
2,500
3,000
3,500
4,000
2017 2018 2019
Bar
rels
Per
Day
France ProductionAquitaineParis Basin
Grandpuitsrefinery outage
VGR113Honline
8
NCF
0015
1 p
09 1
0.19
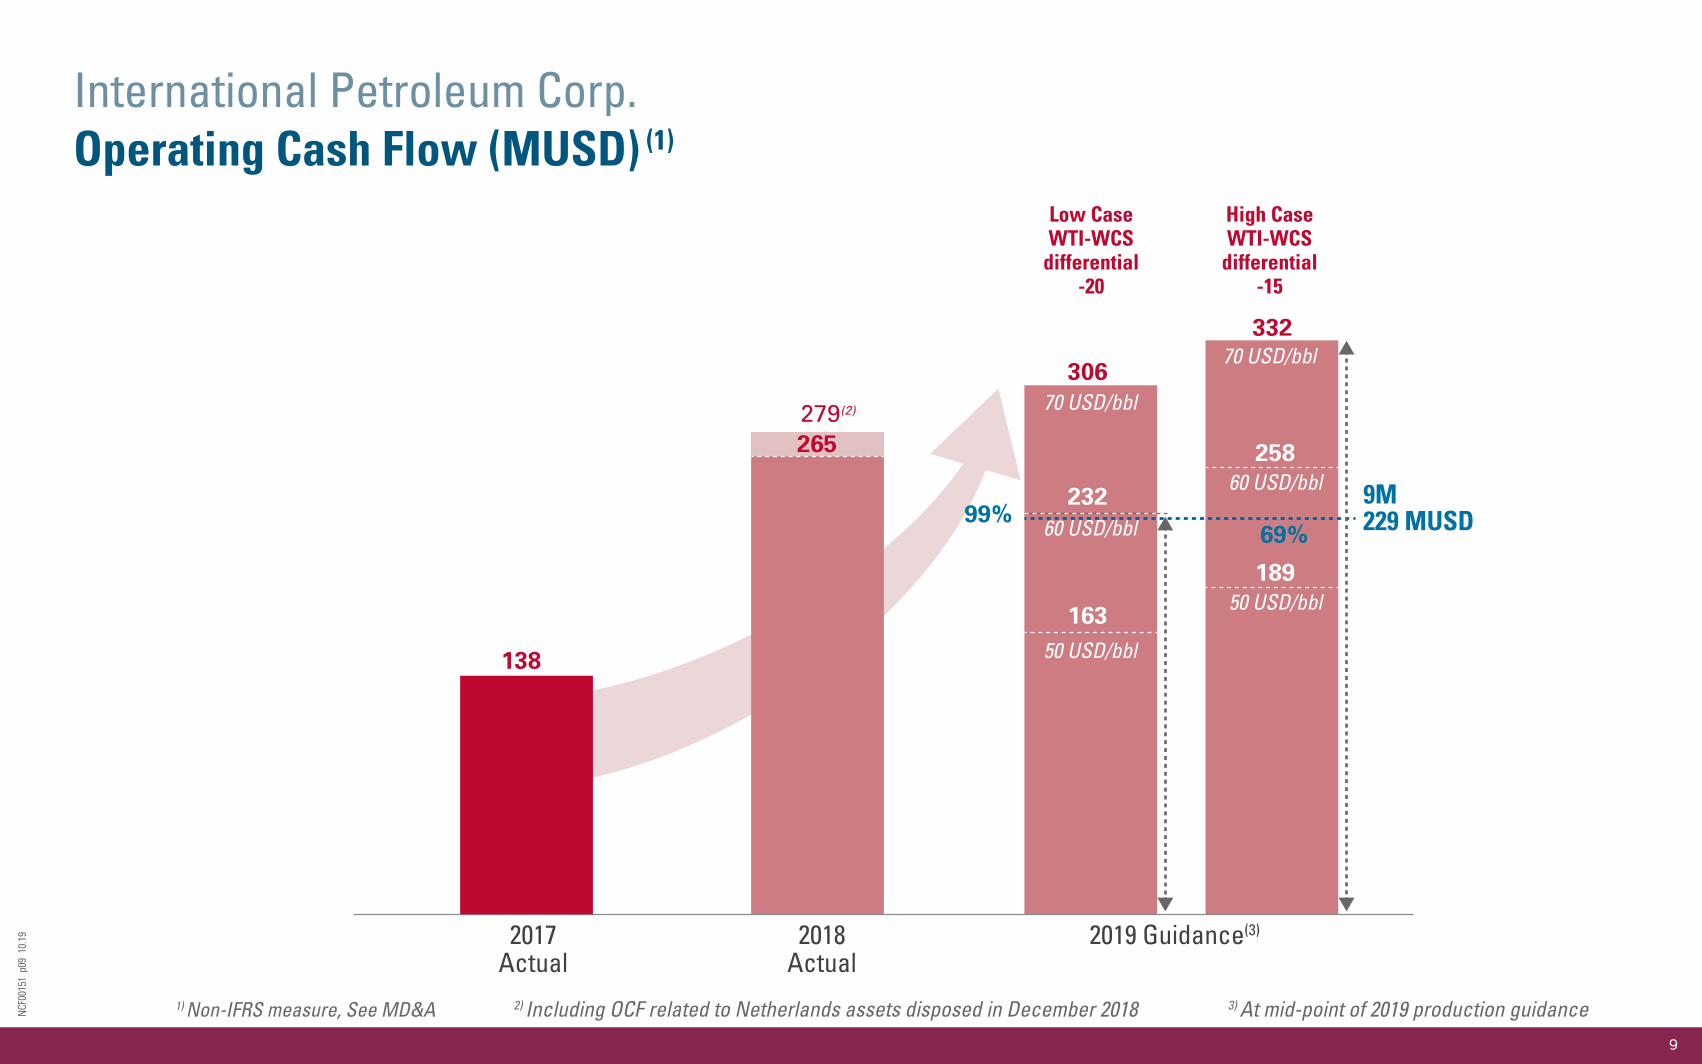
International Petroleum Corp.Operating Cash Flow (MUSD) (1)
2017Actual
2018Actual
2019 Guidance(3)
138
279(2)
306
332
Low CaseWTI-WCS
differential-20
High CaseWTI-WCS
differential-15
265
70 USD/bbl
70 USD/bbl
60 USD/bbl
60 USD/bbl
50 USD/bbl
9M229 MUSD
50 USD/bbl
2) Including OCF related to Netherlands assets disposed in December 2018 3) At mid-point of 2019 production guidance
232
258
189
163
99%69%
1) Non-IFRS measure, See MD&A
9
NCF
0015
1 p
10 1
0.19
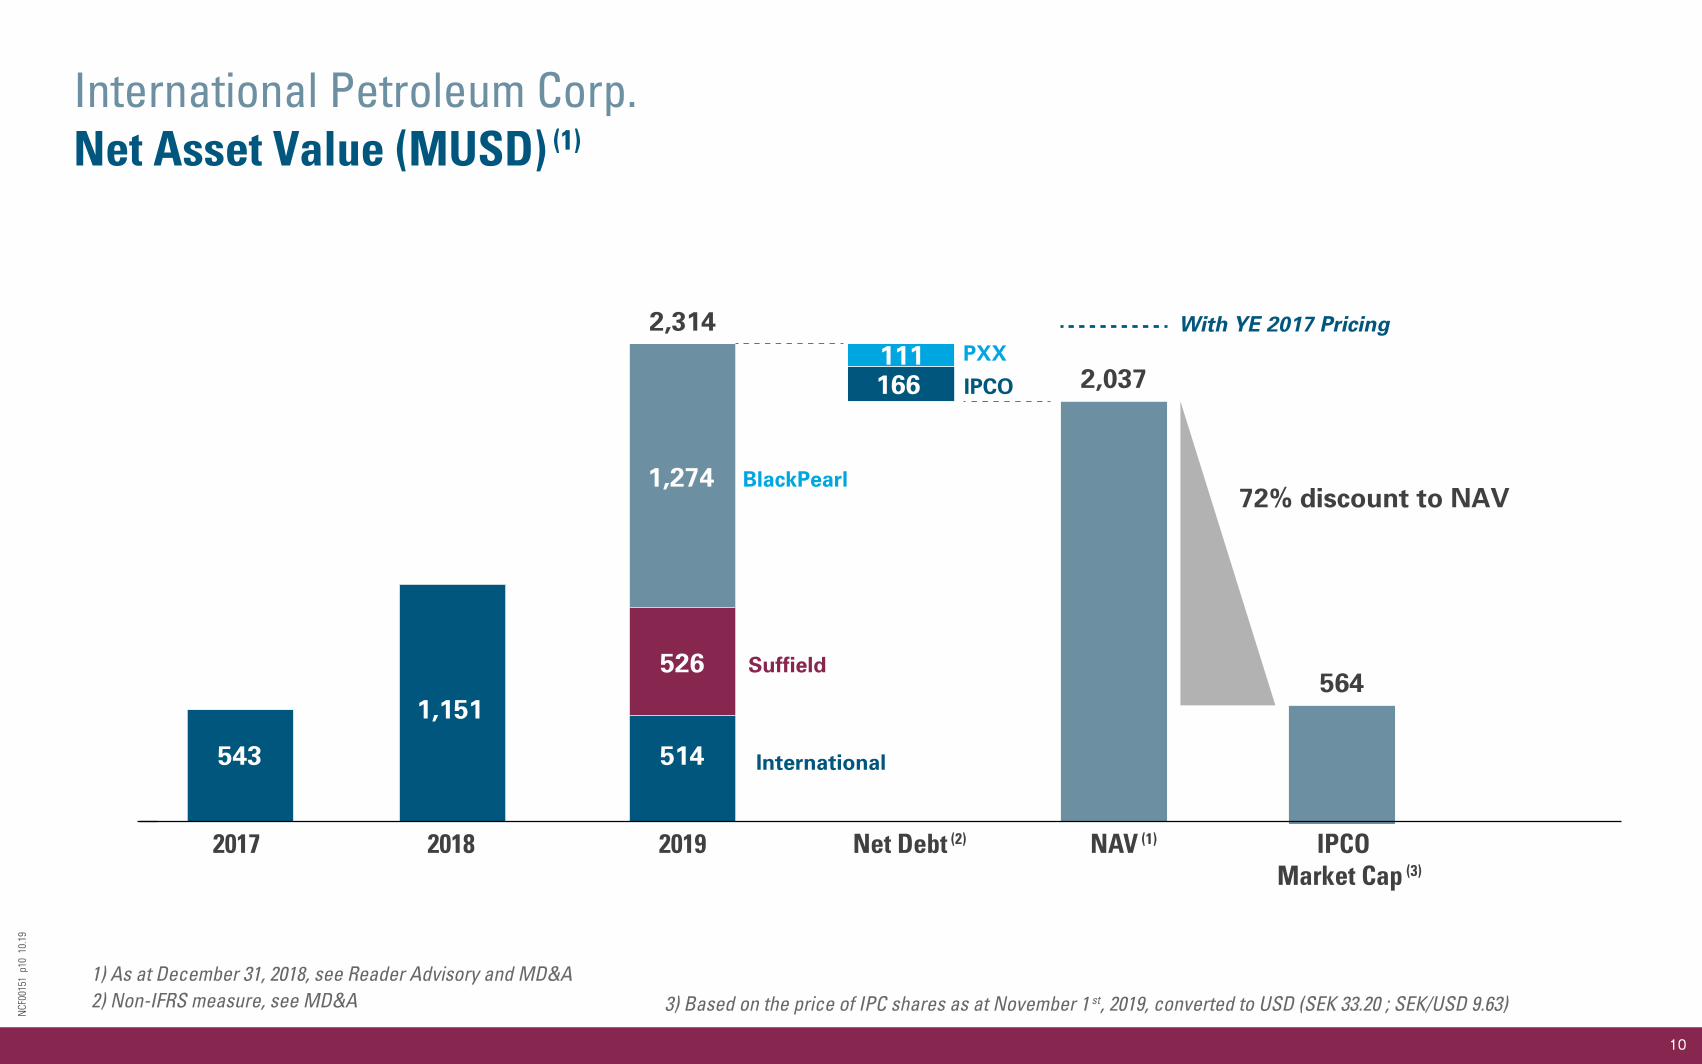
International Petroleum Corp.Net Asset Value (MUSD) (1)
2017 2018 Net Debt (2)2019 NAV (1) IPCO Market Cap (3)
543 514
526
1,151
1,274
2,314
166111
2,037
72% discount to NAV
With YE 2017 Pricing
564
PXX
BlackPearl
Suffield
International
IPCO
1) As at December 31, 2018, see Reader Advisory and MD&A2) Non-IFRS measure, see MD&A 3) Based on the price of IPC shares as at November 1 st, 2019, converted to USD (SEK 33.20 ; SEK/USD 9.63)
10
NCF
0015
1 p
11 1
0.19
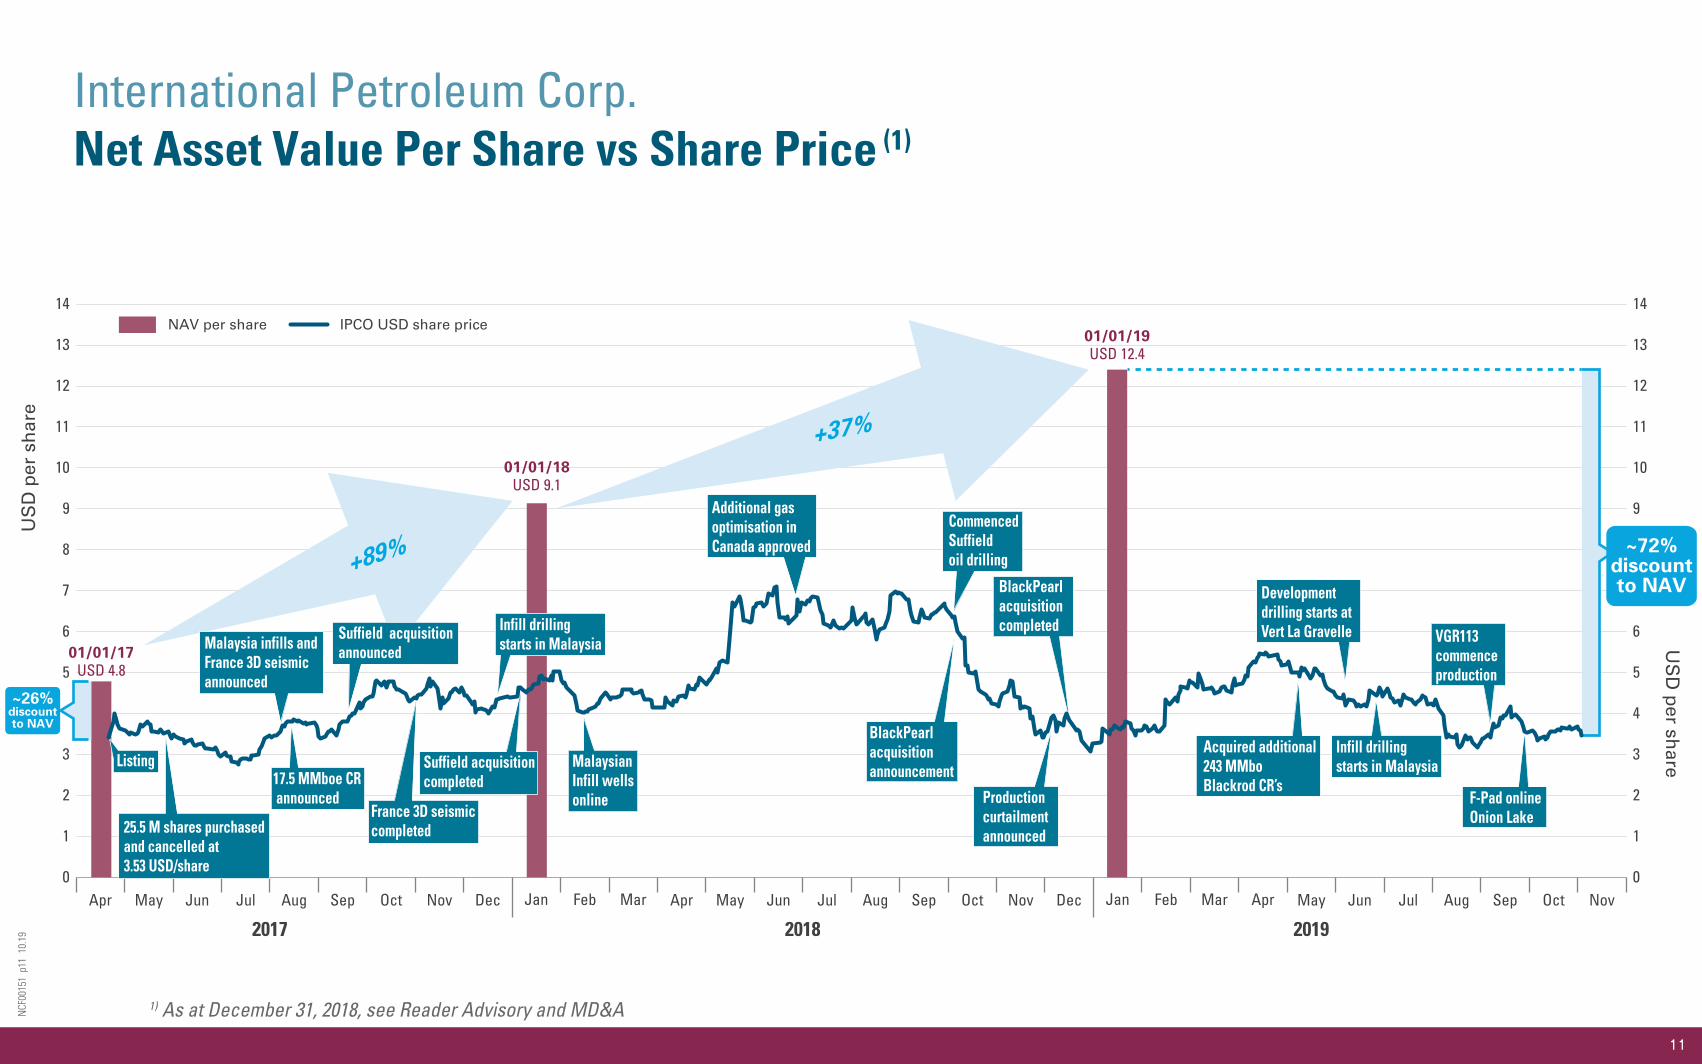
International Petroleum Corp.Net Asset Value Per Share vs Share Price (1)
1) As at December 31, 2018, see Reader Advisory and MD&A
May May May Jun Jul Aug Sep Oct NovJunApr AprJun Jul JulAug Sep Oct Nov Dec Aug Sep Oct Nov DecJan Feb Jan Feb Mar AprMar
US
D p
er s
har
e
10
11
12
13
14
9
8
7
6
3
4
2
1
5
0
10
11
12
13
14
9
8
7
6
3
2
1
5
0
2017 2018 2019
US
D p
er share
01/01/17USD 4.8
01/01/18USD 9.1
01/01/19USD 12.4
~26%discountto NAV
~72%discountto NAV
+89%
+37%
NAV per share IPCO USD share price
Listing
25.5 M shares purchasedand cancelled at 3.53 USD/share
Suffield acquisitionannouncedMalaysia infills and
France 3D seismicannounced
17.5 MMboe CR announced
France 3D seismiccompleted
Suffield acquisitioncompleted
MalaysianInfill wellsonline
Infill drillingstarts in Malaysia
Infill drillingstarts in Malaysia
Additional gasoptimisation inCanada approved
Development drilling starts at Vert La Gravelle
BlackPearlacquisitionannouncement
Productioncurtailmentannounced
Acquired additional243 MMboBlackrod CR’s
F-Pad onlineOnion Lake
BlackPearlacquisitioncompleted
CommencedSuffieldoil drilling
VGR113commenceproduction
11

NCF
0015
1 p
12 1
0.19
International Petroleum Corp.Shareholder Value
First share repurchase launched May 2017 25.5 million shares acquired and cancelled 90 MUSD CAD 4.77 per share Production 10 Mboepd, ~29 MMboe 2P reserve, no contingent resource, significant discount to 2P NAV (1)
New repurchase programme (2)
Production expected to increase ~5x by year end 2P reserve increased by 10x Aggregated ~1 billion barrels contingent resource Wider discount to 2P NAV (1)
Commodity prices relatively stronger 2019 financial performance towards high end of guidance Plan to buy back 11.5 million shares; approx. 7% of shares outstanding, maximum permitted over next 12 months
1) See Reader Advisory 2) Subject to Toronto Stock Exchange approval
12
Third Quarter 2019Financial Highlights
13
Third Quarter2019
First Nine Months2019
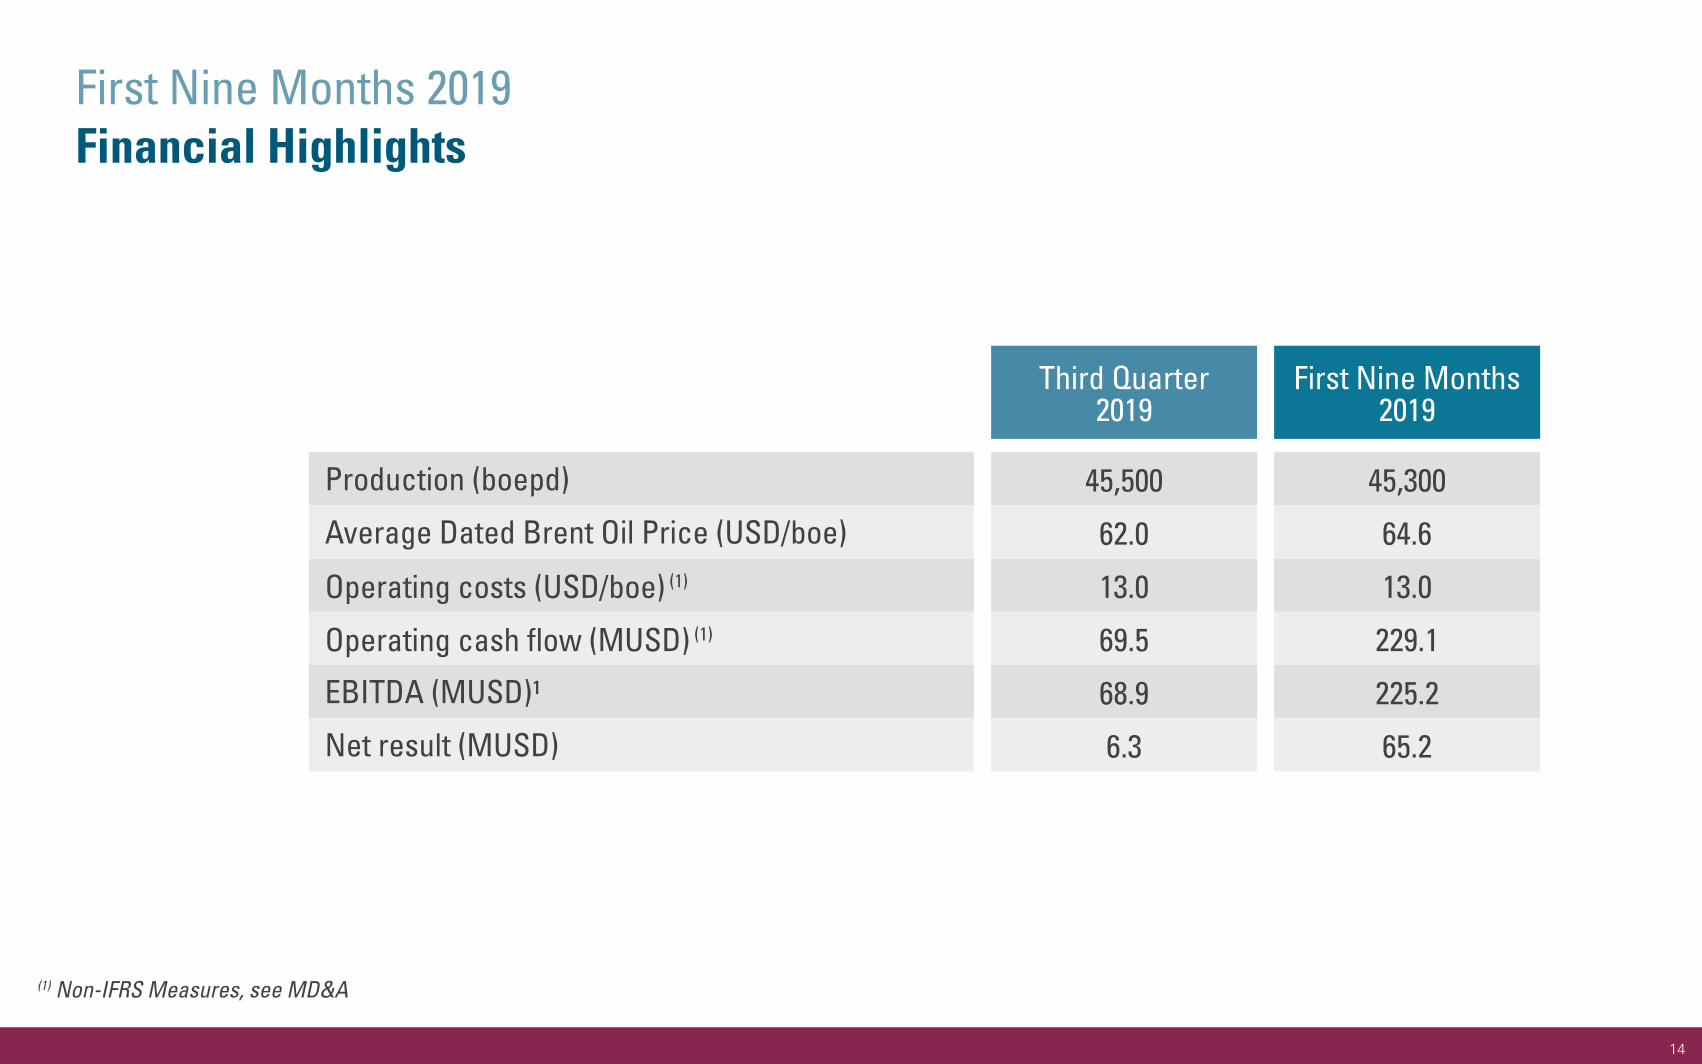
Production (boepd) 45,500 45,300
Average Dated Brent Oil Price (USD/boe) 62.0 64.6
Operating costs (USD/boe) (1) 13.0 13.0
Operating cash flow (MUSD) (1) 69.5 229.1
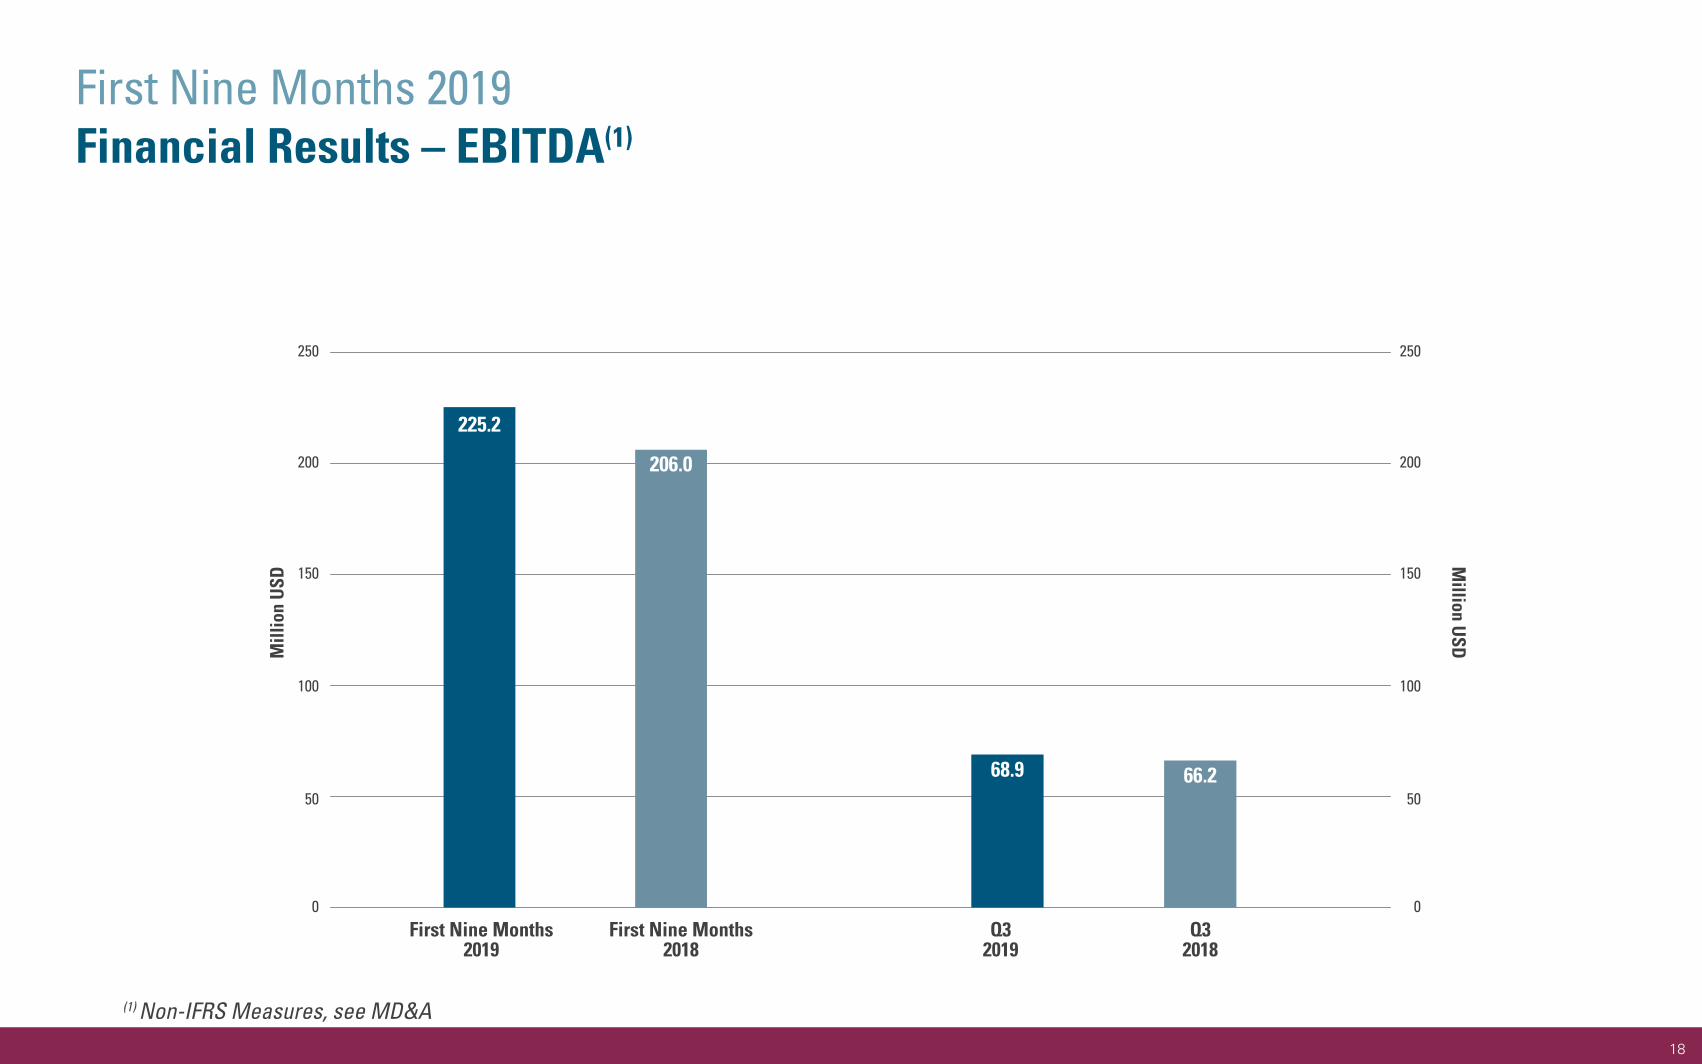
EBITDA (MUSD)¹ 68.9 225.2
Net result (MUSD) 6.3 65.2
(1) Non-IFRS Measures, see MD&A
14
First Nine Months 2019Financial Highlights
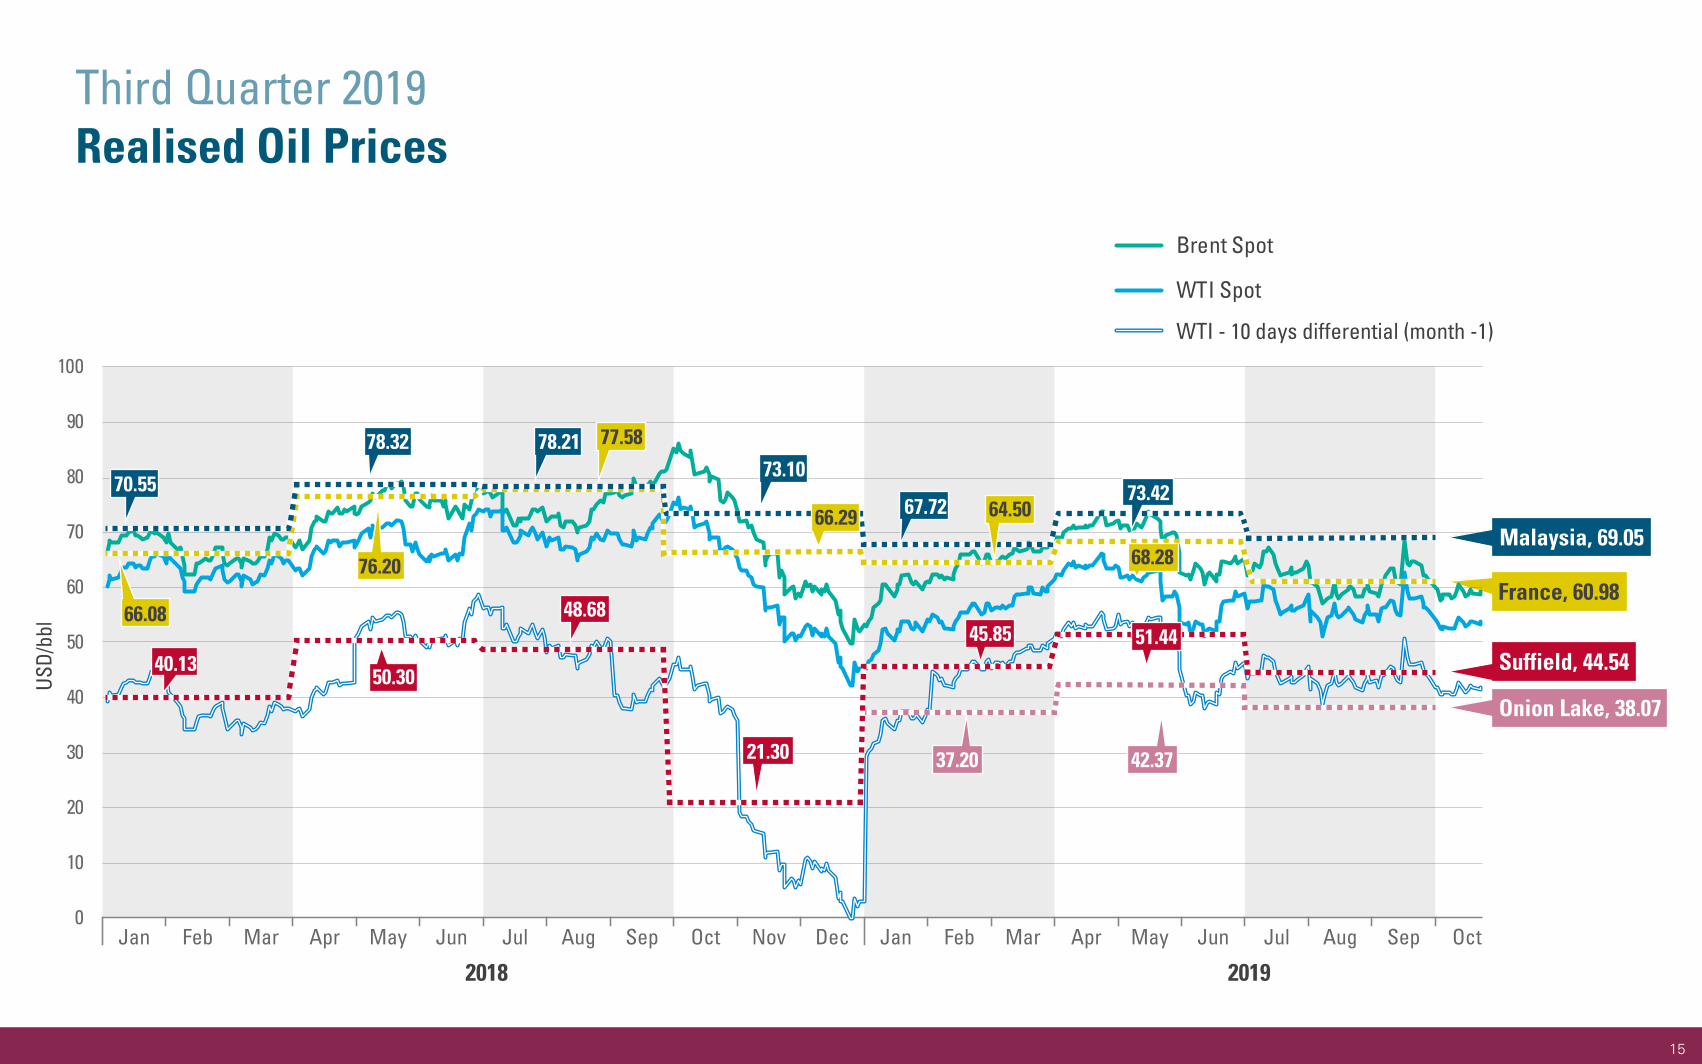
Brent Spot
WTI Spot
USD/
bbl
2018 2019
0
10
20
30
40
50
60
70
80
90
100
Jan Feb Mar Apr May Jun Jul Aug Sep Oct Aug Sep OctNov Dec Jan Feb Mar Apr May Jun Jul
WTI - 10 days differential (month -1)
Suffield, 44.54
Onion Lake, 38.07
Malaysia, 69.05
France, 60.98
70.55
50.30
48.68
21.30
45.85 51.44
37.20 42.37
40.13
78.32 78.2173.10
67.7273.42
77.58
66.29 64.50
68.2876.20
66.08
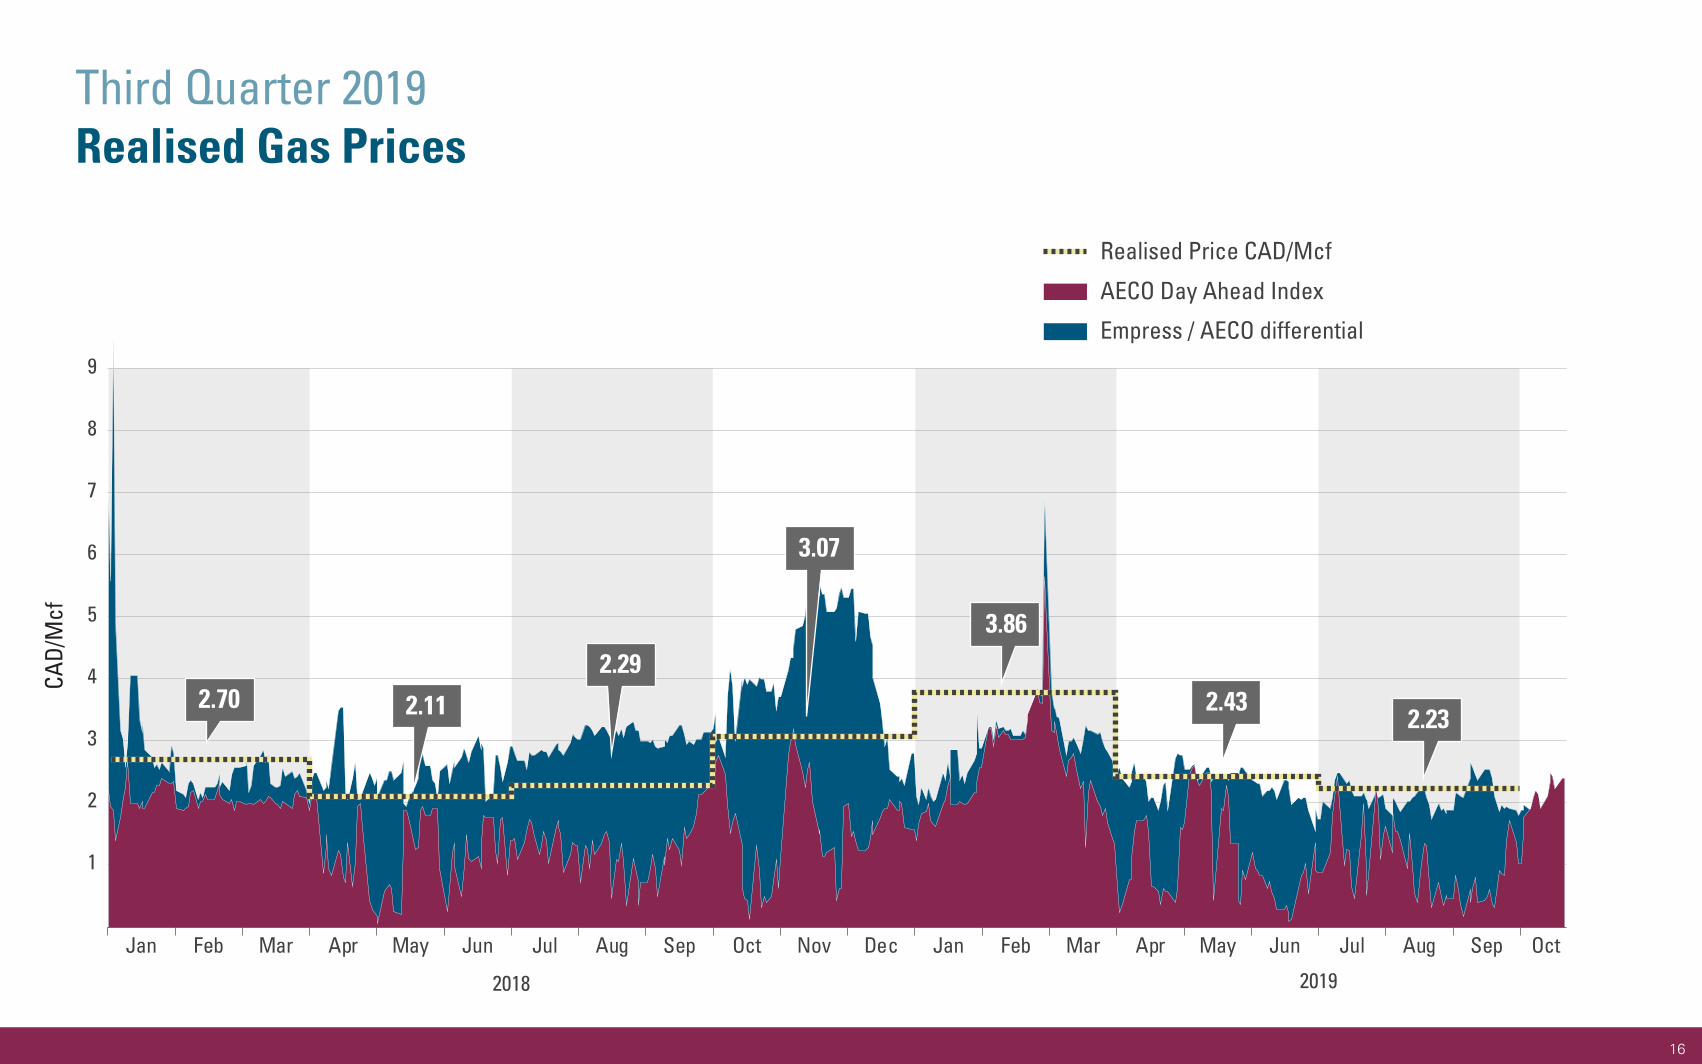
Third Quarter 2019Realised Oil Prices
15
1
2
3
4
5
6
7
8
9
Empress / AECO differential
AECO Day Ahead Index
Realised Price CAD/Mcf
CAD/
Mcf
2018 2019
Jan Feb Mar Apr May Jun Jul Aug Sep Oct Jul Aug Sep OctNov Dec Jan Feb Mar Apr May Jun
2.70 2.11
3.07
3.86
2.232.43
2.29
Third Quarter 2019Realised Gas Prices
16
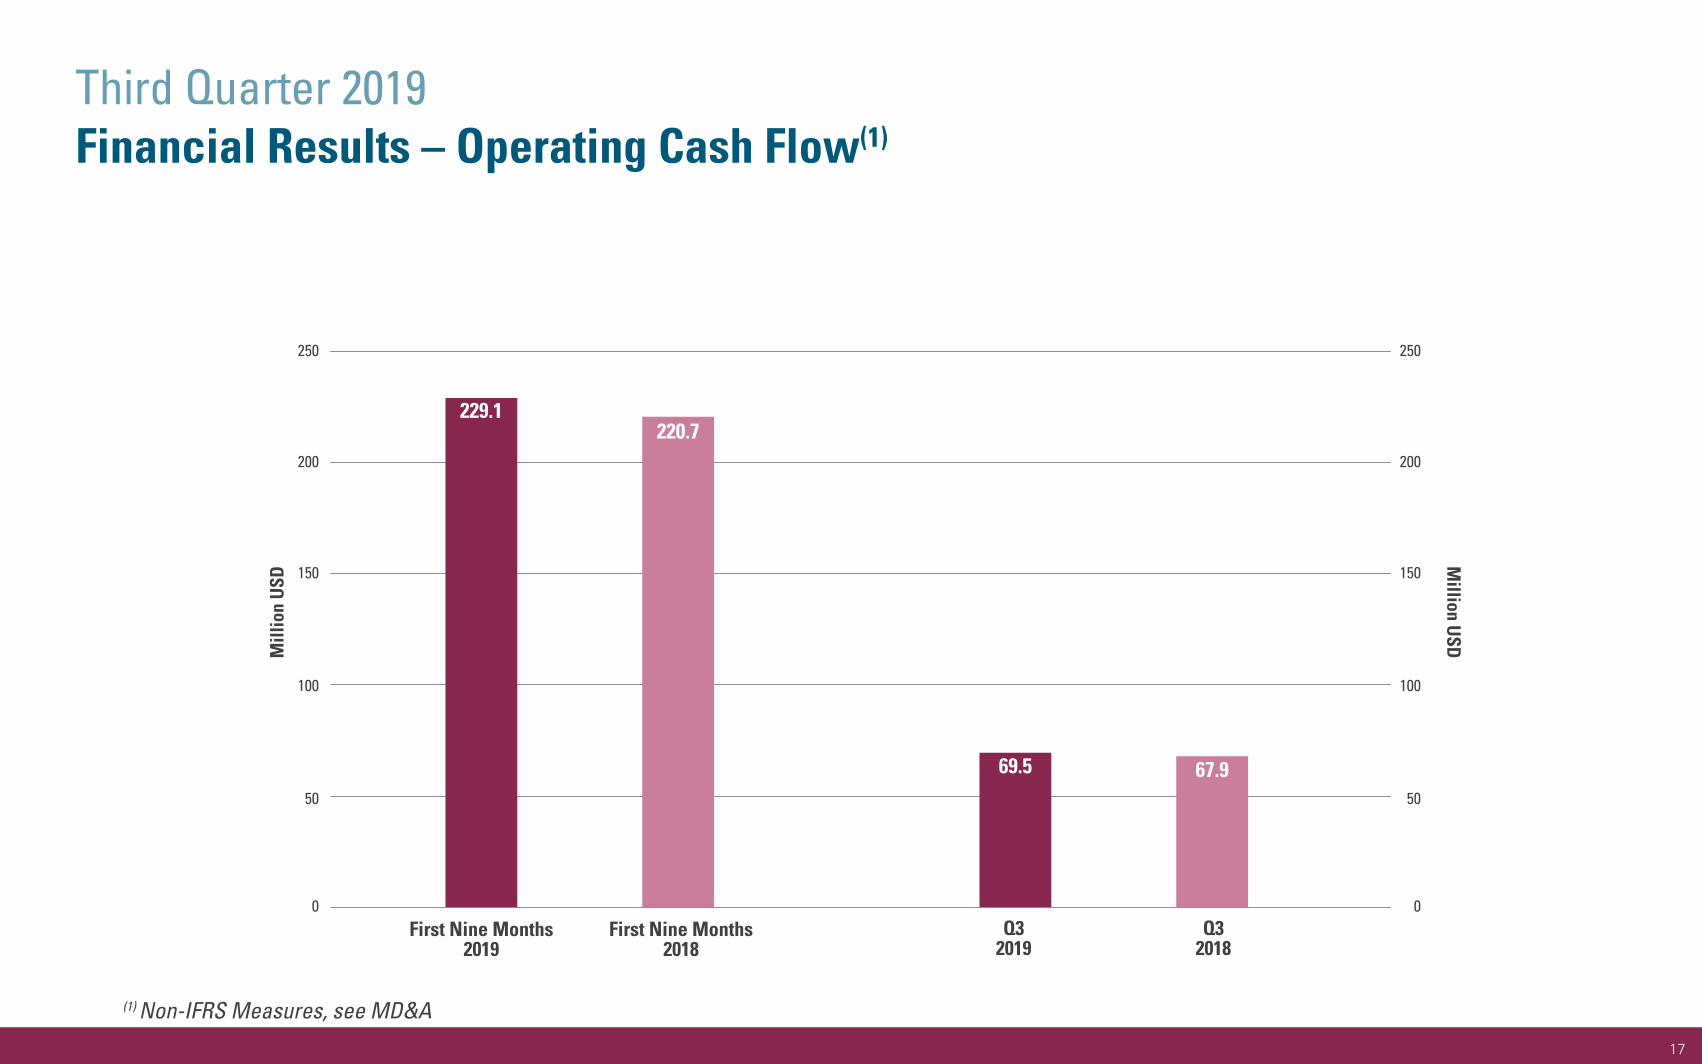
(1) Non-IFRS Measures, see MD&A
0
50
100
250
150
200
0
50
100
250
150
200
Mill
ion
USD
220.7229.1
First Nine Months2019
First Nine Months2018
Million U
SD
67.969.5
Q32019
Q32018
Third Quarter 2019Financial Results – Operating Cash Flow(1)
17
0
50
100
250
150
200
0
50
100
250
150
200
Mill
ion
USD
Million U
SD
First Nine Months2019
First Nine Months2018
(1) Non-IFRS Measures, see MD&A
225.2
206.0
68.9 66.2
Q32019
Q32018
18
First Nine Months 2019Financial Results – EBITDA(1)

4
8
0
16
20
12
4
8
0
16
20
12
Q1 2019Actual
Q2 2019Actual
Q3 2019Actual
Q4 2019Forecast
USD/boe USD/boeoperating costs
2019 Operating Costs:12.9 USD/boe guidance unchanged
(1) Non-IFRS Measure, see MD&A
19
First Nine Months 2019Operating Costs (1)

Third Quarter2019
First Nine Months2019
Average Dated Brent oil price (62.0 USD/bbl) (64.6 USD/bbl)
Revenue 31.5 33.0Cost of operations -10.9 -11.0Tariff and transportation -1.6 -1.6Production taxes -0.5 -0.4
Operating costs (2) -13.0 -13.0Cost of blending -1.3 -1.3Inventory movements -0.2 0.1Revenue – production costs 17.0 18.8
Cash taxes -0.4 -0.3Operating cash flow (2) 16.6 18.5
General and administration costs (3) -0.5 -0.6EBITDA 2 16.5 18.2
(1) Based on production volumes (2) Non-IFRS Measures, see MD&A (3) Adjusted for depreciation
20
First Nine Months 2019Netback (1) (USD/boe)
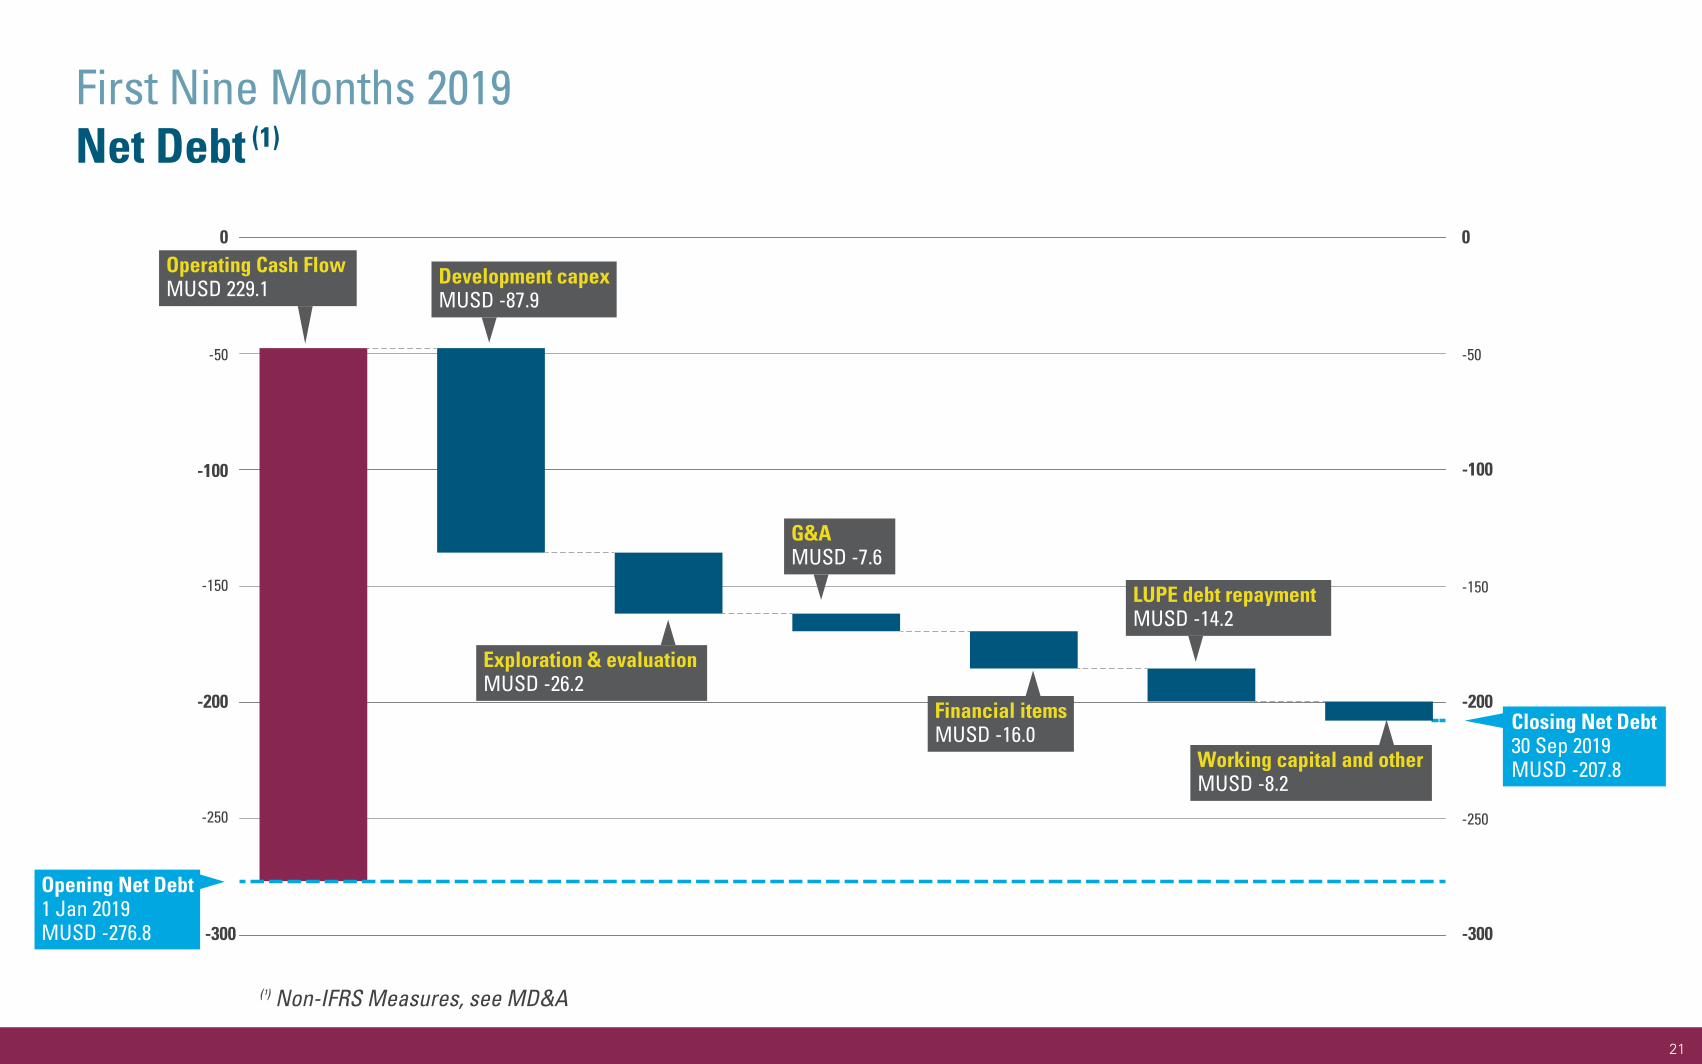
Opening Net Debt1 Jan 2019MUSD -276.8
Closing Net Debt30 Sep 2019 MUSD -207.8
-300
-250
-200
0 0
-150
-100
-50
-300
-250
-200
-150
-100
-50
Operating Cash FlowMUSD 229.1
Exploration & evaluationMUSD -26.2
Financial itemsMUSD -16.0
Development capexMUSD -87.9
G&AMUSD -7.6
LUPE debt repaymentMUSD -14.2
Working capital and otherMUSD -8.2
(¹) Non-IFRS Measures, see MD&A
21
First Nine Months 2019Net Debt (1)

MUSD Third Quarter2019
First Nine Months2019
G&A 2.3 7.6
G&A – Depreciation 0.4 1.1
G&A Expense 2.7 8.7
Third Quarter2019
First Nine Months2019
Interest expense 3.0 14.6
Loan facility commitment fees 0.4 1.2
Amortisation of loan fees 0.4 1.6
Foreign exchange loss (gain), net (1) 4.7 -4.2
Unwinding of site restoration discount 2.7 8.0
Other – 0.3
Net Finance Costs 11.2 21.5
(1) Mainly non-cash, driven by the revaluation of intra-group loans
22
First Nine Months 2019G&A / Financial Items
Mill
ion
USD
Million U
SD
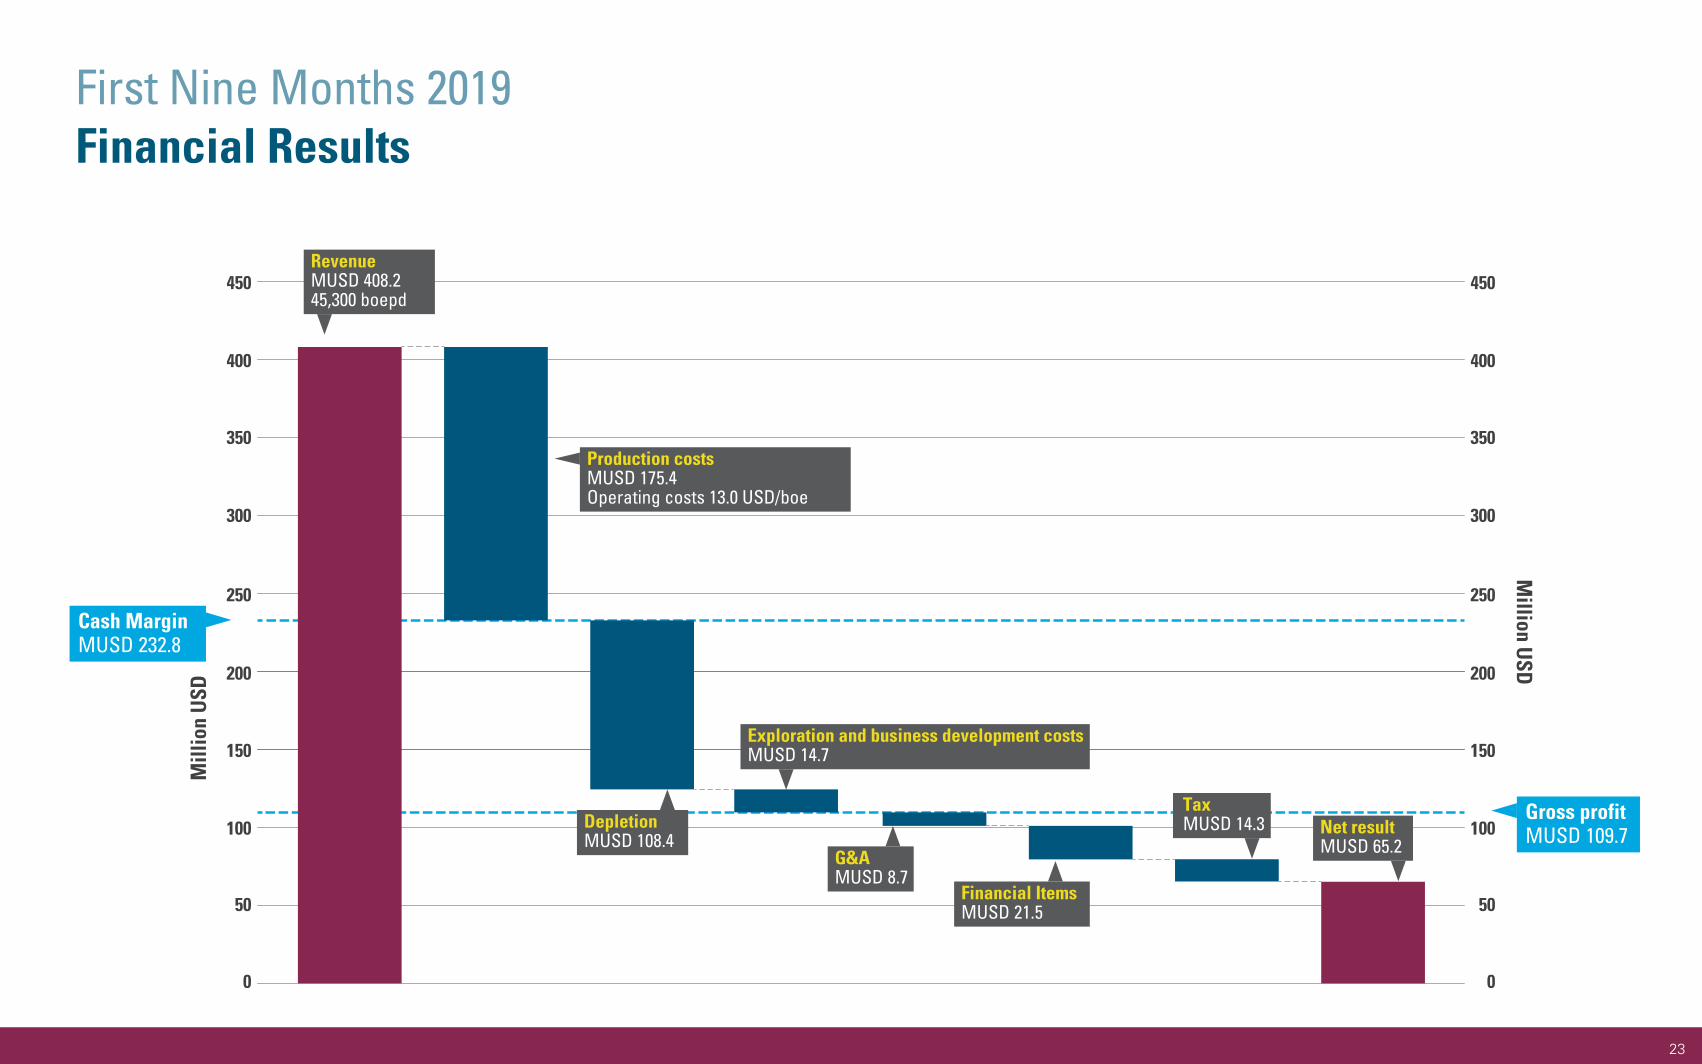
Cash MarginMUSD 232.8
Gross profitMUSD 109.7
50
100
150
200
300
250
350
400
450
0
50
100
150
200
300
250
350
400
450
0
RevenueMUSD 408.245,300 boepd
DepletionMUSD 108.4
G&AMUSD 8.7
TaxMUSD 14.3
Production costsMUSD 175.4Operating costs 13.0 USD/boe
Exploration and business development costsMUSD 14.7
Financial ItemsMUSD 21.5
Net resultMUSD 65.2
23
First Nine Months 2019Financial Results
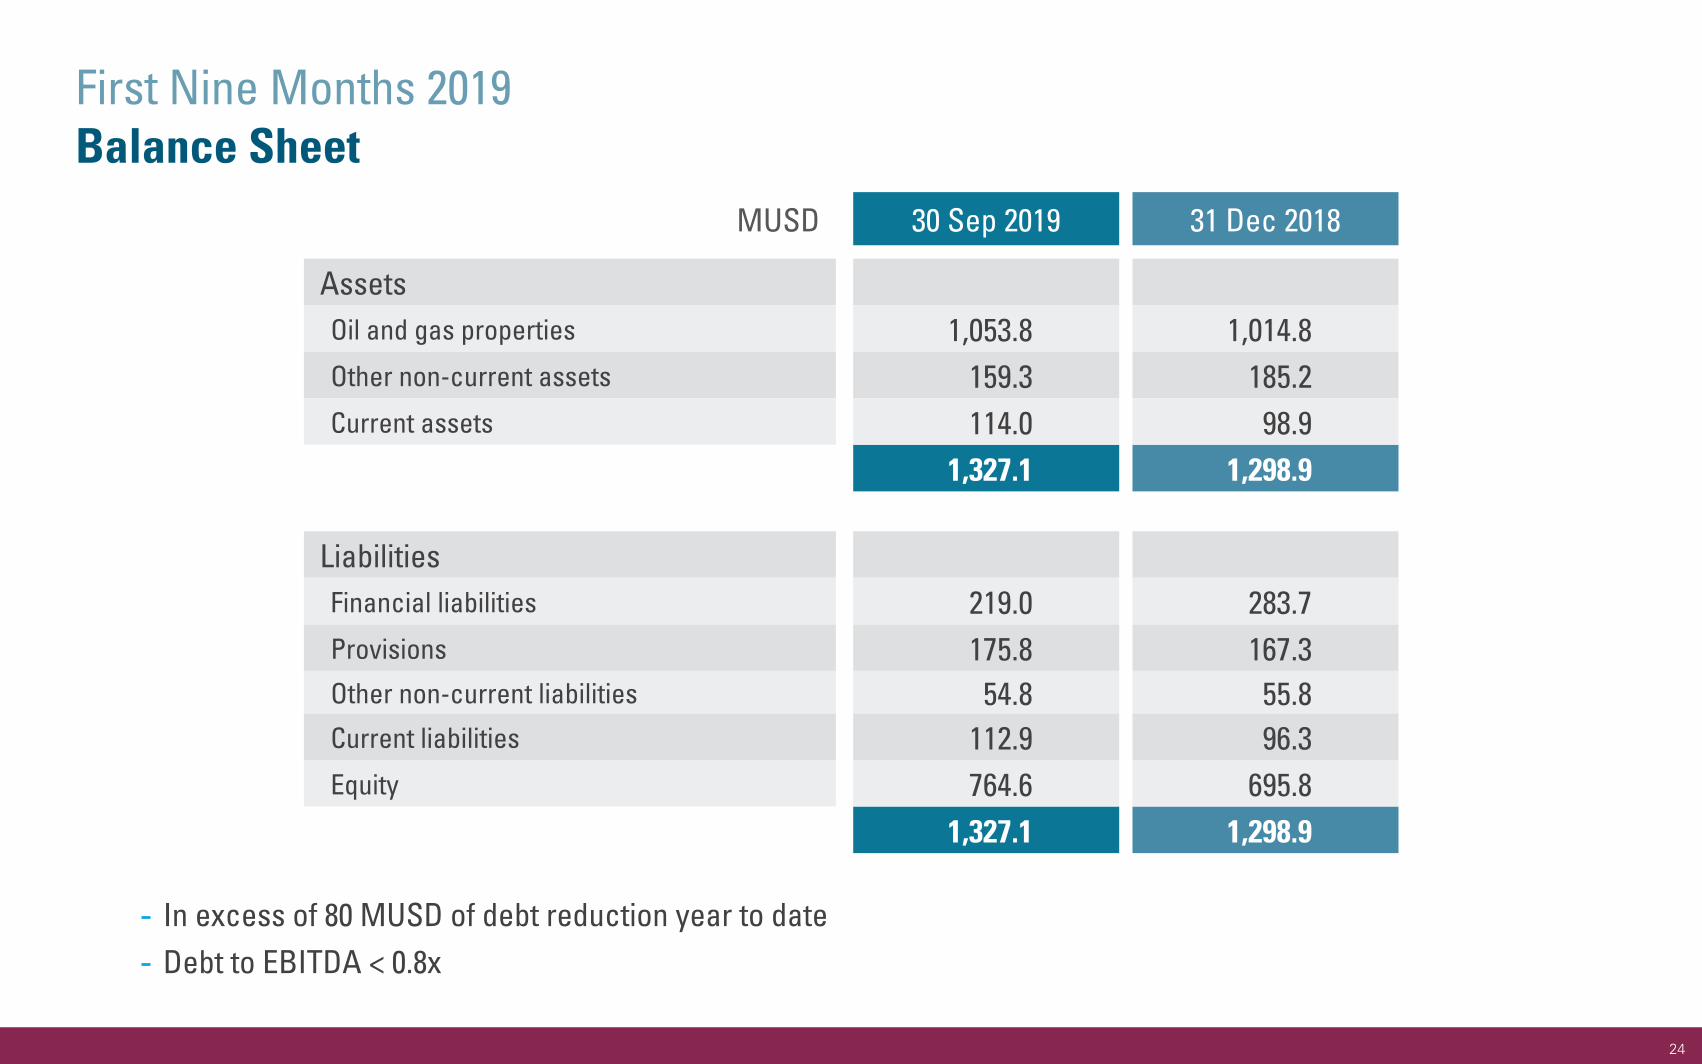
MUSD 30 Sep 2019 31 Dec 2018
AssetsOil and gas properties 1,053.8 1,014.8Other non-current assets 159.3 185.2Current assets 114.0 98.9
1,327.1 1,298.9
LiabilitiesFinancial liabilities 219.0 283.7Provisions 175.8 167.3Other non-current liabilities 54.8 55.8Current liabilities 112.9 96.3Equity 764.6 695.8
1,327.1 1,298.9
In excess of 80 MUSD of debt reduction year to dateDebt to EBITDA < 0.8x
24
First Nine Months 2019Balance Sheet

NCF
0015
1 p
03 1
0.19
International Petroleum Corp.Q3 2019 Highlights
Q3 operating costs of 13.0 USD/boe; in line with guidanceFull year guidance of 12.9 USD/boe retained
Q3 production at 45,500 boepdRetain full year guidance at lower end of 46,000 to 50,000 boepd range2019 forecast exit rate of >50,000 boepd
Production Guidance
Operating Costs (1)
Capital expenditure guidance retained at 188 MUSDDrilling operations ongoing in Canada, France & Malaysia
Organic Growth
Strong cash flow generation, Q3 OCF of 70 MUSDFull year 2019 OCF forecast of 163 to 330 MUSD9M OCF of 229 MUSD, 69% of high end guidance at 70 USD/bbl Brent (Brent avg 65 USD/bbl)
Operating Cash Flow (1)
Capital programme remains fully funded from cash flow with significant free cash flow generatedNet debt reduced from 239 MUSD to 208 MUSDMaterial liquidity headroom under existing bank facilities
Liquidity
Opportunistic approach to further acquisitionsBusiness Development
>2x increase to 288 MMboe; >1.3 billion boe 2P+2C; 16 yr RLIResource Base (2)
37% increase in NAV per share to 12.40 USD, IPC trading at 72% discountNew share repurchase programme to be launched
Shareholder Value (2)
No material incidentsHSE(1) Non-IFRS measure, see MD&A (2) As at December 31, 2018, see Reader Advisory and MD&A
25

Reader Advisory
26
Forward Looking StatementsThis presentation contains statements and information which constitute “forward-looking statements” or “forward-looking information” (within the meaning of applicable securities legislation). Such statements and information (together, “forward-looking statements”) relate to future events, including the Corporation’s future performance, business prospects or opportunities. Actual results may differ materially from those expressed or implied by forward-looking statements. The forward-looking statements contained in this presentation are expressly qualified by this cautionary statement. Forward-looking statements speak only as of the date of this presentation, unless otherwise indicated. IPC does not intend, and does not assume any obligation, to update these forward-looking statements, except as required by applicable laws.
All statements other than statements of historical fact may be forward-looking statements. Any statements that express or involve discussions with respect to predictions, expectations, beliefs, plans, projections, forecasts, guidance, budgets, objectives, assumptions or future events or performance (often, but not always, using words or phrases such as “seek”, “anticipate”, “plan”, “continue”, “estimate”, “expect”, “may”, “will”, “project”, “forecast”, “predict”, “potential”, “targeting”, “intend”, “could”, “might”, “should”, “believe”, “budget” and similar expres-sions) are not statements of historical fact and may be “forward-looking statements”. Forward-looking statements include, but are not limited to, statements with respect to: IPC’s intention and ability to continue to implement strategies to build long-term shareholder value; IPC’s intention to review future potential growth opportunities; the ability of IPC’s portfolio of assets to provide a solid foundation for organic and inorganic growth; the continued facility uptime and reservoir performance in IPC’s areas of operation; the completion of the Vert La Gravelle redevelopment project, including drilling and related production rates and the ability to gather further information regarding the southern part of the field, and other organic growth opportunities in France; the completion of the third phase of infill drilling in Malaysia and the ability to identify and mature additional locations, and the production uplift from such drilling; future development potential of the Suffield operations, including continued and future oil drilling and gas optimization programs, the ability to offset natural declines and the N2N EOR development project (including esti-mated peak rates and timing of such project); the proposed further conventional oil drilling in Canada, including the ability of such drilling to identify further drilling or development opportunities; development of the Blackrod project in Canada; the results of the facility optimization program and the work to debottleneck the facilities and injection capability and the F-Pad production, as well as water intake and steam generation issues, at Onion Lake Thermal; the intention to commence a share repurchase program, including the acceptance thereof by the TSX; the ability to IPC to acquire common shares under the proposed share repurchase program, including the timing of any such purchases; the return of value to IPC’s shareholders as a result of the share repurchases program; 2019 production range, exit rate, operating costs and capital expenditure estimates; potential further acquisition opportunities; estimates of reserves; estimates of contingent resources; estimates of prospective resources; the ability to generate free cash flows and use that cash to repay debt and to continue to deleverage; and future drilling and other explora-tion and development activities.
Statements relating to “reserves”; “contingent resources” and “prospective resources” are also deemed to be forward-looking statements, as they involve the implied assessment, based on certain estimates and assumptions, that the reserves and resources described exist in the quan-tities predicted or estimated and that the reserves and resources can be profitably produced in the future. Ultimate recovery of reserves or resources is based on forecasts of future results, estimates of amounts not yet determinable and assumptions of management.
The forward-looking statements are based on certain key expectations and assumptions made by IPC, including expectations and assumptions concerning: prevailing commodity prices and currency exchange rates; applicable royalty rates and tax laws; interest rates; future well produc-tion rates and reserve and contingent resource volumes; operating costs; the timing of receipt of regulatory approvals; the performance of existing wells; the success obtained in drilling new wells; anticipated timing and results of capital expenditures; the sufficiency of budgeted capital expenditures in carrying out planned activities; the timing, location and extent of future drilling operations; the successful completion of acquisitions and dispositions; the benefits of acquisitions; the state of the economy and the exploration and production business in the jurisdictions in which IPC operates and globally; the availability and cost of financing, labour and services; and the ability to market crude oil, natural gas and natural gas liquids successfully.
Although IPC believes that the expectations and assumptions on which such forward-looking statements are based are reasonable, undue reliance should not be placed on the forward-looking statements because IPC can give no assurances that they will prove to be correct. Since for-ward-looking statements address future events and conditions, by their very nature they involve inherent risks and uncertainties. Actual results could differ materially from those currently anticipated due to a number of factors and risks. These include, but are not limited to: the risks as-sociated with the oil and gas industry in general such as operational risks in development, exploration and production; delays or changes in plans with respect to exploration or development projects or capital expenditures; the uncertainty of estimates and projections relating to reserves, resources, production, revenues, costs and expenses; health, safety and environmental risks; commodity price and exchange rate fluctuations; interest rate fluctuations; marketing and transportation; loss of markets; environmental risks; competition; incorrect assessment of the value of acquisitions; failure to complete or realize the anticipated benefits of acquisitions or dispositions; the ability to access sufficient capital from internal and external sources; failure to obtain required regulatory and other approvals; and changes in legislation, including but not limited to tax laws, royalties and environmental regulations. Readers are cautioned that the foregoing list of factors is not exhaustive.
Additional information on these and other factors that could affect IPC, or its operations or financial results, are included in the management discussion and analysis for the nine months ended September 30, 2019 (MD&A) (See “Cautionary Statement Regarding Forward-Looking Informa-tion” therein), the Corporation’s Annual Information Form (AIF) for the year ended December 31, 2018 (See “Cautionary Statement Regarding Forward-Looking Information”, “Reserves and Resources Advisory” and “ Risk Factors” therein) and other reports on file with applicable securities regulatory authorities, which may be accessed through the SEDAR website (www.sedar.com) or IPC’s website (www.international-petroleum.com).
Non-IFRS MeasuresReferences are made in this press release to “operating cash flow” (OCF), “Earnings Before Interest, Tax, Depreciation and Amortization” (EBITDA), “operating costs” and “net debt”/”net cash”, which are not generally accepted accounting measures under International Financial Re-porting Standards (IFRS) and do not have any standardized meaning prescribed by IFRS and, therefore, may not be comparable with definitions of OCF, EBITDA, operating costs and net debt/net cash that may be used by other public companies. Non-IFRS measures should not be consid-ered in isolation or as a substitute for measures prepared in accordance with IFRS.
Management believes that OCF, EBITDA, operating costs and net debt/net cash are useful supplemental measures that may assist shareholders and investors in assessing the cash generated by and the financial performance and position of the Corporation. Management also uses non-IFRS measures internally in order to facilitate operating performance comparisons from period to period, prepare annual operating budgets and assess the Corporation’s ability to meet its future capital expenditure and working capital requirements. Management believes these non-IFRS measures are important supplemental measures of operating performance because they highlight trends in the core business that may not otherwise be apparent when relying solely on IFRS financial measures. Management believes such measures allow for assessment of the Corpora-tion’s operating performance and financial condition on a basis that is more consistent and comparable between reporting periods. The Corporation also believes that securities analysts, investors and other interested parties frequently use non-IFRS measures in the evaluation of issuers.
The definition and reconciliation of each non-IFRS measure is presented in IPC’s MD&A (See “Non-IFRS Measures” therein).
Disclosure of Oil and Gas InformationThis presentation contains references to estimates of 2P reserves and resources attributed to the Corporation’s oil and gas assets. Gross reserves / resources are the total working interest (operating or non-operating) share reserves before the deduction of any royalties and without including any royalty interests receivable.
Reserves estimates, contingent resource estimates and estimates of future net revenue in respect of IPC’s oil and gas assets in the Suffield area of Canada are effective as of December 31, 2018, and are included in the report prepared by McDaniel & Associates Consultants Ltd. (McDan-iel), an independent qualified reserves evaluator, in accordance with National Instrument 51-101 – Standards of Disclosure for Oil and Gas Activities (NI 51-101) and the Canadian Oil and Gas Evaluation Handbook (the COGE Handbook), and using McDaniel’s January 1, 2019 price fore-casts.
Reserves estimates, contingent resource estimates and estimates of future net revenue in respect of IPC’s oil and gas assets in the Onion Lake, Blackrod and Mooney areas of Canada are effective as of December 31, 2018, and are included in reports prepared by Sproule Associates Limited (Sproule), an independent qualified reserves evaluator, in accordance with NI 51-101 and the COGE Handbook, and using McDaniel’s January 1, 2019 price forecasts.
Reserve estimates, contingent resource estimates, prospective resource estimates and estimates of future net revenue in respect of IPC’s oil and gas assets in France and Malaysia are effective as of December 31, 2018, and are included in the report prepared by ERC Equipoise Ltd. (ERCE), an independent qualified reserves auditor, in accordance with NI 51-101 and the COGE Handbook, and using McDaniel’s January 1, 2019 price forecasts.

Reader Advisory
27
The price forecasts used in the reserve reports are available on the website of McDaniel (www.mcdan.com), and are contained in the MCR.
The reserves life index (RLI) is calculated by dividing the 2P reserves of 288 MMboe as at December 31, 2018, by the mid-point of the initial 2019 production guidance of 46,000 to 50,000 boepd. The reserves replacement ratio is based on 2P reserves of 129.1 MMboe as at December 31, 2017 (including the 2P reserves attributable to the acquisition of the Suffield area assets which completed on January 5, 2018), production during 2018 of 12.4 MMboe, additions to 2P reserves during 2018 of 12.7 MMboe, disposals of 2P reserves related to the disposal of the Netherlands assets of 1.6 MMboe and 2P reserves of 128.0 MMboe as at December 31, 2018 (excluding the 2P reserves attributable to the acquisition of BlackPearl which completed on December 14, 2018).
“2P reserves” means IPC’s gross proved plus probable reserves. “Proved reserves” are those reserves that can be estimated with a high degree of certainty to be recoverable. It is likely that the actual remaining quantities recovered will exceed the estimated proved reserves. “Probable reserves” are those additional reserves that are less certain to be recovered than proved reserves. It is equally likely that the actual remaining quantities recovered will be greater or less than the sum of the estimated proved plus probable reserves.
Contingent resources are those quantities of petroleum estimated, as of a given date, to be potentially recoverable from known accumulations using established technology or technology under development, but which are not currently considered to be commercially recoverable due to one or more contingencies. Contingencies are conditions that must be satisfied for a portion of contingent resources to be classified as reserves that are: (a) specific to the project being evaluated; and (b) expected to be resolved within a reasonable timeframe. Contingencies may include factors such as economic, legal, environmental, political, and regulatory matters, or a lack of markets. It is also appropriate to classify as contingent resources the estimated discovered recoverable quantities associated with a project in the early evaluation stage. Contingent resources are further classified in accordance with the level of certainty associated with the estimates and may be sub-classified based on a project maturity and/or characterized by their economic status.
There are three classifications of contingent resources: low estimate, best estimate and high estimate. Best estimate is a classification of estimated resources described in the COGE Handbook as being considered to be the best estimate of the quantity that will be actually recovered. It is equally likely that the actual remaining quantities recovered will be greater or less than the best estimate. If probabilistic methods are used, there should be at least a 50% probability that the quantities actually recovered will equal or exceed the best estimate.
Contingent resources are further classified based on project maturity. The project maturity subclasses include development pending, development on hold, development unclarified and development not viable. All of the Corporation’s contingent resources are classified as either develop-ment on hold or development unclarified. Development on hold is defined as a contingent resource where there is a reasonable chance of development, but there are major non-technical contingencies to be resolved that are usually beyond the control of the operator. Development un-clarified is defined as a contingent resource that requires further appraisal to clarify the potential for development and has been assigned a lower chance of development until contingencies can be clearly defined. Chance of development is the probability of a project being commercially viable.
References to “unrisked” contingent resources volumes means that the reported volumes of contingent resources have not been risked (or adjusted) based on the chance of commerciality of such resources. In accordance with the COGE Handbook for contingent resources, the chance of commerciality is solely based on the chance of development based on all contingencies required for the re-classification of the contingent resources as reserves being resolved. Therefore unrisked reported volumes of contingent resources do not reflect the risking (or adjustment) of such volumes based on the chance of development of such resources.
The contingent resources reported in this presentation are estimates only. The estimates are based upon a number of factors and assumptions each of which contains estimation error which could result in future revisions of the estimates as more technical and commercial information becomes available. The estimation factors include, but are not limited to, the mapped extent of the oil and gas accumulations, geologic characteristics of the reservoirs, and dynamic reservoir performance. There are numerous risks and uncertainties associated with recovery of such resources, including many factors beyond the Corporation’s control. There is uncertainty that it will be commercially viable to produce any portion of the contingent resources referred to in this presentation.
2P reserves and contingent resources included in the reports of McDaniel, Sproule and ERCE have been aggregated in this presentation by IPC. Estimates of reserves, resources and future net revenue for individual properties may not reflect the same level of confidence as estimates of reserves, resources and future net revenue for all properties, due to aggregation. This presentation contains estimates of the net present value of the future net revenue from IPC’s reserves. The estimated values of future net revenue disclosed in this presentation do not represent fair market value. There is no assurance that the forecast prices and cost assumptions used in the reserve evaluations will be attained and variances could be material.
References to “contingent resources” do not constitute, and should be distinguished from, references to “reserves”. References to “prospective resources” do not constitute, and should be distinguished from, references to “contingent resources” and “reserves”.
This presentation includes oil and gas metrics including “cash margin netback”, “taxation netback”, “operating cash flow netback”, “cash taxes”, “EBITDA netback” and “profit netback”. Such metrics do not have a standardized meaning under IFRS or otherwise, and as such may not be reliable. This information should not be used to make comparisons.
“Cash margin netback” is calculated on a per boe basis as oil and gas sales, less operating, tariff/transportation and production tax expenses. Netback is a common metric used in the oil and gas industry and is used by management to measure operating results on a per boe basis to bet-ter analyze performance against prior periods on a comparable basis.
“Taxation netback” is calculated on a per boe basis as current tax charge/credit less deferred tax charge/credit. Taxation netback is used to measure taxation on a per boe basis.
“Operating cash flow netback” is calculated as cash margin netback less cash taxes. Operating cash flow netback is used to measure operating results on a per boe basis of cash flow.
“Cash taxes” is calculated as taxes payable in cash, and not only for accounting purposes. Cash taxes is used to measure cash flow.
“EBITDA netback” is calculated as cash margin netback less general and administration expenses. EBITDA netback is used by management to measure operating results on a per boe basis.
“Profit netback” is calculated as cash margin netback less depletion/depreciation, general and administration expenses and financial items. Profit netback is used by management to measure operating results on a per boe basis.
BOEs may be misleading, particularly if used in isolation. A BOE conversion ratio of 6 thousand cubic feet (Mcf) per 1 barrel (bbl) is based on an energy equivalency conversion method primarily applicable at the burner tip and does not represent a value equivalency at the wellhead. As the value ratio between natural gas and crude oil based on the current prices of natural gas and crude oil is significantly different from the energy equivalency of 6:1, utilizing a 6:1 conversion basis may be misleading as an indication of value.
CurrencyAll dollar amounts in this presentation are expressed in United States dollars, except where otherwise noted. References herein to USD mean United States dollars. References herein to CAD mean Canadian dollars.
28