international journal of marketing & financial management ... issu… · international journal...
TRANSCRIPT

International Journal of Marketing & Financial Management, Volume 2, issue 4, May-2014, pp 07-19
7 | P a g e
International Journal of
Marketing & Financial
Management (IJMFM)
ISSN: 2348 –3954 (Online)
ISSN: 2349 –2546 (Print)
Available online at : http://www.arseam.com/content/volume-
2issue-4-may-2014
Email us: [email protected]
Instructions for authors and subscription information:
http://www.arseam.com/
A DIAGNOSTIC ANALYSIS OF A SELECTED DERIVATIVE MARKET WITH
SPECIAL REFERENCE TO UDAIPUR, INDIA
Dr.Yogesh Jain
Assistant Professor
Pacific Institute of Management & Technology, Pacific University, Udaipur, India.
Abstract
The past decade has witnessed the multiple growths in the volume of international trade and business due to the wave of
globalization and liberalization all over the world. As a result, the demand for the international money and financial
instruments increased significantly at India level. Capital market investment avenues are perceived to be risky by the
investors. But the younger generation investors are willing to invest in capital market instruments and that too very highly
in Derivatives segment. Even though the knowledge to the investors in the Derivative segment is not adequate, they tend
to take decisions with the help of the brokers or through their friends and were trying to invest in this market. This study
was undertaken to find out the awareness level of various derivative market instruments and also to find out their risk
preference in various segments. This study Intends to find out the preference level of investors on various derivative
market instruments, to find out the type of risk which are considered by the investors to find out the ways through which
the investors on various minimizes their risk to find out the preferences of Investors in derivatives market. About 50
samples were collected from Udaipur city from various investors through a structured questionnaire and investors were
asked questions regarding awareness about derivatives and the investor risk preference in an elaborate manner within a
short span of one month, derivatives trading in Udaipur, India has surpassed cash segment in terms of turnover and
number of traded contracts.
Keywords: Derivatives, Forward, Futures, Options, Swaps, Risk management, Exchange rate, National stock exchange,
Bombay stock exchange, Notional value underlying asset.
International Journal of Marketing & Financial Management, Volume 2, issue 4, May-2014, pp 07-19
8 | P a g e
1. Introduction
Indian capital markets have been receiving global attention, especially from sound investors in India due
to the macroeconomic fundamentals. In the recent past the Indian securities market has been
multifaceted growth in terms of the product traded in the market, viz.equities and bonds issued by the
government and companies, futures on benchmark indices as well as stocks and futures on interest rate
products such as notional 91-day T-bills, 10-year notional zero coupon bond, and 6% notional 10-year
bond. The past decade has witnessed the multiple growths in the volume of international trade and
business due to the wave of globalization and liberalization all over the world. As a result, the demand for
the international money and financial instruments increased significantly at the global level. The amount
raised from the market, number of stock exchanges and other intermediaries, the number of listed stocks,
market capitalization, trading volumes and turnover on stock exchanges, and investor population.
The securities market has witnessed a superfluity of reforms which have refined the micro market
structure, modernized operation and broadened investment choice for investors. Derivatives are new class
of investment invention which offers sophisticated management of risk. Financial markets are
characterized by a high degree of volatility. Derivative product are used to contain the risk arising out of
the fluctuations in asset price, which partially or fully transfer price risk by locking in asset prices,
derivative invention initially emerged as hedging devices against fluctuations in commodity prices.
Financial derivatives came into the spotlight only in the 1970s. In India, trading in derivatives
commenced in June 2000 with index futures on NSE. The market regulator Securities and Exchange
Board of India (SEBI), has been taking active steps to increase liquidity in the available contracts to make
the market more robust and viable for all kinds of investors. The derivative products that are available in
India are index futures, index options, stock futures and stock options. The SEBI has permitted derivative
segments in only two stock exchanges that is (NSE) and (BSE), and their clearing corporation/house to
commence trading and settlement in approved derivative contract. There are three broad categories of
participants, hedger, speculator and arbitrageur. In this respect, change in exchange rates, interest rates
and stock prices of different financial markets have increased the financial risk to the corporate world.
Adverse changes have even threatened the very survival of business world. It is, therefore, to manage
such risk, the new financial instruments have been developed in the financial markets, which are also
popularly known as financial derivatives, and the basic purpose of these instruments is to provide
commitments to prices for future dates for giving protection against adverse movements in future prices,
in order to reduce the extent of financial risks. In India, the emergence and growth of derivatives market
is relatively a recent phenomenon. Since its inception in June 2000, derivatives market has exhibited
exponential growth both in terms of volume and number of contract traded. The market turnover has
grown from Rs.2365 Cr. in 2000-2001 to Rs.16807782.22 Cr. in 2012-13.

International Journal of Marketing & Financial Management, Volume 2, issue 4, May-2014, pp 07-19
9 | P a g e
Derivative Markets serves as risk reducing tool. It promotes economic efficiency by directing funds from
those who do not have an immediate use for these funds to those who are in need of funds. It also
channels money provided by savers and depository institutions to borrowers and investees through a
variety of derivative instruments like future options, forward and swap.
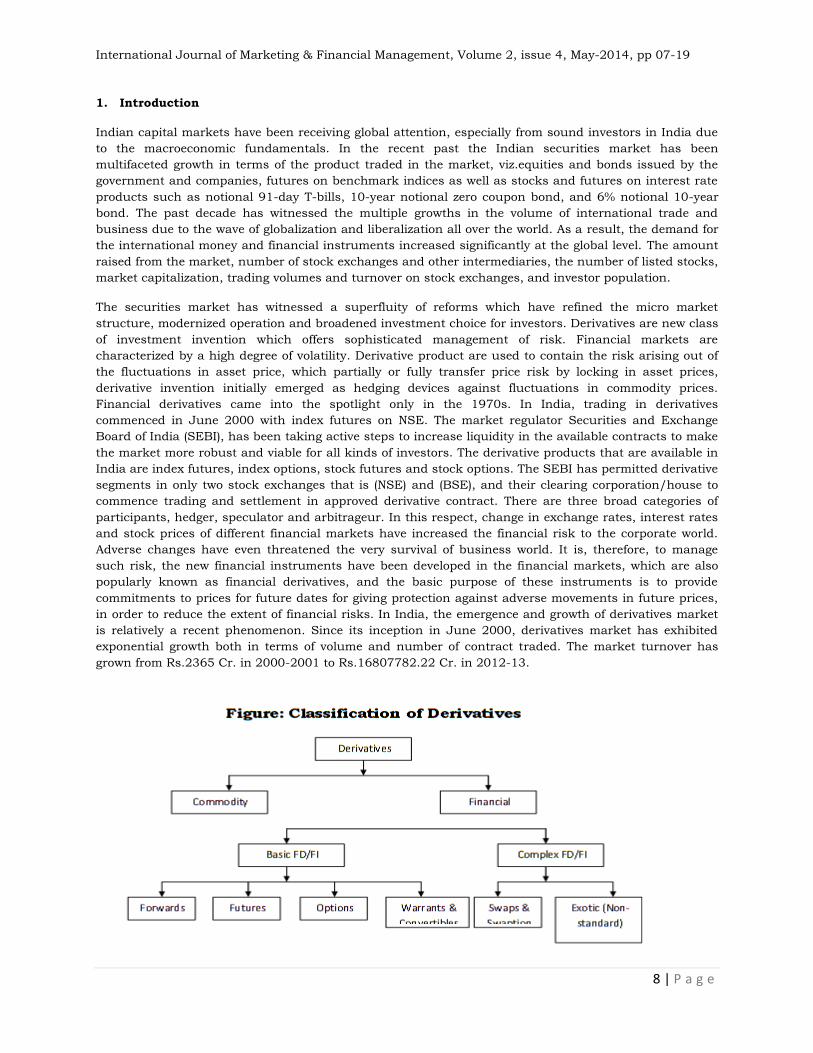
2. Growth of Indian derivatives market
The NSE and BSE are two major Indian markets have shown a remarkable growth both in terms of
volumes and numbers of traded contracts. Introduction of derivatives trading in 2000, in Indian markets
was the starting of equity derivative market which has registered on explosive growth and is expected to
continue the same in the years to come. NSE alone accounts 99% of the derivatives trading in Indian
markets. Introduction of derivatives has been well received by stock market players. Derivatives trading
gained popularity after its introduction in very short time.
If we compare the business growth of NSE and BSE in terms of number of contracts traded and volumes
in all product categories with the help of table no.4, table no.5 and table no.12 which shows the NSE
traded 636132957 total contracts whose total turnover is Rs.16807782.22 cr in the year 2012-13 in
futures and options segment while in currency segment in 483212156 total contracts have traded whose
total turnover is Rs.2655474.26 cr in same year. In case of BSE the total numbers of contracts traded are
150068157 whose total turnover is Rs.3884370.96 Cr in the year 2012-13 for all segments. In the above
case we can say that the performance of BSE is not encouraging both in terms of volumes and numbers
of contracts traded in all product categories.
3. Review of Literature
Avadhani (2000) Innovative financial instruments have emerged to protect against hazards, these include
Future and Options, which are the most dominant forms of financial derivatives, since such volatility and
associated disasters cannot be washed away. They are called derivatives because their values are derived
from an underlying primary financial instrument, commodity or index, such as interest rates, exchange
rates, commodities and equities. A derivative provides a mechanism, which market participants use to
hedge their position against the adverse movement of variables over which they have no control.
Sahoo (1997) opines “Derivatives produce initially emerged, as hedging devices against fluctuation in
commodity prices and commodity-linked derivatives remained the sole form of such products for many
years.” The factors generally attributed as the major driving force behind growth of financial derivatives
are:
International Journal of Marketing & Financial Management, Volume 2, issue 4, May-2014, pp 07-19
10 | P a g e
• Increased volatility in asset prices in financial markets.
• Increased integration of financial markets with the international markets.
• Market improvement in facilities of communication and a sharp decline in costs.
• Providing economic agents a wider choice of risk management strategies through development of more
sophisticated risk management tools.
• Optimally combining the risks and returns over a large number of financial assets, leading to higher
returns, reduces risk as well as transaction cost as compared to individual financial assets by innovations
in the derivative markets.
Bose, Suchismita conducted research on “The Indian Derivatives Market Revisited” in the year 2006.
They found that Derivatives products provide certain important economic benefits such as risk
management or redistribution of risk away from risk-averse investors towards those more willing and able
to bear risk. Derivatives also help price discovery, i.e. the process of determining the price level for any
asset based on supply and demand. These functions of derivatives help in efficient capital allocation in
the economy; at the same time their misuse also poses a threat to the stability of the financial sector and
the overall economy.
Routledge, Bryan and Zin, Stanley E of Carnegie Mellon University conducted research on “Model
Uncertainty and Liquidity” in year 2001. Extreme market outcomes are often followed by a lack of
liquidity and a lack of trade. This market collapse seems particularly acute for markets where traders rely
heavily on a specific empirical model such as in derivative markets. In this paper captured model-
uncertainty explicitly using an Epstein-Wang (1994) uncertainty-averse utility function with an
ambiguous underlying asset-returns distribution. To explore the connection of uncertainty with liquidity,
specify a simple market where a monopolist financial intermediary makes a market for a proprietary
derivative security. The market-maker chooses bid and ask prices for the derivative, then, conditional on
trade in this market, chooses an optimal portfolio and consumption.
Dheeraj Mishra, R Kannan and Sangeeta D Mishra (2006), tried to find out the spot - future parity
relationship in case of index futures in the Indian stock market. NSE Nifty has been chosen as underlying
asset. It also aims at exploring different factors responsible for the violation of spot-future parity
relationship. It was found that there exists a theoretical relationship between spot, futures and other
relevant variables as dividend yield, maturity etc. the paper also aimed at finding out whether there exists
an arbitrage profit due to violation of spot future. It was found that arbitrage profits are higher for far
month future contracts than for near month future contracts. Arbitrage profits are more for undervalued
future markets than overvalued future markets.
Sen Shankar Som and Ghosh Santanu Kumar (2006) studied the relationship between stock market
liquidity and volatility and risk. The paper also deals with time series data by applying “Cochrane Orchutt
two step procedures”. An effort has been made to establish a relation between liquidity and volatility in
this paper. It has been found that here is a statistically significant negative relationship between risk and
stock market liquidity. Finally it is concluded that there is no significant relationship between liquidity
and trading activity in terms of turnover.
Shenbagraman (2004) reviewed the role of some non-price variables such as open interests, trading
volume and other factors, in the stock option market for determining the price of underlying shares in
cash market. The study covered stock option contracts for four months from Nov. 2002 to Feb. 2003
consisting 77 trading days. The study concluded that net open interest of stock option is one of the
significant variables in determining future spot price of underlying share. The results clearly indicated
that open interest based predictors are statistically more significant than volume based predictors in
Indian context. The following exhibit gives the snapshot view of the results of studies on volatility effect of
Stock Index Futures.

International Journal of Marketing & Financial Management, Volume 2, issue 4, May-2014, pp 07-19
11 | P a g e
Masih AM, Masih R, Quarterly Review of Economics and Finance, 2007, Volume: 37, Page: 859-
885, “Global Stock Futures: A Diagnostic Analysis of a Selected Emerging and Developed Markets with
Special Reference to India”, Tools used: correlation coefficients, granger’s causality test, augmented Dicky
Fuller test (ADF), Elliott, Rothenberg and Stock point optimal test. The Authors, through this paper, have
tried to find out what kind of relationship exists between emerging and developed futures markets of
selected countries.
Kumar Dr. R. & Chandra Abhijeet, “Individual Investor’s Sentiments and Asset Pricing” June 2000
Individuals often invest in securities based on approximate rule of thumb, not strictly in tune with market
conditions. Their emotions drive their trading behavior, which in turn drives asset (stock) prices. Investors
fall prey to their own mistakes and sometimes other’s mistakes, referred to as herd behavior. Markets are
efficient, increasingly proving a theoretical concept as in practice they hardly move efficiently. The purely
rational approach is being subsumed by a broader approach based upon the trading sentiments of
investors. The present paper documents the role of emotional biases towards investment (or
disinvestment) decisions of individuals, which in turn force stock prices to move.
Srivastava Sandeep, Yadav Surendra S, Jain P K, “Derivative Trading in Indian Stock Market:
Brokers Perception”, September, 2008, Volume 20, Number 3 Review. The issues covered in the survey
included: a) perception of brokers about the attractiveness of different derivative securities for
clients; b) profile of clients dealing in derivative securities; c) popularity of a particular derivative
security out of the total set; d) different purposes for which the clients are using these
securities in order of preference; e) issues concerning derivative trading; f) reasons for non usage
of derivatives by some investors and g)pricing, liquidity and informational efficiency of the
derivative market. Derivative securities have penetrated the Indian stock market and it emerged
that investors are using these securities for different purposes, namely, risk management, profit
enhancement, speculation and arbitrage.
Naresh Gopal, University of Madras, “Views of the Market Participants on Trading, Regulations in the
Derivatives Market”, Indian Institute of Capital Markets 9th Capital Markets Conference Paper, January
25, 2006, the dynamic growth of the Derivatives market, particularly Futures & Options and the
perceived risks to the financial sector, continue to stimulate debate on the proper regulation of these
instruments. Even though this market was initially fuelled by various expert teams survey, regulatory
framework, recommendations byelaws and rules there is still a debate on the existing regulations such as
why is regulation needed? When and where regulation needed? What are reasonable and attainable goals
of these regulations? Therefore this article critically examines the views of market participants on the
existing regulatory issues in trading Derivative securities in Indian capital market conditions.
4. Research Methodology
Questionnaire method of sampling is used to collect the data from 50 respondents who are the clients of
various broking houses of Udaipur. Percentage analysis & Correlation Tools used for analysis
4.1 Statement of the problem
Derivative are new segment of secondary market operation in India so investors need to understand the
complex nuance of this trade and to make profit in derivatives trading this is not reached to small
investor. Technological enablement and rapid growth of derivative market since the new economic policy
of 1991 has given more importance to investors. Investor behaviour also tend to move into savings to
investment, More number of brokers also entered into the capital market due to the liberalized regulation
in capital market. Brokers are providing number of services under single umbrella to the investors based
on their need. So, this study aims to discover that how these services are perceived by the investors and
how these services are utilized by the investors.
4.2 Objectives of the study

International Journal of Marketing & Financial Management, Volume 2, issue 4, May-2014, pp 07-19
12 | P a g e
To find out influencing investors’ perception towards investment decision on derivatives market.
To study Investors objective and preferred type of instrument
To identify Investors opinion on derivative market
To study the Factors influence trade in derivative instrument
5. Data Analysis & Inferences Derived
Table 5.1: Perceptions of The Investor in Derivative Market
Male 36
Female 14
Graph 5.1: Perceptions of the Investor in Derivative Market
Interpretation: It is found that out of 50 investor respondents 36 i.e.72% were male and 14 i.e.28% were
female which shows that generally male investors are more in numbers.
Table 5.2: Monthly Income
Less than 10000 8
10000-20000 15
20000-30000 12
30000-40000 10
40000 & above 5
International Journal of Marketing & Financial Management, Volume 2, issue 4, May-2014, pp 07-19
13 | P a g e
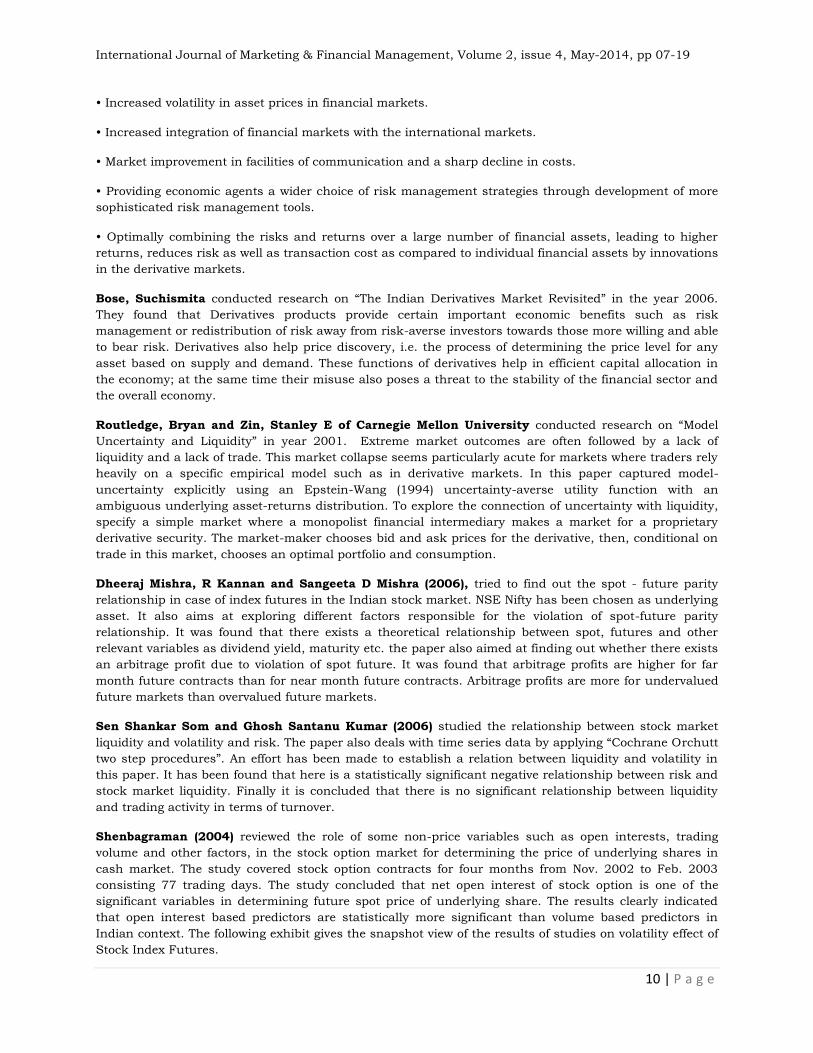
Graph 5.2: Monthly Income
Interpretation: It is found that investors from lower and medium income group are more in numbers (
income less than10000 (16%), range 10,000-30000 were almost 50% of total investors and in higher
income groups almost 30% investors were there.
Table 5.3: Investment avenue you prefer most to invest your savings
Bank Deposit 5
National Saving Certificate 5
Shares 5
Debentures 5
Bonds 5
Real Estate 3
Commodity 2
Derivatives 8
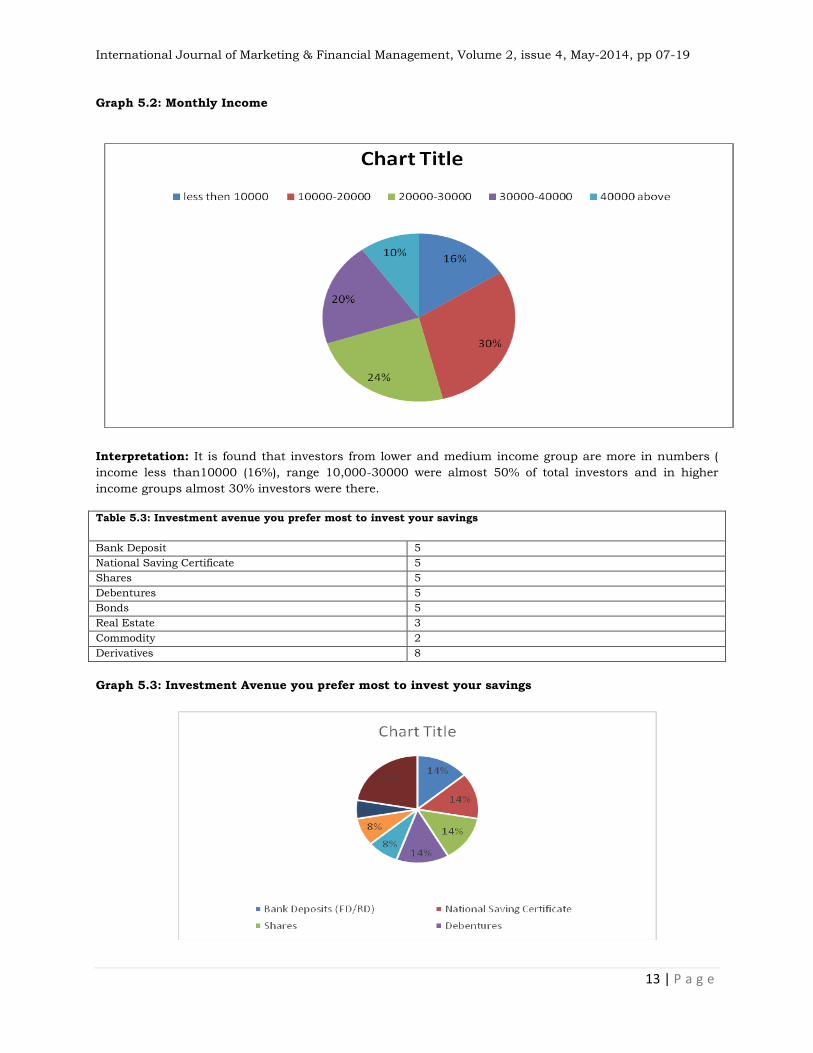
Graph 5.3: Investment Avenue you prefer most to invest your savings
International Journal of Marketing & Financial Management, Volume 2, issue 4, May-2014, pp 07-19
14 | P a g e
Interpretation: when preferred investment avenue asked from investors 16 % of the investors prefer to
invest in derivative market and rest all avenue were equally divided. Real estate and commodity are less
preferred investment avenues.
Table 5.4:How did you come to know derivative market
Advertisements 26
Financial Advisor 6
Friends/Relatives 15
Others 6
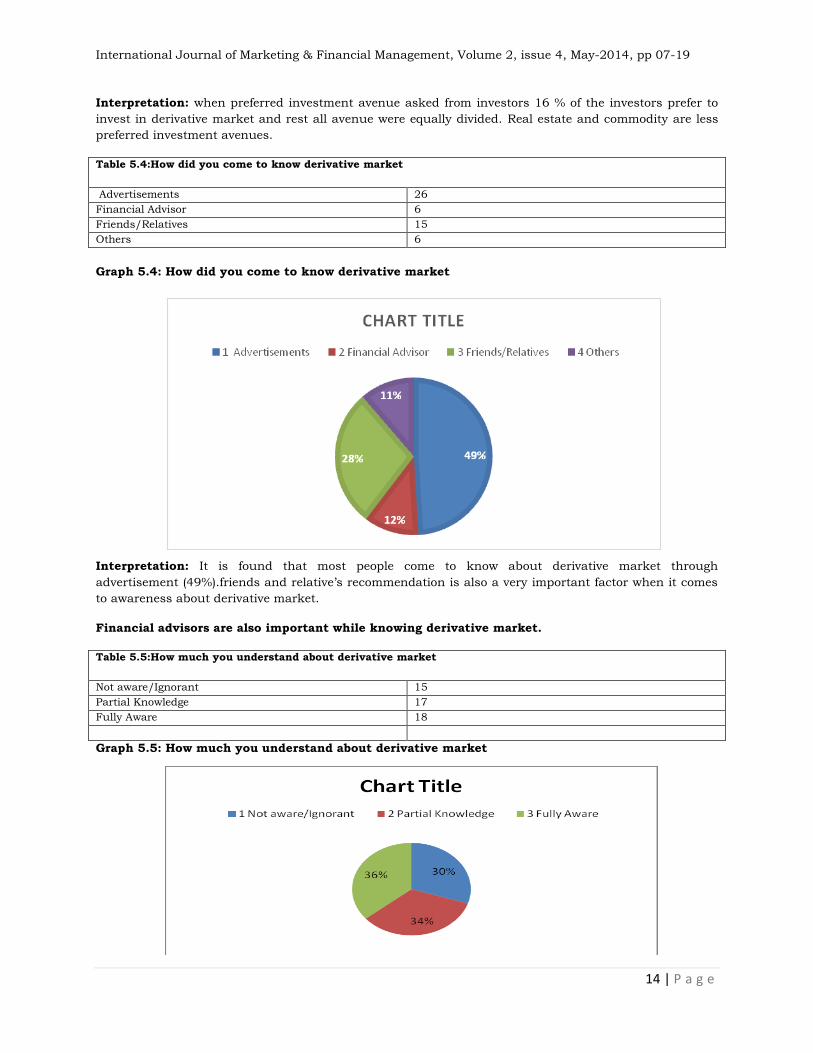
Graph 5.4: How did you come to know derivative market
Interpretation: It is found that most people come to know about derivative market through
advertisement (49%).friends and relative’s recommendation is also a very important factor when it comes
to awareness about derivative market.
Financial advisors are also important while knowing derivative market.
Table 5.5:How much you understand about derivative market
Not aware/Ignorant 15
Partial Knowledge 17
Fully Aware 18
Graph 5.5: How much you understand about derivative market

International Journal of Marketing & Financial Management, Volume 2, issue 4, May-2014, pp 07-19
15 | P a g e
Interpretation: When asked about investors understanding of derivative market it seems that 30%
investors are still not understands about derivatives ,34% investors are having partial knowledge about
derivatives and 36% investors well understands the derivative market.
Table 5.6: Which of the following Derivative instruments do you deal in?
Derivative instruments user
Options
18
Future 11
Forward 16
Swaps 5
Graph 5.6: Which of the following Derivative instruments do you deal in?
Interpretation: It is found that 36% of the investors are dealing and interested in options, interested in
forward 32%, interested in future 22% and 9% interested in swaps.
It is found that most of the investors dealing with options and forward.
Table 5.7: How much percentage of your income you trade in Derivative market?
Don’t trade 13
Less than 5% 2
5%-10% 15
11%-15% 12
16%-20% 8
Interpretation: It is found that 30% of the investor respondents are investing almost 5-10% of their
income in derivatives. 16% of the investors are investing 16-20% of their income in derivatives and there
are almost 26% of them are not investing from their income.

International Journal of Marketing & Financial Management, Volume 2, issue 4, May-2014, pp 07-19
16 | P a g e
Graph 5.7: How much percentage of your income you trade in Derivative market?
Table 5.8: Level of satisfaction
Satisfaction level Users
Satisfy
33
Highly Satisfy 2
Not Satisfy 9
Graph 5.8: Level of satisfaction
Interpretation: It is found that 75% of the investors who are investing into derivatives are satisfied with
their investment. Only 5% of the derivative investors are highly satisfies and 20 % of the derivative
investors are dissatisfied with their investment.

International Journal of Marketing & Financial Management, Volume 2, issue 4, May-2014, pp 07-19
17 | P a g e
Table 5.9 Services of the stock broker
Good 30
Bad 20
Graph 5.9: Services of the stock broker
Interpretation: It is found that 60% of the derivative investors are satisfied with the services from the
stock broker and 40% of the investors are not satisfied with the services from the stock brokers.
5.10 Using Correlation on the factors like age & Investment Avenue
Correlation Table 5.10
S.No. Variables Correlation
1 Age and Investment Avenue 0.72362723
2 Gender and Investment Avenue 0.51706974
3 Income and Investment Avenue 0.85048507
4 Income and percentage of your income 0.83308741
Interpretation
Using correlation to check the that the our data is accurate or not so we take to difference between two
variables like age and investment avenue and then find out the correlation and the correlation between
age and investment avenue is 0.72 and rules of correlation says that when the is +1 correlation or when
value of correlation is more than +.50 then it will be highly correlated so that our interpretation that our
data is highly correlated and it will be positive correlation and varying in same direction

International Journal of Marketing & Financial Management, Volume 2, issue 4, May-2014, pp 07-19
18 | P a g e
Table 5.11
S.No.
Variables
Correlation of 95% confidence
interval Correlation
1 Age and Investment Avenue Highly correlated 0.72362723
2 Gender and Investment
Avenue
Highly correlated
0.51706974
3 Income and Investment
Avenue
Highly correlated
0.85048507
4 Income and percentage of
your income
Highly correlated
0.83308741
5.12 Using Variance on the Factors like age and Investment Avenue etc.
Table 5.12
S.No Variable Variance is measure
dispersion
Variance
1 Age and factors affect 45% 1.64525612
2 Gender and factors affect 46% 1.66966592
3 Income and factors affect 48% 1.69305122
Interpretation
Using Variance to check the that the our data is accurate or not so we take to difference between two
variables like age and Scale based and then find out the variance and the between age and factors affect
is 1.64 and that variance is measure dispersion is 45% and second is gender and factors affect variance is
1.66 and that variance is measure dispersion is 46%
And third variable is Income and factors affect variance is 1.69 and that variance is measure dispersion is
48%.
6. Conclusion
After going through the study of investor perception for investment in derivatives market, some wrathful
results were found out in the light of awareness. In this study derivative market is dominated by male
investor with an age group of 31-40.
Investor rejected that they are not affected by spot market movement and even excess return does not
affect their decision of investment in derivatives. In study the factor “broker feel problem in providing
suggestions about derivative trading” but it was found that they are interested in providing suggestions
about derivative trading.
In the study, it was found that derivatives are used as risk Hedging tool and the trend of the spot market
affects the trading of Derivatives. But an interesting fact to note down here is that around 80 % of out of
the overall amount invested is in derivative market and rest in the cash market. It clearly signifies that
the most of the amount is for speculation and not for hedging. In study, investor perception about
derivative is influenced by the popularity of stock and also affected by the trading of FII and movement in
International market. Most of them (30%) invested about 5-10% of their income on investments and only
16% invested more than 20% of their income on investments. Respondents perceived that Market Risk
and Credit risk are the two major risk observed in capital markets.
Investor has enormous scope for current earnings and capital appreciation in incipient market like India.
But this can be possible only if the elements like trust, guidance and regulations were exists progressively
in the derivatives market among the brokers and investors. Now brokers have access to the best
technique and tools due to technological developments and globalization, like, online trading software,

International Journal of Marketing & Financial Management, Volume 2, issue 4, May-2014, pp 07-19
19 | P a g e
online derivatives market information, etc. They should make the best use of the opportunities created by
reforms and prizefight competitively on the issues affecting them. Moreover, they should make a
uninterrupted interaction with the existing and proposed clients to attract more investors towards the
derivatives market. Financial derivatives have earned a well deserved and extremely significant place
among all the financial instruments (products), due to innovation and revolutionized the landscape.
Derivatives are tool for managing risk. Derivatives provide an opportunity to transfer risk from one to
another. Launch of equity derivatives in Indian market has been extremely encouraging and successful.
The growth of derivatives in the recent years has surpassed the growth of its counterpart globally.
The Notional value of option on the NSE increased from 1195.691178 lakhs USD in 2003 to 354648.1941
lakhs USD in 2012 and notional value of NSE futures increased from 14329.35627 lakhs USD in 2003 to
39228.38563 lakhs USD in 2012. India is one of the most successful developing countries in terms of a
vibrate market for exchange-traded derivatives. The equity derivatives market is playing a major role in
shaping price discovery. Volatility in financial asset price, integration of financial market internationally,
sophisticated risk management tools, innovations in financial engineering and choices at risk
management strategies have been driving the growth of financial derivatives worldwide, also in India.
Finally we can say there is big significance and contribution of derivatives to financial system.
References
B. Brahmaiah and Rao P. Subba, "Financial futures and option", 1st ed., Himalaya Publishing House, New Delhi, 1998,
PP.25-147.
Chaturvedula Chakrapani Venkata IBS Hyderabad, “Price Effects of Introduction of Derivatives: Evidence from India”,
The Icfai University Journal of Applied Economics, Vol. VII, No. 5, pp. 5975, September 2008.
D. Vasant, "The Indian financial system and development", 4th ed., Himalaya Publishing House, New Delhi, 2012,
PP.398-412, 645-677.
Hull John.C., “Options, Futures and others Derivative”, Sixth Edition and Third Impression 2007
Masih A.M., Masih R, “Global Stock Futures: A Diagnostic Analysis of a Selected Emerging and Developed Markets
with Special Reference to India”, Quarterly Review of Economics and Finance, 2007, Volume: 37, Page: 859-885.
M. Gurusamy, and J. Sachin, "Financial derivatives", 1st ed., Ramesh Book Depot, New Delhi, 2009-10, PP.1.01-5.10.
M. Ranganatham and R. Madhumathi, "Security analysis and portfolio management", 1st ed., Pearson education, New
Delhi, 2011, PP.723-730.
Rao Ramana, “Impact of Financial Derivative Products on Spot Market Volatility: A Study on Nifty”, T.A. Pai
Management Institute, Icfai Journal of Derivatives Markets, Vol. IV, No. 1, pp. 716, January 2007
R.P. Rustagi, "Investment analysis and portfolio management", 1st ed., Sultan Chand & Sons, New Delhi, 2007,
PP.459-596
S. Kevin, "Security analysis and portfolio management", 6th Pr., PHI Learning Private Ltd., New Delhi, 2009, PP.232-
270
S.S.S. Kumar, "Financial derivatives", 2nd Pr., PHI Learning Private Ltd., New Delhi, 2008, PP.1-27, 57-306
S.L. Gupta, "Financial derivatives", 6th Pr., PHI Learning Private Ltd., New Delhi, 2009, PP.3-551
V.A. Avadhani, "Security analysis and Portfolio management", 10th ed., Himalaya Publishing House, New Delhi,
PP.222-231, 251-256
Asia-Pacific Business Review, Vol. 3, No. 1, pp. 67-90, January-June 2007.
Sarkar Asani, “Indian Derivatives Market”, The Oxford companion to economics in India, 2006