international journal of machine tools & manufacture · pulse train data analysis to...
TRANSCRIPT

International Journal of Machine Tools & Manufacture 50 (2010) 775–788
Contents lists available at ScienceDirect
International Journal of Machine Tools & Manufacture
0890-69
doi:10.1
n Corr
fax: +9
E-m
journal homepage: www.elsevier.com/locate/ijmactool
Pulse train data analysis to investigate the effect of machining parameterson the performance of wire electro discharge turning (WEDT) process
V. Janardhan, G.L. Samuel n
Manufacturing Engineering Section, Department of Mechanical Engineering, Indian Institute of Technology Madras, Chennai 600036, India
a r t i c l e i n f o
Article history:
Received 2 December 2009
Received in revised form
19 May 2010
Accepted 21 May 2010Available online 10 June 2010
Keywords:
Wire electro discharge turning
Pulse train analysis
Material removal rate
Surface roughness
Roundness error
55/$ - see front matter & 2010 Elsevier Ltd. A
016/j.ijmachtools.2010.05.008
esponding author. Tel.:+91 44 22574699 (O)
1 44 2257 4652.
ail addresses: [email protected], samuelgl@
a b s t r a c t
This paper aims at giving an insight into the wire electro discharge turning (WEDT) process, by
analyzing the effect of machining parameters on material removal rate (MRR), surface roughness and
roundness error, using the pulse train data acquired at the spark gap. To achieve this objective a simple
and cost effective spindle is developed for the WEDT process. Pulse train data are acquired with a data
acquisition system developed in the present work. A pulse discrimination algorithm has been
developed for classifying the discharge pulses into open circuit, normal, arc and short circuit pulses.
With the help of algorithm the number of arc regions, average ignition delay time, the width of the
normal and arc regions in the data acquired can also be obtained. It has been observed that the rotation
of the workpiece has significant influence on the type of the discharges occurring at the spark gap.
Preliminary experiments conducted to compare the WEDM and WEDT processes disclosed that MRR is
less in WEDT and the number of arcs and arc regions are more in WEDT. It has been observed that the
surface roughness and roundness error of the WEDT components are influenced by the occurrence of
arc regions, width of arc and normal discharge regions and average ignition delay time.
& 2010 Elsevier Ltd. All rights reserved.
1. Introduction
The electrical discharge machining (EDM) technology hasdeveloped rapidly in the recent years and become important inprecision manufacturing applications like die and mould making,micro machining, etc. Wire electrical discharge machining(WEDM) is a modified electrical discharge technique used formanufacturing components with intricate shapes and profiles,with the help of a numerically controlled travelling wireelectrode. Material is eroded from the workpiece by a series ofdiscrete sparks between the workpiece and the wire electrode(tool) separated by a thin film of dielectric fluid. Because of itswide capabilities it has applications in various fields such asautomobile, aerospace, medical and virtually all areas ofconductive materials machining [1]. Turning with WEDM is oneof the emerging areas, developed to generate cylindrical form onhard and difficult to machine materials by adding a rotary axis toWEDM.
Several researchers have contributed to the development ofthe wire electrical discharge turning (WEDT). Masuzawa andTonshoff [2] reported turning of small diameter pins of size 5 mmusing WEDM. Qu et al. [3] turned automobile components like
ll rights reserved.
, +91 44 22576699 (R);
yahoo.com (G.L. Samuel).
diesel injector plungers with WEDM. Takayuki et al. [4] machinedarbitrary shapes on insulating ceramics. Rhoney et al. [5] truedmetal bonded diamond wheels with WEDM. However the draw-back of the WEDT process compared to conventional turning onlathe is that the maximum depth of cut in a single pass is limitedby the wire diameter in WEDT process.
Efforts have been made to study the characteristics of theWEDT process with various machining parameters. Qu et al. [3]mathematically modeled the material removal rate (MRR), andcompared MRR for WEDM and WEDT. The author observed thatMRR in case of WEDT is more compared to that of WEDM.Mohammadi et al. [6] developed a mathematical relation betweenmachining parameters on MRR using regression analysis andreported that power, voltage and servo voltage are the mostsignificant parameters affecting the MRR and also mentioned thatrotational speed and servo voltage have inverse effect on MRR. Itis also mentioned that wire speed and pulse off time have noeffect on MRR. Haddad and Tehrani [7] developed a mathematicalrelation between the machining parameters and MRR usingresponse surface methodology and observed that power, voltage,pulse off time and rotational speed have much effect on MRR;however the pulse off time and rotational speed are reciprocallyproportional to MRR.
The effect of machining parameters on surface roughness androundness of the parts turned using WEDT is also carried out byseveral researchers. Qu et al. [8] developed a mathematical modelfor arithmetic average surface roughness in WEDT. The authors

Nomenclature
Vt, Va voltage threshold values for detecting ignition delayand non-ignition delay pulses, respectively (V)
It current threshold value (A)tpc pulse classification time interval (ms)tf discharge duration (ms)to pulse off time (ms)tc, tv sampling time corresponding to current and voltage
threshold crossing point (ms)Vf wire feed rate (mm/min)K, L sampling points in the rising direction, K¼{k1, k2, y,
Ki, y, Kn} prior to and L¼{l1, l2, y, li, y, ln} after thevoltage threshold level
M, N sampling points in the falling direction, M¼{m1,m2, y, mi, y, mn} prior to and N¼{n1, n2, y, ni, y,nn} after the voltage threshold level
O, P sampling points in the rising direction, O¼{o1, o2, y,oi, y, on} prior to and P¼{p1, p2, y, pi,y, pn} after thecurrent threshold level
Q, R sampling points in the falling direction, Q¼{q1,q2, y, qi, y, qn} prior to and R¼{r1, r2, y, ri, y, rn}after the voltage threshold level
D1 initial diameter of the workpiece (mm)D2 diameter of the workpiece after machining (mm)w Kerf width (mm)t thickness of the workpiece (mm)
V. Janardhan, G.L. Samuel / International Journal of Machine Tools & Manufacture 50 (2010) 775–788776
found that shorter pulse on time and lower feed rate createdbetter surface finish and roundness. Haddad and Tehrani [9]modeled the surface roughness and roundness with machiningparameters using response surface methodology for AISI D3 steel.The authors reported that power is directly proportional toarithmetic average surface roughness Ra, pulse off time androtational speed have inverse effect on surface roughnessparameter Ra. When the rotational speed is increased, theroundness error decreased greatly and it increased whenthe power and voltage are high. Mohammadi et al. [10] studiedthe variation in surface finish and roundness of the parts withmachining parameters by developing a mathematical model usingregression analysis. The authors reported that power hassignificant effect on surface roughness and the parameters power,wire speed and servo voltage on roundness are more significantthan pulse off time, voltage and rotational speed. The MRR andsurface finish depends on the discharge energy [11] and the typeof the discharges occurring at the spark gap. Pulse train studiesreveal typical characteristics of the discharges occurring at thespark gap [12].
Pulse train analysis includes the classification of the differenttypes of discharges occurring at the spark gap. Several researchershave studied the classification of pulses. Dauw et al. [13] classifiedthe discharge pulses in EDM into fifteen types with the help ofvoltage and time reference levels. Watanabe et al. [14] classifiedthe discharge pulses into three categories: normal, deion and arcaccording to the discharge profile, to monitor and control WEDM.This method is used for offline process optimization. Yan and Liao[15] discriminated the pulses into normal and arc pulses based onignition delay as sensing parameter to prevent wire rupture inWEDM. Liao and Woo [16] developed a pulse discriminatingsystem to analyze the relationship between the machiningsettings and pulse trains in WEDM. Tarng et al. [17] classifiedthe pulses in EDM based on the features of the measured gapvoltage and gap current by using a fuzzy set theory. Yan and Chien[18] developed a computer-aided pulse discriminating andcontrol system based on the characteristics of the gap voltagewave form.
The exact mechanism of WEDT is not reported clearly in theliterature. The effect of rotational speed on roundness errorreported by different researchers is not in agreement. Theavailable literature regarding the WEDT mainly deals withstudying the effect of machining parameters with the help ofstatistical methods and mathematical models but the same wasnot studied with respect to pulse trains. It is useful in providing aclear description about the variation in discharges occurring bythe rotation of the workpiece and to study the effect of machiningparameters on MRR, surface roughness and roundness error. To
study the performance of WEDT process with pulse trains a pulsediscrimination method for offline analysis is required. Most of thepulse discrimination methods discussed in the literature are usedfor online control of the EDM and WEDM process.
In the present work a cost effective spindle is fabricated tomeet the requirements of the WEDT process. The pulse train datais collected with the help of a pulse train data acquisition systemdeveloped. A pulse discrimination algorithm has been proposedbased on the voltage, current and time data obtained from dataacquisition system. With the pulse discrimination algorithm thepulses are classified into four types: open, normal (spark), arc andshort circuit pulses for off-line analysis of the WEDT character-istics. The effect of machining parameters such as pulse off-time,spark gap, servo feed, rotational speed and flushing pressure onMRR, surface roughness and roundness error is studied usingpulse train data analysis.
2. Development of WEDT spindle
The purpose of spindle is to give rotary motion to theworkpiece during discharge. Precision spindle is the key sub-system for cylindrical wire electro discharge turning process.Following are the basic requirements for the spindle:
�
Protection from flushing. � High current electrical connectivity to the ground. � Spindle rotational accuracy. � Work holding and flexibility. � Electrical insulation to the bearings: The bearing balls and racesmay get eroded during the discharge due to the smallclearance between them [5]. This will affect the rotationalaccuracy of the bearings.
Detailed explanation regarding each requirement is alsoavailable in [3].
The spindle has been fabricated to meet the requirementsmentioned earlier and with a minimum cost. The cross sectionalview of the bearing assembly is shown in Fig. 1(a). A straightshank ER11 collet adaptor had been modified and used as spindleshaft as shown in Fig. 1(a). The collet is locked with a nut asshown in Fig. 1(a). Generally electrical insulation to the bearingsis achieved by using ceramic ball bearings. However thesebearings are expensive; in the present work two sleeves madeof nylon are press fit into the spindle shaft and stainless steel deepgroove ball bearings are inserted over them as shown in Fig. 1(a).The housing is also made of nylon to provide electrical insulation

Fig. 1. Spindle for WEDT process: (a) cross sectional view of the bearing assembly, (b) spindle assembly and (c) components machined with the present setup.
Fig. 2. Block diagram of the pulse train data acquisition system.
V. Janardhan, G.L. Samuel / International Journal of Machine Tools & Manufacture 50 (2010) 775–788 777
to the bearings. Brass cylinder is inserted into the housing, toavoid damage of housing bore during the installation of bearingsand to improve rotational accuracy. Housing is provided withthreaded holes along its circumference for inserting carbon brushholder as shown in Fig. 1(a), and brush contact with the spindleshaft is adjusted with a screw as shown in Fig. 1(a). The realmodel of the spindle after assembling all the individualcomponents is shown in Fig. 1(b). Both the spindle shaft andthe motor shaft are connected by a Worm gear made of plastic forinsulation. The bearing assembly is fixed to the vertical face ofthe L-section. The motor is fixed to the base of the L-section. Thetotal spindle is covered with a casing made of acrylic plates toprotect from flushing. The runout of the spindle is checked usingcapacitance sensor and is found to be 5 mm on the spindle shaft.Components machined with the present spindle are shown inFig. 1(c).
3. Analysis of pulse train data
3.1. Pulse train data acquisition
Pulse train data include voltage and current waveforms acrossthe spark gap during machining. The variation in the dischargesoccurring at the spark gap due to addition of rotary axis is studiedusing pulse train analysis. A block diagram of pulse train data
acquisition system to obtain the spark gap voltage and currentwaveform is shown in Fig. 2. Current waveform is obtained bymeasuring the voltage drop across 75 mV/75 A shunt (resistance1 mO). The idea of using electrical shunt for measuring gapcurrent is reported by Murthy and Philip [19] and Gangadhar et al.[12]. Cathode ray oscilloscope is used to acquire voltage andcurrent waveforms. Pulse train data are collected during themachining for a duration of 100 ms at different parametersettings. Voltage and current pulse train data representingdifferent pulse types are shown in Fig. 3.

5.05 5.1 5.15 5.2 5.25x 10⁻³
-50
0
50
100
150
-40-20
020406080
100120
Gap
vol
tage
(V)
Gap
cur
rent
(A)
Fig. 3. Pulse train data with different types of discharge pulses.
Else
Else
Else
Yes
tpc< tf
tpc> to
tc < tv
Yes
Start
Input: Voltage, current, time data
Step:1 Detection of threshold crossing points of voltage andcurrent data for a given threshold value (Vt,It)
Step: 2 Determination of sampling time of threshold crossingpoints of voltage and current data
Pulse classification time interval (tpc)
Normal pulse
Open circuit pulse
Yes
End
Step: 3Classification of pulses for the input data
ni does not existafter o'i & tpc> to
Yes
No
Peak voltage<Va
Yes
NoArc
pulse
Shortpulse
Fig. 4. Flow chart for pulse classification.
V. Janardhan, G.L. Samuel / International Journal of Machine Tools & Manufacture 50 (2010) 775–788778

V. Janardhan, G.L. Samuel / International Journal of Machine Tools & Manufacture 50 (2010) 775–788 779
3.2. Pulse classification algorithm
The algorithm for classifying pulses is developed based on thedetection of threshold crossing points for voltage and current. Theflow chart for classifying different types of discharges is shown inFig. 4. Algorithm for pulse classification has been written usingMATLAB and the data obtained is processed using a personalcomputer. Various steps involved in the proposed algorithm forclassifying different types of discharges are explained in thissection.
3.2.1. Step 1: Finding the voltage and current threshold crossing
points
The voltage, current and time data from the data acquisitionsystem are input to the algorithm. Fig. 5 shows a sample of thegap voltage and current wave from on time scale. A thresholdlevel is given for both voltage (Vt) and current (It). Whenever thevoltage and current cross the threshold level, the correspondingsampling data point numbers prior to and after the threshold levelare stored. The up and down arrows in Fig. 5 indicate the risingand falling directions. The sampling data point numbers crossingthe voltage threshold level are stored in matrices K, L in the risingdirection and M, N in the falling direction. Similarly for thecurrent threshold level crossing points are stored in matrices O, Pand Q, R as shown in Fig. 5.
0
50
100
Gap
vol
tage
(V)
tf
Vt
nitpc<tf
3.2.2. Step 2: Detecting voltage, current and time corresponding to
threshold level crossing sampling points
The sampling times corresponding to the sampling data pointsstored in the matrices K, L, M, N and O, P, Q, R are obtained fromthe input data. The time corresponding to the sampling datapoints in matrices L and M are used to find the average ignitiondelay time of the pulses.
1 2 3
−50
−50
0
50
100
Time (µs)
Gap
cur
rent
(I)
tpc
It
tv tc
oi
Fig. 6. Detecting normal pulse.
3.2.3. Step 3: Classification of pulses
The classification of pulses is based on the time intervalbetween the voltage threshold crossing point in the matrix N andthe corresponding current threshold crossing point in the matrixO. ni represents the voltage threshold crossing point of ithelement of the matrix N. The time corresponding to ni isrepresented as tv and oi the current threshold crossing point ofthe ith element of matrix O. The time corresponding to oi isrepresented as tc. The time difference between tc and tv is noted aspulse classification time interval tpc (tpc¼tc�tv).
5 10 15 20 25
−50
0
50
100
−50
0
50
100
Time (µs)
Gap
vol
tage
(V)
Gap
cur
rent
(A)
N
L M
Q
RO
P
K
Vt
It
Fig. 5. Detection of voltage and current threshold crossing points for pulse
classification.
3.2.3.1. Detection of normal pulse. In case of normal pulse, currentdischarge occurs soon after the ignition delay time. The voltageand current threshold crossing points ni and oi occur before thedischarge completes. Then tpc will be less than discharge duration(tf) as shown in Fig. 6 (tpcotf).
3.2.3.2. Detection of open circuit pulse. In case of open circuitpulses, the current discharge does not occur. Then tpc is calculatedwith respect to the current threshold crossing point (oi) of thepulse occurring after the concerned open circuit pulse as shown inFig. 7. Since the successive pulse occurs only after pulse off time(to), tpc should be greater than pulse off time (tpc4to).
3.2.3.3. Detection of non-ignition delay pulse. In case of a non-ig-nition delay pulse ignition delay does not occur and voltagethreshold crossing point does not exist. There are two cases inoccurrence of non-ignition delay pulse in the input sample data.In the first case, if the non-ignition delay pulse occurs with anignition delay pulse after it as shown in Fig. 8(a), tpc is calculatedwith respect to the ignition delay pulse occurring just after theconcerned arc pulse. tpc will become negative since tcotv asshown in Fig. 8(a).
In the second case, there is no ignition delay pulse after thecorresponding non-ignition delay pulse as shown in Fig. 8(b). Inthis case tpc is calculated with respect to the voltage thresholdcrossing point of the ignition delay pulse occurring just earlier tothe concerned arc pulse. And tpc4to as shown Fig. 8(b).
5 10 15 20 25
−50
0
50
100
150
−50
0
50
100
Time (µs)
Gap
vol
tage
(V)
Gap
cur
rent
(A)
Vt
It
tv
tpc>to
tpc
tc
to
Fig. 7. Detecting open circuit pulse.

−50
0
50
100
Gap
vol
tage
(V)
5 10 15 20 25 30 35 40−50
0
50
100
Time (µs)
Gap
cur
rent
(A)
ni
oi
Vt
It
tc tv
tpc
−50
0
50
100
Gap
vol
tage
(V)
5 10 15 20 25 30 35 40−50
0
50
100
Time (µs)
Gap
cur
rent
(A)
Vt
It
tv
tpc
tc
tpc >to
tc >tv
ni
oi
to
Fig. 8. Detecting non-ignition delay pulse: (a) detecting non-ignition delay pulse (case 1) and (b) detecting non-ignition delay pulse (case 2).
V. Janardhan, G.L. Samuel / International Journal of Machine Tools & Manufacture 50 (2010) 775–788780
The non-ignition delay pulses are further classified into shortand arc pulses. This is done based on the magnitude of their peakvoltage. The peak voltage corresponding to a short circuit pulse isless than the arc pulse [18,20]. The threshold voltage (Va) forclassifying different non-ignition delay pulses is taken as 20 V. Ifthe peak voltage of the non-ignition delay pulse is greater than20 V it is arc pulse and else it is a short circuit pulse.
Fig. 9. Experimental setup for WEDT.
4. Experiments for WEDT process analysis
The experimental setup for conducting WEDT experiments isshown in Fig. 9. The experiments are conducted on ELECTRONICAECOCUT WEDM machine. Two sets of experiments are conductedin the present work. In the first set, preliminary experiments areconducted to compare the discharges occurring in WEDM andWEDT to study the variation in discharges occurring when theworkpiece is fixed and rotating, respectively .The experiments areconducted on brass material for both WEDT and WEDM. Thediameter of the brass workpiece for WEDT is 10 mm, and

V. Janardhan, G.L. Samuel / International Journal of Machine Tools & Manufacture 50 (2010) 775–788 781
thickness of the workpiece for WEDM is 12 mm. The MRR (i.e.volume of the material removed per unit time) is calculated usingEqs. (1) and (2) for WEDT [7] and WEDM [21]. The equationavailable for mass of the material removed per unit time ismodified to get volume of material removed per unit time inWEDM [21]:
MRR for WEDT¼p� ðD2
1�D22Þ � Vf
4ð1Þ
MRR for WEDM¼w� t � Vf ð2Þ
4.1. Preliminary experiments
Experiments were conducted by varying the pulse off time, forboth WEDT and WEDM. The comparison of pulse train graphs atpulse off time 42 ms for WEDT and WEDM is reported in Fig. 11(a)and (b). The arc and normal discharge concentration regions arerepresented by a rectangular waveform. The peak regionrepresents the arc regions and the valley region represents thenormal (spark) discharge region. From Fig. 10 it is observed that atconstant pulse off time the number of arcs is more in WEDT thanin WEDM. The number of arc regions and width of the arc regions(Wa) are more in WEDT compared to WEDM. The experimentalobservations made during WEDT and WEDM at different pulse offtimes are shown in Table 1. It is observed that much fluctuation inthe average voltage is observed in WEDT compared to WEDM,which can be attributed to the occurrence of arc regions in WEDT.
0 0.001 0.002 0.003 0.004 0.00Time
Gap
vol
tge
(V)
0 0.001 0.002 0.003 0.004 0.
-50
0
50
100
-50
0
50
100
Tim
Gap
vol
tge
(V)
Arc region
Fig. 10. Comparison of pulse trains for WEDT and WEDM: (a) pulse train data for W
representing the arc regions at 42 ms.
Table 1Observations from preliminary experiments conducted on WEDT.
S. no. Pulse off time (ls) Fluctuation in average voltage (V) Fluc
WEDT WEDM WED
1 30 44–54 52–56 1.9–
2 35 46–54 50–52 1.4–
3 42 46–52 48–50 0.9–
It is also observed that the MRR in case of WEDT is less than thatof WEDM at all the pulse off times. This is due to the increased arcpulses in WEDT, the arc pulses reduce MRR and spark pulsesincrease MRR [12,19,20]. The possible cause for the occurrence ofwider arc regions in WEDT is due to rotation of the workpiece.When discharge occurs, the material is removed from the rotatingworkpiece and the wire is fed forward during which theunmachined portion of the workpiece faces the wire and thespark gap reduces. This phenomenon increases the formation ofarcs and arc regions.
4.2. Experiments to study the effect of machining parameters
The second set of experiments is conducted to study the effectof machining parameters pulse off time, spark gap, servo feed,rotational speed and flushing pressure on MRR, surface roughnessand roundness error. The details of the machining parametersettings for the experiments are shown in Table 2. The pulse offtimes used are 30, 35 and 42 ms. From the preliminaryexperiments conducted it was observed that for the WEDMmachine used the turning process is not consistent at lower pulseoff times (below 30 ms). Due to this limitation, aforementionedpulse off times have been chosen. The spark gap and servo feedknobs can be varied from 1 to 10; during this spark gap variesfrom 10 to 100 mm proportionally. For the present case spark gapsare chosen as 30, 50 and 80 mm since it was observed frompreliminary experiments that consistent machining occurredwithin this range only. Varying the servo feed knob from 1 to
5 0.006 0.007 0.008 0.009 0.010 (s)
005 0.006 0.007 0.008 0.009 0.01e (s) Spark region
EDT representing the arc regions at 42 ms and (b) pulse train data for WEDM
tuation in average current (A) Material removal rate (mm3/min)
T WEDM WEDT WEDM
2.0 2.0 9.75 15.84
1.5 1.8 8.67 12.96
1.0 1.0 6.89 7.68

V. Janardhan, G.L. Samuel / International Journal of Machine Tools & Manufacture 50 (2010) 775–788782
10 increases the wire federate (Technology manual ECOCUTmachine). Servo feed knob is set at 3, 5 and 8 since machining isnot consistent below level3 and above level8. Using the worm andhelical gear the rotational speed can be varied from 4 to 100 rpm.However at lower rotational speeds helical threads are formed onthe workpiece as shown in Fig. 1(c). Because of this the rotationalspeed is varied between 40 and 100 (40, 70 and 100 rpm). Theflushing pressure can be adjusted at three levels using regulatingvalves. Hence the flushing pressure is chosen as 1 (lower), 2(medium) and 3 (higher) to cover the total range. The actualvalues are given in Table 2. The process constants used forconducting experiments are shown in Table 3. The experimentsare conducted such that when a particular parameter is varying,all other parameters are kept constant. The constant value usedfor pulse off time when studying the effect of any other machiningparameter is 42 ms. For spark gap and servo feed the constant
Table 4Results of pulse train analysis for different machining parameters.
S.no.
Machiningparameter
Average number ofnormal pulses
Average numberof arc pulses
Totalnumber ofpulses
Averagedelay tim
1 Pulse off time
Level 1 818 945 1763 57
Level 2 812 714 1526 59
Level 3 722 497 1219 68
2 Spark gap
Level 1 760 965 1725 37
Level 2 722 497 1219 67
Level 3 430 132 562 160
3 Servo feed
Level 1 716 447 1164 72
Level 2 722 497 1219 61
Level 3 820 545 1365 50
4 Rotational speed
Level 1 722 497 1219 68
Level 2 772 487 1259 62
Level 3 771 590 1361 56
5 Flushing pressure
Level 1 725 688 1413 57
Level 2 722 497 1219 68
Level 3 717 511 1228 68
Table 2Parameter settings for WEDT experiments.
Machining parameter Parameter levels
Level 1 Level 2 Level 3
Pulse off time (ms) 30 35 42
Spark gap (mm) 30 50 80
Servo feed 3 5 8
Flushing pressure (kg/cm2) 2 4 6
Rotational speed (rpm) 40 70 100
Table 3Process constants used for WEDT experiments.
Parameter Value
Wire speed (m/min) 4.0
Depth of cut (mm) 0.3
Diameter of the specimen 10.0
Maching length (mm) 8.0
Material Brass
value is 5. Similarly for rotational speed it is 40 rpm and flushingpressure is set at level 2.
5. Results and discussions
The effect of machining parameters on pulse trains, MRR,surface roughness and roundness will be discussed in this section.
5.1. Influence of machining parameters on pulse trains
The pulse train data are collected for a duration of 100 ms ateach experimental condition. The results of pulse train analysiswith pulse off time, spark gap, servo feed, rotational speed andflushing pressure are shown in Table 4. The number of normalpulses, arc pulses, total number of pulses, average ignition delaytime, number of arc regions, width of the arc and normal regionsare also shown in Table 4. Open circuit and short circuit pulses didnot occur in the data analyzed, so they are represented in Table 4.
5.1.1. Influence of pulse off time
From Table 4, it is observed that the pulse off time hassignificant influence on the number of arc pulses, total number ofpulses and the number of arc regions. With increase in pulse offtime from 30 to 42 ms, the number of arc pulses decreased from945 to 497, the total number of pulses reduced from 1763 to 1219and the number of arc regions reduced from 159 to 117. Becauseat higher pulse off times the deionization time available for thecharge carriers increases and most of the charge carriers formedduring the discharge will get deionized and the flushing availablewill also be more. Due to this the number of arc pulses reducedfrom 945 to 497 and arc regions reduced from 159 to 117. Ignitiondelay time did not vary much with pulse off time.
5.1.2. Influence of spark gap
Spark gap has much influence on most of the pulse trainresults. From Table 4 it is observed that with increase in spark gapfrom level 3 to 8, ignition delay time increased from 37 to 160 ms.This is due to the increase in gap resistance. The number ofnormal and arc discharges reduced from 760 to 430 and from 965
ignitione (ls)
Average numberof arc regions
Average width ofarc region (ls)
Average width of normaldischarge region (ls)
150 159 497
145 134 544
128 117 652
180 180 371
128 117 652
48 70 2033
124 100 687
128 117 652
159 111 508
128 117 652
147 94 583
175 99 469
157 141 491
128 117 652
123 131 677

V. Janardhan, G.L. Samuel / International Journal of Machine Tools & Manufacture 50 (2010) 775–788 783
to 132 with increase in spark gap due to the increase in ignitiondelay time. At lower spark gap, gap resistance is less andbreakdown occurs at a faster rate, and hence the number ofdischarges per unit time is increased. When the number ofdischarges increase, the gap contamination will be more and thechances of forming arcs and arc regions increase. Because of thisthe number of arc regions when the spark gap knob is set at 3 is180 and at 8 it is 48 as shown in Table 4. The pulse train datacollected at different spark gaps is shown in Fig. 11(a)–(c). Areduction in the number of arcs, arc regions, width of the arcregion with increase in spark gap can be observed. The width ofnormal discharge region increases with increase in spark gapsince the chances of forming normal discharge are more at higherspark gap.
5.1.3. Influence of servo feed
Increasing the servo feed knob from 3 to 8 increases the wirefeed rate (Technology manual ECOCUT). Since it reduces the servoreference voltage, the difference between the average inter-electrode gap voltage and servo reference voltage increases andservo control increases the feed rate [22]. When feed rateincreases the gap between the wire and workpiece reduces,leading to the reduction in ignition delay. Due to this the averageignition delay time reduced from 72 to 50 ms with increase inservo feed. The total number of pulses increased from 1164 to1365 with increase in servo feed level, due to the increase in thenumber of normal and arc discharges. The average number ofnormal discharges per unit time increased from 716 to 820 due to
0 0.001 0.002 0.003 0.004 0
-50
0
50
100
150
Tim
Gap
vol
tge
(V)
0.000 0.001 0.002 0.003 0.004 0
-50
0
50
100
150
Tim
Gap
vol
tge
(V)
0 0.001 0.002 0.003 0.004 0.
-50
0
50
100
150
Tim
Gap
vol
tge
(V)
Fig. 11. Variation in pulse trains with spark gap: (a) pulse train data at spark gap 30 mm,
pulse train data at spark gap 50 mm, normal discharges¼73; arcs¼55; arc regions¼1
discharges¼55; arcs¼24; arc regions¼8; Wa¼95 ms; Wn¼715 ms.
reduction in the average ignition delay time. At higher servo feedlevel since the spark gap reduces due to increased feed rate, thechances of forming arcs increase, because of this the averagenumber of arcs increased from 447 to 545 as shown in Table 4;also the average number of arc regions increased from 124 to 159with increase in servo feed.
5.1.4. Influence of rotational speed
Rotational speed has significant influence on the number of arcregions. With increase in rotational speed from 40 to 100 rpm,number of arc regions increased from 128 to 175 as shown inTable 4, due to reduction in the spark gap. As the rotational speedincreases, the circumferential length of the material crossing thesparking region per unit time increases but the energy input inthe form of pulse is the same. So the volume of material removedper unit length or the depth of the material removed at thesparking region reduces. If the depth of material removed is less,the gap between the wire and workpiece decreases. Because ofthis the chances of forming arcs increases and hence the arcregions increased. A slight reduction in the ignition delay from 68to 56 ms occurred with increase in rotational speed due to thereduction in the spark gap. For the same reason the total numberof discharges increased from 1219 to 1361 as shown in Table 4.
5.1.5. Influence of flushing pressure
Flushing pressure effects the contamination of spark gap withthe debris formed. Increasing the flushing pressure flush away thedebris formed and gap contamination reduces. It can be observed
.005 0.006 0.007 0.008 0.009 0.010e (s)
.005 0.006 0.007 0.008 0.009 0.010e (s)
005 0.006 0.007 0.008 0.009 0.010e (s)
normal discharges¼63; arcs¼112; arc regions¼18; Wa¼231 ms; Wn¼367 ms, (b)
2; Wa¼163 ms; Wn¼490 ms and (c) pulse train data at spark gap 80 mm, normal
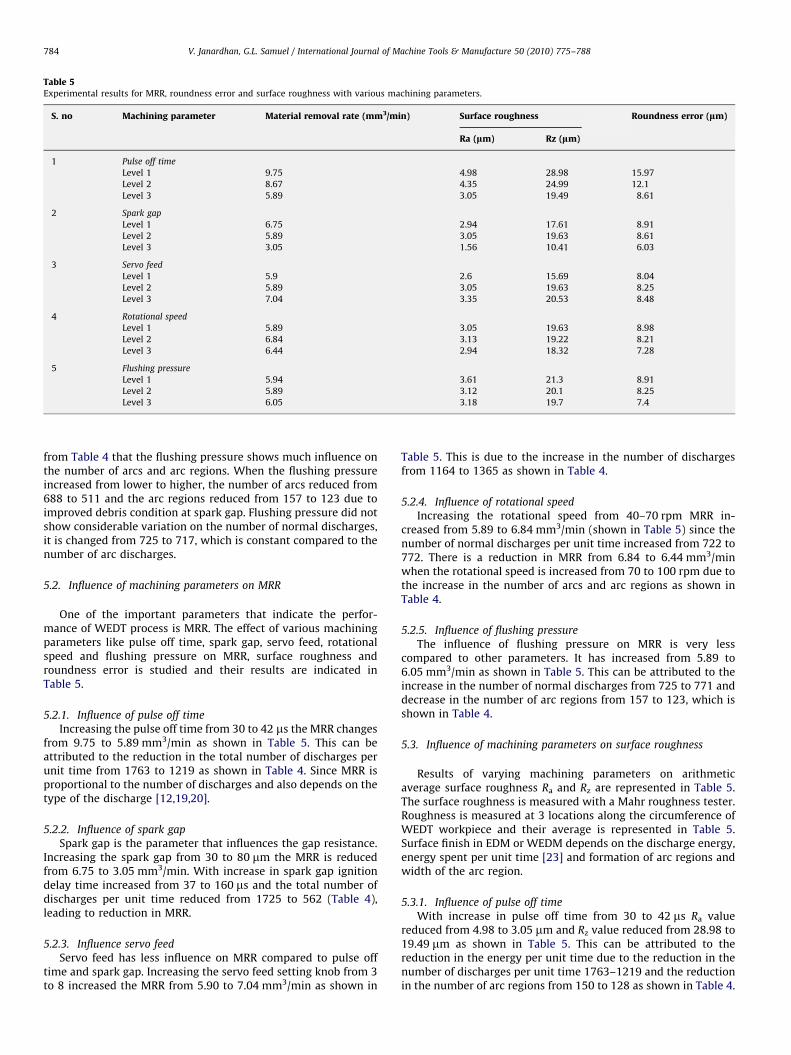
Table 5Experimental results for MRR, roundness error and surface roughness with various machining parameters.
S. no Machining parameter Material removal rate (mm3/min) Surface roughness Roundness error (lm)
Ra (lm) Rz (lm)
1 Pulse off time
Level 1 9.75 4.98 28.98 15.97
Level 2 8.67 4.35 24.99 12.1
Level 3 5.89 3.05 19.49 8.61
2 Spark gap
Level 1 6.75 2.94 17.61 8.91
Level 2 5.89 3.05 19.63 8.61
Level 3 3.05 1.56 10.41 6.03
3 Servo feed
Level 1 5.9 2.6 15.69 8.04
Level 2 5.89 3.05 19.63 8.25
Level 3 7.04 3.35 20.53 8.48
4 Rotational speed
Level 1 5.89 3.05 19.63 8.98
Level 2 6.84 3.13 19.22 8.21
Level 3 6.44 2.94 18.32 7.28
5 Flushing pressure
Level 1 5.94 3.61 21.3 8.91
Level 2 5.89 3.12 20.1 8.25
Level 3 6.05 3.18 19.7 7.4
V. Janardhan, G.L. Samuel / International Journal of Machine Tools & Manufacture 50 (2010) 775–788784
from Table 4 that the flushing pressure shows much influence onthe number of arcs and arc regions. When the flushing pressureincreased from lower to higher, the number of arcs reduced from688 to 511 and the arc regions reduced from 157 to 123 due toimproved debris condition at spark gap. Flushing pressure did notshow considerable variation on the number of normal discharges,it is changed from 725 to 717, which is constant compared to thenumber of arc discharges.
5.2. Influence of machining parameters on MRR
One of the important parameters that indicate the perfor-mance of WEDT process is MRR. The effect of various machiningparameters like pulse off time, spark gap, servo feed, rotationalspeed and flushing pressure on MRR, surface roughness androundness error is studied and their results are indicated inTable 5.
5.2.1. Influence of pulse off time
Increasing the pulse off time from 30 to 42 ms the MRR changesfrom 9.75 to 5.89 mm3/min as shown in Table 5. This can beattributed to the reduction in the total number of discharges perunit time from 1763 to 1219 as shown in Table 4. Since MRR isproportional to the number of discharges and also depends on thetype of the discharge [12,19,20].
5.2.2. Influence of spark gap
Spark gap is the parameter that influences the gap resistance.Increasing the spark gap from 30 to 80 mm the MRR is reducedfrom 6.75 to 3.05 mm3/min. With increase in spark gap ignitiondelay time increased from 37 to 160 ms and the total number ofdischarges per unit time reduced from 1725 to 562 (Table 4),leading to reduction in MRR.
5.2.3. Influence servo feed
Servo feed has less influence on MRR compared to pulse offtime and spark gap. Increasing the servo feed setting knob from 3to 8 increased the MRR from 5.90 to 7.04 mm3/min as shown in
Table 5. This is due to the increase in the number of dischargesfrom 1164 to 1365 as shown in Table 4.
5.2.4. Influence of rotational speed
Increasing the rotational speed from 40–70 rpm MRR in-creased from 5.89 to 6.84 mm3/min (shown in Table 5) since thenumber of normal discharges per unit time increased from 722 to772. There is a reduction in MRR from 6.84 to 6.44 mm3/minwhen the rotational speed is increased from 70 to 100 rpm due tothe increase in the number of arcs and arc regions as shown inTable 4.
5.2.5. Influence of flushing pressure
The influence of flushing pressure on MRR is very lesscompared to other parameters. It has increased from 5.89 to6.05 mm3/min as shown in Table 5. This can be attributed to theincrease in the number of normal discharges from 725 to 771 anddecrease in the number of arc regions from 157 to 123, which isshown in Table 4.
5.3. Influence of machining parameters on surface roughness
Results of varying machining parameters on arithmeticaverage surface roughness Ra and Rz are represented in Table 5.The surface roughness is measured with a Mahr roughness tester.Roughness is measured at 3 locations along the circumference ofWEDT workpiece and their average is represented in Table 5.Surface finish in EDM or WEDM depends on the discharge energy,energy spent per unit time [23] and formation of arc regions andwidth of the arc region.
5.3.1. Influence of pulse off time
With increase in pulse off time from 30 to 42 ms Ra valuereduced from 4.98 to 3.05 mm and Rz value reduced from 28.98 to19.49 mm as shown in Table 5. This can be attributed to thereduction in the energy per unit time due to the reduction in thenumber of discharges per unit time 1763–1219 and the reductionin the number of arc regions from 150 to 128 as shown in Table 4.

V. Janardhan, G.L. Samuel / International Journal of Machine Tools & Manufacture 50 (2010) 775–788 785
It is also observed from Table 4 that width of arc region is more atpulse off time 30 ms. Due to this the energy spent is more, formingwide craters, and increases the Rz value since it is calculated basedon the maximum peak to peak height of surface roughness profile.
5.3.2. Influence of spark gap
The spark gap has an inverse effect on surface roughness.Increasing the spark gap from 30 to 80 mm decreased Ra from 2.94to 1.56 mm and Rz from 17.61 to 10.41 mm. This is due to thereduction in the number of discharges and the number of arcregions with increase in spark gap as shown in Table 4. The widthof arc region is less at higher spark gap compared to that of thelower one due to this Rz value reduced. At the same time theaverage ignition delay time increased from 37 to 160 ms; thisreduces the energy spent per unit time during normal dischargeregion and results in reduction of surface roughness.
5.3.3. Influence of servo feed
The surface roughness is directly proportional to servo feed,which is observed from Table 5. Increasing servo feed setting knobfrom 3 to 8Ra value increased from 2.6 to 3.35 mm and Rz valueincreased from 15.69 to 20.53 mm. Surface roughness parametersare less at lower servo feed since the servo voltage is high. Due tothis the difference between the average inter-electrode gapvoltage and servo voltage reduces and the wire feed reduces.This will reduce the chances of forming arcs and arc regions and
Fig. 12. Roundness profiles at different pulse off times: (a) roundness profile at pulse of
at pulse off time 42 ms.
the number of discharges per unit time also less at lower servofeed than that of the higher one as shown in Table 4, leading tothe reduction in energy spent per unit time. The increase insurface roughness parameters with increase in servo feed isdue to the increase in the energy per unit time as the number ofpulses per unit time and the arc regions are more as shown inTable 4.
5.3.4. Influence of rotational speed
Rotational speed has very less influence on surface roughness.The variation in surface roughness parameters with rotationalspeed is shown in Table 5. Slight decrease in the Ra and Rz isobserved when the rotational speed is increased from 40 to100 rpm since the circumferential length of the material crossingthe spark region per unit time increases about 60%, reducing theenergy spent per unit length. Due to this the surface finish ofthe machined component improved, though there is increase inthe number of arc regions as shown in Table 4.
5.3.5. Influence of flushing pressure
Flushing pressure did not show significant effect on the surfaceroughness parameters. The Ra value decreased from 3.61 to3.18 mm and the Rz value decreased from 21.30 to 19.70 mm asshown in Table 5. This can be attributed to the reduction in energydue to the reduction in the number of arc regions from 157 to 123and width of arc regions from 141 to 131 ms. The increase in
f time 30 ms, (b) roundness profile at pulse off time 35 ms and (c) roundness profile

V. Janardhan, G.L. Samuel / International Journal of Machine Tools & Manufacture 50 (2010) 775–788786
average ignition delay time from 57 to 68 ms as seen in Table 4 isalso a cause for this.
5.4. Influence of machining parameters on roundness error
Roundness error is measured with the Mahr roundness tester.The roundness is measured at three cross sections of themachined component and their average is shown in Table 5.The maximum peak and valley in the roundness profile depend onthe discharge energy per unit time and energy spent per unitlength along the circumference of the workpiece. Dischargeenergy per unit time and length depends on the formation ofarc regions, width of the normal and arc regions and the averageignition delay time. A valley may be formed during arc regionsince the number of discharges per unit time and length along thecircumference of the workpiece is more and creates a deep crater.The depth of crater formed during normal discharge region is lesscompared to that of the arc region. Because the number ofdischarges per unit time during normal discharge region is less,normal discharge is associated with ignition delay and the energyper unit time reduces and the depth of crater reduces or forms apeak in the roundness profile. The average gap voltage reducesduring the arc region, when it is less than the servo voltage, thetable is withdrawn and this may also cause an irregularity in theroundness profile. Han et al. [24] mentioned that when the tableis withdrawn or wire feed is reduced suddenly, unnecessary
Fig. 13. Variation in roundness profiles with spark gap: (a) Roundness profile at spark
spark gap 80 mm.
streaks are formed, resulting in waviness of the parts machined.The bearing form error also affects the roundness error [8]. Thevariation in roundness error with various machining parametersis shown in Table 5.
5.4.1. Influence of pulse off time
Pulse off time has an inverse effect on roundness error.Increasing the pulse off time from 30 to 42 ms, the average valueof roundness error decreased from 15.97 to 8.61 mm as shown inTable 5. Since the number of discharges per unit time reduceswith increase in pulse off time as shown in Table 4, the size ofcraters formed reduces. Because of this roundness error reduces.The polar plots of roundness profiles collected at different pulseoff times are shown in Fig. 12. The roundness profile collected atpulse off time 30 ms is shown in Fig. 12(a). It is observed fromFig. 12(a) that the depth of the valleys is more due to the higherwidth of the arc regions at pulse off time 30 ms as shown inTable 4. Because of this the roundness error is 17.18 mm, which ismore compared to the pulse off times 35 and 42 ms as shown inFig. 12(b) and (c). As the pulse off time increases, the number ofarc regions and width of the arc regions reduced and the width ofthe normal discharge regions and average ignition delay timeincreased as shown in Table 4. These result in the reduction ofcrater size formed and the roundness error reduces as shown inFig. 12(b) and (c).
gap 30 mm, (b) roundness profile at spark gap 50 mm and (c) roundness profile at

V. Janardhan, G.L. Samuel / International Journal of Machine Tools & Manufacture 50 (2010) 775–788 787
5.4.2. Influence of spark gap
Increase in the spark gap from 30 to 80 mm reduced theaverage roundness error from 8.91 to 6.03 mm. Since the energyper unit time reduces as number of discharges, number of arcregions and the width of the arc regions reduce with increase inspark gap as shown in Table 4. The roundness profiles collected atspark gaps are shown in Fig. 13. It is observed from Fig. 13(a) thatat spark gap 30 mm the depth of the craters in the roundnessprofile is more since the average width of the arc regions is moreas shown in Table 4. When the spark gap is increased the depth ofthe craters reduced as shown in Fig. 13(b) and (c). Since at higherspark gap the width of normal regions and ignition delay timeincreased as represented in Table 4, this will also reduce theenergy per unit time and roundness error reduces. The minimumroundness obtained at higher spark is 5.37 mm.
5.4.3. Influence of servo feed
The roundness error increases slightly with increase in servofeed. The roundness error increased from 8.04 to 8.48 mm whenthe servo feed setting knob is changed from 3 to 8 as shown inTable 5. There is a slight increase in total number of dischargesand increase in the average width of the arc regions as shown inTable 4. At the same time a slight reduction in the average ignitiondelay time also occurred, which will also increase the energyspent during normal discharge region. The number of arc regionsincreased considerably, which may increase the number of peaksand valleys but will not vary the roundness error since thevariation in width of the arc region is less.
5.4.4. Influence of rotational speed
Rotational speed has considerable influence on roundness error.Average roundness error decreased from 8.98 to 7.28 mm. Whenthe rotational speed increases from 40 to 100 rpm the circumfer-ential length of the material crossing the spark region per unit timeincreases about 60% and hence the roundness error reduced thoughthe number of arc regions increased from 128 to 175 with increasein rotational speed as shown in Table 4. The reduction in the widthof the normal and arc regions with increase in rotational speed alsocontributes to the reduction in roundness error.
5.4.5. Influence of flushing pressure
A slight reduction in the roundness error is observed withincrease in flushing pressure as shown in Table 5. This is due tothe reduction in the number of arc regions and width of the arcregions with increase in flushing pressure as shown in Table 4. Atthe same time the average ignition delay time increased, andbecause of this the energy spent per unit length during the normaldischarge region decreases and roundness error reduces.
6. Conclusions
In the present work a precise, simple and cost effective spindlefor WEDT process is fabricated. It was observed that the spindlerunout is the key parameter affecting consistent machining inWEDT. A data acquisition system for acquiring pulse train dataduring WEDT process is developed. A pulse classificationalgorithm for off-line analysis of the WEDT process is developedusing MATLAB. Following are the major conclusions from theexperimental results:
�
Discharge pulses were classified into open circuit, normal, arcand short circuit pulses. The effect of machining parameters onMRR, surface roughness and roundness are analyzed withrespect to pulse classification results.�
MRR increased with decrease in pulse off time in both WEDTand WEDM. At a constant pulse off time, MRR in WEDT is lesscompared to that of WEDM. � The rotation of workpiece caused arc regions in WEDT process.The number of arc regions and duration of the arc regionsobserved in WEDT are more than that observed in WEDM.
� MRR is influenced by variation in total number of dischargesand the type of discharge. Pulse off time and spark gap have aninverse effect on MRR. Decreasing the pulse off time and sparkgap increases the MRR by about 50%. Increasing the servo feedand rotational speed increased the MRR by 17% and 14%,respectively. Flushing pressure has less influence on MRRcompared to the other parameters.
� Surface finish improved with decrease in the number of arcregions per unit time and increase in the average ignition delaytime. By reducing the pulse off time, the arithmetic averageroughness (Ra) reduced by 56% of the total reduction and byreducing the spark gap it has reduced by 43%. Decreasing theservo feed decreased Ra by 22%.
� Roundness error reduced with decrease in the number of arcregions per unit time, increase in the average width of thenormal discharge regions and average ignition delay time. Byreducing the pulse off time roundness error reduced by 74%and by reducing the spark gap roundness error reduced by29%. Increasing the rotational speed reduced the roundnesserror by 17%. Increase in the flushing pressure reduced theroundness error by 15%.
The online control of the process considering the reduction inthe number arc regions and control of average ignition delay timeas a control strategy can be implemented as a next step toimprove the MRR, surface finish and roundness error of the WEDTcomponent.
References
[1] T.A. Spedding, Z.Q. Wang, Study on modeling of wire EDM process, Journal ofMaterials Processing Technology 69 (1997) (1997) 18–28.
[2] T. Masuzawa, H.K. Tonshoff, Three-dimensional micromachining by machinetools, Annals of the CIRP 46 (1997) (1997) 621–628.
[3] Jun Qu, A.J. Shih, R.O. Scattergood, Development of the cylindrical wireelectrical discharge machining process: Part 1: Concept, design, and materialremoval rate, Journal of Manufacturing Science and Engineering 124 (3)(2002) 702–707.
[4] T. Takayuki, F. Yasushi, M. Naotake, S. Nagao, O Masaaki, Machiningphenomena in WEDM of insulating ceramics, Journal of Materials ProcessingTechnology 149 (2004) 124–128.
[5] K. Rhoney, A. Shih, R.O. Scattergood, J. Akemon, D. Gust, M. Grant, Wireelectrical discharge machining of metal bond diamond wheels for ceramicgrinding, International Journal of Machine Tools and Manufacture 42 (2002)1355–1362.
[6] A. Mohmmadi, F.T. Alireza, E. Ehsan, K. Davoud, Statistical analysis of wireelectrical discharge turning on material removal rate, Journal of MaterialProcessing Technology 205 (2008) 283–289.
[7] M.J. Haddad, A.F. Tehrani, Material removal rate (MRR) study in thecylindrical wire electrical discharge turning (CWEDT) process, Journal ofMaterials Processing Technology 199 (2008) 369–378.
[8] Jun Qu, A.J. Shih, R.O. Scattergood, Development of the cylindrical wireelectrical discharge machining process: Part 2: surface integrity and round-ness, Journal of Manufacturing Science and Engineering 124 (3) (2002) 708–714.
[9] M.J. Haddad, A.F. Tehrani, Investigation of cylindrical wire electrical dischargeturning (CWEDT) of AISI D3 tool steel based statistical analysis, Journal ofMaterial Processing Technology 198 (2008) 77–85.
[10] A. Mohmmadhi, F.T. Alireza, E. Ehsan, K. Davoud, A new approach to surfaceroughness and roundness improvement in wire electrical discharge turningbased on statistical analysis, International Journal Advanced ManufacturingTechnology 39 (2008) 64–73.
[11] F. Han, J. Jiang, D Yu, Influence of discharge current on machined surfaces bythermo analysis in finish cut of WEDM, International Journal of MachineTools and Manufacture 47 (2007) 1187–1196.

V. Janardhan, G.L. Samuel / International Journal of Machine Tools & Manufacture 50 (2010) 775–788788
[12] A. Gangadhar, M.S. Shunmugam, P.K. Philip, Pulse train studies in EDM withcontrolled pulse relaxation, International Journal Machine Tools andManufacture 32 (5) (1992) 651–657.
[13] D.F. Dauw, R. Snoeys, W. Dekeyser, Advanced pulse discriminating system forEDM process and control, Annals of the CIRP 32 (2) (1983) 541–549.
[14] H Watanabe, T. Wang, I. Suzuki, WEDM monitoring with a statistical pulseclassification method, Annals of the CIRP 39 (1) (1990) 175–178.
[15] M.T. Yan, Y.S. Liao, Monitoring and self-learning fuzzy control for wirerupture prevention in wire electrical discharge machining, InternationalJournal of Machine Tools and Manufacture 36 (3) (1996) 339–353.
[16] Y.S. Liao, J.C. Woo, The effects of machining settings on the behavior of pulsetrains in the WEDM process, Journal of Materials Processing Technology 71(3) (1997) 433–439.
[17] Y.S. Tarng, C.M. Tseng, L.K. Chunng, A fuzzy pulse discriminating system forelectrical discharge machining, International Journal of Machine Tools andManufacture 37 (4) (1997) 511–522.
[18] M.T. Yan, H.T. Chien, Monitoring and control of micro wire-EDM process,International Journal of Machine Tools and Manufacture 47 (2007) 148–157.
[19] V.S.R. Murthy, P.K. Philip, Pulse train analysis in ultrasonic assisted EDM,International Journal of Machine Tools and Manufacture 27 (4) (1987) 469–477.
[20] Y.S. Liao, Y.Y. Chu, M.T. Yan, Study of wire breaking process and monitoring ofWEDM, International Journal Machine Tools and Manufacture 37 (4) (1997)555–567.
[21] N. Tosun, Can Cogun, A Gul Tosun, study on kerf width and material removalrate in wire electrical discharge machining based on Taguchi method, Journalof Materials Processing Technology 152 (2004) 316–322.
[22] M.T. Yan, Y.S. Liao, Adaptive control of the WEDM process using thefuzzy control strategy, Journal of Manufacturing Systems 17 (4) (1998)263–274.
[23] S.H. Lee, X.P. Li, Study on the effect of machining parameters on themachining characteristics in electrical discharge machining of tungstencarbide, Journal of Materials Processing Technology 115 (2001) 344–358.
[24] F. Han, M. Kunieda, T. Sendai and Y. Imai, Simulation of WEDM usingdischarge location searching algorithm. In: Proceedings of the 10th Interna-tional Conference on Precision Engineering (ICPE), July 18–20, 2001,Yokohama, Japan, pp. 319–323.