international journal of engineering research and general...
TRANSCRIPT

International Journal of Engineering Research and General Science Volume 4, Issue 5, September-October, 2016 ISSN 2091-2730
55 www.ijergs.org
INVESTIGATION OF THE EFFECT OF MOBILE NUMBER
PORTABILITY ON NETWORK SWITCHING CAPACITY IN NIGERIA
D. E. Bassey., A. P. Orim., and S. Ekwe.
Department of Physics,
University of Calabar, Calabar,
Cross River State, Nigeria.
Abstract- Mobile Number Portability is the aptitude of a subscriber to change his / her Network Provider (NP), without losing his /
her original Mobile Station Integrated Services Digital Network (MSISDN) number. This laudable process was recently introduced
into the Nigerian Telecommunications environment, in view of its impact on competition and quality of service among various
Network Providers (NPs). Ironically, the initial excitement it generated gradually faded. More than four years after its introduction,
the statutory agency, the Nigerian Communication Commission has not made any statement on the success or failure of the exercise.
In view of this, this study resorted to modeling a similar environment to investigate the switching capability of mobile network
operators transacting this porting regime. The assumption made was that all calls (seeds) were successfully originated and routed
using SS7 protocol. The model was framed after taking cognizance of how the signaling traffic was routed for real-time services under
a certain bandwidth switching capacity. Among other key performance indicators, the exercise indicated congested switching nodes:
an indication that porting activities will introduce traffic congestion if the operational channels are not expanded to accommodate high
traffic generated through porting activities. The study collaborates the reasons for the unimpressive performance witnessed on the
Number Portability programme in Nigeria.
Keywords: Donor network, Mobile network operators, Number portability, Originating network, Switching capacity.
3. INTRODUCTION
1.1 Mobile Number Portability in Nigeria.
The introduction of Mobile Network Portability (MNP) in Nigeria was welcomed with great expectations; arguably, to bring in the
needed competition among the various Network Providers (NPs), and above all, form the needed catalyst to commit operators on
Quality of Service (QoS) delivery. Ironically, more than four years after its introduction, the Nigerian Communication Commission
has not made any policy statement on the success or failure of the exercise. Besides, the initial excitement it generated has gradually
faded. MNP is the ability of a subscriber to change his / her Network Provider (NP), without losing his / her original Mobile Station
Integrated Services Digital Network (MSISDN) number [14]. Prior to the introduction of MNP, if a subscriber is dissatisfied with the
Quality of Service (QoS) of his/her NP, the individual is left with the option of continuing with that NP in order not to lose contact
with friends and associates who are familiar with that MSISDN number, or acquire a new MSISDN number from another NP [7]. The
ported MISISDN belongs to a set of static assigned number block, which was earlier assigned to the donor NP [19]. When ported
successfully, the ported MSISDN shall be served by the recipient NP [1].There are three types of Number Portability. They are:
(i) Service Portability: This is a situation where a subscriber can change from Fixed to Mobile Line or verse versa, and from Public
Switched Telephone Network (PSTN) to Integrated Services Digital Network (ISDN) [11].
(ii) Service Provider Portability: This can be referred to as the changing of a subscriber from one NP to another (i.e. Mobile to Mobile
or Fixed to Fixed) [5].
(iii) Location Portability. This happens when a subscribe changes his geographical location.
A significant amount of work is required technically to implement number portability due to the restructuring of the
telecommunications infrastructure [13]. This restructuring may involve creating a new database and selecting or implementing
different routing methods for various types of calls and messaging services [9].
This work focuses on the second model of Number Portability and therefore limits the study to the effect of MNP on network
switching capacity in Nigeria.
1.2 MNP Routing Schemes
MNP means moving from one NP to another without losing your MSISDN number. This transaction involves three parties such as [2]:
(a) Donor Network: The NP who initially assigned the MSISDN number to the subscriber.

International Journal of Engineering Research and General Science Volume 4, Issue 5, September-October, 2016 ISSN 2091-2730
56 www.ijergs.org
(b) Originating Network: The NP which originates a call to a ported MSISDN number.
(c) Recipient Network: The new NP which is the new host of the ported MSISDN number.
For the purpose of simulating the Nigerian model, consideration was given to the donor network, originating network and recipient
network; which are usually from different NPs [3].
From the definitions above, one can see that the Donor network of a subscriber does not change, and the Recipient network does not
need to allocate another MSISDN number to the ported SIM. Also, the MSISDN number does not depend on the network hosting the
ported number. The role of the mentioned parties varies and a particular NP can play more than one role at a time [12].
4. LITERATURE REVIEW
The importance of MNP on the deregulation wave sweeping the telecommunications sector cannot be overemphasized. [4]
while researching on the effect of mobile number portability on consumers in South Africa, observed that strengthening the regulatory
environment is required in order to ensure fair competition and consumer protection. He noted that there were gaps in respect of the
MNP regulation due to weak regulatory frame-work. According to him, the regulatory body lacked the capacity to enforce and
monitor compliance. [6] conclusion was based on analyses from 38 countries (1999 to 2004), that: when the quality of service was put
together with ported lines, it had an impact on the switching capacity and average prices. In some countries, MNP was associated with
increased switching cost, congestion and lower prices; especially for countries with porting times lower than five days. Countries with
less stringent porting times have not experienced churn or revenue effects [8]. The routing scheme and the porting times affect the
success of MNP in any country. Other examples are as follows: the telecommunications’ regulator in Chile, introduced Mobile
Number Portability (MNP) in January 2012, and by June 2013, it recorded 616,686 pre-paid subscribers and 480,571 post-paid
customers who successfully ported their numbers to their choice carriers[15].Ghana’s National Communication Authority (NCA)
introduced MNP on 6 July 2013, one year after the introduction of MNP, about 370,107 mobile numbers ported successfully,
representing 1.6 per cent of the total active mobile numbers in the market [17]. Following the introduction of MNP in Colombia, by
August 2011, a total of 441,163 customers have switched providers. The greatest concentration of ports was in the first quarter of
2012, when 167,914 people moved operators, while the number dropped to 132,344, the next quarter [22] .India unveiled MNP in
November 2010, and two months later in January 2011, 1.7 million of over 200 million subscribers had ported [18].When MNP was
introduced in UK in 1999, it took 25 days to port. Before April 2011, porting time reduced to two days [20]. Efforts have been made
to reduce it to 24 hours, while in Ecuador, a total of 29,029 requests by subscribers to port their numbers had been received by January
25, 2010, and exactly one year after MNP was introduced in the country[21].The number in Brazil was even higher, with 3.48 million
of 210 million subscribers seeking to port, just six months after MNP was unveiled; while Romania, which introduced MNP in
October 2008, recorded over 31,000 subscribers porting by February of the following year. Presently [23]. Nigeria’s regulator has not
made any official statement on the number of ported lines and the success rate recorded so far. In view of this, this study resorted to
modeling a similar environment to investigate the switching capability of mobile network operators transacting this porting regime.
3. CONCEPTUAL FRAMEWORK
3.1 Modelling
Different seeds of subscribers seeking MNP services were simulated and the time taken to access different switching nodes of the
Donor NP through to the Recipient NP was recorded using the simulation’s tool-kit. The assumption made was that all calls (seeds)
were successfully originated and routed using SS7 protocol [4]. The model was framed after taking cognizance of how the signaling
traffic was rooted for real services under a certain bandwidth switching capacity [8]. Also consideration was given for multiple
network-provider environment; noting that the donor NP and recipient NP belonged to different operators. This scenario was chosen
in line with the Nigerian Telecommunications environment. The simulation task was accomplished using Packet tracer software to
simulate the porting processes and in some cases one or more components were substituted with a component in the stimulating
software to give a general scenario of the integrated network. The software used and the routing model employed are discussed
briefly.
3.1.1 Routing models
The SS7 network scenario was used from the interconnection of the various components on the network. The switching protocol
considered in this case was to ease possible traffic congestion that may be experienced during porting processes [16]. Two NPs were
considered in designing the model; since they were the minimum subscribers’ interface required for an MSISDN number to be ported.
This made the SS7 architecture scaled down to have the same signaling points and links. The SS7 used the signaling protocols known
as the Transaction Capabilities Application Part (TCAP) routing protocol [6].
3.1.2 Simulation software
Going by the aim of this research work: to find out the performance impact of MNP on the switching capacity of the Donor or
Receptor network in Nigeria, the study relied on estimation since the NCC refused to supply empirical data even after conscientious
efforts were made [21].The software used for simulation is the Packet Tracer software. Packet Tracer provided the convenient
environment to construct and stimulate traffic flow scenario using variable inputs similar to what is obtained during real-time signal
International Journal of Engineering Research and General Science Volume 4, Issue 5, September-October, 2016 ISSN 2091-2730
57 www.ijergs.org
flow [17]. The TCP IP protocol was used in the Packet Tracer simulation. The design model focused on the SS7 protocol used by
GSM networks [10].
3.2 Method
The method employed by this study was first designing the signal flow diagram and there after the process flow was developed. This
was followed by the creation of the design scenario.
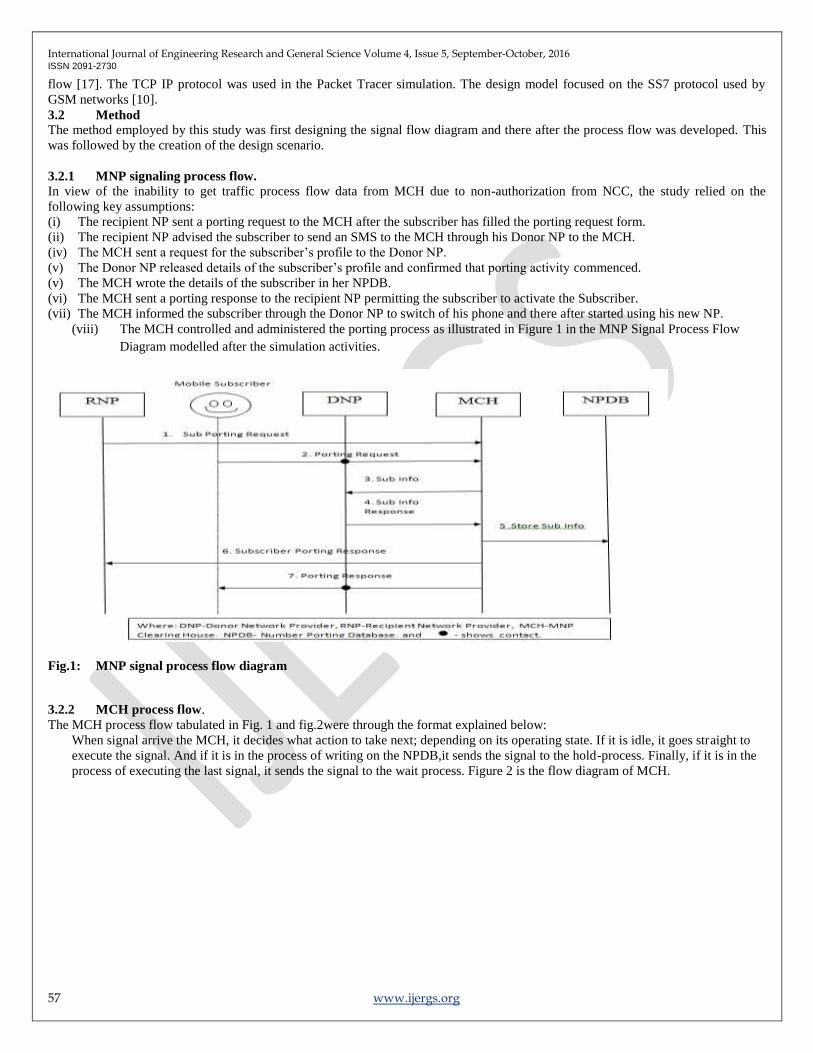
3.2.1 MNP signaling process flow.
In view of the inability to get traffic process flow data from MCH due to non-authorization from NCC, the study relied on the
following key assumptions:
(i) The recipient NP sent a porting request to the MCH after the subscriber has filled the porting request form.
(ii) The recipient NP advised the subscriber to send an SMS to the MCH through his Donor NP to the MCH.
(iv) The MCH sent a request for the subscriber’s profile to the Donor NP.
(v) The Donor NP released details of the subscriber’s profile and confirmed that porting activity commenced.
(v) The MCH wrote the details of the subscriber in her NPDB.
(vi) The MCH sent a porting response to the recipient NP permitting the subscriber to activate the Subscriber.
(vii) The MCH informed the subscriber through the Donor NP to switch of his phone and there after started using his new NP.
(viii) The MCH controlled and administered the porting process as illustrated in Figure 1 in the MNP Signal Process Flow
Diagram modelled after the simulation activities.
Fig.1: MNP signal process flow diagram
3.2.2 MCH process flow.
The MCH process flow tabulated in Fig. 1 and fig.2were through the format explained below:
When signal arrive the MCH, it decides what action to take next; depending on its operating state. If it is idle, it goes straight to
execute the signal. And if it is in the process of writing on the NPDB,it sends the signal to the hold-process. Finally, if it is in the
process of executing the last signal, it sends the signal to the wait process. Figure 2 is the flow diagram of MCH.

International Journal of Engineering Research and General Science Volume 4, Issue 5, September-October, 2016 ISSN 2091-2730
58 www.ijergs.org
Fig.2: MCH Flow Diagram
3.2.3 Simulation design
The simulations were processed by using the tool-kit for traffic modelling in Computer and Telecommunication networks. MNP
message exchanges from the subscribers and their routing functionalities to the end point were simulated in order to compare the
impact of performance of each routing scheme under SS7 signaling mode [3]. Consideration was given to the fact that Number
Portability occurs using the facilities of two network operators (RNP and DNP). The message goes through these switching nodes to
reach the Donor NP. Then, the Donor NP will first check whether the called party directory number is in the directory. With the
updated routing information, the call is forwarded to the recipient network.
This therefore brings to fore the primary task of this model: to study the routing of MNP transaction through the host network to the
recipient, and finally to the subscriber. All these signaling and switching nodes were considered during the simulation processes [11].
The components chosen on the Packet tracer environment were as close to the real scenario as possible; though assumptions were
made in order to trace the signal flow. The diagram in Figure 3showsthe MNP signal processes. The figure illustrates the signaling
processes and inter-partner relationship.
Fig. 3: Interworking reference model

International Journal of Engineering Research and General Science Volume 4, Issue 5, September-October, 2016 ISSN 2091-2730
59 www.ijergs.org
3.2.4 Design Scenario The design was tested from point to point to check for connectivity of all components on the Packet Tracer environment. The design
was simulated following the MNP signaling process flow with the assumptions that signals were transmitted from the MSC. The
processes followed are as follows:
The signal packet leaves the Recipient NP to the MCH. The MCH waits for the request from the Subscriber, which comes through the
Donor NP. The MCH on receiving the request from the subscriber conducts confirmation that the subscriber is still in the Donor NP
network, and further request for the profile of the subscriber. The Donor NP sends both the confirmation and the subscriber’s profile
to the MCH. The MCH writes the subscriber’s profile on NPDB and there-after sends an authorization to the Recipient NP to activate
the subscriber on the network. The MCH sends another message to the subscriber to initiate a hard reset in order to activate it on the
Recipient NP. This MNP signaling process flow was design to monitor some parameters in some components like the MSC, GMS,
NPDB.
3.3 Parameters
Five distinct parameters were employed during the simulation process. They are presented as follows:
• Average arrival rate of in-coming transactions (λcalls ):
λcalls = 1/tcalls, (1)
where tcalls is the average inter-arrival time of incoming signal.
• Average service rate of the network operator:
(μnetServ): μnetServ = 1/tnetServ, (2)
where tnetServ is the average service time from the links to the network operator.
• Average processing rate at the NPDB (μdbServ): μdbServ = 1/tdbServ , (3)
where tdbServ is the average processing time from the links to NPDB.
• External link delay (τexLink): This simply refers to the delay experienced on the out-door links of the operator’s network. That is from
the donor network to the recipient network or from the originating network to the centralized NPDB (which in the case of this research
work was induced). The scenario presented in this study is based on analyses carried out in terms of seeds. Seeds in this case refers to
a group of subscribers modeled after real traffic scenario.
4.0 RESULTS AND DISCUSSION The Figures presented below show the forward routing scheme in the simple model adopted for this study. The following results were
obtained from the simulation of one to hundred subscribers under different switching conditions. When a request for MNP was
originated, a message was generated to the Donor NP to set up a call segment carrying information which includes the called party
number and the routing label. In addition, different routing nodes that passed through the traffic were examined. Figure.4 presents the
models for MNP routing schemes for one subscriber. The transaction was analyzed by measuring the arrival time for each transaction
and the number of switching nodes the MNP traffic accessed. Fig. 4 to Fig. 8 show results obtained after simulating a traffic scenario
carrying one, ten, fifty, and hundred porting requests. These seeds (subscribers) were varied and analyzed based on the time taken for
the MNP request to access a switching node of each network and the total number of nodes accessed after completion of the porting
process.
4.1 Simulation for One Subscriber
The following results were obtained for the simulation of one subscriber. Figure 4 shows that more switching activities took place on
the Donor network compared to the Recipient network. The resources of the MCH were more utilized due to its control and
administrative role on the transaction. The graph also shows the arrival time for one subscriber; indicating the point to point arrival
time for the various switching nodes accessed during the porting process.
International Journal of Engineering Research and General Science Volume 4, Issue 5, September-October, 2016 ISSN 2091-2730
60 www.ijergs.org
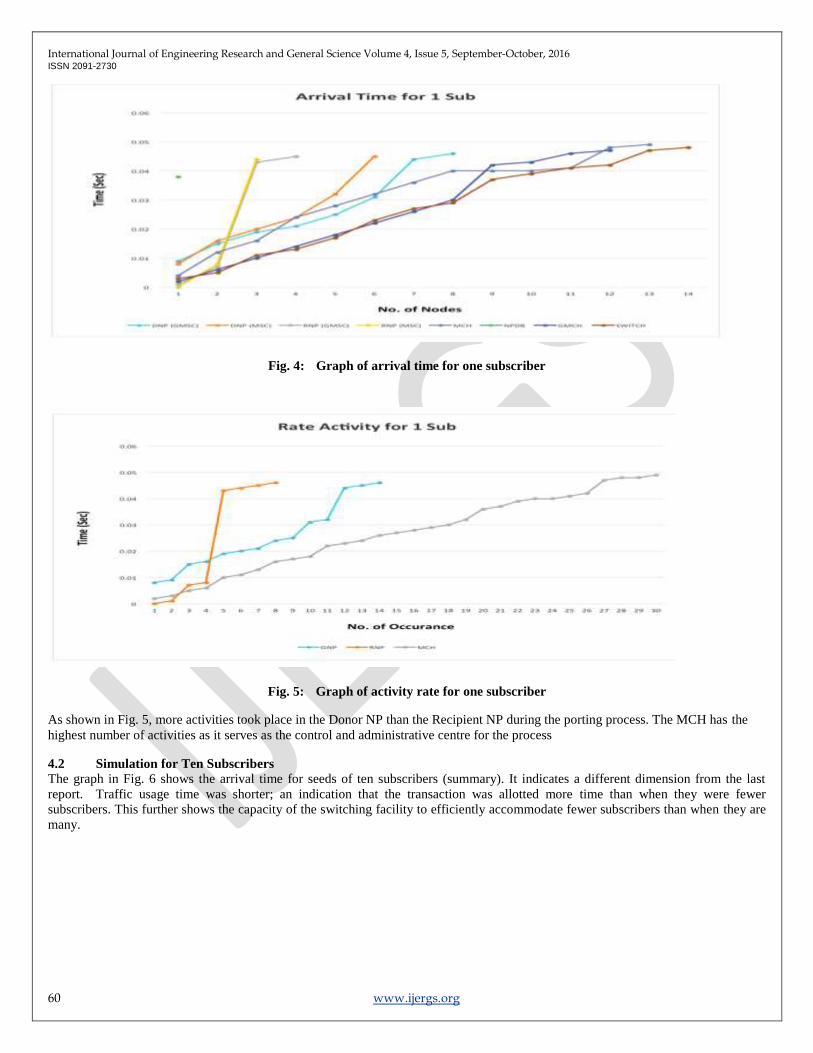
Fig. 4: Graph of arrival time for one subscriber
Fig. 5: Graph of activity rate for one subscriber
As shown in Fig. 5, more activities took place in the Donor NP than the Recipient NP during the porting process. The MCH has the
highest number of activities as it serves as the control and administrative centre for the process
4.2 Simulation for Ten Subscribers
The graph in Fig. 6 shows the arrival time for seeds of ten subscribers (summary). It indicates a different dimension from the last
report. Traffic usage time was shorter; an indication that the transaction was allotted more time than when they were fewer
subscribers. This further shows the capacity of the switching facility to efficiently accommodate fewer subscribers than when they are
many.
International Journal of Engineering Research and General Science Volume 4, Issue 5, September-October, 2016 ISSN 2091-2730
61 www.ijergs.org
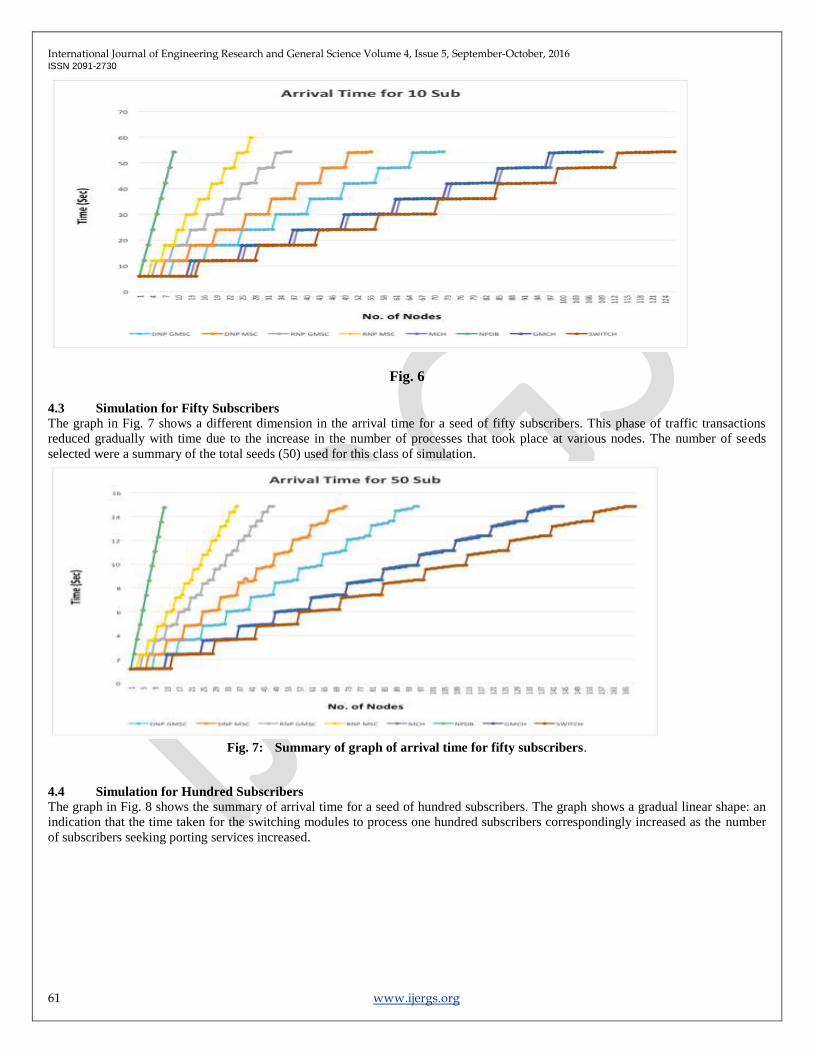
Fig. 6
4.3 Simulation for Fifty Subscribers
The graph in Fig. 7 shows a different dimension in the arrival time for a seed of fifty subscribers. This phase of traffic transactions
reduced gradually with time due to the increase in the number of processes that took place at various nodes. The number of seeds
selected were a summary of the total seeds (50) used for this class of simulation.
Fig. 7: Summary of graph of arrival time for fifty subscribers.
4.4 Simulation for Hundred Subscribers
The graph in Fig. 8 shows the summary of arrival time for a seed of hundred subscribers. The graph shows a gradual linear shape: an
indication that the time taken for the switching modules to process one hundred subscribers correspondingly increased as the number
of subscribers seeking porting services increased.
International Journal of Engineering Research and General Science Volume 4, Issue 5, September-October, 2016 ISSN 2091-2730
62 www.ijergs.org
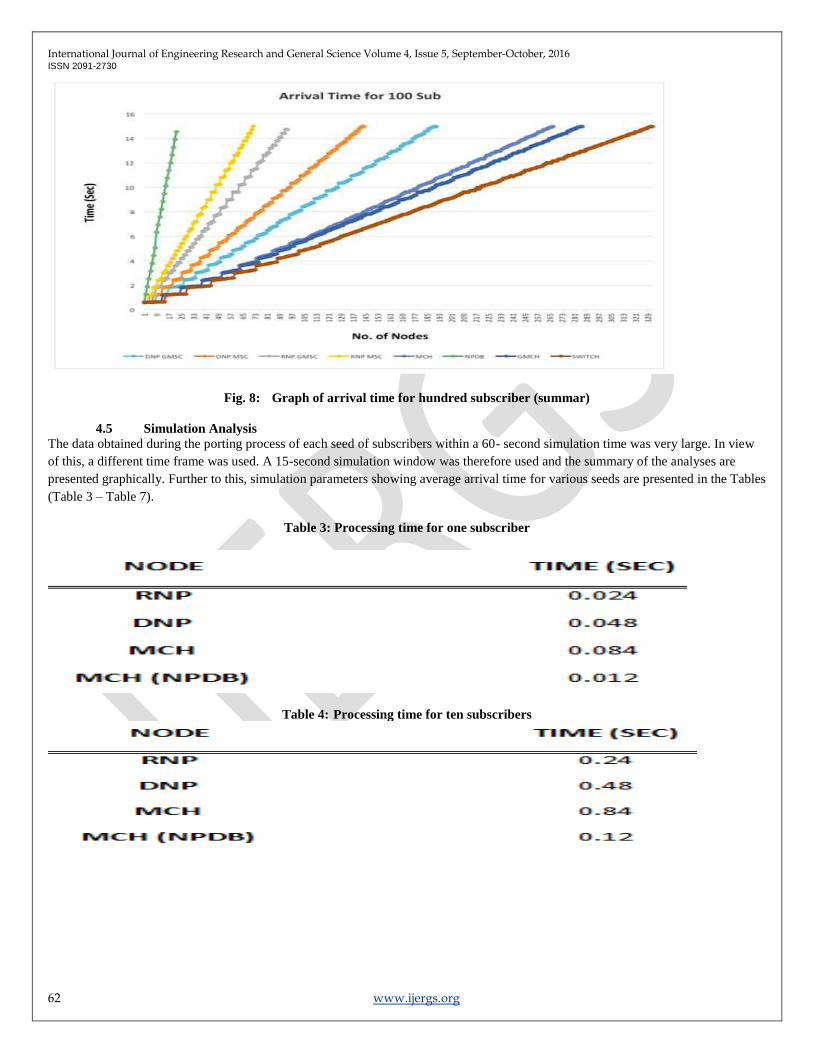
Fig. 8: Graph of arrival time for hundred subscriber (summar)
4.5 Simulation Analysis
The data obtained during the porting process of each seed of subscribers within a 60- second simulation time was very large. In view
of this, a different time frame was used. A 15-second simulation window was therefore used and the summary of the analyses are
presented graphically. Further to this, simulation parameters showing average arrival time for various seeds are presented in the Tables
(Table 3 – Table 7).
Table 3: Processing time for one subscriber
Table 4: Processing time for ten subscribers

International Journal of Engineering Research and General Science Volume 4, Issue 5, September-October, 2016 ISSN 2091-2730
63 www.ijergs.org
Table 5: Processing time for fifty subscribers.
Table 6: Processing time for hundred subscribers.
Figure 9 shows a comparison between the average arrival rates and the average service rate for each seed. Also they show processing
rate at the NPDB for each seed. This graphical presentation takes a closer look at the effect of the porting process when a seed of ten,
fifty and hundred subscribers were ported within a time frame of 15 seconds. This figure also supports the signaling scheme shown in
Figure 5; indicating that increase in the average arrival rate of a network is based on the increase in the number of MNP requests made
by subscribers.
Fig. 9: Comparison of the average arrival rate.

International Journal of Engineering Research and General Science Volume 4, Issue 5, September-October, 2016 ISSN 2091-2730
64 www.ijergs.org
Fig. 10: Comparison of the average service rate.
The service rate is the time allocated by the network to service its subscribers. Figure 10 shows that increase in the number of
subscriber per time (that requested for porting service) has a lesser service rate thanwhen there were fewer subscribers. This is an
indication that service time allocated can deliberately be reduced in order to reduce pressure on the bandwidth configured for real-time
income generating traffic.
Fig. 11: Comparison of the processing rate at NPDB for different seeds
5. CONCLUSION AND RECOMMENDATIONS
5.1 Conclusion
Number portability allows a subscriber to change service provider, geographical location or service type without changing his phone
number. This unique technology has become a mandatory service in many countries in view of its numerous advantages. The aim of
the study is to find out the rate at which traditional services (voice, data, and video) carried out by these network providers shall be
affected if the rate of port number- requests become very high. This is so because of the assumption that all service arrivals are
Poissonian and the service time is exponentially distributed. The performance of the network was therefore measured with respect to
the percentage of the numbers ported as against the average arrival rate, service rate and the processing rate. These variables account
for the switching capacity of a network.
International Journal of Engineering Research and General Science Volume 4, Issue 5, September-October, 2016 ISSN 2091-2730
65 www.ijergs.org
The simulating model was deployed using Packet Tracer tool-kit. The study noted that initiating an MNP request up to completion,
requires the signal passing through many switching nodes, which traditionally are routing nodes for normal services (call, SMS, data,
video). Besides, the study also indicated that MNP request set-up is more complex and has a longer duration than the normal services.
The study revealed that the ported subscribers in Nigeria are still a far cry of what is expected, considering the high subscriber-base in
the country. The study further inferred that since not less than two networks are usually involved in the porting processes and
administration, different signaling protocols, bandwidth capacity and technologies can be involved. Traffic interconnects agreement
between these different operators, existing load levels and deliberate propagation delays created through software configuration are
hindrances to the porting process. The study also noted that since the MNP transactions occupy the same switching ports with the
traditional services, MNP services encounter delay traffic terminations.
This is in view of different routing platforms; which may invariably cause deliberate frustrations from operators with limited
switching capacity; through extension of the processing time, or reduced time allotted for porting services. Besides, the Donor NP can
deliberately create bottle necks in view of the infrastructure involved, losing their subscriber base and depleting their operational
income. The study also noted that congestion becomes the order of the day, as termination of traffic simulated during porting
transaction becomes very slow as the number of seeds increased.
The essence of this exercise is to monitor real-time traffic under a combination of porting numbers and traditional traffic flow. The
exercise indicated congested switching nodes, which is an indication that porting activities will introduce traffic congestion if the
operational channels are not expanded to accommodate high traffic that may be generated through porting regime. Furthermore,
results obtained after the simulation shows that the NPDB is the least used resource in the porting process and has a processing rate of
833msec-1
for 100 subscribers, 1667msec-1
for 50 subscribers and 333msec-1
for 10 subscribers. The service rate of each network was
monitored in a 15sec simulation window. The result also shows that the service rate for 10 subscribers is given as 105.1msec-1
for the
Recipient NP, and 107.9msec-1
for the Donor network; while for 50 subscribers, it is 96.7msec-1
for the Recipient NP and 109.7msec-1
for the Donor NP. Similarly, for 100 subscribers it is 100msec-1
for Recipient NP and 80msec-1
for Donor NP. The Recipient NP has
average arrival rate of 130msec-1
, while the Donor NP is 131msec-1
for 100 subscribers. The Recipient NP average arrival rate of
125.9msec-1
and the Donor NP is 126.3msec-1
for 50 subscribers. Finally, the Recipient NP has average arrival rate of 110.8msec-1
and
the Donor NP is 110.7msec-1
for 10 subscribers. The study collaborates the reasons for the unimpressive performance of the Nigerian
Communications Commission on Number Portability programme in Nigeria.
5.2 RECOMMENDATION
This research work was accomplished with minimum details of the switching nodes involved in traffic carriers for Mobile Network
Portability. This was due to limited data from network operators and NCC; thereby restricting our sources of knowledge to simulation
packages to model a similar traffic scenario. However, further effort should be made to access relevant data from statutory bodies in
view of the importance of the study.
.
REFERENCES:
[1] Fife, E. & Pereira, F. (2002) Socio-economic and cultural factors affecting adoption of broadband access: A cross-country
analysis. Retrieved November 18, 2012 from http://www.marshal.usc.edu/ctm/publications/FITCE2002.pdf.
[2] Bassey, D. E., Okon, B. E. & FaithPraise, F. O. (2016). Design and Construction of a GSM-Based Multipurpose Measuring Device for
UHF Signal Strength Levels. International Journal of Science, Engineering and Technology Research, Vol. 5, Issue 3, pp. 841-846.
[3] Bassey, D. E., R. C. Okoro., J. C. Ogbulezie. (2016). Design Considerations of Different Segments of UHF Wireless Network
in Cross River State, Nigeria. International Journal of Science, Engineering and Technology Research, Vol. 5, Issue 3, pp. 835-840.
[4] Bassey, D. E., Okon, B. E. & Effiom, E. O. (2016). Pilot Case Study of GSM - Network Load Measurement in Ikeja - Nigeria.
International Journal of Science, Engineering and Technology Research, Vol. 5, Issue 3, pp. 824-829.
[5] Bassey, D. E., Ogbulezie, J. C. & Okon, B. E. (2016). Modeling a Low Latency IP Network in Nigeria. International Journal of
Science, Engineering and Technology Research, Vol. 5, Issue 3, pp. 830-834.
[6] Bassey, D. E., Okoro, R. C., Okon, B. E. (2016). Modeling of Radio Waves Transmission of Building Located around Niger Delta
Urban Microcell Environment Using "Ray Tracing Techniques". International Journal of Science and Research, Vol.5, Issue 2, pp.
337-346.
[7] Bassey, D. E., Okoro, R. C., Okon, B. E. (2016). Issues of Variance of Extreme Values in a Heterogenous Teletraffic Environment.
International Journal of Science and Research, Vol. 5, Issue 2, pp. 164-169.
[8] Hart, J., Reed, R., & Bar, F. (1992). The building of the internet: Implications for the future of broadband networks. A journal
of Telecommunications Policy, 16, 666–689.

International Journal of Engineering Research and General Science Volume 4, Issue 5, September-October, 2016 ISSN 2091-2730
66 www.ijergs.org
[9] Bassey, D. E., Okoro, R. C. & Okon, B. E. (2016). Issues Associated with Decimeter Waves Propagation at 0.6, 1.0 and 2.0 Peak
Fresnel Zone Levels. International Journal of Science and Research, Vol. 5, Issue 2, pages 159-163.
[10] Bassey, D. E., Okoro, R. C., Okon, B. E., & Eyime, E. E. (2016). Broadband – Infrastructural Deficit and ICT Growth Potentials in
Cross River State, Nigeria. International Journal of Innovative Research in Computer and Communication Engineering (IJIRCCE),
Vol. 4, Issue 5, pages 8465-8476.
[11] Bassey, D. E & Okon, B. E (2015). Comparative Studies between Reduction of Discrete Frequency Ranges and Radiated Sound
Levels (A Case Study of 50 kVA Diesel Engine Cooling Fan). International Journal of Technology and Research (IJTNR), Vol. 3,
Issue 4, pages 85-92.
[13] Bassey, D. E., Okon, B. E., Faith-Praise, F. O., & Eyime, E. E. (2016). Characterization of Traffic Flow Consumption Pattern and
Subscribers’ Behaviour. International Journal of Innovative Research in Computer and Communication Engineering (IJIRCCE), Vol.
4, Issue 5, pages 8484-8493.
[14] Bassey, D. E., Okon, B. E. & Effiom, E. O. (2016). ‘Broadband Network Penetration and Growth Pattern in North Eastern Part of
Nigeria’. Retrieved September 5, 2016 from http://www.ijser.org/onlineResearchPaperViewer.aspx?Broadband-Network-Penetration-
and-Growth-Pattern-in-North-Eastern-Part-of-Nigeria.pdf
[15] Bassey, D. E., Okon, B. E. & Umunnah, R. (2016). ‘The Security Implications of Virtual Local Area Network (VLAN), Niger Mills,
Calabar, Nigeria’. Retrieved September 5, 2016 from http://www.ijser.org/onlineResearchPaperViewer.aspx?The-Security-
Implications-of-Virtual-Local-Area-Network--VLAN--Niger-Mills--Calabar--Nigeria.pdf
[16] Mason, A. (2011). Assessment of economic impact of wireless broadband in Nigeria. Retrieved January 5, 2013 from
http://serving.webgen.gsm.org/5926DA9A-2DD6-48E7-BAD4-
50D4CD3AF30A/projects/Spectrum/DigitalDividend/DDtoolkit/uploads/assets/downloads/07/wireless-broadband-in-
nigeria.pdf.
[17] Bassey, D. E., Ogbulezie, J. C. & R. Umunnah (2016). Empirical Review of Basic Concepts of Teletraffic Postulates. International
Journal of Scientific & Engineering Research, Volume 7, Issue 3, pages 1171-1186.
[18] Bassey, D. E., Akpan, Aniefiok. O. & Udoeno, E. (2016). UHF Wave Propagation Losses Beyond 40 Percent Fresnel Zone Radius in
South-South Nigeria. International Journal of Science and Research, Volume 5, Issue 2, pages 740-745.
[19] Bassey, D. E., Ogbulezie, J. C. & Effiom, E. O. (2016). Local Area Network (LAN) Mock-up and Prevention of Cybernetics
Related Crimes in Nigermills Company Using Firewall Security Device. International Journal of Scientific & Engineering
Research, Volume 7, Issue 3, pages 1124-1130.
[20] Okon, B. E & Bassey, D. E. (2016). Discrete Frequency Noise Reduction of 100 kVA Diesel Engine Cooling Fan International
Journal of Engineering Research and General Science, Volume 4, Issue 4, pages 414-422.
[21] Ogbulezie, J., Onuu, M., Bassey, D. & Etienam-umoh, S. (2013). Site specific measurements and propagation models for GSM
in three cities in Northern Nigeria. American Journal of Scientific and Industrial Research, vol. 4, Issue 2, pages 238-245.
[22] Okon, B. E., & Umunnah, R. A (2015). Identification of Threats to Communication Security, Effects and Ways of Mitigation the
Threats. International Journal of Scientific & Engineering Research (IJSER), Vol.6, Issue 5 pages. 1219-1235.
[23] Atiya, F. K. (2010). Mobile Number Portability: Challenges and Solutions. Journal Of Emerging Trends In Computing and
Information Sciences.4 (6)2079-8407