international journal of computer science and innovation -vol 2015-n2-paper1
DESCRIPTION
International Journal of Computer Science and Innovation -vol 2015-n2-Paper1TRANSCRIPT
53
International Journal of Computer Science and Innovation
Vol. 2015, no. 2, pp. 53-67
ISSN: 2458-6528
Copyright © Infinity Sciences
On the Performance of Off-Body Links for a Wireless Body Area Network in an Underground
Mining Environment Moulay El Azhari1, Mourad Nedil1, Yassine Salih Alj2, Larbi Talbi3, Ismail Ben Mabrouk3 and
Khalida Ghanem4
1 Underground Communications Research Laboratory UQAT, Val d’Or, Canada 2 School of Science and Engineering (SSE), Al Akhawayn University in Ifrane (AUI), Ifrane, Morocco
3 Department of Computer Science and Engineering, University of Quebec in Outaouais (UQO), Canada 4 Division Architecture des Systèmes, Centre de développement des technologies avancées, Algiers, Algeria
Email: {moulay.el-azhari, mourad.nedil}@uqat.ca, [email protected], [email protected], [email protected], [email protected]
Abstract- The influence of the underground environment on the characteristics of the WBAN (Wireless Body Area Network) channel is considered in this article. Channel characteristics of WBAN are different from those of other wireless channels, especially in the presence of shadowing obstacles at Non-Line-of-Sight (NLOS). Moreover, directive antennas could be used for off-body communications as a mean to minimize the interaction with human body. Hence, in this study, the off-body performance of a single-input single-output (SISO) system was evaluated in Non-Line-of-Sight (NLOS) situations and compared with Line of Sight (LOS) measurements, at the 2.45 GHz band, for two antenna setups. Experimental results of the Rician k-factor, RMS delay spread, and path loss are obtained and discussed from measurements conducted at an underground mine gallery with Patch and Omnidirectional antennas. The results show that the average value of the Rician k-factor generally increases with distance, due to an increased multipath energy losses compared to the LOS energy loss. Moreover, the path loss exponent decreases at NLOS while the path loss values are increased due to human shadowing obstacle. The channel capacity is decreased at NLOS and as we increase the distance, due to the path loss effect. Directivity did not have a significant impact on the channel parameters.
Keywords: SISO; Off-body channel; WBAN; channel capacity; frequency response; impulse response; LOS, NLOS; k-factor.
I. INTRODUCTION
Recent advances in wireless technology have led to the development of wireless body area networks (WBAN). WBAN is a conceptual wireless network technology where a set of communicating devices are located in a distributed sensor network around the human body [1]. Data of vital body parameters and movements is collected and communicated using short-range wireless communication techniques to a close by command station. Wireless Off-body communication is a technology that deals with the communication links between devices mounted on the body, and other devices, or access points, away from the body. It found applications in the industrial, entertainment, sport, and medical fields. Among the examples of this technology are wearable RFID tags and medically oriented body-worn sensors. In off-body links, much precision and attention should be taken in antenna design, placement,
M. El Azhari et al. / International Journal of Computer Science and Innovation
54
and orientation. For optimal off-body communication, the antennas’ radiation patterns should be directed away from the body [2].
Recently, the rising accidents rates in the mining field pushed toward exploring new communication schemes destined to the safety of the miners in such off-body communication scheme. Indeed, the off-body technology has emerged as a promising communication scheme dedicated to the miners’ safety [3-4]. Toxic gases’ levels could be displayed to the miners and vital information could be delivered to the command station, in a timely manner. This allows improving the miners’ safety and health through the fast detection of potential problems which eases the decision making. However, in a mine environment, the reliability of the wireless link is affected by short-term and long-term fading mainly caused by multipath communication, and shadowing [1]. Moreover, the off-body communication link performance depends on the allocated frequency band and the directivity of the transmitter (Tx) and the receiver (Rx) antennas. Hence, a good characterizing study of the off-body channel in a mine environment should explore the effect of directivity and link obstruction at NLOS.
This work focuses on the 2.45 GHz ISM (industrial, scientific and medical) band. This band is suitable for off-body propagation studies [5]. At this frequency, the propagation is due to creeping waves and multipath signals resulting from the reflections at the surrounding environment [6]. Numerous papers in the literature deal with off-body communication systems, for patients’ vital signs monitoring application as well as entertainment applications [1-2]. Moreover, the 2.45 GHz band has been thoroughly investigated for applications in a mine gallery, for regular radio transmission (not involving the human body), using different kinds of antennas such as monopole and patch antennas [7]. In fact, wireless communication systems in an underground environment should be designed to provide reliable services with high throughput [8], bearing in mind that the link capacities are limited by the transmission power and the bandwidth of the radio link [9-10].
In our previous research studies [3-4], the off-body performance was investigated using monopole and patch antennas and a single-antenna setup was considered to assess the path loss, RMS delay spread and channel capacity. However, Rician k-factor was not considered to determine the best distribution that would approximate the corresponding capacity [3-4]. In this paper, k-factor results are presented along with the corresponding test for the best cumulative distribution function (CDF) approximation. Furthermore, the overall results characterizing the off-body channel in terms of the considered Rician k-factor, channel impulse response, path-loss, RMS delay spread and coherence bandwidth, at the 2.45 GHz band, are compared using two-antenna setups exploring the effect of directivity. The link obstruction at NLOS is also discussed and the channel capacity is calculated (assuming a fixed transmitted power) and compared to five usual distributions in order to determine the closest CDF approximation. To ease the reading, the notations in Table 1 were used throughout the paper.
The remainder of the paper is organized as follows. Sec. II describes the measurements setup used to characterize the underground off-body channel and to evaluate the corresponding channel capacity for a WBAN. Sec. III combines the results from the different measurement scenarios to determine and discuss the different channel parameters. Finally, Sec. IV discusses the conclusions and results derived from this study.
Table 1. Nomenclatures for the different configurations.
Configuration Patch Monopole
link LOS NLOS LOS NLOS
nomenclature LOS-P NLOS-P LOS-M NLOS-M
II. MEASUREMENT PROCEDURE FOR OFF-BODY CHANNEL CHARACTERIZATION IN A WBAN
WBAN Channels are classified into four categories (C1~C4), as illustrated in Fig. 1 [5]. These channels are categorized by their device location. The in-body channel (C1) is related to the inside of the body; the C2 channel is related to the surface and inside of the body; the on-body channel (C3) is related to the surface of the body and the off-body channel (C4) is related to off-body communications where the maximum distance is 5 m [1].

M. El Azhari et al. / International Journal of Computer Science and Innovation
55
Figure 1. Illustration of WBAN Channels.
In this paper, the off-body channel is characterized at the 2.45 GHz band and the corresponding measurements
are conducted in a peculiar indoor environment, i.e., an underground gold mine located in Val-d’Or, Quebec, Canada, and managed by the Mining and Mineral Sciences Laboratories-Canadian Center for Minerals and Energy Technology (MMSL-CANMET). The considered underground gallery is located at the 40 m underground level. It stretches over a length about 140 m with a width and height of about 3 m. Photography of the measurement setup in the corresponding underground gallery is shown in Fig. 2.
The mine gallery consists mainly of very rough walls and uneven floor. Cables and pipes are stretched along these walls (near the ceiling). The temperature is maintained at 6 °C, with a humidity level of nearly 100 % throughout the year. There are some water puddles with different dimensions along the gallery and the water dripping through the walls.
Figure 2. Measurement setup in the considered underground gallery.
There is mining machinery few meters away from the measurement’ setup. Metal rods and screens cover the ceiling of the gallery contributing to multipath phenomenon within a dusty environment. The chosen site is an ideal environment to study the LOS and NLOS multipath propagation. The NLOS communication is achieved when the direct propagation path is obstructed by a human subject wearing miner’s outfit, hence emulating the usual human
C2 C1
On-Body / In-Body Off-Body
Body
: Implant
: Non-Implant
C4
C3

M. El Azhari et al. / International Journal of Computer Science and Innovation
56
shadowing activities inside the mine. Fig. 3 illustrates the mining machinery in a gallery near the measurement setup; Fig. 4 depicts a graphic representation of the WBAN system inside a mine.
Figure 3. Mining machinery near the measurement setup.
Figure 4. Representation of the WBAN system in a mine environment.
The process of calibration is necessary to remove the losses introduced by the cables from the measured frequency response S21. Hence, the system calibration is performed at 1 m separation between the transmitter and the receiver. This 1 m Tx-Rx separation do is picked to be the reference distance for the path loss modeling. After the

M. El Azhari et al. / International Journal of Computer Science and Innovation
57
calibration, all the parameters were configured, namely the transmitted power, the frequency range, and the number of points as presented in Table 2.
Figure 5. Illustration of the considered measurement setup.
Table 1. Measurement parameters.
Equipment Parameter Value
VNA (of type Anritsu)
Center frequency
2.45 GHz
Number of points 6401
Sweep time Auto
Calibration Full-2-port
(Tx power = -10 dBm)
Human body
Gender Male
Height 180 cm
Weight 75 kg
Antenna
Type Monopole
Distance to body 5-10 mm
Orientation Head to Head
The measurements campaign aims to investigate the small and the large scale variations in the fading signal. Large-scale channel characterization consists of path loss (PL) and shadowing effect, while the small-scale channel characterization consists of small scale fading which is caused by the multipath propagation. The transmitting

M. El Azhari et al. / International Journal of Computer Science and Innovation
58
antennas were placed at a fixed position in the middle of the mine pathway. The receiving antennas were placed on the right side of the chest of a 1.80 m, 75 kg male subject wearing a miner’s outfit, as seen in Fig. 2. The transmitting and the receiving antenna elements are kept at the same distance from ground. During the measurements, 6 data snapshots were collected at each distance, from a distance of 1 m through 5 m away from the transmitter, as shown in Fig. 5. The transmitting and receiving antennas were connected to the two ports of the previously calibrated vector network analyzer (VNA). At each snapshot, the S21 values were recorded for 6401 frequency samples around the center frequency of 2.45 GHz, as indicated in Table 2. The noise floor for the measurements was considered at -90 dBm, which is considerably higher than the average power for Nyquist Noise, the noise floor for the VNA, and the observed noise floor from the measurements.
III. RESULTS AND DISCUSSION
A. Channel impulse response
The channel impulse response h(t) is acquired using the Inverse Fourier Transform (IFT) of the average of six
measured channel frequency responses (given by the scattering parameter S21). It can be seen that the LOS signal generally carries the highest power among the multipath received signals, when the link is not obstructed. In general, the first arriving multipath signal is highest for the smallest distances and decreases as the Tx-Rx separation increases. Some exceptions to this general result were observed; for example, in NLOS-M, the first arriving multipath component for a Tx-Rx separation of 5 m is higher than that of a Tx-Rx separation of 4 m due to constructive multipath additions. It is also observed that the received signal’ power at LOS is higher than the corresponding NLOS power level for both the monopole and the patch antennas. Figs. 6 and 7 represent the impulse responses for the monopole and the patch antenna setups at the 2 m and 4 m distances.
0 50 100-120
-100
-80
-60
-40Impulse Response at LOS
Time (ns)
Rec
eive
d P
ower
(dB
m)
0 50 100-120
-100
-80
-60
-40Impulse Response at NLOS
Time (ns)
Rec
eive
d P
ower
(dB
m)
TX-RX separation = 2 mTX-RX separation = 4 m TX-RX separation = 2 m
TX-RX separation = 4 m
Figure 6. Impulse responses for Tx-Rx separations of 2 m and 4 m for a monopole antenna.

M. El Azhari et al. / International Journal of Computer Science and Innovation
59
0 50 100-130
-120
-110
-100
-90
-80
-70
-60Impulse Response at LOS
time (ns)
rece
ived
pow
er (d
Bm)
0 50 100-130
-120
-110
-100
-90
-80
-70
-60Impulse Response at NLOS
time (ns)
rece
ived
pow
er (d
Bm)
TX-RX separation = 2 mTX-RX separation = 4 m
TX-RX separation = 2 mTX-RX separation = 4 m
Figure 7. Impulse responses for Tx-Rx separations of 2 m and 4 m for a patch antenna.
B. Rician K-Factor
The Rician k-factor is an indicator of link quality [11], measured as the relative strength of the direct and scattered components of the received signal, as expressed in the following equation [12]:
HvarHε=dBK
210log
2
(1)
Where denotes the mathematical expectation (average) and var(•) refers to the variance of the channel vector H.
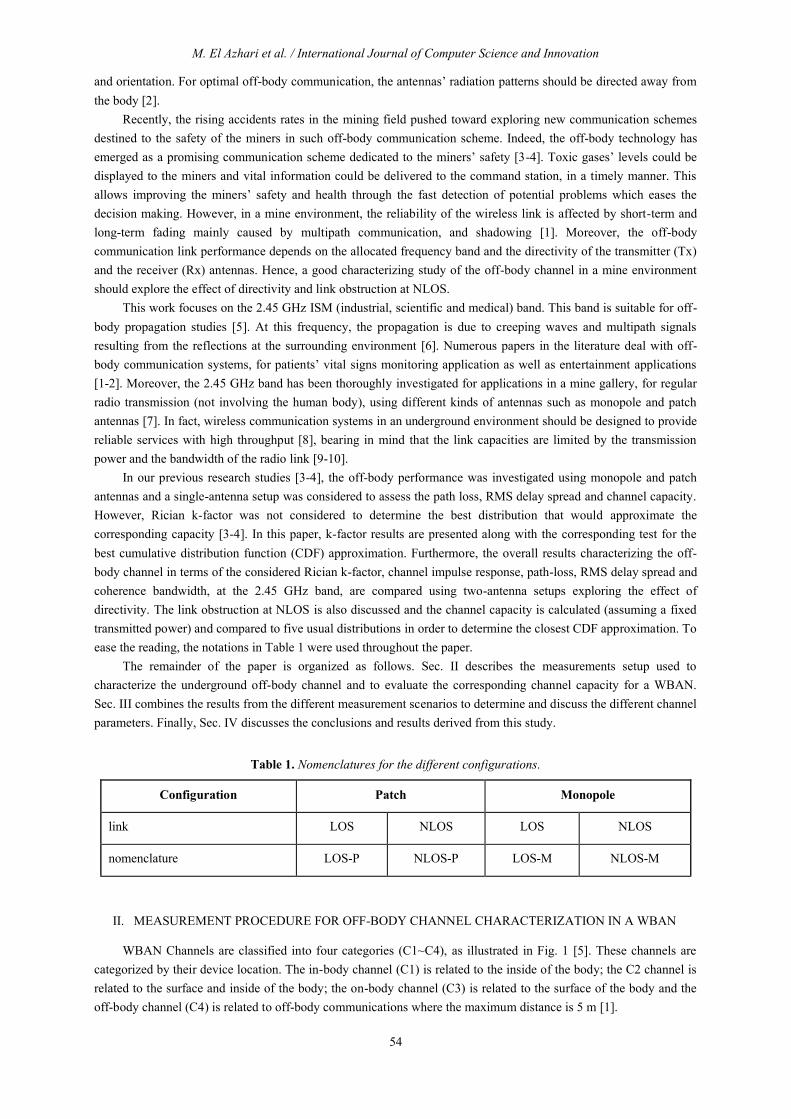
The k-factor was calculated for each distance between Tx and Rx. Fig. 8 shows the Rician k-factor versus Tx-Rx
separation for the monopole antenna setup, and Table 3 shows the k-factor statistics for the monopole and patch
antenna setups. The results show that the Rician k-factor generally increases for the first three distances, decreases
for the 4 m distance, and increase again for the 5 m distance. This is due to the fact that the scattered components
encounter additional reflections against the walls, the ceiling and the floor, as the distance is increased; the additional
reflections correspond to additional losses of multipath energy due to the increased propagation distance. This
decrease in the multipath power (relative to the LOS power) is mitigated at the 4 m distance, due to the specific
geometry of the gallery. Moreover, it is observed that the Rician k-factor for the monopole setup is higher than that
of the patch setup. In fact the monopole antenna has a much larger bandwidth than the patch antenna; hence, the
impulse response of the off-body channel using the patch antenna is wider than that which uses the monopole
antenna as illustrated in Figs. 6 and 7. This means that the powers of the multipath signal (relative to the LOS signal
power) when using the patch antenna are higher than their monopole counterparts, which explains the K-factor
results.
Table 3. Statistics of the k-factor for the off-body channels inside the mine gallery (Minimum, Maximum, average and standard deviation measured values).
Min Max Mean std
k-factor (dB) LOS-M
2.7356 5.9711 4.3024 1.3779
k-factor (dB) LOS-P
-2.4332 -1.2148 -1.9021 0.4762
M. El Azhari et al. / International Journal of Computer Science and Innovation
60
C. Path loss
The path loss is defined as the ratio of the transmitted power to the local average of the received power [7]. It was obtained from the path gains, by averaging over the frequency samples and the different snapshots; it is mathematically represented as follows:
sN
=j
fN
=n
pj
fs
nHNN
=pdPL1 1
10120log (2)
0 1 2 3 4 5 6 7-5
0
5
10 K factor of the measurements
10.log(distance/1m)
K fa
ctor
(dB
)
k factor for LOS-Pk factor for LOS-M
Figure 8. k-factor for the LOS-M off-body channels.
where pdPL is the path loss at the position of p (with Tx-Rx separation d(p)); NS and Nf are the number of the
snapshots and frequency samples, respectively. nH pj denotes the measured S21 for the position p, jth snapshot, and
nth frequency sample [2]. When expressed in terms of the Tx-Rx distance, the path loss is modeled as follows [7]:
X+ddα.log+dPL=dPL dB
0100 10. (3)
where 0dPLdB is the mean path loss at the reference distance 0d , d is the distance where the path loss is
calculated, α is the path loss exponent (determined using least square linear regression analysis), and X is a zero
mean Gaussian variable (in dB) [7].
The path loss results and a linear regression of these values are plotted in Figs. 9 and 10, for both the patch and monopole antennas at the LOS and NLOS situations.

M. El Azhari et al. / International Journal of Computer Science and Innovation
61
0 1 2 3 4 5 6 745
50
55
60
65
70Pathloss of the measurements
10.log(distance/1m)
Pat
hlos
s(dB
)
SISO LOS path loss linear regressionSISO LOS path loss valuesSISO-NLOS path loss linear regressionSISO-NLOS path loss values
Figure 9. Path Loss values and their linear regression for the monopole antenna.
0 1 2 3 4 5 6 740
50
60
70
80
90
100
10.log(distance/1m)
Path
loss
(dB
)
Pathloss of the measurements
SISO-LOS path loss values SISO-NLOS path loss valuesSISO-LOS path loss linear regressionSISO-NLOS path loss linear regression
Figure 10. Path Loss values and their linear regression for the patch antenna.
Table. 4. PL exponent values for the different off-body channel configurations.
Configuration Patch Monopole
Parameters LOS N-LOS LOS N-LOS
PL-exponent 2.48 1.26 2.16 1.19
The path loss exponent α is found to be close to the free-space path-loss exponent (which is equal to 2) for the LOS configurations, for both the monopole and the patch antennas. Hence, the linear regression analysis suggests that the off-body signal decays in LOS with about the same rate as it would decay in free space. The results in Table 4 show that, relative to a LOS scenario, the path loss exponent decreases in NLOS configurations for both monopole and patch antennas. However, the path loss values at NLOS are higher compared to a comparable LOS scenario due to the shadowing effect of the human obstacle. This suggests that the signal is damped slower in NLOS due to constructive multipath power additions. This result is expected because the path loss exponents are typically low for Off-body links in NLOS cases as discussed in [13-15].
M. El Azhari et al. / International Journal of Computer Science and Innovation
62
D. Time dispersion parameters The time dispersion parameters are determined from the power delay profile (PDP), which represents the power
received in the time domain. PDP is determined by calculating the statistical average of the magnitude squared of the
impulse response as follows:
2 PDP(t) th (4)
The RMS delay spread and the coherence bandwidth, shown in Figs. 11 and 12, were determined using equations
(5) and (6) respectively, as follow [16]:
22 ττ=τRMS (5)
where denotes the mean excess delay and 2 is the second moment of the PDP, while the coherence bandwidth
is
RMS
cB51
(6)
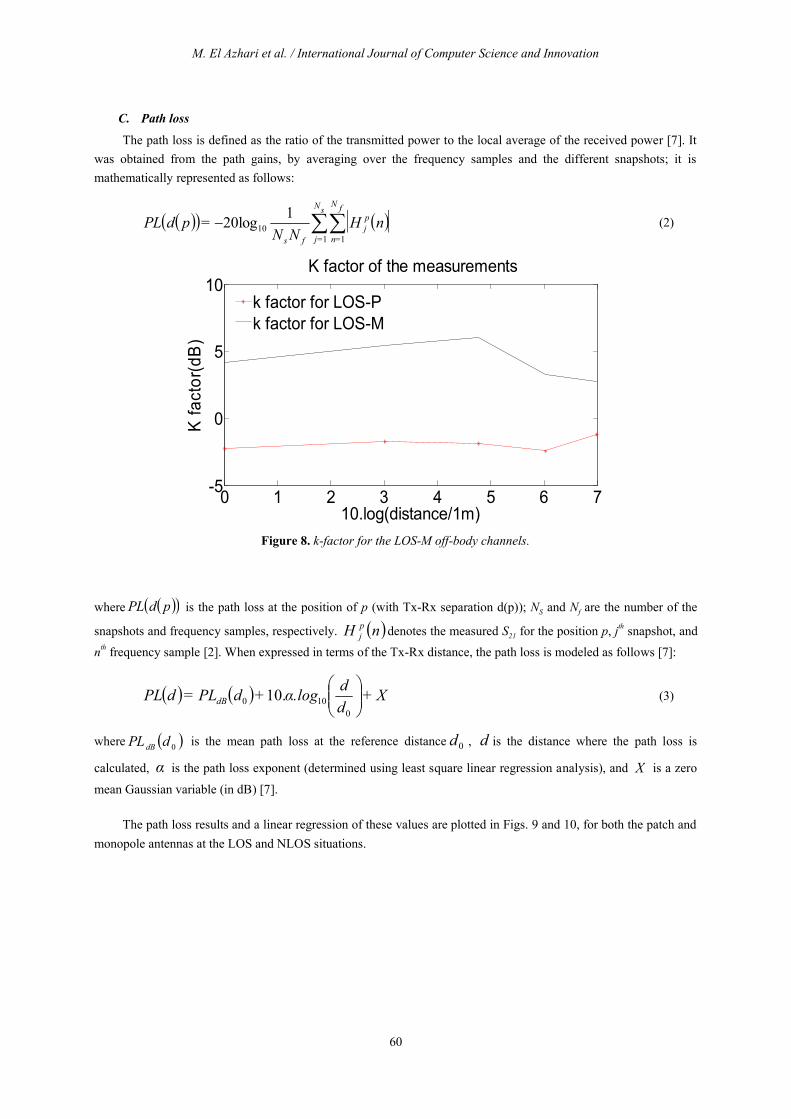
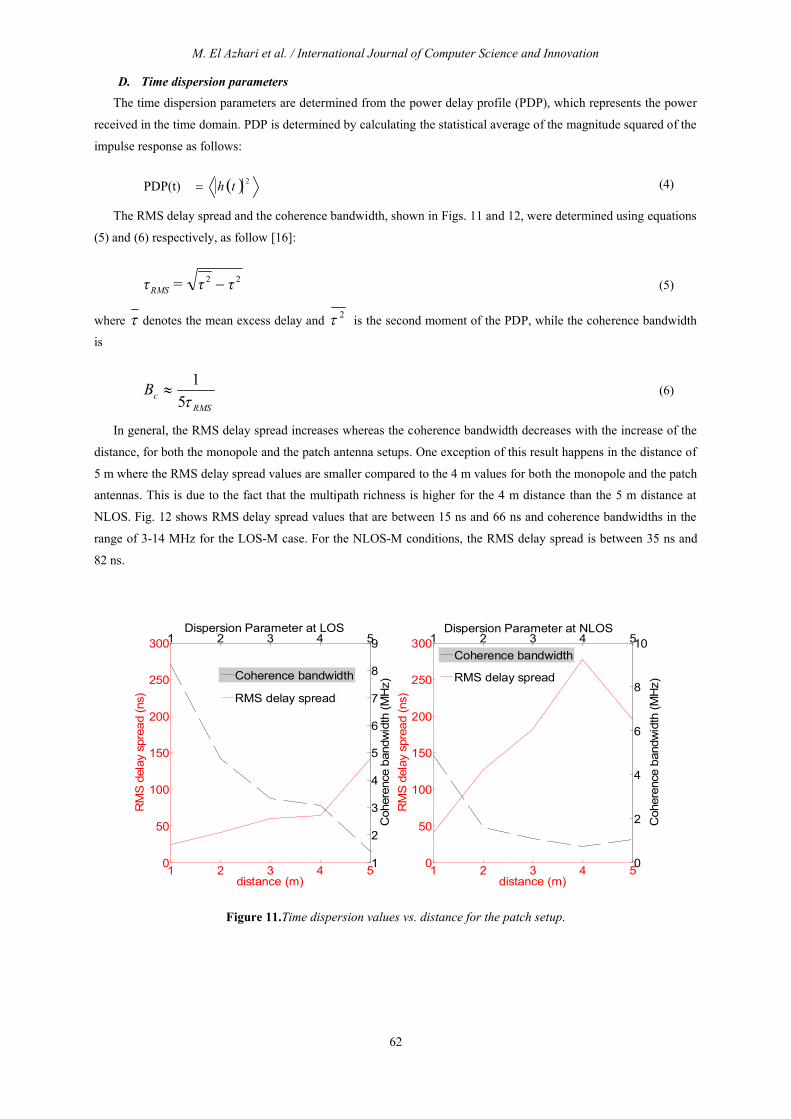
In general, the RMS delay spread increases whereas the coherence bandwidth decreases with the increase of the
distance, for both the monopole and the patch antenna setups. One exception of this result happens in the distance of
5 m where the RMS delay spread values are smaller compared to the 4 m values for both the monopole and the patch
antennas. This is due to the fact that the multipath richness is higher for the 4 m distance than the 5 m distance at
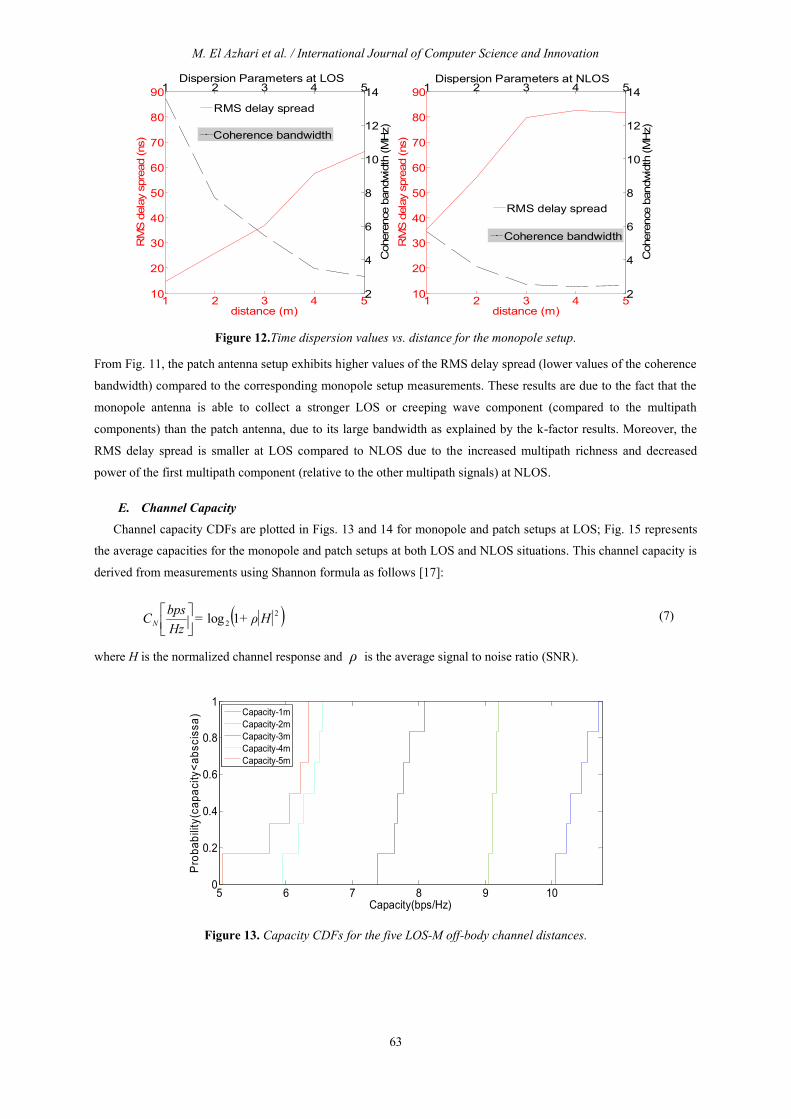
NLOS. Fig. 12 shows RMS delay spread values that are between 15 ns and 66 ns and coherence bandwidths in the
range of 3-14 MHz for the LOS-M case. For the NLOS-M conditions, the RMS delay spread is between 35 ns and
82 ns.
1 2 3 4 50
50
100
150
200
250
300
RM
S de
lay
spre
ad (n
s)
distance (m)
1 2 3 4 5
0
2
4
6
8
10Dispersion Parameter at NLOS
Coh
eren
ce b
andw
idth
(MH
z)
1 2 3 4 50
50
100
150
200
250
300
RM
S de
lay
spre
ad (n
s)
distance (m)
1 2 3 4 5
1
2
3
4
5
6
7
8
9Dispersion Parameter at LOS
Coh
eren
ce b
andw
idth
(MH
z)
Coherence bandwidth
RMS delay spread
RMS delay spread
Coherence bandwidth
Figure 11.Time dispersion values vs. distance for the patch setup.
M. El Azhari et al. / International Journal of Computer Science and Innovation
63
1 2 3 4 510
20
30
40
50
60
70
80
90
RM
S d
elay
spr
ead
(ns)
distance (m)
1 2 3 4 5
2
4
6
8
10
12
14Dispersion Parameters at LOS
Coh
eren
ce b
andw
idth
(MH
z)
1 2 3 4 510
20
30
40
50
60
70
80
90
RM
S d
elay
spr
ead
(ns)
distance (m)
1 2 3 4 5
2
4
6
8
10
12
14Dispersion Parameters at NLOS
Coh
eren
ce b
andw
idth
(MH
z)
RMS delay spread
Coherence bandwidth
RMS delay spread
Coherence bandwidth
Figure 12.Time dispersion values vs. distance for the monopole setup.
From Fig. 11, the patch antenna setup exhibits higher values of the RMS delay spread (lower values of the coherence
bandwidth) compared to the corresponding monopole setup measurements. These results are due to the fact that the
monopole antenna is able to collect a stronger LOS or creeping wave component (compared to the multipath
components) than the patch antenna, due to its large bandwidth as explained by the k-factor results. Moreover, the
RMS delay spread is smaller at LOS compared to NLOS due to the increased multipath richness and decreased
power of the first multipath component (relative to the other multipath signals) at NLOS.
E. Channel Capacity
Channel capacity CDFs are plotted in Figs. 13 and 14 for monopole and patch setups at LOS; Fig. 15 represents
the average capacities for the monopole and patch setups at both LOS and NLOS situations. This channel capacity is
derived from measurements using Shannon formula as follows [17]:
22 1log Hρ+=
HzbpsCN
(7)
where H is the normalized channel response and ρ is the average signal to noise ratio (SNR).
5 6 7 8 9 100
0.2
0.4
0.6
0.8
1
Capacity(bps/Hz)
Prob
abilit
y(ca
paci
ty<a
bsci
ssa)
Capacity-1mCapacity-2mCapacity-3mCapacity-4mCapacity-5m
Figure 13. Capacity CDFs for the five LOS-M off-body channel distances.
M. El Azhari et al. / International Journal of Computer Science and Innovation
64
5 6 7 8 9 10 110
0.2
0.4
0.6
0.8
1
Capacity (bps/Hz)
Pro
babi
lity(
capa
city
< ab
scis
sa)
Capacity-1mCapacity-2mCapacity-3mCapacity-4mCapacity-5m
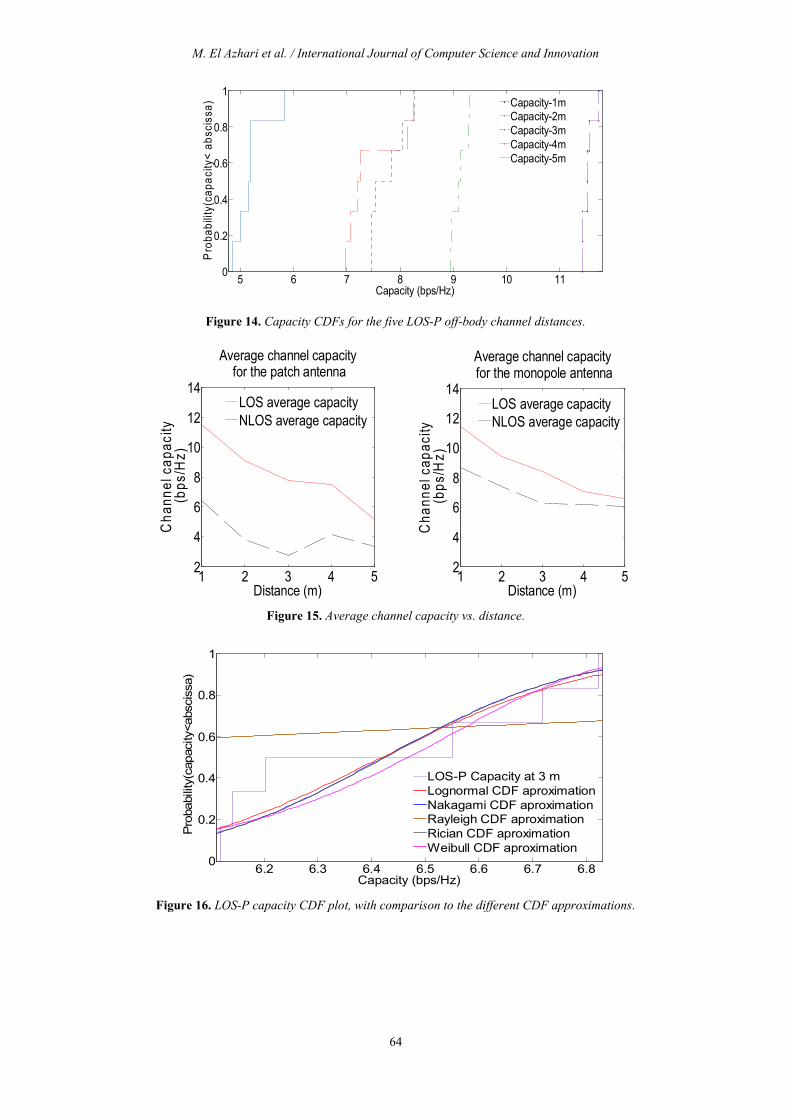
Figure 14. Capacity CDFs for the five LOS-P off-body channel distances.
1 2 3 4 52
4
6
8
10
12
14
Average channel capacity for the patch antenna
Distance (m)
Cha
nnel
cap
acity
(bps
/Hz)
1 2 3 4 52
4
6
8
10
12
14
Average channel capacity for the monopole antenna
Distance (m)
Cha
nnel
cap
acity
(bps
/Hz)
LOS average capacityNLOS average capacity
LOS average capacityNLOS average capacity
Figure 15. Average channel capacity vs. distance.
6.2 6.3 6.4 6.5 6.6 6.7 6.80
0.2
0.4
0.6
0.8
1
Capacity (bps/Hz)
Pro
babi
lity(
capa
city
<abs
ciss
a)
LOS-P Capacity at 3 mLognormal CDF aproximationNakagami CDF aproximationRayleigh CDF aproximationRician CDF aproximationWeibull CDF aproximation
Figure 16. LOS-P capacity CDF plot, with comparison to the different CDF approximations.

M. El Azhari et al. / International Journal of Computer Science and Innovation
65
1.8 1.9 2 2.1 2.2 2.30
0.2
0.4
0.6
0.8
1
capacity (bps/Hz)
Prob
abilit
y(ca
paci
ty <
abs
ciss
a)NLOS-P capacity at 3 m Lognormal CDF approximationNakagami CDF approximationRayleigh CDF approximationRician CDF approximationWeibull CDF approximation
Figure 17. NLOS-P capacity CDF plot, with comparison to the different CDF approximations.
6.55 6.6 6.65 6.7 6.75 6.8 6.85 6.9 6.95 70
0.2
0.4
0.6
0.8
1
Capacity (bps/Hz)
Pro
babi
lity(
capa
city
< a
bsci
ssa)
LOS-M capacity at 3 mLognormal CDF approximationNakagami CDF approximationRayleigh CDF approximationRician CDF approximationWeibull CDF approximation
Figure 18. LOS-M capacity CDF plot, with comparison to the different CDF approximations.
4.2 4.4 4.6 4.8 5 5.2 5.4 5.60
0.2
0.4
0.6
0.8
1
Capacity (bps/Hz)
Pro
babi
lity(
capa
city
< a
bsci
ssa)
NLOS-M capacity at 3 mLognormal CDF approximationNakagami CDF approximationRayleigh CDF approximationWeibull CDF approximationRician CDF approximation
Figure 19. LOS-M capacity CDF plot, with comparison to the different CDF approximations.
The above results show that the channel capacity at a certain probability level decreases with distance at LOS.
This is explained by the fact that the smaller distances correspond to higher received average powers and hence
higher average SNRs which have a direct impact on the capacity as given in (3). Moreover, it is observed that

M. El Azhari et al. / International Journal of Computer Science and Innovation
66
capacity values in NLOS situations are smaller than their corresponding LOS values due to the decay in power
associated with the human shadowing effect. Comparing the channel capacities for the monopole and the patch
setups, it is observed that the NLOS-M capacities are higher than the corresponding NLOS-P capacities. Moreover,
the LOS-M capacities at the 3 m and 5 m distances are higher than their corresponding LOS-P capacities. This is due
to the ability of the monopole antenna, which has a broad bandwidth, to efficiently capture the LOS signal. Hence,
the directivity of the patch antenna is only favorable at the smaller LOS distances, where the LOS component’ power
is considerably large due to the efficient Tx-Rx alignment.
The different configurations’ capacity CDFs at the 3 m distance were compared to several CDF approximations as illustrated in Figs. 16-19. The most accurate approximations for both the LOS-P and LOS-M are the Rice and the Nakagami distributions. For the NLOS-P, the Rician and lognormal distributions best describe the capacity CDF of the measurements. Finally, for the NLOS-M, the Nakagami and Rician distribution best approximate the capacity CDF of the measurements. Furthermore, the Rayleigh distribution, which usually characterizes the radio channels’ fading, does not characterize the patch nor monopole capacity distributions. This is due to the fact that the Rayleigh fading is not valid for WBAN distributions due to the presence of a strong direct link [10], which is established with LOS or creeping wave communications. In these conditions, the Rician distribution usually characterizes the WBAN channel, which explains the results.
IV. CONCLUSION
In this paper, the off-body channel was characterized at 2.45 GHz for a WBAN in a mine gallery using patch and monopole antennas considering LOS and NLOS situations. It can be noted that the k-factor is not as high as expected in a short range line-of-sight (LOS) communication. This may be due to the presence of the human body involving creeping wave signals that attenuate more rapidly compared to the free space propagation. It was also observed that the path-loss exponent decreases in NLOS situations compared to a corresponding LOS situation for both monopole and patch antenna setups, due to constructive multipath combining. The monopole antenna setup exhibit lower values of the RMS delay spread compared to their corresponding patch setup’ RMS delay spread values. This is due to the fact that the monopole antenna (which has a large beam width) is able to collect the LOS or the creeping wave component better than the patch antenna. The RMS delay spread is higher at NLOS situations compared to a LOS situation for both antenna setups. This is due to the fact that the multipath powers increases (compared to the first arriving multipath signal’ power) at NLOS. The Rician K-factor further emphasizes the time dispersion results (at LOS) with values generally increasing (except for the 4 m distance) due to the increased reflections through walls and ceiling. The channel capacities decrease with distance for both LOS-M and LOS-P, due to the path loss effect. At NLOS, the multipath richness did not overcome the shadowing of the LOS component, and hence the capacity is lower than that of a corresponding LOS situation. The NLOS-M capacities are higher than the corresponding NLOS-P capacities, because of the efficiency of the monopole antenna in capturing the LOS or the creeping wave signals. For both LOS and NLOS configurations, the Rician ditribution approximate the CDF of the measurements (at the 3 m distance), due to the presence of either a strong LOS component or a strong creeping wave signal. Although both the patch and the monopole results are accepteble for underground communications, the channel parametters using the monopole setups are better than the corresponding patch setup parametters in most situations. The mine environment favors the use of the monopole antenna more than the patch antenna for off-body communications at the 2.45 GHz band. We conclude that an in-mine off-body system at 2.45 GHz destined to improve the security of the miners should use monopole antennas rather than the patch antennas.
REFERENCES
[1] HAN, Sang-Hun et PARK, Sang Kyu. Performance analysis of wireless body area network in indoor off-body communication. Consumer Electronics, IEEE Transactions on, 2011, vol. 57, no 2, p. 335-338.
[2] SHEIKH, Sharif I. Mitu, ABU-AL-SAUD, W., et NUMAN, A. B. Directive Stacked Patch Antenna for UWB Applications. International Journal of Antennas and Propagation, 2013, vol. 2013.
M. El Azhari et al. / International Journal of Computer Science and Innovation
67
[3] EL AZHARI, Moulay, NEDIL, Mourad, SALIH ALJ, Yassine, et al. Off-body LOS and NLOS channel characterization in a mine environment. In : Electrical and Information Technologies (ICEIT), 2015 International Conference on. IEEE, 2015. p. 114-118.
[4] EL-AZHARI, H. M., NEDIL, Mourad, BEN MABROUK, Ismail, et al. Off-body channel characterization at 2.45 GHz in underground mine environment. In : Antennas and Propagation Society International Symposium (APSURSI), 2014 IEEE. IEEE, 2014. p. 251-252.
[5] Opening Report for the TG6 session in Aug 2008, IEEE 802.15 P08-0576-00-0006. [6] KHAN, Imdad, HALL, Peter S., SERRA, Andrea, et al. Diversity performance analysis for on-body
communication channels at 2.45 GHz. Antennas and Propagation, IEEE Transactions on, 2009, vol. 57, no 4, p. 956-963.
[7] BEN MABROUK, Ismail, TALBI, Larbi, NEDIL, Mourad, et al. MIMO-UWB channel characterization within an underground mine gallery. Antennas and Propagation, IEEE Transactions on, 2012, vol. 60, no 10, p. 4866-4874.
[8] SALIH-ALJ, Yassine, DESPINS, Charles, et AFFES, Sofiene. Design considerations for an UWB computationally-efficient fast acquisition system for indoor line-of-sight ranging applications. Wireless Communications, IEEE Transactions on, 2011, vol. 10, no 8, p. 2776-2784.
[9] VAN TORRE, Patrick, VALLOZZI, Luigi, ROGIER, Hendrik, et al. Reliable MIMO communication between firefighters equipped with wearable antennas and a base station using space-time codes. In : Antennas and Propagation (EUCAP), Proceedings of the 5th European Conference on. IEEE, 2011. p. 2690-2694.
[10] KHAN, Imdad, HALL, Peter S., SERRA, Andrea, et al. Diversity performance analysis for on-body communication channels at 2.45 GHz. Antennas and Propagation, IEEE Transactions on, 2009, vol. 57, no 4, p. 956-963.
[11] TEPEDELENLIO LU, Cihan, ABDI, Ali, et GIANNAKIS, Georgios B. The Ricean K factor: estimation and performance analysis. Wireless Communications, IEEE Transactions on, 2003, vol. 2, no 4, p. 799-810.
[12] SARRIS, Joannis et NIX, Andrew R. Ricean K-factor measurements in a home and an office environment in the 60 GHz band. In : Mobile and Wireless Communications Summit, 2007. 16th IST. IEEE, 2007. p. 1-5.
[13] CLAVIER, M. Laurent. Contributions to Cooperative Localization Techniques within Mobile Wireless Body Area Networks. 2013. Thèse de doctorat. Orange Labs.
[14] ROSINI, Ramona et D'ERRICO, Raffaele. Off-body channel modelling at 2.45 ghz for two different antennas. In : Antennas and Propagation (EUCAP), 2012 6th European Conference on. IEEE, 2012. p. 3378-3382.
[15] DENIS, B., AMIOT, Nicolas, UGUEN, Bernard, et al. Qualitative Analysis of RSSI Behavior in Cooperative Wireless Body Area Networks for Mobility Detection and Navigation Applications. In : Electronics, Circuits and Systems (ICECS), 2014 21st IEEE International Conference on. IEEE, 2014. p. 834-837.
[16] RAPPAPORT, Theodore S. Mobile radio propagation: small scale fading and multipath. Wireless Communications Principles and Practice, 2nd Ed. Prentice Hall, 2001.
[17] INANOGLU, Hakan. Multiple-Input Multiple-Output System Capacity: Antenna and Propagation Aspects. Antennas and Propagation Magazine, IEEE, 2013, vol. 55, no 1, p. 253-273.