international journal of chemtech research - …2697-2710)v7n6.pdf · vol.7, no.6, pp 2697-2710,...
TRANSCRIPT
International Journal of ChemTech Research CODEN (USA): IJCRGG ISSN: 0974-4290
Vol.7, No.6, pp 2697-2710, 2014-2015
Response surface modeling of polyacrylamide redox polymerization
Khai Ern Lee1*, Thian Lai Goh2, Norbert Simon2
1Research Centre for Sustainability Science & Governance (SGK), Institute for
Environment and Development (LESTARI) Universiti Kebangsaan Malaysia 43600 UKM Bangi, Selangor, Malaysia
2 School of Environment and Natural Resources Sciences, Faculty of Science and Technology Universiti Kebangsaan Malaysia 43600 UKM Bangi, Selangor, Malaysia
Abstract: Polyacrylamide was obtained through redox polymerization in a single batch
reactor. Redox initiators, consisting of ammonium persulphate and sodium bisulfite, were
applied in initiating the redox polymerization. Response surface methodology (RSM) was
used to optimize the polymerization process. Four design parameters i.e. temperature,
concentrations of acrylamide, ammonium persulphate and sodium bisulfite were taken into
account for optimization. An empirical model was constructed in terms of related significant
design parameters to describe the polyacrylamide conversion (%) as the response. Based on
the response surface plots and analysis of variance (ANOVA), optimum redox
polymerization obtained was: 1.0335M acrylamide, 5x10⁻⁴
M ammonium persulphate and
1x10⁻⁴
M sodium bisulfite under 65oC, producing 96.89% of polyacrylamide in 10 minutes.
FT-IR, GPC and TEM analysis were carried out to investigate the changes of chemical
functional groups and molecular structure during the conversion of acrylamide to
polyacrylamide. The weight average molecular weight of the polyacrylamide produced was
1.66 x 10⁶ Da. Vinyl group, which existed in acrylamide FT-IR spectra,
disappeared during
the conversion of acrylamide into polyacrylamide, and it was replaced by a new alkyl group.
The viscosity of aqueous polyacrylamide solution increased with the concentration.
Polyacrylamide was observed in linear tree-roots-like structure under TEM viewing. Keywords: Polyacrylamide, optimization, redox polymerization, response surface
methodology.
Introduction
The production of polyacrylamide has received extensive attention due to their wide applications in
wastewater treatment1,2,3,4,5,6,7,8,9
. Redox polymerization is one of the effective methods used in polymerizing
acrylamide. This method requires lower activation energy compared to that of thermal polymerization. It is able
to produce a high molecular weight polymer with high yield10,11
.
One problem associated with this redox polymerization technique is the determination of the optimal
condition of the process which will produce the highest yield. There are many factors that have to be optimized;
amongst them are concentration of monomer, concentration of the redox initiators and temperature. The
conventional method of determining the best condition was by using the univariate method whereby the
experiment was carried out by varying one factor while keeping all other factors fixed at a specific set of
conditions12
. However, the shortcomings of this single-dimensional analysis method were that they were
laborious and, time and resource consuming; and the real optimal range may not be obtained, since the
interactions between factors were not considered. In order to overcome these shortcomings, response surface
Khai Ern Lee et al /Int.J. ChemTech Res.2014-2015,7(6),pp 2697-2710. 2698
methodology (RSM) is proposed to be employed in this study. RSM is a collection of mathematical and
statistical techniques that is used to investigate the effects of several design parameters at different levels as
well as their interactions simultaneously13
. RSM has been proven to be an effective technique to determine the
optimal operating condition, by evaluating the effects of several design parameters and their interactions on the
responses with a limited number of planned experiments12,14
. Therefore, it is extensively used for scientific and
technical application optimization in applied chemistry and physics, biochemistry and biological, chemical
engineering and environmental protection14,15,16,17
.
In this research, central composite design, which is one of the standard designs in RSM, was used to
determine the optimum redox polymerization condition for polyacrylamide. Four design parameters:
temperature, concentrations of acrylamide, ammonium persulphate and sodium bisulfite, were taken into
account as the independent variables while polyacrylamide conversion (%) was the response (dependent
variable). The experimental output was analyzed using Minitab 14 software. The optimal redox polymerization
condition was determined at the highest percentage conversion of polyacrylamide. An empirical model was
constructed based on the related significant independent terms and their interactions to describe the response
surface. The fitness of the proposed model was then determined using analysis of variance (ANOVA). The
constructed response surface model was used to determine the optimal condition.The optimized polyacrylamide
was characterized using FT-IR, GPC and TEM to investigate the changes of chemical and molecular structure
during the conversion of acrylamide to polyacrylamide. Molecular weight and solution viscosity of the
optimized polyacrylamide were also studied.
Experimental
Materials
Acrylamide (AM) (>99% purity, Merck) was used without further purification. Ammonium persulphate
(AR, Systerm) and sodium bisulfite (GR, Acros Organics) were used as redox initiators. Deioinized water was
used throughout the experiment.
Redox polymerization
Acrylamide was polymerized using a single batch reactor consisting of a 500 mL three-necked reaction
flask equipped with a reflux condenser, a thermostatic stirring water bath and an oxygen-free-nitrogen gas inlet.
Acrylamide solution with concentrations of 0.64 M – 1.12 M were transferred into the reaction flask and
thoroughly stirred. Oxygen-free-nitrogen gas was purged into the acrylamide solution for 10 minutes to
deoxygenate the solution. The temperature of the thermostatic stirring water bath was controlled to attain
equilibrium temperatures (45oC – 65
oC) before the redox polymerization took place. To initiate the redox
polymerization, certain concentrations of ammonium persulphate (1x10⁻⁴
M – 5x10⁻⁴
M) and sodium bisulfate
(4x10⁻⁵
M – 8x10⁻⁵
M) were injected into the acrylamide solution. The redox initiation system follows the
reactions10,11
:
S2O82-
+ HSO3- SO4
2- + SO4
-· + HSO3· (1)
The addition of reducing agent (sodium bisulfite) in the initiation system helps in decomposing
ammonium persulphate into persulphate ion. Hence, the radical formation and polymerization process can be
accelerated10
. Redox polymerization was carried out for 10 minutes after the redox initiator couple have been
injected into the acrylamide solution. The polymerization process was terminated after 10 minutes of
polymerization. The polymerized acrylamide solution was precipitated with cold acetone to obtain
polyacrylamide. The precipitated polyacrylamide was separated by filtration and dried in an oven at 150oC until
it attained a constant weight. The conversion was determined through the following equations:
(2)
Experimental design and analysis
Central composite design (CCD) which is one of the standard designs of RSM was employed in
optimizing polyacrylamide redox polymerization18
. The design parameters are usually described in different
units and different limits of variation. The significance of the design parameters on response is then compared
after they are coded. In CCD, design parameters were coded as xi where x1 represents concentration of
Khai Ern Lee et al /Int.J. ChemTech Res.2014-2015,7(6),pp 2697-2710. 2699
acrylamide, x2 represents concentration of ammonium persulphate, x3 represents concentration of sodium
bisulfite and x4 represents polymerization temperature. The real values of the design parameters, shown in Table
1, were determined through the following equation:
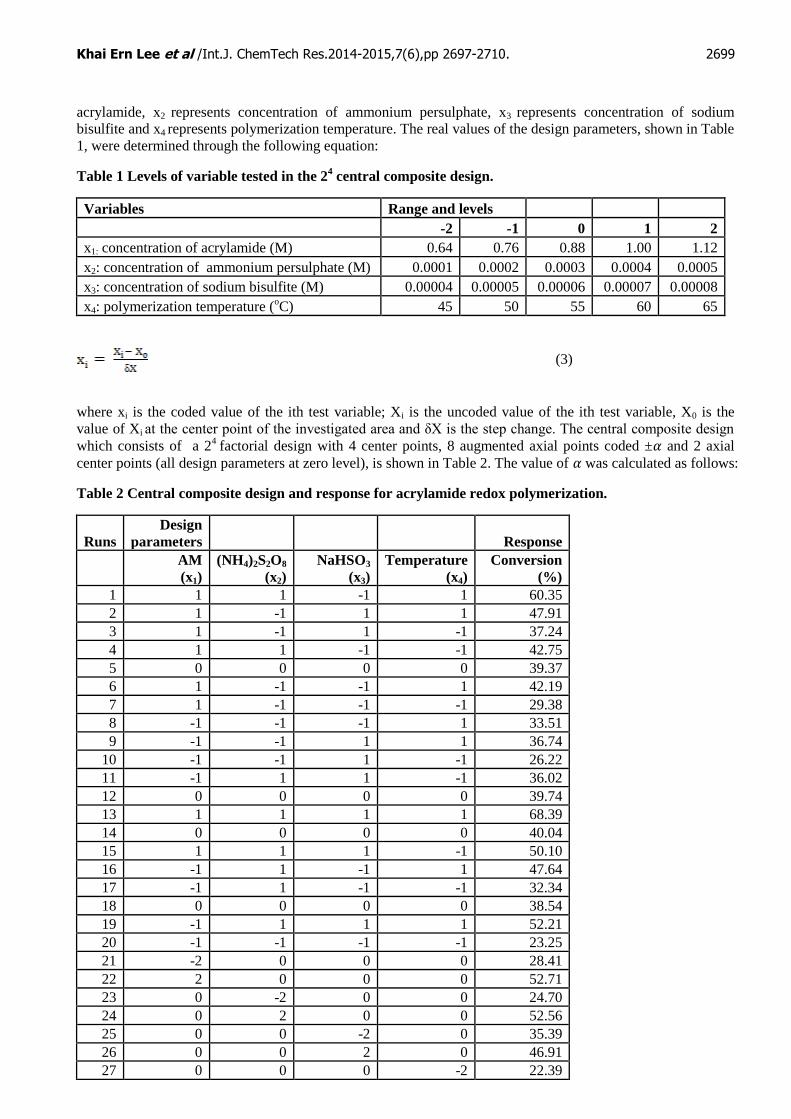
Table 1 Levels of variable tested in the 24 central composite design.
Variables Range and levels
-2 -1 0 1 2
x1: concentration of acrylamide (M) 0.64 0.76 0.88 1.00 1.12
x2: concentration of ammonium persulphate (M) 0.0001 0.0002 0.0003 0.0004 0.0005
x3: concentration of sodium bisulfite (M) 0.00004 0.00005 0.00006 0.00007 0.00008
x4: polymerization temperature (oC) 45 50 55 60 65
(3)
where xi is the coded value of the ith test variable; Xi is the uncoded value of the ith test variable, X0 is the
value of Xi at the center point of the investigated area and δX is the step change. The central composite design
which consists of a 24
factorial design with 4 center points, 8 augmented axial points coded ±𝛼 and 2 axial
center points (all design parameters at zero level), is shown in Table 2. The value of 𝛼 was calculated as follows:
Table 2 Central composite design and response for acrylamide redox polymerization.
Runs Design
parameters Response
AM
(x1) (NH4)2S2O8
(x2) NaHSO3
(x3) Temperature
(x4) Conversion
(%)
1 1 1 -1 1 60.35
2 1 -1 1 1 47.91
3 1 -1 1 -1 37.24
4 1 1 -1 -1 42.75
5 0 0 0 0 39.37
6 1 -1 -1 1 42.19
7 1 -1 -1 -1 29.38
8 -1 -1 -1 1 33.51
9 -1 -1 1 1 36.74
10 -1 -1 1 -1 26.22
11 -1 1 1 -1 36.02
12 0 0 0 0 39.74
13 1 1 1 1 68.39
14 0 0 0 0 40.04
15 1 1 1 -1 50.10
16 -1 1 -1 1 47.64
17 -1 1 -1 -1 32.34
18 0 0 0 0 38.54
19 -1 1 1 1 52.21
20 -1 -1 -1 -1 23.25
21 -2 0 0 0 28.41
22 2 0 0 0 52.71
23 0 -2 0 0 24.70
24 0 2 0 0 52.56
25 0 0 -2 0 35.39
26 0 0 2 0 46.91
27 0 0 0 -2 22.39

Khai Ern Lee et al /Int.J. ChemTech Res.2014-2015,7(6),pp 2697-2710. 2700
28 0 0 0 2 51.72
29 0 0 0 0 38.64
30 0 0 0 0 37.97
𝛼 = (4)
where n is the number of design parameters. Considering that there are 4 design parameters in this study,
therefore 𝛼 is 2.
Polyacrylamide conversion (%) was used as the dependent response fitted by a second-order model in
the form of quadratic polynomial equation:
(5)
The approximation for the true functional relationship between the acrylamide redox polymerization
conversion (%) and the set of independent design parameters are determined where is the offset term, is
the linear effect, is the squared effect, represents the interaction effect, xi are the coded variables and ε
represents error18
.
The response and its corresponding analysis on the variations were analyzed with Minitab 14 statistical
software to determine the effects of the design parameters, their interactions as well as statistical parameters of
the model. The effects of the independent design parameters on the response were illustrated by three-
dimensional surface plots and the optimized redox polymerization condition was obtained from the plots.
ANOVA was used to analyze the response and the empirical model was constructed based on the significant
terms with p<0.05. The quality of fit of the model was expressed by least square technique. To determine the
adequacy of the proposed model, a validation test involving diagnostic plot of predicted response versus
experimental response was carried out.
Fourier Transform Infrared (FT-IR) spectra analysis
The presence of various chemical functional groups and their changes were monitored using Avatar 360
FT-IR spectrophotometer. Acrylamide and polyacrylamide were prepared into platlets using potassium bromide.
The platlets were tested after completion of the blank spectrum scanning. The FT-IR spectrophotometer was
operated with a resolution of 4 cm-1
and scanning range from 4000 to 400 cm-1
. The chemical functional groups
of acrylamide and polyacrylamide were determined based on the wavenumbers obtained from the FT-IR spectra.
Molecular weight distribution determination
Molecular weight of the polyacrylamide was determined using Waters 2414 Gel Permeation
Chromatography (GPC), a differential refractive index meter as a detector and a series of Waters Ultrahydrogel
columns (Linear, 500 and 120). Water was used as the mobile phase, and polyethylene oxide standards were
employed for calibration. The polyacrylamide sample was dissolved in deionized water at the concentration of
0.1 % by weight. The aqueous sample was filtered through a 0.45 μm syringe filter prior to being injected into
the GPC system. A 20 μL of sample was injected into the system with a flow rate of 1.0 mL/min and the
temperature of the columns was kept constant at 40oC in a column oven. The data collected was processed by
Breeze software.
Intrinsic viscosity and solution viscosity measurement
Polyacrylamide solution was prepared by dissolving a known weight of polyacrylamide powder in
deionized water as solvent. The polyacrylamide solution was agitated to ensure complete dissolution. For each
concentration, the flow time of the solution was measured4. Specific viscosity of polyacrylamide solution was
determined using an Ubbelohde viscometer in thermostatic water bath at 30oC. Intrinsic viscosity [η] of
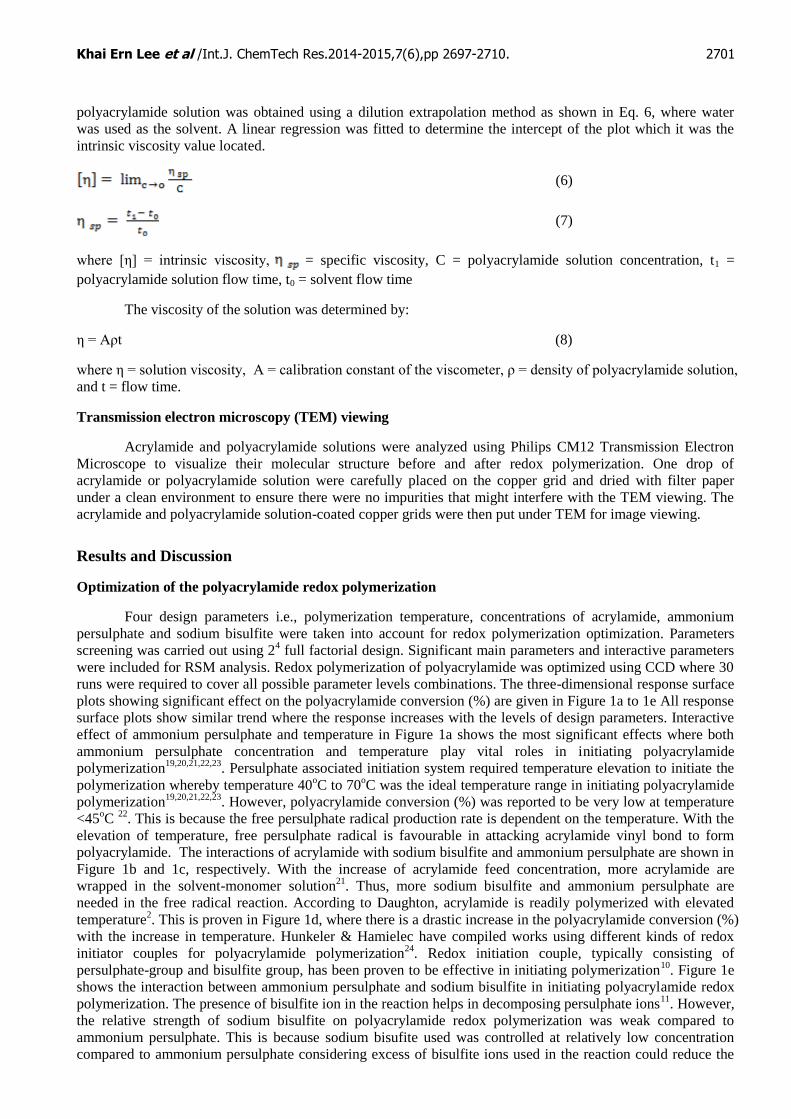
Khai Ern Lee et al /Int.J. ChemTech Res.2014-2015,7(6),pp 2697-2710. 2701
polyacrylamide solution was obtained using a dilution extrapolation method as shown in Eq. 6, where water
was used as the solvent. A linear regression was fitted to determine the intercept of the plot which it was the
intrinsic viscosity value located.
(6)
(7)
where [η] = intrinsic viscosity, = specific viscosity, C = polyacrylamide solution concentration, t1 =
polyacrylamide solution flow time, t0 = solvent flow time
The viscosity of the solution was determined by:
η = Aρt (8)
where η = solution viscosity, A = calibration constant of the viscometer, ρ = density of polyacrylamide solution,
and t = flow time.
Transmission electron microscopy (TEM) viewing
Acrylamide and polyacrylamide solutions were analyzed using Philips CM12 Transmission Electron
Microscope to visualize their molecular structure before and after redox polymerization. One drop of
acrylamide or polyacrylamide solution were carefully placed on the copper grid and dried with filter paper
under a clean environment to ensure there were no impurities that might interfere with the TEM viewing. The
acrylamide and polyacrylamide solution-coated copper grids were then put under TEM for image viewing.
Results and Discussion
Optimization of the polyacrylamide redox polymerization
Four design parameters i.e., polymerization temperature, concentrations of acrylamide, ammonium
persulphate and sodium bisulfite were taken into account for redox polymerization optimization. Parameters
screening was carried out using 24 full factorial design. Significant main parameters and interactive parameters
were included for RSM analysis. Redox polymerization of polyacrylamide was optimized using CCD where 30
runs were required to cover all possible parameter levels combinations. The three-dimensional response surface
plots showing significant effect on the polyacrylamide conversion (%) are given in Figure 1a to 1e All response
surface plots show similar trend where the response increases with the levels of design parameters. Interactive
effect of ammonium persulphate and temperature in Figure 1a shows the most significant effects where both
ammonium persulphate concentration and temperature play vital roles in initiating polyacrylamide
polymerization19,20,21,22,23
. Persulphate associated initiation system required temperature elevation to initiate the
polymerization whereby temperature 40oC to 70
oC was the ideal temperature range in initiating polyacrylamide
polymerization19,20,21,22,23
. However, polyacrylamide conversion (%) was reported to be very low at temperature
<45oC
22. This is because the free persulphate radical production rate is dependent on the temperature. With the
elevation of temperature, free persulphate radical is favourable in attacking acrylamide vinyl bond to form
polyacrylamide. The interactions of acrylamide with sodium bisulfite and ammonium persulphate are shown in
Figure 1b and 1c, respectively. With the increase of acrylamide feed concentration, more acrylamide are
wrapped in the solvent-monomer solution21
. Thus, more sodium bisulfite and ammonium persulphate are
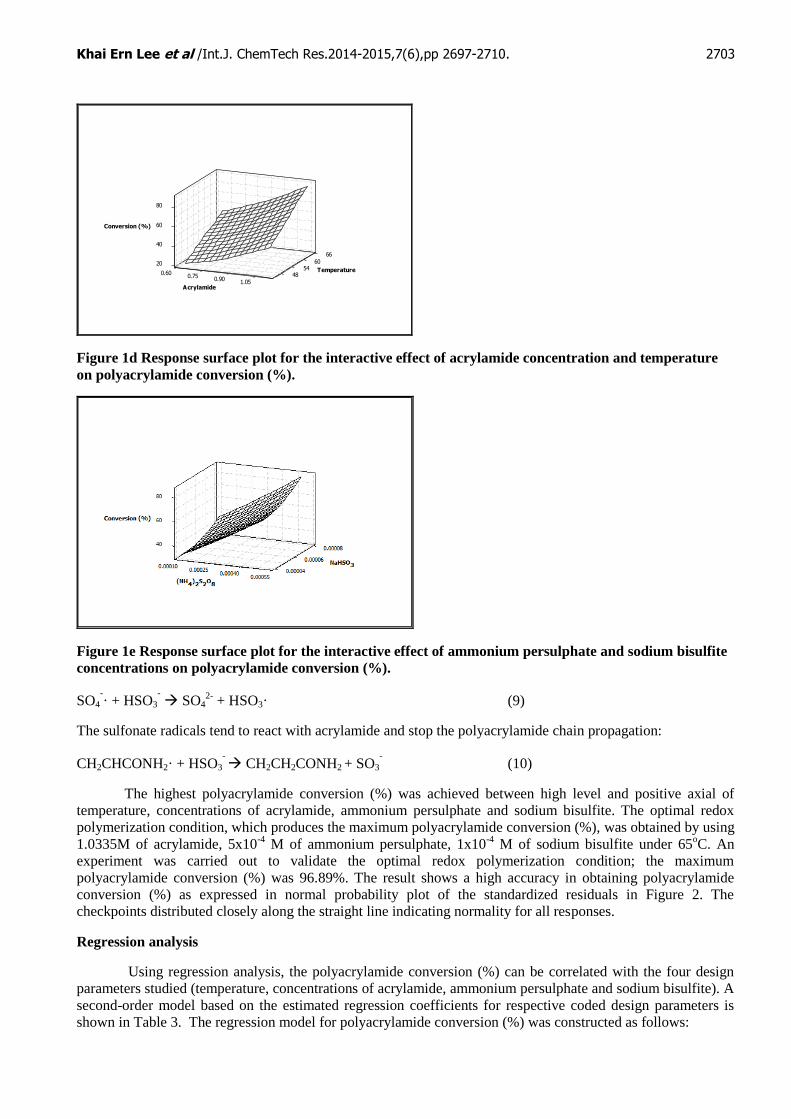
needed in the free radical reaction. According to Daughton, acrylamide is readily polymerized with elevated
temperature2. This is proven in Figure 1d, where there is a drastic increase in the polyacrylamide conversion (%)
with the increase in temperature. Hunkeler & Hamielec have compiled works using different kinds of redox
initiator couples for polyacrylamide polymerization24
. Redox initiation couple, typically consisting of
persulphate-group and bisulfite group, has been proven to be effective in initiating polymerization10
. Figure 1e
shows the interaction between ammonium persulphate and sodium bisulfite in initiating polyacrylamide redox
polymerization. The presence of bisulfite ion in the reaction helps in decomposing persulphate ions11
. However,
the relative strength of sodium bisulfite on polyacrylamide redox polymerization was weak compared to
ammonium persulphate. This is because sodium bisufite used was controlled at relatively low concentration
compared to ammonium persulphate considering excess of bisulfite ions used in the reaction could reduce the
Khai Ern Lee et al /Int.J. ChemTech Res.2014-2015,7(6),pp 2697-2710. 2702
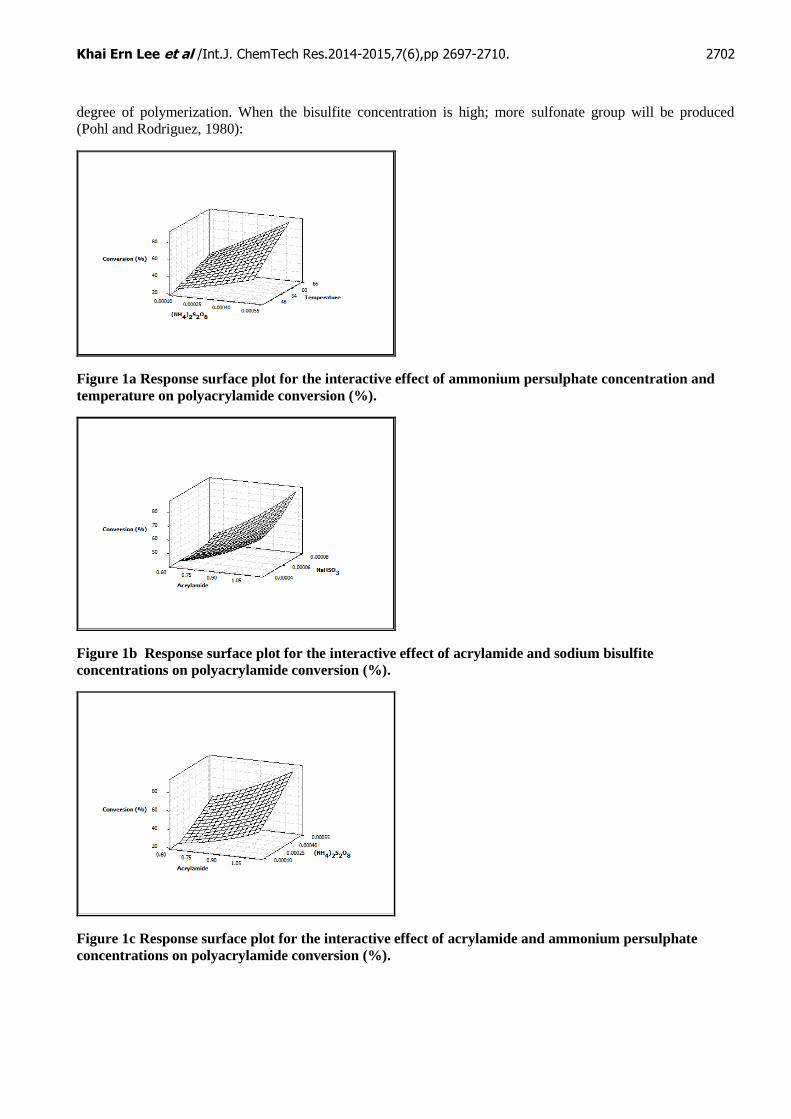
degree of polymerization. When the bisulfite concentration is high; more sulfonate group will be produced
(Pohl and Rodriguez, 1980):
Figure 1a Response surface plot for the interactive effect of ammonium persulphate concentration and
temperature on polyacrylamide conversion (%).
Figure 1b Response surface plot for the interactive effect of acrylamide and sodium bisulfite
concentrations on polyacrylamide conversion (%).
Figure 1c Response surface plot for the interactive effect of acrylamide and ammonium persulphate
concentrations on polyacrylamide conversion (%).
Khai Ern Lee et al /Int.J. ChemTech Res.2014-2015,7(6),pp 2697-2710. 2703
666
0
Conversion (%)
20
40
54
60
80
Temperature0.60 480.75
0.901.05
Acrylamide
Figure 1d Response surface plot for the interactive effect of acrylamide concentration and temperature
on polyacrylamide conversion (%).
Figure 1e Response surface plot for the interactive effect of ammonium persulphate and sodium bisulfite
concentrations on polyacrylamide conversion (%).
SO4
-· + HSO3
- SO4
2- + HSO3· (9)
The sulfonate radicals tend to react with acrylamide and stop the polyacrylamide chain propagation:
CH2CHCONH2· + HSO3
- CH2CH2CONH2 + SO3
- (10)
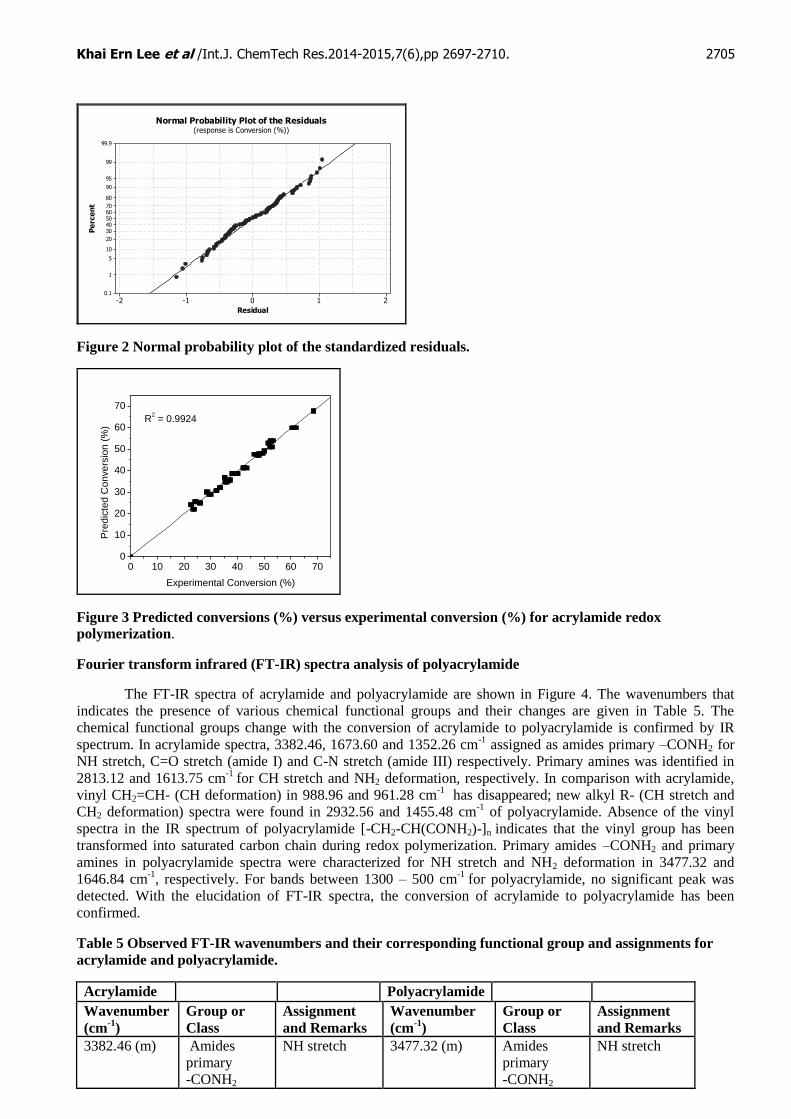
The highest polyacrylamide conversion (%) was achieved between high level and positive axial of
temperature, concentrations of acrylamide, ammonium persulphate and sodium bisulfite. The optimal redox
polymerization condition, which produces the maximum polyacrylamide conversion (%), was obtained by using
1.0335M of acrylamide, 5x10⁻⁴
M of ammonium persulphate, 1x10⁻⁴
M of sodium bisulfite under 65oC. An
experiment was carried out to validate the optimal redox polymerization condition; the maximum
polyacrylamide conversion (%) was 96.89%. The result shows a high accuracy in obtaining polyacrylamide
conversion (%) as expressed in normal probability plot of the standardized residuals in Figure 2. The
checkpoints distributed closely along the straight line indicating normality for all responses.
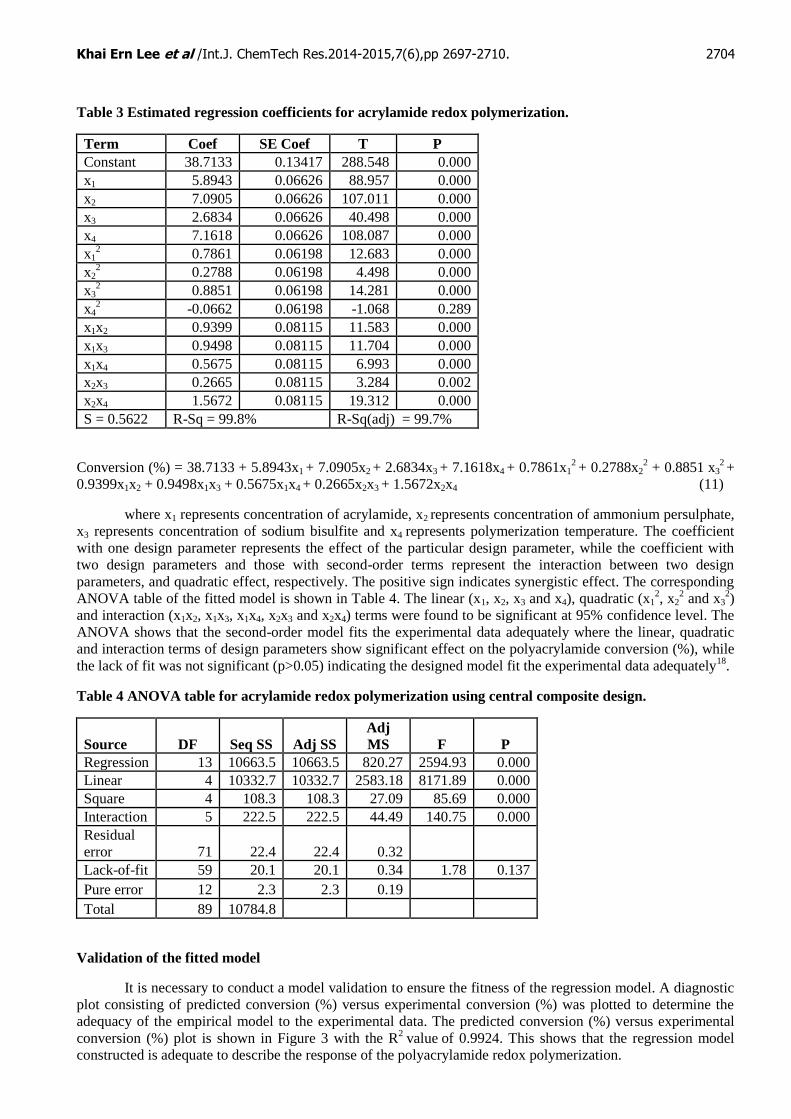
Regression analysis
Using regression analysis, the polyacrylamide conversion (%) can be correlated with the four design
parameters studied (temperature, concentrations of acrylamide, ammonium persulphate and sodium bisulfite). A
second-order model based on the estimated regression coefficients for respective coded design parameters is
shown in Table 3. The regression model for polyacrylamide conversion (%) was constructed as follows:
Khai Ern Lee et al /Int.J. ChemTech Res.2014-2015,7(6),pp 2697-2710. 2704
Table 3 Estimated regression coefficients for acrylamide redox polymerization.
Term Coef SE Coef T P
Constant 38.7133 0.13417 288.548 0.000
x1 5.8943 0.06626 88.957 0.000
x2 7.0905 0.06626 107.011 0.000
x3 2.6834 0.06626 40.498 0.000
x4 7.1618 0.06626 108.087 0.000
x12 0.7861 0.06198 12.683 0.000
x22 0.2788 0.06198 4.498 0.000
x32 0.8851 0.06198 14.281 0.000
x42 -0.0662 0.06198 -1.068 0.289
x1x2 0.9399 0.08115 11.583 0.000
x1x3 0.9498 0.08115 11.704 0.000
x1x4 0.5675 0.08115 6.993 0.000
x2x3 0.2665 0.08115 3.284 0.002
x2x4 1.5672 0.08115 19.312 0.000
S = 0.5622 R-Sq = 99.8% R-Sq(adj) = 99.7%
Conversion (%) = 38.7133 + 5.8943x1 + 7.0905x2 + 2.6834x3 + 7.1618x4 + 0.7861x12 + 0.2788x2
2 + 0.8851 x3
2 +
0.9399x1x2 + 0.9498x1x3 + 0.5675x1x4 + 0.2665x2x3 + 1.5672x2x4 (11)
where x1 represents concentration of acrylamide, x2 represents concentration of ammonium persulphate,
x3 represents concentration of sodium bisulfite and x4 represents polymerization temperature. The coefficient
with one design parameter represents the effect of the particular design parameter, while the coefficient with
two design parameters and those with second-order terms represent the interaction between two design
parameters, and quadratic effect, respectively. The positive sign indicates synergistic effect. The corresponding
ANOVA table of the fitted model is shown in Table 4. The linear (x1, x2, x3 and x4), quadratic (x12, x2
2 and x3
2)
and interaction (x1x2, x1x3, x1x4, x2x3 and x2x4) terms were found to be significant at 95% confidence level. The
ANOVA shows that the second-order model fits the experimental data adequately where the linear, quadratic
and interaction terms of design parameters show significant effect on the polyacrylamide conversion (%), while
the lack of fit was not significant (p>0.05) indicating the designed model fit the experimental data adequately18
.
Table 4 ANOVA table for acrylamide redox polymerization using central composite design.
Source DF Seq SS Adj SS Adj
MS F P
Regression 13 10663.5 10663.5 820.27 2594.93 0.000 Linear 4 10332.7 10332.7 2583.18 8171.89 0.000
Square 4 108.3 108.3 27.09 85.69 0.000
Interaction 5 222.5 222.5 44.49 140.75 0.000
Residual
error 71 22.4 22.4 0.32
Lack-of-fit 59 20.1 20.1 0.34 1.78 0.137
Pure error 12 2.3 2.3 0.19
Total 89 10784.8
Validation of the fitted model
It is necessary to conduct a model validation to ensure the fitness of the regression model. A diagnostic
plot consisting of predicted conversion (%) versus experimental conversion (%) was plotted to determine the
adequacy of the empirical model to the experimental data. The predicted conversion (%) versus experimental
conversion (%) plot is shown in Figure 3 with the R2
value of 0.9924. This shows that the regression model
constructed is adequate to describe the response of the polyacrylamide redox polymerization.
Khai Ern Lee et al /Int.J. ChemTech Res.2014-2015,7(6),pp 2697-2710. 2705
Residual
Pe
rce
nt
210-1-2
99.9
99
95
90
80
7060504030
20
10
5
1
0.1
Normal Probability Plot of the Residuals(response is Conversion (%))
Figure 2 Normal probability plot of the standardized residuals.
0 10 20 30 40 50 60 700
10
20
30
40
50
60
70
R2 = 0.9924
Pre
dic
ted C
onvers
ion (
%)
Experimental Conversion (%)
Figure 3 Predicted conversions (%) versus experimental conversion (%) for acrylamide redox
polymerization.
Fourier transform infrared (FT-IR) spectra analysis of polyacrylamide
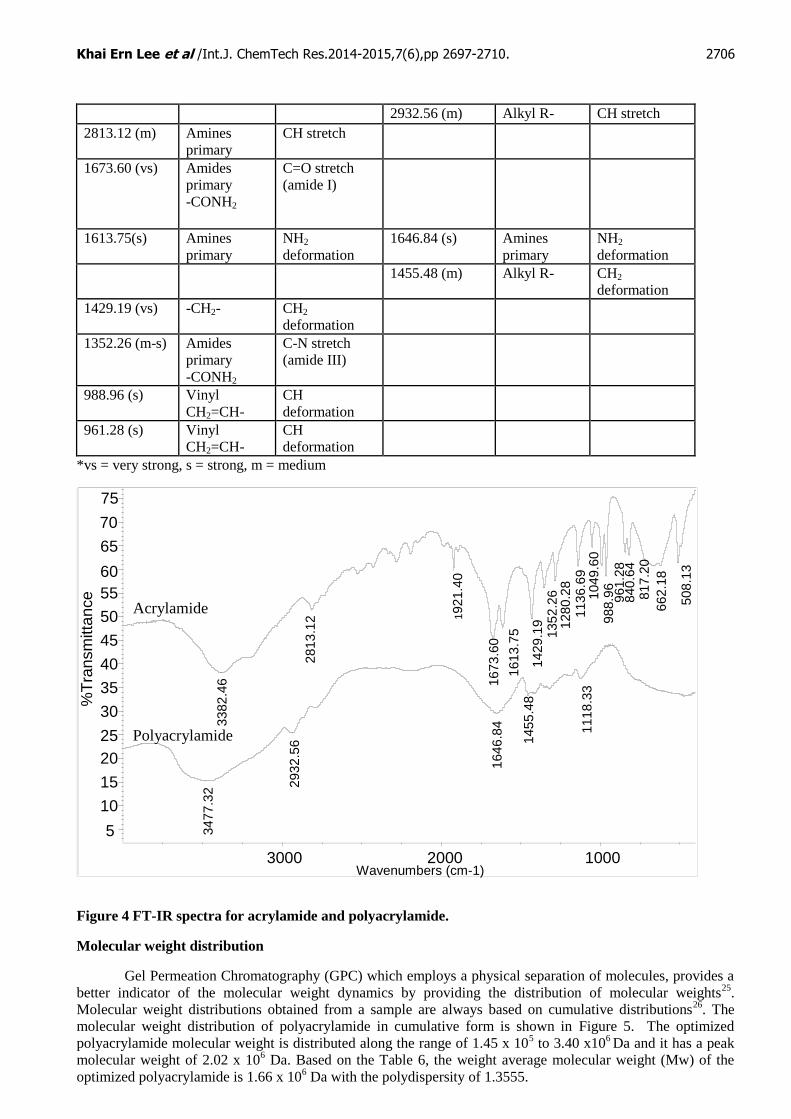
The FT-IR spectra of acrylamide and polyacrylamide are shown in Figure 4. The wavenumbers that
indicates the presence of various chemical functional groups and their changes are given in Table 5. The
chemical functional groups change with the conversion of acrylamide to polyacrylamide is confirmed by IR
spectrum. In acrylamide spectra, 3382.46, 1673.60 and 1352.26 cm-1
assigned as amides primary –CONH2 for
NH stretch, C=O stretch (amide I) and C-N stretch (amide III) respectively. Primary amines was identified in
2813.12 and 1613.75 cm-1
for CH stretch and NH2 deformation, respectively. In comparison with acrylamide,
vinyl CH2=CH- (CH deformation) in 988.96 and 961.28 cm-1
has disappeared; new alkyl R- (CH stretch and
CH2 deformation) spectra were found in 2932.56 and 1455.48 cm-1
of polyacrylamide. Absence of the vinyl
spectra in the IR spectrum of polyacrylamide [-CH2-CH(CONH2)-]n indicates that the vinyl group has been
transformed into saturated carbon chain during redox polymerization. Primary amides –CONH2 and primary
amines in polyacrylamide spectra were characterized for NH stretch and NH2 deformation in 3477.32 and
1646.84 cm-1
, respectively. For bands between 1300 – 500 cm-1
for polyacrylamide, no significant peak was
detected. With the elucidation of FT-IR spectra, the conversion of acrylamide to polyacrylamide has been
confirmed.
Table 5 Observed FT-IR wavenumbers and their corresponding functional group and assignments for
acrylamide and polyacrylamide.
Acrylamide Polyacrylamide
Wavenumber
(cm-1
) Group or
Class Assignment and Remarks
Wavenumber
(cm-1
) Group or
Class Assignment
and Remarks
3382.46 (m) Amides
primary -CONH2
NH stretch 3477.32 (m) Amides
primary -CONH2
NH stretch
Khai Ern Lee et al /Int.J. ChemTech Res.2014-2015,7(6),pp 2697-2710. 2706
2932.56 (m) Alkyl R- CH stretch
2813.12 (m) Amines
primary CH stretch
1673.60 (vs) Amides
primary -CONH2
C=O stretch
(amide I)
1613.75(s) Amines
primary NH2
deformation 1646.84 (s) Amines
primary NH2
deformation
1455.48 (m) Alkyl R- CH2
deformation
1429.19 (vs) -CH2- CH2
deformation
1352.26 (m-s) Amides
primary -CONH2
C-N stretch
(amide III)
988.96 (s) Vinyl CH2=CH-
CH
deformation
961.28 (s) Vinyl CH2=CH-
CH
deformation
*vs = very strong, s = strong, m = medium
Figure 4 FT-IR spectra for acrylamide and polyacrylamide.
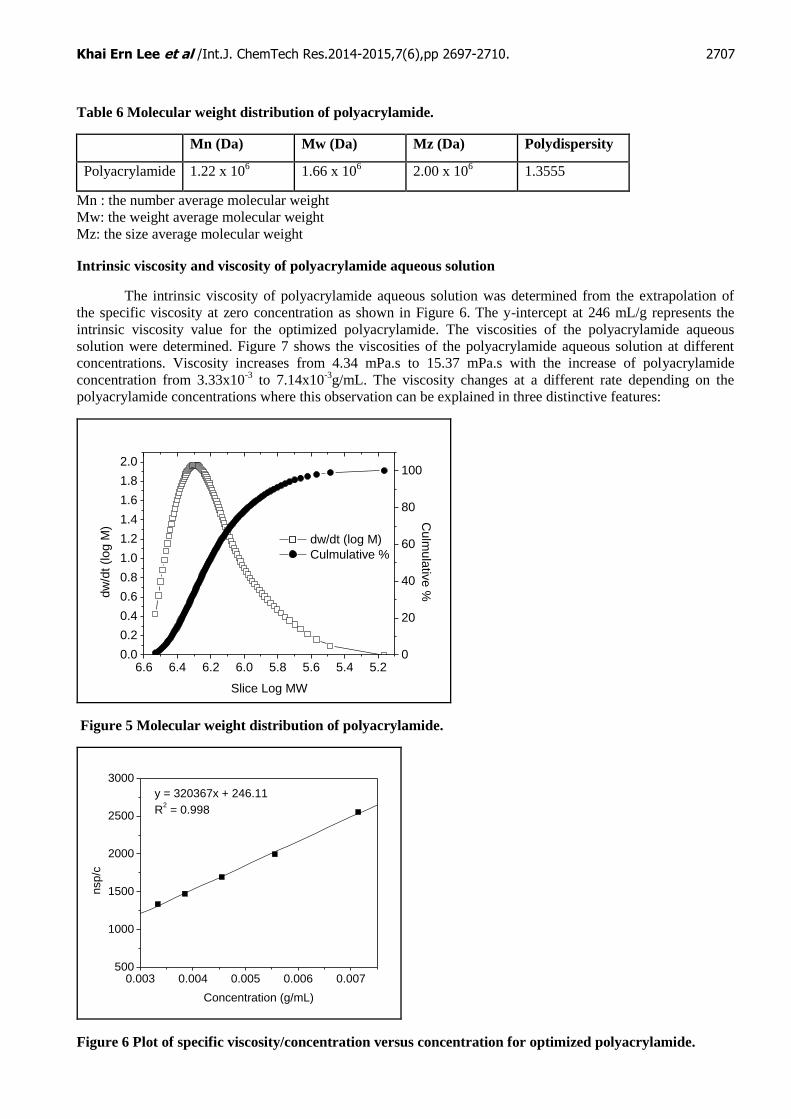
Molecular weight distribution
Gel Permeation Chromatography (GPC) which employs a physical separation of molecules, provides a
better indicator of the molecular weight dynamics by providing the distribution of molecular weights25
.
Molecular weight distributions obtained from a sample are always based on cumulative distributions26
. The
molecular weight distribution of polyacrylamide in cumulative form is shown in Figure 5. The optimized
polyacrylamide molecular weight is distributed along the range of 1.45 x 10⁵ to 3.40 x10
6 Da and it has a peak
molecular weight of 2.02 x 10⁶ Da. Based on the Table 6, the weight average molecular weight (Mw) of the
optimized polyacrylamide is 1.66 x 10⁶ Da with the polydispersity of 1.3555.
1118
.33
1455
.48
1646
.84
2932
.56
3477
.32
508.1
3
662.1
8
817.2
0
840.6
4
961.2
8
988.9
6
1049
.60
1136
.69
1280
.28
8
1352
.26
1429
.19
9
1613
.75
5
1673
.60
0
1921.4
0
0
2813
.12
2
3382
.46
6
5
10
15
20
25
30
35
40
45
50
%T
ran
sm
itta
nce
e
1000 2000 3000 Wavenumbers (cm-1)
Acrylamide
Polyacrylamide
55
60
65
70
75
Khai Ern Lee et al /Int.J. ChemTech Res.2014-2015,7(6),pp 2697-2710. 2707
Table 6 Molecular weight distribution of polyacrylamide.
Mn (Da) Mw (Da) Mz (Da) Polydispersity
Polyacrylamide 1.22 x 10⁶ 1.66 x 10
6 2.00 x 10⁶ 1.3555
Mn : the number average molecular weight
Mw: the weight average molecular weight
Mz: the size average molecular weight
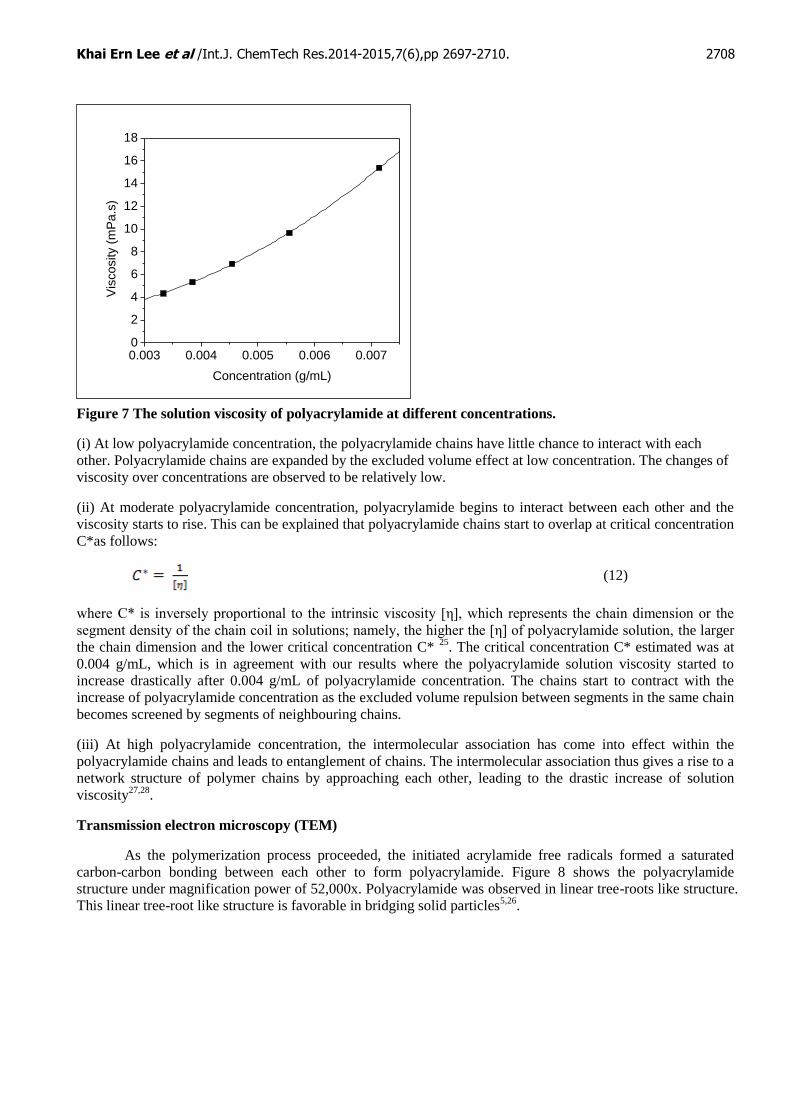
Intrinsic viscosity and viscosity of polyacrylamide aqueous solution
The intrinsic viscosity of polyacrylamide aqueous solution was determined from the extrapolation of
the specific viscosity at zero concentration as shown in Figure 6. The y-intercept at 246 mL/g represents the
intrinsic viscosity value for the optimized polyacrylamide. The viscosities of the polyacrylamide aqueous
solution were determined. Figure 7 shows the viscosities of the polyacrylamide aqueous solution at different
concentrations. Viscosity increases from 4.34 mPa.s to 15.37 mPa.s with the increase of polyacrylamide
concentration from 3.33x10⁻³
to 7.14x10⁻³
g/mL. The viscosity changes at a different rate depending on the
polyacrylamide concentrations where this observation can be explained in three distinctive features:
6.6 6.4 6.2 6.0 5.8 5.6 5.4 5.20.0
0.2
0.4
0.6
0.8
1.0
1.2
1.4
1.6
1.8
2.0
dw/dt (log M)
Culmulative %
Slice Log MW
dw
/dt (log M
)
0
20
40
60
80
100
Culm
ula
tive %
Figure 5 Molecular weight distribution of polyacrylamide.
0.003 0.004 0.005 0.006 0.007500
1000
1500
2000
2500
3000
y = 320367x + 246.11
R2 = 0.998
nsp/c
Concentration (g/mL)
Figure 6 Plot of specific viscosity/concentration versus concentration for optimized polyacrylamide.
Khai Ern Lee et al /Int.J. ChemTech Res.2014-2015,7(6),pp 2697-2710. 2708
Figure 7 The solution viscosity of polyacrylamide at different concentrations.
(i) At low polyacrylamide concentration, the polyacrylamide chains have little chance to interact with each
other. Polyacrylamide chains are expanded by the excluded volume effect at low concentration. The changes of
viscosity over concentrations are observed to be relatively low.
(ii) At moderate polyacrylamide concentration, polyacrylamide begins to interact between each other and the
viscosity starts to rise. This can be explained that polyacrylamide chains start to overlap at critical concentration
C*as follows:
(12)
where C* is inversely proportional to the intrinsic viscosity [η], which represents the chain dimension or the
segment density of the chain coil in solutions; namely, the higher the [η] of polyacrylamide solution, the larger
the chain dimension and the lower critical concentration C* 25
. The critical concentration C* estimated was at
0.004 g/mL, which is in agreement with our results where the polyacrylamide solution viscosity started to
increase drastically after 0.004 g/mL of polyacrylamide concentration. The chains start to contract with the
increase of polyacrylamide concentration as the excluded volume repulsion between segments in the same chain
becomes screened by segments of neighbouring chains.
(iii) At high polyacrylamide concentration, the intermolecular association has come into effect within the
polyacrylamide chains and leads to entanglement of chains. The intermolecular association thus gives a rise to a
network structure of polymer chains by approaching each other, leading to the drastic increase of solution
viscosity27,28
.
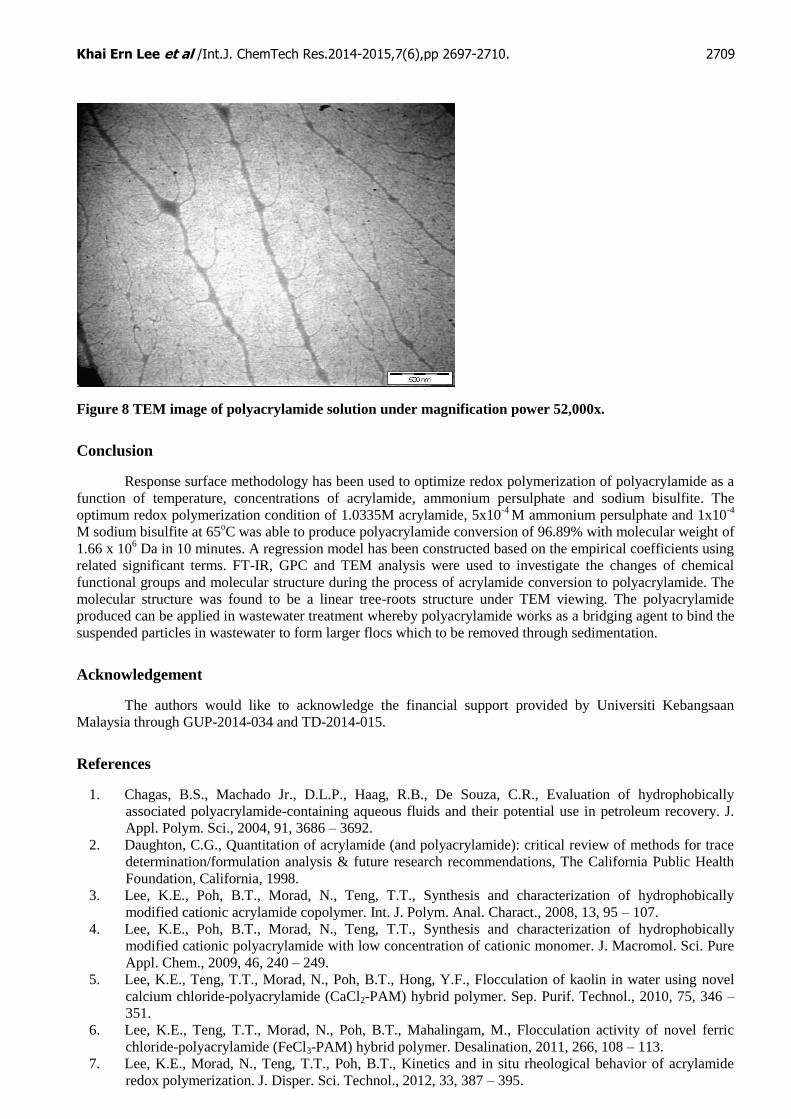
Transmission electron microscopy (TEM)
As the polymerization process proceeded, the initiated acrylamide free radicals formed a saturated
carbon-carbon bonding between each other to form polyacrylamide. Figure 8 shows the polyacrylamide
structure under magnification power of 52,000x. Polyacrylamide was observed in linear tree-roots like structure.
This linear tree-root like structure is favorable in bridging solid particles5,26
.
0.003 0.004 0.005 0.006 0.0070
2
4
6
8
10
12
14
16
18
Vis
cosity (
mP
a.s
)
Concentration (g/mL)
Khai Ern Lee et al /Int.J. ChemTech Res.2014-2015,7(6),pp 2697-2710. 2709
Figure 8 TEM image of polyacrylamide solution under magnification power 52,000x.
Conclusion
Response surface methodology has been used to optimize redox polymerization of polyacrylamide as a
function of temperature, concentrations of acrylamide, ammonium persulphate and sodium bisulfite. The
optimum redox polymerization condition of 1.0335M acrylamide, 5x10⁻⁴
M ammonium persulphate and 1x10⁻⁴
M sodium bisulfite at 65oC was able to produce polyacrylamide conversion of 96.89% with molecular weight of
1.66 x 10⁶ Da in 10 minutes. A regression model has been constructed based on the empirical coefficients using
related significant terms. FT-IR, GPC and TEM analysis were used to investigate the changes of chemical
functional groups and molecular structure during the process of acrylamide conversion to polyacrylamide. The
molecular structure was found to be a linear tree-roots structure under TEM viewing. The polyacrylamide
produced can be applied in wastewater treatment whereby polyacrylamide works as a bridging agent to bind the
suspended particles in wastewater to form larger flocs which to be removed through sedimentation.
Acknowledgement
The authors would like to acknowledge the financial support provided by Universiti Kebangsaan
Malaysia through GUP-2014-034 and TD-2014-015.
References
1. Chagas, B.S., Machado Jr., D.L.P., Haag, R.B., De Souza, C.R., Evaluation of hydrophobically
associated polyacrylamide-containing aqueous fluids and their potential use in petroleum recovery. J.
Appl. Polym. Sci., 2004, 91, 3686 – 3692.
2. Daughton, C.G., Quantitation of acrylamide (and polyacrylamide): critical review of methods for trace
determination/formulation analysis & future research recommendations, The California Public Health
Foundation, California, 1998.
3. Lee, K.E., Poh, B.T., Morad, N., Teng, T.T., Synthesis and characterization of hydrophobically
modified cationic acrylamide copolymer. Int. J. Polym. Anal. Charact., 2008, 13, 95 – 107.
4. Lee, K.E., Poh, B.T., Morad, N., Teng, T.T., Synthesis and characterization of hydrophobically
modified cationic polyacrylamide with low concentration of cationic monomer. J. Macromol. Sci. Pure
Appl. Chem., 2009, 46, 240 – 249.
5. Lee, K.E., Teng, T.T., Morad, N., Poh, B.T., Hong, Y.F., Flocculation of kaolin in water using novel
calcium chloride-polyacrylamide (CaCl2-PAM) hybrid polymer. Sep. Purif. Technol., 2010, 75, 346 –
351.
6. Lee, K.E., Teng, T.T., Morad, N., Poh, B.T., Mahalingam, M., Flocculation activity of novel ferric
chloride-polyacrylamide (FeCl3-PAM) hybrid polymer. Desalination, 2011, 266, 108 – 113.
7. Lee, K.E., Morad, N., Teng, T.T., Poh, B.T., Kinetics and in situ rheological behavior of acrylamide
redox polymerization. J. Disper. Sci. Technol., 2012, 33, 387 – 395.
Khai Ern Lee et al /Int.J. ChemTech Res.2014-2015,7(6),pp 2697-2710. 2710
8. Rahman, A., Islam, A., Farrukh, M.A., An improved method for the preparation of analytical grade
sodium chloride from Khewra rock salt. World Appl. Sci. J., 2010, 8, 61-65.
9. Wong, S.S., Teng, T.T., Ahmad, A.L., Zuhairi, A., Najafpour, G., Treatment of pulp and paper mill
wastewater by polyacrylamide (PAM) in polymer induced flocculation. J. Hazard. Mater, 2006, 135,
378 – 388.
10. Pohl, K., Rodriguez, F., Adiabatic polymerization of acrylamide using a persulfate-bisulfite redox
couple. J. Appl. Polym. Sci., 1980, 26, 611 – 618.
11. Sarac, A.S., Redox polymerization. Prog. Polym. Sci., 1999, 24, 1149 – 1204.
12. Wang, J-P., Chen, Y-Z., Ge, X-W., Yu, H-Q., Optimization of coagulation-flocculation process for a
paper-recycling wastewater treatment using response surface methodology. Colloid. Surface. A., 2007,
302, 204-210.
13. Idris, A., Kormin, F., Noordin, M.Y., Application of response surface methodology in describing the
performance of thin film composite membrane. Sep. Purif. Technol., 2006, 49, 271-280.
14. Ahmad, A.L., Wong, S.S., Teng, T.T., Zuhairi, A., Optimization of coagulation-flocculation process for
pulp and paper mill effluent by response surface methodological analysis. J. Hazard. Mater, 2007, 145,
162-168.
15. Aktas, N., Optimization of biopolymerization rate by response surface methodology. Enzyme Microb.
Tech., 2005, 37, 441-447.
16. Khayet, M., Abu Seman, M.N., Hilal, N., Response surface modeling and optimization of composite
nanofiltration modified membranes. J. Membrane Sci., 2010, 349, 113-122.
17. Salamatinia, B., Bhatia, S., Abdullah, A.Z., A response surface methodology based modeling of
temperature variation in an ultrasonic-assisted biodiesel production process. World Appl. Sci. J., 2011,
12, 1549-1557.
18. Montgomery, D.C., Design and analysis of experiments, 5th ed. John Wiley & Sons, New York, 2001.
19. Cai, K-Y., Wang, J-F., Du, S-Li., The effect of initiating system on the relative molecular weight of
polyacrylamide. J. N. China Inst. Technol., 1999, 20, 87.
20. Giz, A., Catalgil-Giz, H., Alb, A., Brousseau, J-L., Reed, W.F., Kinetics and mechanisms of acrylamide
polymerization from absolute, online monitoring of polymerization reaction. Macromolecules, 2001, 34,
1180-1191.
21. Kang, S.C., Choi, Y.J., Hyung, Z.K., Jin, B.K., Dong, K.K., Kinetics of acrylamide solution
polymerization using potassium persulfate as initiator by in situ IR. Macromol. Res., 2004, 12, 107 –
111.
22. Lin, H-R., Solution polymerization of acrylamide using potassium persulfate as an initiator: kinetics
studies, temperature and pH dependence. Eur. Polym. J., 2001, 37, 1507 – 1510.
23. Riggs, J.P., Rodriguez, F., Persulfate-initiated polymerization of acrylamide. J. Polym. Sci. A: Polym.
Chem., 1967, 5, 3151 – 3165.
24. Hunkeler, D., Hamielec, A.E., Mechanism and kinetics of the persulfate-initiated polymerization of
acrylamide, in: Shalaby, S.W., McCormick, C.L., Butler, G.B. (Eds.), Water-soluble polymers:
synthesis, solution properties, and applications. American Chemical Society, WashingtonDC, 1991, 82
– 104.
25. Liberatore, M.W., Baik, S., McHugh, A.J., Hanratty, T.J., Turbulent drag reduction of polyacrylamide
solutions: Effect of degradation on molecular weight distribution. J. Non-Newton Fluid, 2004, 123,
175-183.
26. Pabon, M., Selb, J., Candau, F., Gilbert, R.G., Polymerization of acrylamide in solution and inverse
emulsion: number molecular weight distribution with chain transfer agent. Polymer, 1999, 40, 3101 –
3106.
27. Poh, B.T., Ong, B.T., Dependence of viscosity of polystryrene solutions on molecular weight and
concentration. Eur. Polym. J., 1984, 20, 975-978.
28. Zheng, B.Q., Qian, J.W., Li, X.K., Zhu, Z.H., Effect of the parent solution concentration on the
flocculation performance of PAAM flocculants and the relation between the optimal parent solution
concentration and critical concentrations. J. Appl. Polym. Sci., 2007, 103, 1585-1592.
*****