international journal of bio-inorganic hybrid nanomaterials
DESCRIPTION
Volume 2, Issue 4, Autumn 2013, Page 471-524TRANSCRIPT
International Journal of Bio-Inorganic Hybrid Nanomaterials
ABSTRACT
In this work, the effect of immobilization of bread yeast (Saccharomyces cerevisiae) by sol-gel technique combined
with functionalized nanoporous silica was investigated in different weight ratios of silica containing materials
(TMOS: LUS-1). The activities of immobilized yeast in days after immobilization were examined. The results
showed immobilization maintain the yeast life for a longer time. The functionalization by C18 functional group
improved the environmental conditions for yeast life. These results indicate that the immobilization technique in the
gel matrix and porous solid is a good system to develop industrial fermentations.
Keyword: Nanoporous silica, Sol-gel, Bread yeast, LUS-1, Fermentation, Immobilization, Mesopore.
(*) Corresponding Author - e-mail: [email protected].
Cells and Enzymes are immobilized by different meth-
ods including absorption, covalent linkage, entrapment,
cross linking and microencapsulation [1]. Produc-
ing ethanol through consuming glucose is one of the
-
ing yeasts through removing the ethanol, it is needed
to stabilize the yeasts leading to decrease the costs of
separation steps [2]. Immobilization of cells in a silica
metabolic activity, protection of environmental stresses
-
tion as a cellular storage systems in postponement of
reactions [3]. Saccharomyces Cerevisiae (SC), a type
of yeast bread, was utilized in this research. In order
to immobilizing the yeast, entrapping technique by
sol-gel method was used. Sol-gel method provides the
Improvement in Immobilization of Bread Yeasts by Sol-gel Meth-
od Combined with Functionalized Nanoporous Silica (LUS-1)
Alireza Badiei1*, Golriz Dadashi2, Hossein Attar3, Nastaran Hayati-Roodbari4
1 Associate Professor, School of Chemistry, College of Science, University of Tehran, Tehran, Iran
2 M.Sc. Student, Department of Chemical Engineering, Science and Research Branch,
Islamic Azad University, Tehran, Iran
3 Associate Professor, Department of Chemical Engineering, Science and Research Branch,
Islamic Azad University, Tehran, Iran
4 Ph.D. Student, School of Chemistry, College of Science, University of Tehran, Tehran, Iran
Received: 27 August 2013; Accepted: 6 November 2013
1. INTRODUCTION
Int. J. Bio-Inorg. Hybd. Nanomat., Vol. 2, No. 4 (2013), 471-476 ISSN: 2251-8533
472
Int. J. Bio-Inorg. Hybd. Nanomat., Vol. 2, No. 4 (2013), 471-476 Badiei A et al
-
Utilizing the sol-gel process commonly is accompa-
process includes solution formation, gelation, drying
and agglomeration [4].
Pope and co-workers investigated the immobiliza-
tion of SC into tetramethylortosilicate (TMOS) gel.
One day after of immobilization, the yeast did not
show any activity [5]. Fennouh et al immobilized the
of entrapping method [6]. Nassif et al investigated the
immobilization of Escherichia coli into TMOS and
after two weeks the yeast activity were reduced and
al compared the resistance of free and immobilized
The term “nanoporous materials” indicates the ma-
terials with pore diameters less than 100 nm [10].
LUS-1 is a type of silica with amorphous walls clas-
material was reported by Benneviot and Badiei in
2001 at Laval University [11]. Alvaro et al used nano-
porous silica to immobilize the Lipas Enzyme [12].
Jang and et al in 2006 immobilized Tripsin Enzyme
on SBA-15 (a type of mesoporous silica) with and
without functionalized by thiol group [13]. As the im-
mobilization into nanoporous silica leads to protection
of yeast from unwanted environmental factors and in
other side the functional group on surface of nanopo-
rous material, help to remove the unsuitable materials
such as ethanol.
In this work, the effect of immobilization of bread
yeast (Saccharomyces cerevisiae) by sol-gel tech-
nique combined with functionalized nanoporous
silica was investigated in different weight ratios of
silica containing materials (TMOS: LUS-1). The ac-
the measurement of produced CO2 by consumption
of glucose in days after immobilization and a sample
able to maintain the activity of yeast after one month
were determined. In comparison to the other methods
which were used before including Gas Chromatog-
raphy (GC) and High Performance Liquid Chroma-
tography (HPLC), this method is more practical and
convenient [15].
2. MATERIALS AND METHODS
2.1. Materials
SiO2, cetyl-trimethylammonium bromide (CTMABr),
-
-
Fala Company. P-toluenesulfonicacid monohydrate
(TSOH) obtained from Aldrich.
2.1.1. Characterizations
In order to characterize the functional groups on nano-
55Bruker were applied. The morphology and shapes
of synthesized materials were investigated by SEM
diameter, surface area and adsorption-desorption iso-
therms were measured at 77 K using a BELSORP-
miniII porosimeter. BET (Brunauer-Emmett-Teller)
area and BJH (Barret, Joyner and Halenda). The
low angle X-ray scattering spectrum was recorded
within a range of 2θ of 0.6 - 10 degree.
2.2. Methods
2.2.1. Synthesis of LUS-1
LUS-1 was synthesized according to the literature
[16], with a molar ratio of SiO2: 0.054 CTMABr:
2O. Prepared LUS-1 was washed
with a solution of HCl (2 M) and ethanol, with a
vacuum and dried in an oven overnight.
2.2.2. Functionalization of LUS-1
Acid washed LUS-1 was functionalized with Trichlo-
rooctadecylsilane. 1 g LUS-1 with 30 mL dried Tolu-
473
Badiei A et al Int. J. Bio-Inorg. Hybd. Nanomat., Vol. 2, No. 4 (2013), 471-476
2.2.3. Immobilization of bread yeast on functionalized
LUS-1
Immobilization of yeast was performed through sol-
gel method. 5 gel samples were prepared by adding
different amounts of functionalized LUS-1 to 22.5 µL
-
-
ring, the Si-O-R bonds were created. Hydrolysis pro-
cess was catalyzed by HCl. The synthesized samples
-
tigate pore size effect on immobilization of yeast dif-
ferent ratios of different silica materials were utilized.
The silica amounts of TMOS were measured and then
LUS-1 was added in weight ratios of 1:1, 0.75, 0.5,
0.375 and 0.3125.
2.2.4. Measurement of immobilized yeast activity
To investigate the remained yeast activity, the amount
-
sumption by yeasts were measured. The yeasts con-
sume the Glucose through following reaction.
Glucose (C6H
12O
6 2H
5 2
were dissolved in 75 mL deionized water and were
-
ing 50 mL H2SO
4 0.1 M in one and Gel (fereman-
tor) in another were joint through a tube. The lid of
the system. The produced CO2 in gel container were
2SO
4 container. Thus the
weight in gel container reduced frequently. Its weight
was measure every 15 minutes. The reduced weight is
equal to produced CO2 [15].
-
ized LUS-1 and Free yeast.
3. RESULTS AND DISCUSSION
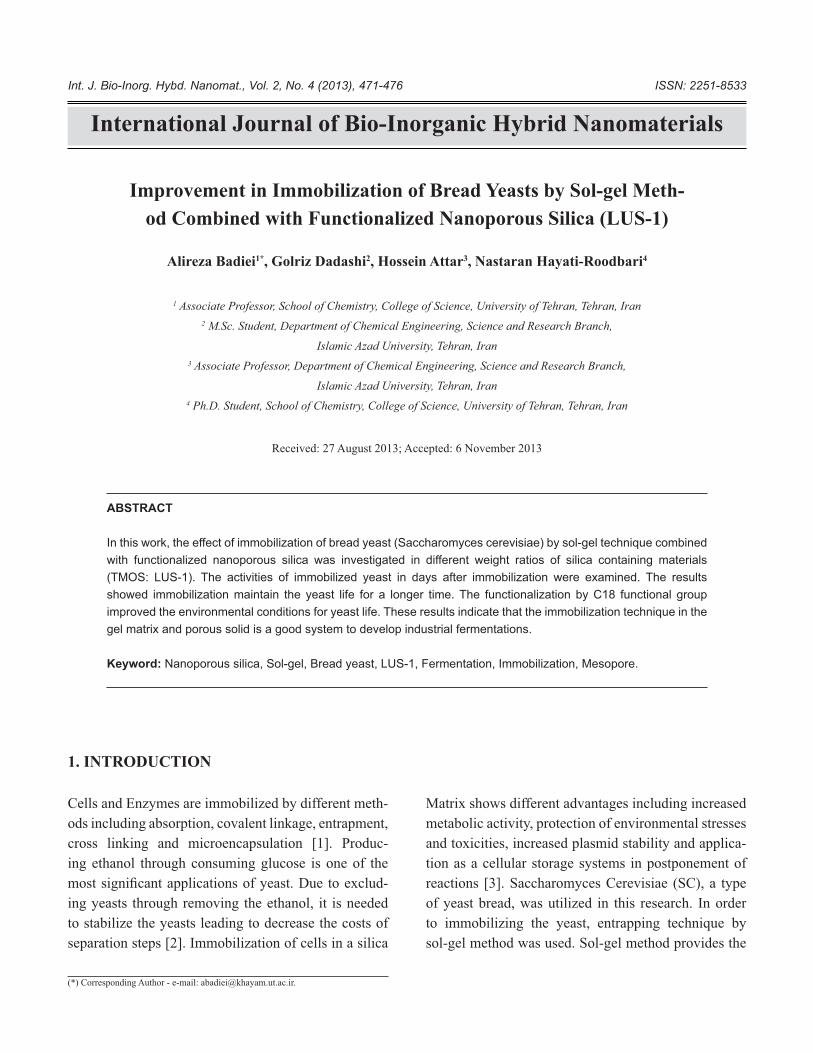
Figure 1 shows the functionalized LUS-1 X-ray dif-
fraction pattern. Three well-known and characteristic
θ
to diffraction peaks of (100), (110), and (200), are at-
LUS-1
236as (m2/g)
0.3010.1120.303Total pore
Volume (cm3/g)
2.72.32.4p (nm)
Table 1: Texture properties of samples.
Figure 1: Low angel X-Ray Diffraction pattern of the func-
tionalized LUS-1.
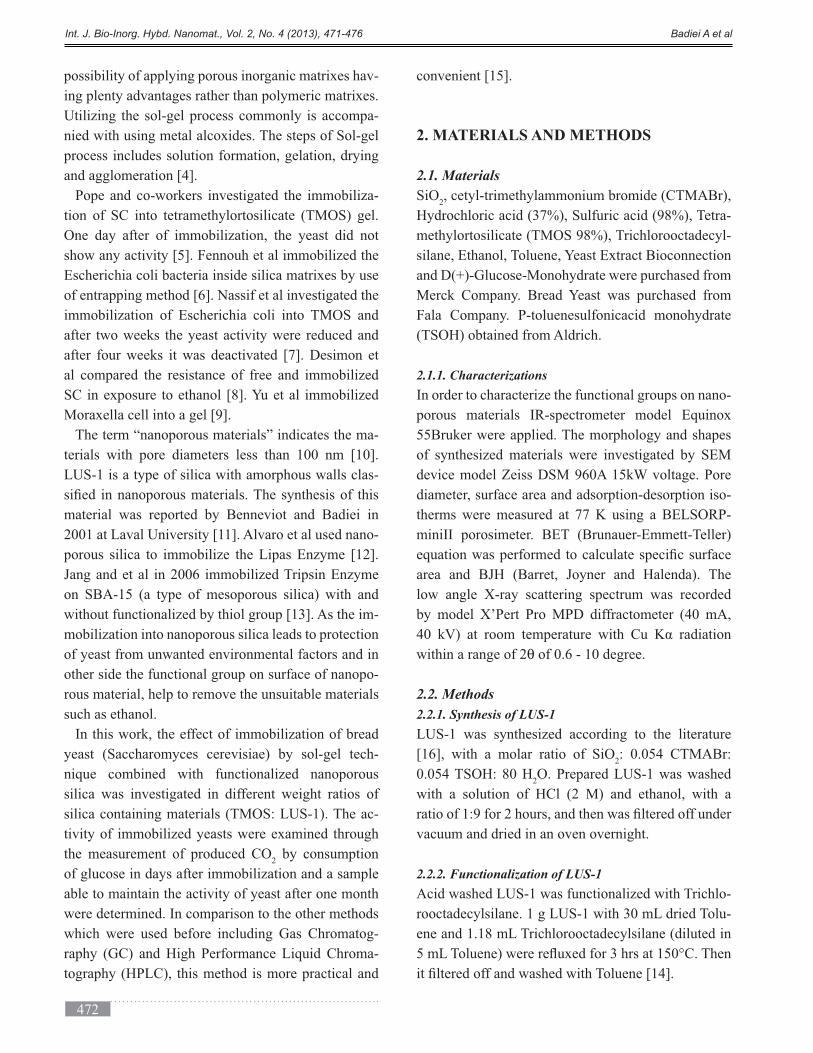
Figure 2: IR Spectrophotometer: (a) LUS-1 (b) functional-
ized LUS-1.

474
Int. J. Bio-Inorg. Hybd. Nanomat., Vol. 2, No. 4 (2013), 471-476 Badiei A et al
-
-
of LUS-1.
LUS-1, functionalized LUS-1and gel samples
(TMOS/LUS-1: 1:0.5) were investigated by nitrogen
-
eters and surface area are provided on Table 1.
Surface area and total pore volume in functional-
ized LUS-1 in comparison to LUS-1 illustrated a sig-
are on surface of silica and in some parts pore block-
ing happened. In gel sample, surface area and total
pore volume in comparison to functionalized one is
increased indicating the functionalized LUS were
placed inside gel structure and resulted data was at-
tributed to pores of gel.
The FTIR spectra (Figure 2) of LUS-1 based mate-
including a very strong band at 1110-1010 cm-1 rep-
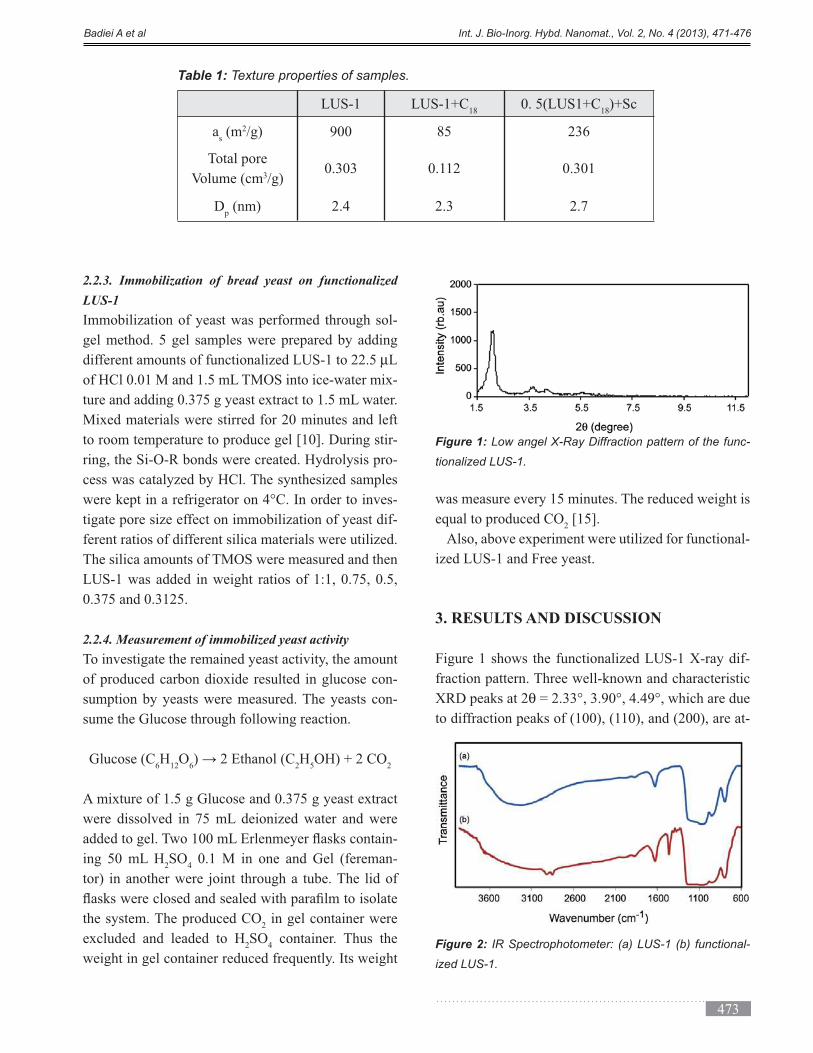
Figure 3: Producing CO2 from free and immobilized yeasts at days 1, 2, 7, 21 and 31.
475
Badiei A et al Int. J. Bio-Inorg. Hybd. Nanomat., Vol. 2, No. 4 (2013), 471-476
resenting stretching vibration of Si-O-Si, a very broad
band in the range of 3700-3200 cm-1 and a strong
-
2 vibrations may be assigned
-1. Vibratios of
H2O physisorbed onto the surface of silica appears at
around 1645 cm-1 in spectra of all LUS-1 based materi-
al. Functional group, Cetyloctadecylsilane, on surface
of LUS-1 was characterized by IR spectrophotometer
-1 and 1462 cm-1 are related to stretching vi-
bration of C-H bonds.
Vital activity of immobilized yeasts and free yeasts
were investigated at 0, 1, 2, 7, 21 days and one month
after immobilization (Figure 3). According to differ-
ent behaviour of gels illustrated in plots, Gels in com-
parisons to each other show different behaiviours. In
all samples by spending time the activity is reduced.
In comparison to free yeasts, this reduction of activ-
cell life was followed by a smaller slope. Because of
-
lized yeasts show less reduction of activity. In order
to achieve the yeasts, the substra should pass through
mass transfer resistances such as boundary layer of
(as an internal one). This fact reduces the amount of
level).
Because of environmental effects and inappropri-
ate conditions, the number of yeast was decreased.
Since Ethanol interefer with Fermentation ability
growth rate of SC and compete to Glucose transfer
which lead to slow and incomplete fermentation. As
LUS-1 possess outstanding chemical, thermal and me-
chanical stability is able to act as a microprotective
environment leading to avoid ethanols of prohibiting
on yeast activity.
According to the plots, the gel with TMOS: LUS-1
ratio of 1:0.5 provides the best conditions for yeast’s
-
ties, 21 days after immobilization the gel with 1:0.5
ratio maintains life and activity of yeasts for more
time rather than the other ratios. So this ratio of TMSO
and LUS-1 is selected as an optimum ratio.
By comparing immobilized yeast’s activity on func-
tionalized LUS-1 and LUS-1, the activity of yeasts
on functionalized LUS-1 was more protected. The
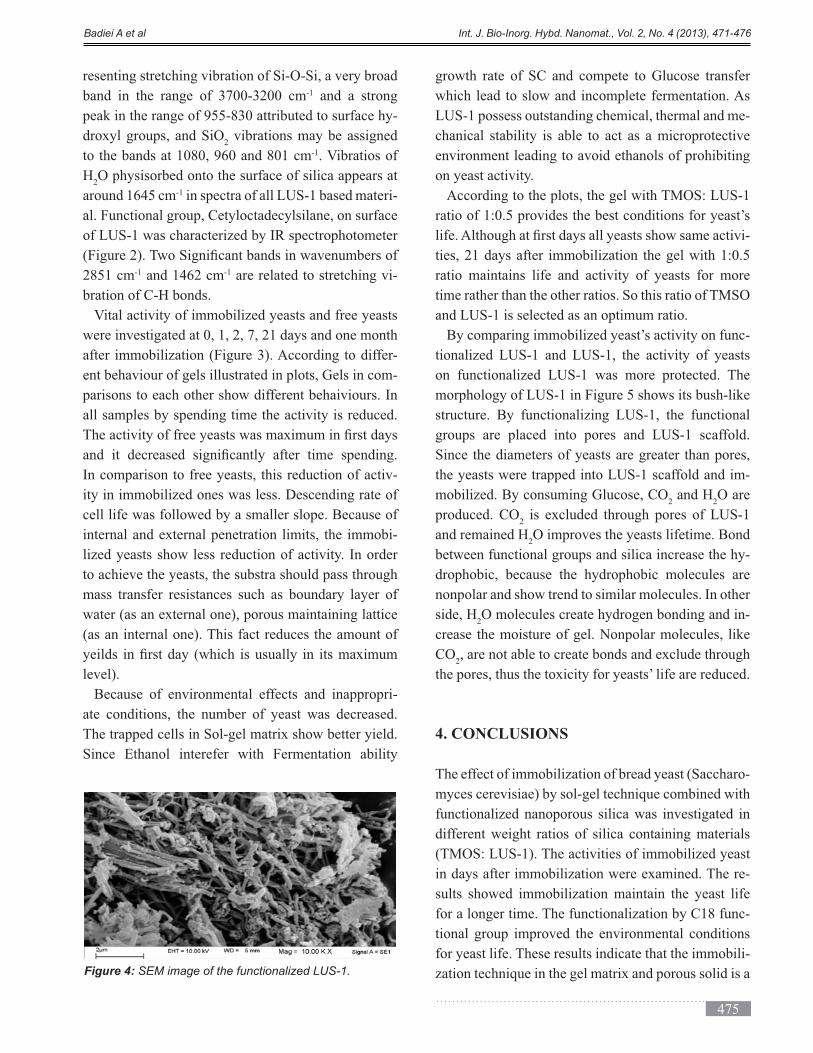
morphology of LUS-1 in Figure 5 shows its bush-like
structure. By functionalizing LUS-1, the functional
groups are placed into pores and LUS-1 scaffold.
Since the diameters of yeasts are greater than pores,
the yeasts were trapped into LUS-1 scaffold and im-
mobilized. By consuming Glucose, CO2 and H
2O are
produced. CO2
and remained H2O improves the yeasts lifetime. Bond
between functional groups and silica increase the hy-
drophobic, because the hydrophobic molecules are
nonpolar and show trend to similar molecules. In other
side, H2O molecules create hydrogen bonding and in-
crease the moisture of gel. Nonpolar molecules, like
CO2
4. CONCLUSIONS
The effect of immobilization of bread yeast (Saccharo-
myces cerevisiae) by sol-gel technique combined with
functionalized nanoporous silica was investigated in
different weight ratios of silica containing materials
(TMOS: LUS-1). The activities of immobilized yeast
-
sults showed immobilization maintain the yeast life
-
tional group improved the environmental conditions
for yeast life. These results indicate that the immobili-
Figure 4: SEM image of the functionalized LUS-1.

476
Int. J. Bio-Inorg. Hybd. Nanomat., Vol. 2, No. 4 (2013), 471-476 Badiei A et al
good system to develop industrial fermentations. The
REFERENCES
Immobilization of en-
zymes and cells, Humana Press.
The phys-
ics and chemistry of sol-gel processing, Academic
Press Limited.
Anal. Chem.,
78 (3) 2006, 646.
Progress in inorganic
chemistry: coordination complexes in Sol-Gel sil-
ica materials
5. Pope E. et al., J. Sol-Gel Science & Tech., 4
225.
J.
Sol-Gel Science & Tech., 19 (2000), 647.
7. Nassif N. et al., Nat. Mater., 1 (2002), 42.
Biotechnol. Lett., 24 (2002), 1557.
Pure Appl. Chem., 57
603.
Mulchandani, A.K. Singh, Biosens. Bioelectron,
20 (7) 2005, 1433.
11. Bonneviot M.M.L., Badiei A., Patent
01/55031 A1, 2001.
12. A. Mayoral, R. Arenal, V. Gascon, C.M. Alvarez,
Chem. Cat Chem., 5 (4)
J. Porous Ma-
ter, 13
Physicochem. Eng. Aspects, 229 (2003), 1.
JFSE, 4 (2005).
16. Bonneviot L., Morin M., Badiei A., US Patent
Chem. Mate., 12 (2) (2000), 275.
Adv. Mater., 15 (6) (2003), 511.
International Journal of Bio-Inorganic Hybrid Nanomaterials
ABSTRACT
Metal nanoshells consists of a dielectric core surrounded by a thin noble metal shell, possess unique optical
properties that render nanoshells attractive for use in different technologies. This paper reports a facile method
for growth of small gold nanoparticles on the functionalized surface of larger silica nanoparticles. Mono-dispersed
silica particles and gold nanoparticles were prepared by the chemical reduction method. The size of the shell
nanoseeds could be altered by repeating the stage of reducing HAuCl4 on Au/APTES/silica particles, and the time
for which they react. The nanocore-shell particles prepared were studied using scanning electron microscopy
(TEM), UV–Vis spectroscopy, Fourier transform infrared spectroscopy (FTIR) and PL spectrophotometer. The TEM
images indicated that by growing gold nano-seeds over the silica cores a red shift in the maximum absorbance
silica@Au NPs in comparison with that of bare silica NPs. But, the existence of gold nanoseeds on the silica
particles surfaces does not change the PL spectra peaks of these nanoparticles.
Keyword: Core-shell; Silica; Gold; Nanoparticle; Surface functionalized; Initial growth.
Much recent research has focused on the fabrication
of new types of nanoparticles, particularly those with
optical and electrical properties that can be controlled
with precision. There is increasing interest in the
design and synthesis of topological structures com-
posed of monocrystals of various size and shape. Such
materials may have unusual optical properties as a
Gradual Growth of Gold Nanoseeds on Silica for Silica@Gold
Core-Shell Nanoparticles and Investigation of Optical Properties
1*, Nasser Shahtahmasebebi2, Ahmad Kompany2, Elaheh
Kafshdargoharshadi3
1 M.Sc., Department of Physics, Faculty of Science, Ferdowsi University of Mashhad, Mashhad,
Iran & Centre of Nanoresearch, Ferdowsi University of Mashhad, Mashhad, Iran
2 Professor, Department of Physics, Faculty of Science, Ferdowsi University of Mashhad, Mashhad,
Iran & Centre of Nanoresearch, Ferdowsi University of Mashhad, Mashhad, Iran
3 Professor, Department of Chemistry, Faculty of Science, Ferdowsi University of Mashhad, Mashhad,
Iran &Centre of Nanoresearch, Ferdowsi University of Mashhad, Mashhad, Iran
Received: 31 August 2013; Accepted: 3 November 2013
1. INTRODUCTION
Int. J. Bio-Inorg. Hybd. Nanomat., Vol. 2, No. 4 (2013), 477-483 ISSN: 2251-8533
noble metals have received particular attention,because
of the stability and the ease of preparation of Nano-
particles derived from, Hal and co-workers have
recently reported a new hybrid nanoparticle system
that consists of a dielectric core surrounded by a thin
noble-metal shell [1-3]. These nanoparticles, termed
“nanoshells”, possess unique optical properties,
including a strong optical absorbance and a large
third-order nonlinear optical susceptibility [4]. More
importantly, the absorbance can be selectively tuned
to any wavelength across the visible and infrared
regions of the spectrum simply by adjusting the
ratio of the dielectric core to the thickness of the
metal overlayer. These features render nanoshells
attractive for use in technologies ranging from conducting
polymer devices to biosensing and drug delivery
[5-7].
At present, the most versatile nanoshell system is
bed on the coating of silica nanoparticles with a thin
dielectric cores not only because methods for the
functionalization of the surface of silica are well-known,
but also because colloidal silica particles can be prepared
with reproducibly spherical shapes and narrow size
To prepare these gold nanoshells,a silica
-
minated surface silanizing agent (e.g., 3-aminopro-
is used as the surface primer. The interaction between
the amines and the negatively charged THPC gold
nanoparticles might be electrostatic rather than coor-
amine groups act attachment points for small colloidal
gold particles, which then serve nucleation sites for
Of all possible strategies [10], the reduction of
phosphoniumchloride (THPC) affords relatively
small gold particles (e.g., 2 nm) with a net negative
particles can attach to APTMS-functionalized silica
cores by coordinating to the lone pairs of the termi-
nal amine groups, the attachment can be enhanced
perhaps several fold by electrostatic effects, where in
the negatively charged THPC gold nanoparticles are
attracted to the amine groups, which are positively
charged at the pH used for the attachment process.
This strategy leads to silica nanoparticles in which
25% of the surface is covered by colloidal gold
particles that can be used to nucleate the growth of the
gold overlayer.
In this work, we describe the preparation of
gold nanoshellsby the chemical reduction method
and characterize the nanoshells by using transmis-
sion electron microscopy (TEM), Fourier transform
infrared (FTIR) spectroscopy, ultraviolet visible
(UV-Vis) spectroscopy and photo luminescence (PL)
spectroscopy.
2. EXPERIMENTAL
2.1. Materials
All reagents were purchased from the indicated sup-
-
-
hydrogen tetrachloroaurate (III) (all from Merch Co.).
Similarly, all solvents were received from the indicat-
ed suppliers: HPLC grade water, and absolute ethanol
(Merch Co.).
2.2.Characterization methods
AB electron microscope operating at a bi voltage of
200 kV. Sample preparation involved deposition of
the nanoparticles dispersed in water onto a 200 mesh
copper grid. The grid was then set aside to allow for
evaporation of any residual water before analysis.
The FTIR data were collected using an AVA-TAR-
370-FTIR THERMONICOLET spectrometer using
two separate procedures. The sample was impacted
into a tablet shape and put onto a polished silicon
wafer before analysis. UV-Vis spectra were collected
-
trometer over the range from 400 to 1100 nm. All
samples were dispersed in water into a quartz cell for
analysis.
2.3. Preparation of silica nanoparticles
An aliquot (3.0 mL) of ammonia (30% NH3 NH
4OH
say) was added to 50.0 mL of absolute ethanol. The
aliquot (1.5 mL, 6.7 mmol) of Si(OC2H
5)
4 (tetra-
ethyl orthosilicate, TEOS) was added dropwise.
Previous studies have shown that there is usually a
concentrationdependent induction period required
to form the SiO2 nucleus from the TEOS monomer.
For the concentrations employed here, the induction
change of the solution from clear to opaque white. On
the basis of previous work from our laboratories, the
concentration of the resultant silica nanoparticles was
7×10¹² particles / mL. Analysis by TEM indicated that
the silica nanoparticles were spherical in shape with
115 nm diameters.
2.4. Functionalization ofsilica nanoparticlesurfaces
with APTES
The silica nanoparticles were then surface function-
alized by grafting them with 12 mM APTES in vol-
ume ratio of 3:7 under constant heating and vigorous
group on their surface. Under this condition, the
-
plete surface functionalization. The amine grafted
silica particles were then cooled to room temperature
and washed with at least 2 cycles of centrifugation and
redispersion in absolute ethanol and distilled water at
10,000 rpm for 15 min each to remove residual reac-
tants before resuspending them in 1 mL of water for
every 0.3 g of silica used for surface functionalization
with amine.
2.5. Preparation of colloidal gold nanoparticles
To a 45 mL aliquot of HPLC grade water was added
0.5 mL of 1 M NaOH and 1 mL of THPC solution
(prepared by adding 12 µ
THPC in water to 1 mL of HPLC grade water). The
(27 mmol) of HAuCl4 1% in water was added quickly
to the stirred solution, which was stirred further for
30 min. The color of the solution changed very quickly
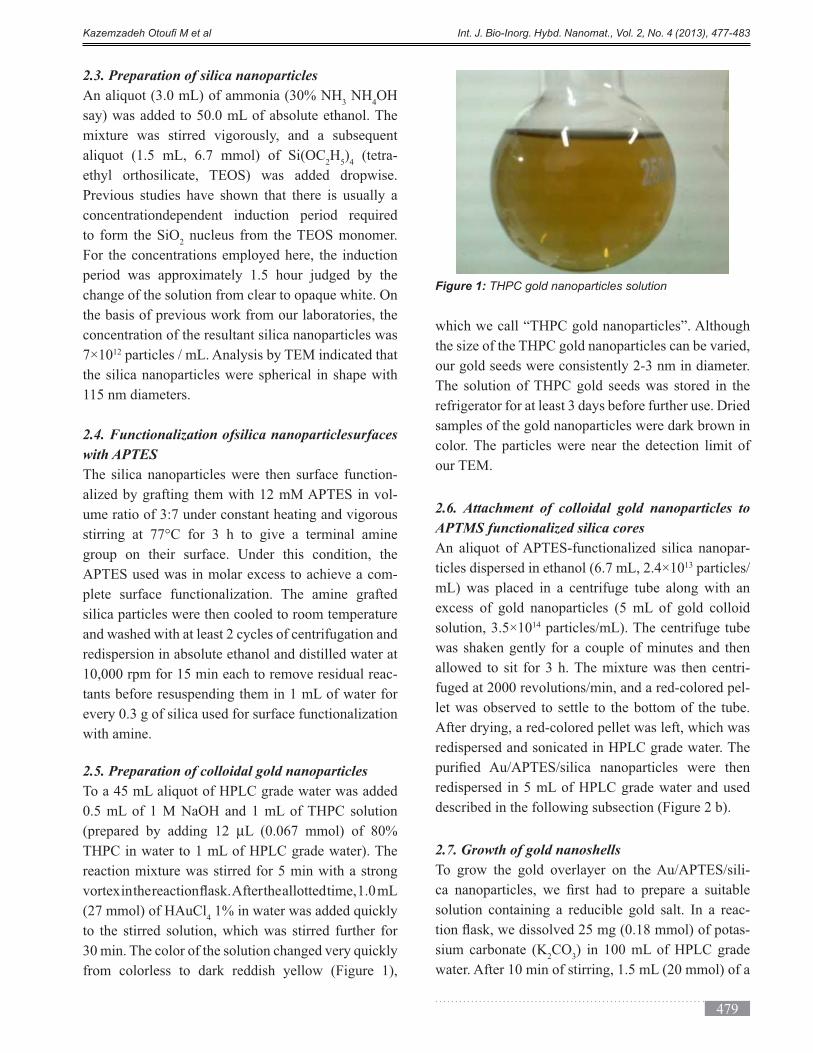
from colorless to dark reddish yellow (Figure 1),
which we call “THPC gold nanoparticles”. Although
the size of the THPC gold nanoparticles can be varied,
our gold seeds were consistently 2-3 nm in diameter.
The solution of THPC gold seeds was stored in the
samples of the gold nanoparticles were dark brown in
color. The particles were near the detection limit of
our TEM.
2.6. Attachment of colloidal gold nanoparticles to
APTMS functionalized silica cores
An aliquot of APTES-functionalized silica nanopar-
ticles dispersed in ethanol (6.7 mL, 2.4×10¹³ particles/
mL) was placed in a centrifuge tube along with an
solution, 3.5×10¹⁴ particles/mL). The centrifuge tube
was shaken gently for a couple of minutes and then
fuged at 2000 revolutions/min, and a red-colored pel-
let was observed to settle to the bottom of the tube.
After drying, a red-colored pellet was left, which was
redispersed and sonicated in HPLC grade water. The
redispersed in 5 mL of HPLC grade water and used
described in the following subsection (Figure 2 b).
2.7. Growth of gold nanoshells
To grow the gold overlayer on the Au/APTES/sili-
solution containing a reducible gold salt. In a reac-
-
sium carbonate (K2CO
3) in 100 mL of HPLC grade
water. After 10 min of stirring, 1.5 mL (20 mmol) of a
Figure 1: THPC gold nanoparticles solution
solution of 1% HAuCl4 in water was added. The
solution initially appeared transparent yellow and
slowly became colorless over the course of 30 min. To
a vigorously stirred 4 mL aliquot of the colorless solu-
tion, we injected 200 µL of the solution containing the
Au/APTES/silica nanoparticles.
µL (0.36 mmol) aliquot of
formaldehyde. Over the course of 2-4 min, the solu-
tion changed from colorless to blue, which is charac-
teristic of nanoshell formation. The nanoshells were
centrifuged and re-dispersed in HPLC grade water
until use.
3. RESULTS AND DISCUSSION
3.1. Imaging by TEM
spherical silica nanoparticleswith a size of about
120 nm, and then attached small colloidal particles
of gold to APTES-functionalized silica nanoparticles
cores and then used the attached gold particles to tem-
plate the growth of a gold overlayer. NH3 is the most
effective parameter in thespherical shape of silica
nanoparticles [11].
By increasing theconcentration of TEOS and
H2O, the size of the nanoparticles increases. It
-
ate of condensation and hydrolysis reactions [12].
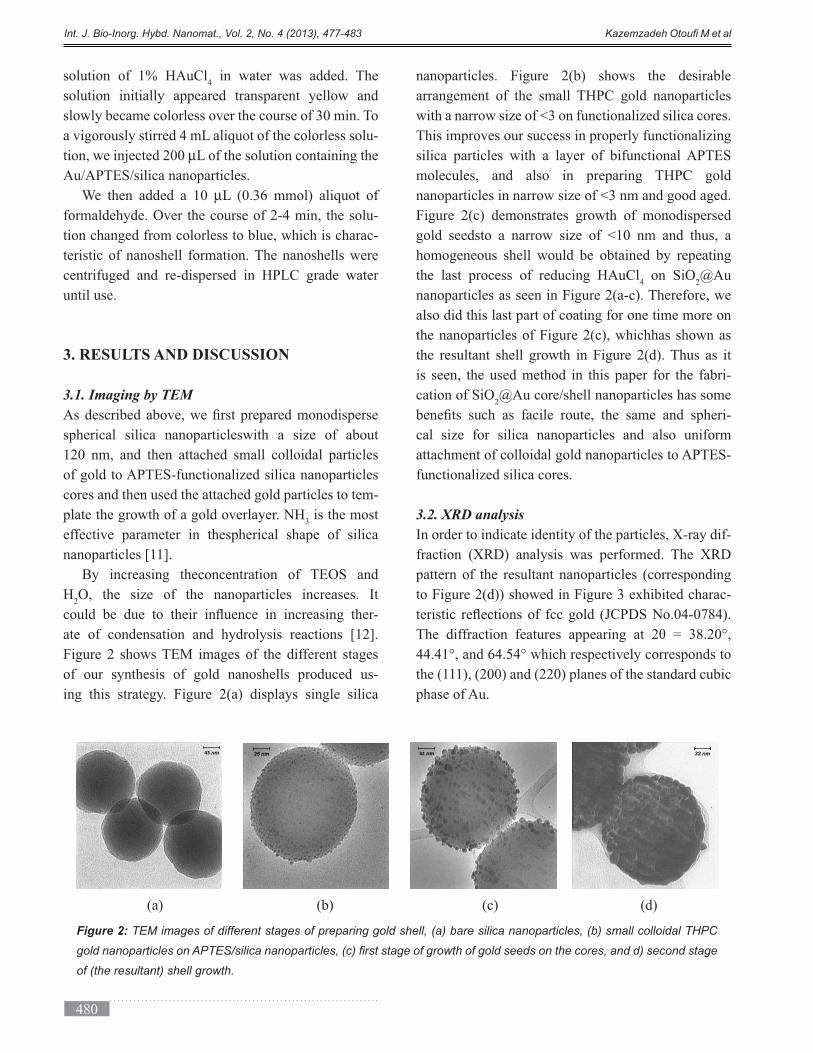
Figure 2 shows TEM images of the different stages
of our synthesis of gold nanoshells produced us-
ing this strategy. Figure 2(a) displays single silica
nanoparticles. Figure 2(b) shows the desirable
arrangement of the small THPC gold nanoparticles
with a narrow size of <3 on functionalized silica cores.
This improves our success in properly functionalizing
silica particles with a layer of bifunctional APTES
molecules, and also in preparing THPC gold
nanoparticles in narrow size of <3 nm and good aged.
Figure 2(c) demonstrates growth of monodispersed
gold seedsto a narrow size of <10 nm and thus, a
homogeneous shell would be obtained by repeating
the last process of reducing HAuCl4 on SiO
2@Au
nanoparticles as seen in Figure 2(a-c). Therefore, we
also did this last part of coating for one time more on
the nanoparticles of Figure 2(c), whichhas shown as
the resultant shell growth in Figure 2(d). Thus as it
is seen, the used method in this paper for the fabri-
cation of SiO2@Au core/shell nanoparticles has some
-
cal size for silica nanoparticles and also uniform
attachment of colloidal gold nanoparticles to APTES-
functionalized silica cores.
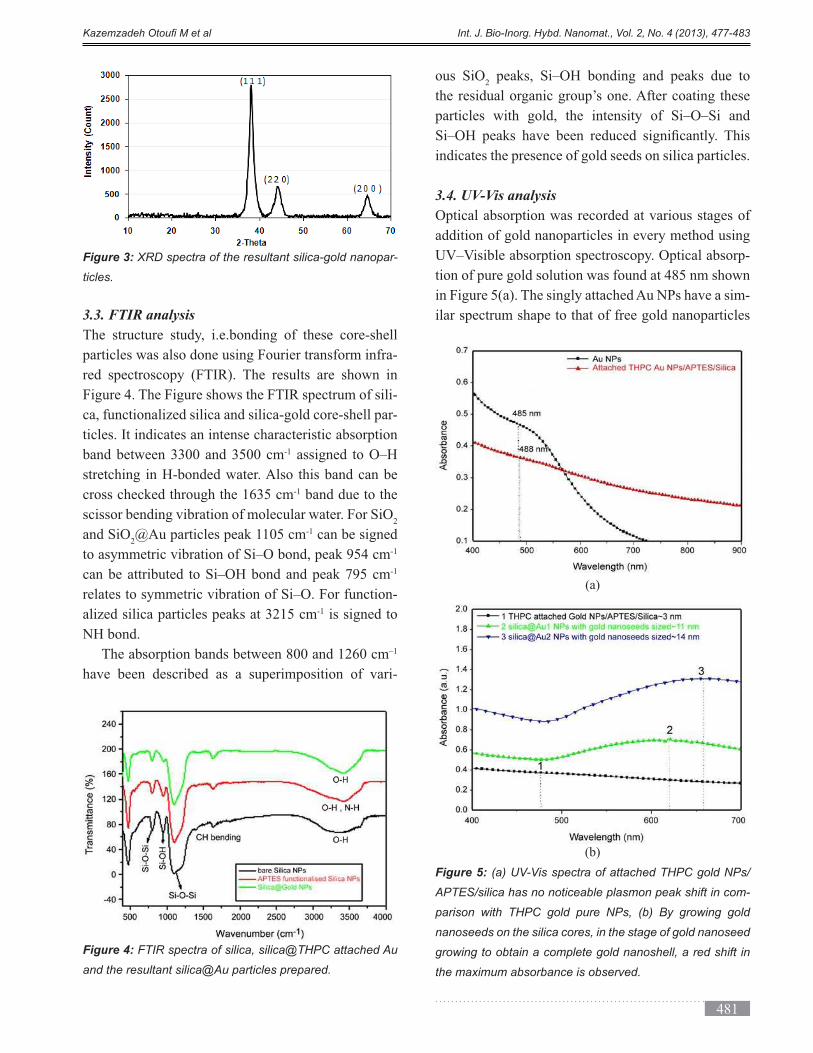
3.2. XRD analysis
In order to indicate identity of the particles, X-ray dif-
pattern of the resultant nanoparticles (corresponding
-
the (111), (200) and (220) planes of the standard cubic
phase of Au.
(a) (b) (c) (d)
Figure 2: TEM images of different stages of preparing gold shell, (a) bare silica nanoparticles, (b) small colloidal THPC
of (the resultant) shell growth.
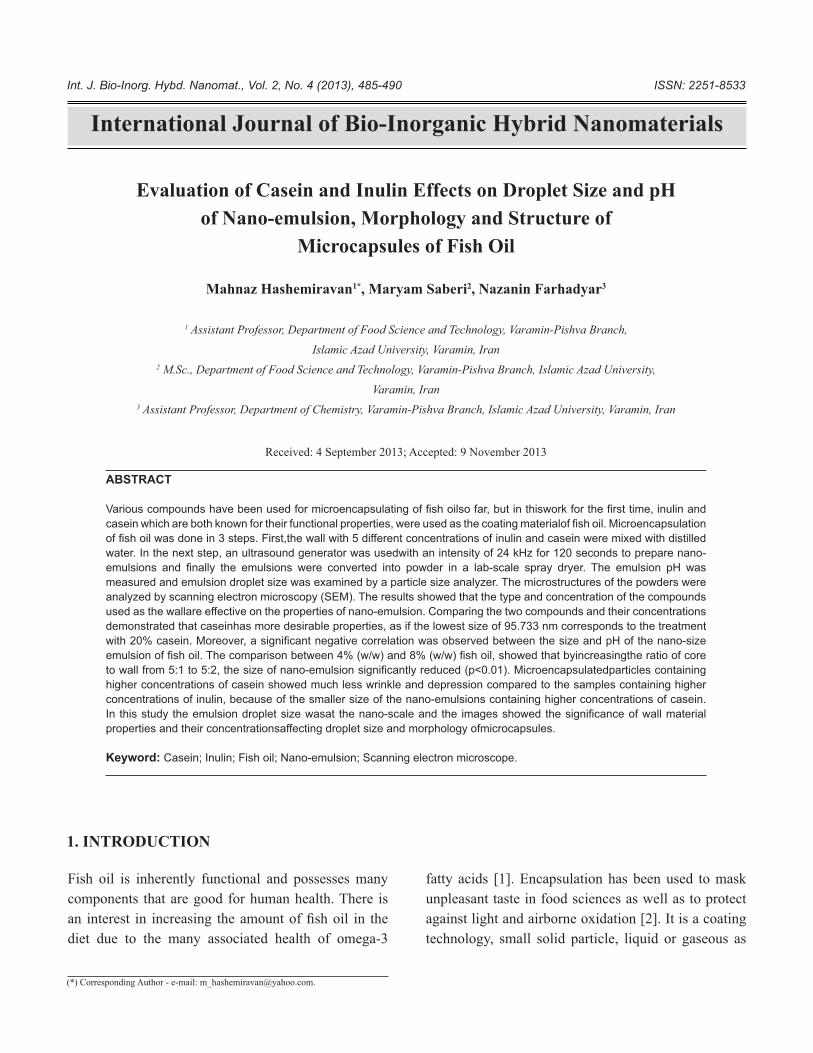
3.3. FTIR analysis
The structure study, i.e.bonding of these core-shell
particles was also done using Fourier transform infra-
red spectroscopy (FTIR). The results are shown in
Figure 4. The Figure shows the FTIR spectrum of sili-
ca, functionalized silica and silica-gold core-shell par-
ticles. It indicates an intense characteristic absorption
band between 3300 and 3500 cm-1 assigned to O–H
stretching in H-bonded water. Also this band can be
cross checked through the 1635 cm-1 band due to the
scissor bending vibration of molecular water. For SiO2
and SiO2@Au particles peak 1105 cm-1 can be signed
-1
-1
relates to symmetric vibration of Si–O. For function-
alized silica particles peaks at 3215 cm-1 is signed to
NH bond. –1
have been described as a superimposition of vari-
ous SiO2 peaks, Si–OH bonding and peaks due to
the residual organic group’s one. After coating these
particles with gold, the intensity of Si–O–Si and
indicates the presence of gold seeds on silica particles.
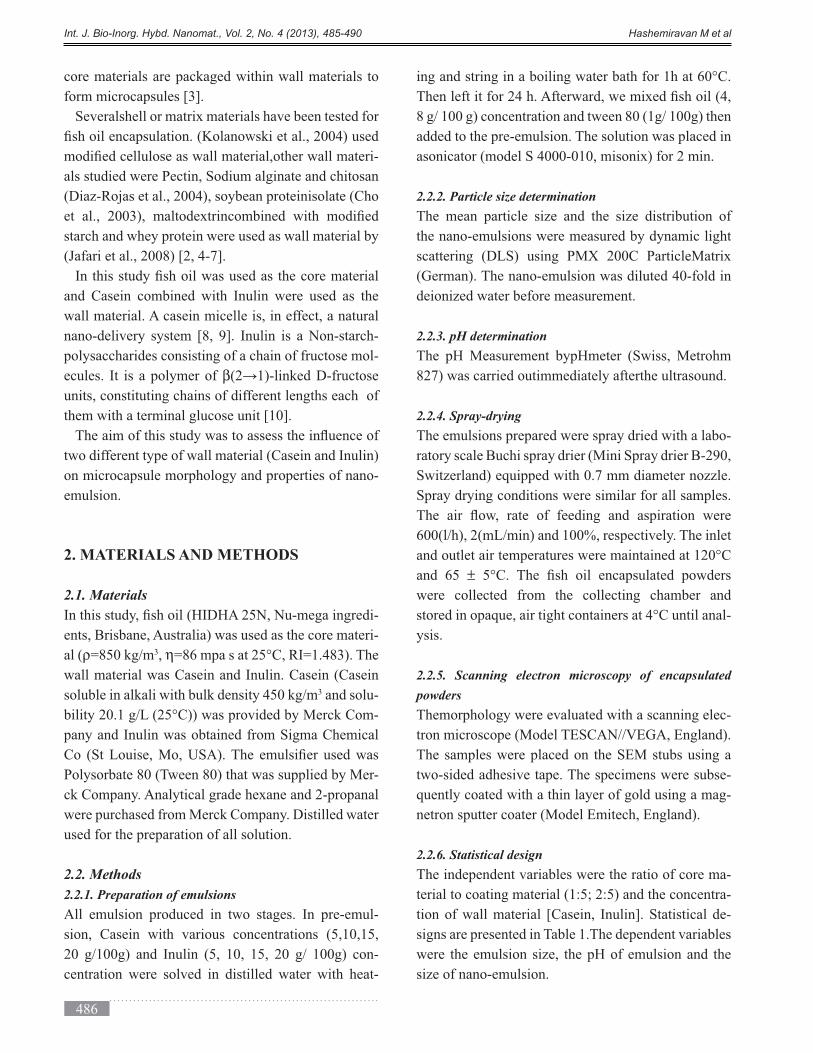
3.4. UV-Vis analysis
Optical absorption was recorded at various stages of
addition of gold nanoparticles in every method using
UV–Visible absorption spectroscopy. Optical absorp-
in Figure 5(a). The singly attached Au NPs have a sim-
ilar spectrum shape to that of free gold nanoparticles
Figure 3: XRD spectra of the resultant silica-gold nanopar-
ticles.
(a)
(b)
Figure 5: (a) UV-Vis spectra of attached THPC gold NPs/
APTES/silica has no noticeable plasmon peak shift in com-
parison with THPC gold pure NPs, (b) By growing gold
nanoseeds on the silica cores, in the stage of gold nanoseed
growing to obtain a complete gold nanoshell, a red shift in
the maximum absorbance is observed.
Figure 4: FTIR spectra of silica, silica@THPC attached Au
and the resultant silica@Au particles prepared.

the plasmon resonance region. In contrast, the absorp-
tion spectrum for gold nanoparticles attached in clus-
ters to silica nanoparticles shows an enhanced absorp-
tion in the plasmon resonance region. This result is
interpreted as a collective effect of the gold nanopar-
ticles in the cluster which would indicate the presence
of gold nanoparticle clusters on the silica nanoparti-
cles and the effect of plasmon-plasmon interactions on
the absorption of the group of gold nanoclusters on a
the UV–Visible spectra of silica-gold core-shell parti-
cles that after two coatings (in SiO2@Au1 and SiO
2@
Au2) the Plasmon peak demonstrated more spreading
and red shift from 622 to 662 nm respectively (Figure
5(b)). So it reveals that as more gold chloride has re-
duced on the attached gold particles and the particles
has begun to grow and merge, Their aspect ratio has
increased and this has leaded to a red shift of the ab-
electron mean free path in the metal shell [15].
3.5. PL analysis
Figure 6 shows the PL emission spectra under 540
silica@Au NPs. The silica@Au NPs prepared by
two methods in water display one strong emis-
does not shift the emission peak position.
4. CONCLUSIONS
Silica@gold core-shell particles were synthesized
by reducing gold chloride on THPC attached silica
nanoparticle cores for several stages. The morphology
of these particles was also studied using TEM. TEM
images demonstrated the growth of monodispersed
gold seeds in narrow sizes up to 10 nm and making
a whole shell by their linkage. Therefore, a uniform
shell was obtained by repeating the last process of
reducing HAuCl4 on these particles on the nanometer
scale. UV–Vis absorption spectroscopy shows a red
-
mon resonance peak position of gold depends upon
the sizes of gold shell seeds. Therefore, by chang-
ing the sizes of gold seeds on core surfaces and thus
by changing shell thicknesses; it is possible to de-
sign a material with desired optical properties.The
spectroscopy.
ACKNOWLEDGEMENTS
-
REFERENCES
Nano-
technology, 21
2. Huang F., Baumberg J.J., Nano Lett., 10 (2010),
J. Phys. Chem. B, 105
Principles of Colloid and
Surface Chemistry
T.R., Hal N.J., Appl. Phys. Lett., 78 (2001), 1502.
Curr. Opin. Biotechnol, 11
(2000), 215.
J.
Biomed. Mater. Res., 51
Pramana J.
Phys., 69 (2007), 277.
Figure 6: PL spectra of silica and silia@Au in comparison
with each other.

An Introduction to Ultrathin Or-
ganic Films
Recent. Patents. Biomed.
Eng., 1
J. Colloid Interface Sc., 26
ACS Appl. Mater. Interfaces, 3
Chem. Mater, 18
(2006), 4115.
JPCS, 188
102.
15. Park J., Estrada A., Sharp K., Sang K., Schwartz
Opt. Express, 16
International Journal of Bio-Inorganic Hybrid Nanomaterials
ABSTRACT
water. In the next step, an ultrasound generator was usedwith an intensity of 24 kHz for 120 seconds to prepare nano-
measured and emulsion droplet size was examined by a particle size analyzer. The microstructures of the powders were
analyzed by scanning electron microscopy (SEM). The results showed that the type and concentration of the compounds
used as the wallare effective on the properties of nano-emulsion. Comparing the two compounds and their concentrations
higher concentrations of casein showed much less wrinkle and depression compared to the samples containing higher
concentrations of inulin, because of the smaller size of the nano-emulsions containing higher concentrations of casein.
properties and their concentrationsaffecting droplet size and morphology ofmicrocapsules.
Keyword: Casein; Inulin; Fish oil; Nano-emulsion; Scanning electron microscope.
(*) Corresponding Author - e-mail: [email protected].
Fish oil is inherently functional and possesses many
components that are good for human health. There is
diet due to the many associated health of omega-3
fatty acids [1]. Encapsulation has been used to mask
unpleasant taste in food sciences as well as to protect
technology, small solid particle, liquid or gaseous as
Evaluation of Casein and Inulin Effects on Droplet Size and pH
of Nano-emulsion, Morphology and Structure of
Microcapsules of Fish Oil
Mahnaz Hashemiravan1*, Maryam Saberi2, Nazanin Farhadyar3
1 Assistant Professor, Department of Food Science and Technology, Varamin-Pishva Branch,
Islamic Azad University, Varamin, Iran
2 M.Sc., Department of Food Science and Technology, Varamin-Pishva Branch, Islamic Azad University,
Varamin, Iran
3 Assistant Professor, Department of Chemistry, Varamin-Pishva Branch, Islamic Azad University, Varamin, Iran
1. INTRODUCTION
Int. J. Bio-Inorg. Hybd. Nanomat., Vol. 2, No. 4 (2013), 485-490 ISSN: 2251-8533
Int. J. Bio-Inorg. Hybd. Nanomat., Vol. 2, No. 4 (2013), 485-490 Hashemiravan M et al
core materials are packaged within wall materials to
form microcapsules [3].
-
als studied were Pectin, Sodium alginate and chitosan
starch and whey protein were used as wall material by
and Casein combined with Inulin were used as the
wall material. A casein micelle is, in effect, a natural
-
polysaccharides consisting of a chain of fructose mol-
ecules. It is a polymer of β
units, constituting chains of different lengths each of
them with a terminal glucose unit [10].
two different type of wall material (Casein and Inulin)
on microcapsule morphology and properties of nano-
emulsion.
2. MATERIALS AND METHODS
2.1. Materials
-
ents, Brisbane, Australia) was used as the core materi-
al (ρ 3, η
wall material was Casein and Inulin. Casein (Casein
soluble in alkali with bulk density 450 kg/m3 and solu-
-
pany and Inulin was obtained from Sigma Chemical
-
used for the preparation of all solution.
2.2. Methods
2.2.1. Preparation of emulsions
All emulsion produced in two stages. In pre-emul-
sion, Casein with various concentrations (5,10,15,
20 g/100g) and Inulin (5, 10, 15, 20 g/ 100g) con-
centration were solved in distilled water with heat-
added to the pre-emulsion. The solution was placed in
2.2.2. Particle size determination
The mean particle size and the size distribution of
the nano-emulsions were measured by dynamic light
(German). The nano-emulsion was diluted 40-fold in
deionized water before measurement.
2.2.3. pH determination
The pH Measurement bypHmeter (Swiss, Metrohm
2.2.4. Spray-drying
The emulsions prepared were spray dried with a labo-
Switzerland) equipped with 0.7 mm diameter nozzle.
Spray drying conditions were similar for all samples.
600(l/h), 2(mL/min) and 100%, respectively. The inlet
and 65 ±
were collected from the collecting chamber and
-
ysis.
2.2.5. Scanning electron microscopy of encapsulated
powders
Themorphology were evaluated with a scanning elec-
tron microscope (Model TESCAN//VEGA, England).
The samples were placed on the SEM stubs using a
two-sided adhesive tape. The specimens were subse-
quently coated with a thin layer of gold using a mag-
netron sputter coater (Model Emitech, England).
2.2.6. Statistical design
The independent variables were the ratio of core ma-
terial to coating material (1:5; 2:5) and the concentra-
tion of wall material [Casein, Inulin]. Statistical de-
signs are presented in Table 1.The dependent variables
were the emulsion size, the pH of emulsion and the
size of nano-emulsion.
Hashemiravan M et al Int. J. Bio-Inorg. Hybd. Nanomat., Vol. 2, No. 4 (2013), 485-490
3. RESULTS AND DISCUSSION
3.1. pHofNano-emulsion
According to the Table (2), the results show that the-
kindand concentration of combination of Casein and
(p<0.05) on the pH of nano-emulsions.
kind of wall material, when nano-emulsion was pre-
pared at 20%wt inulin had the least pH of nano-emul-
sion on the other hand pH of Nano-emulsion had in-
that have relatively high electric charged and it is the
result of the presence of phosphate groups bonded to
serine [11].
3.2. Size of nano-emulsion
The results show that thekind and concentration of-
combination of Case in and Inulin have very signif-
Figure (2) shows that the sample which contains 20%
Formulation Casein (%) Inulin (%) Fish oil (%)
F1
0 20 4 1 75
F2
20 0 4 1 75
F3
10 10 4 1 75
F4
15 5 4 1 75
F5
5 15 4 1 75
F6
0 20 1 71
F7
20 0 1 71
F 10 10 1 71
F 15 5 1 71
F10
5 15 1 71
Table 1:
Nano emulsion
F1
b
F2
5.756 ± 0.60a
F3
5.773±0.011a
F4
a
F5
a
F6
a
F7
4.520±0.070b
F 5.750±0.070a
F a
F10
a
Table 2: pH nano-emulsion of casein at various con-
centration (5, 10, 15 and 20%wt) mixed with inulin 5,
-
ues in the same column shown with similar letters are
Figure 1:
concentration on the pH of nano-emulsion.
Int. J. Bio-Inorg. Hybd. Nanomat., Vol. 2, No. 4 (2013), 485-490 Hashemiravan M et al
higher pH from it is Isoelectric point change between
the shared level of oil and water, it creates repulsion of
electrostatic and also space prevent that avoids water
closing each other [12].
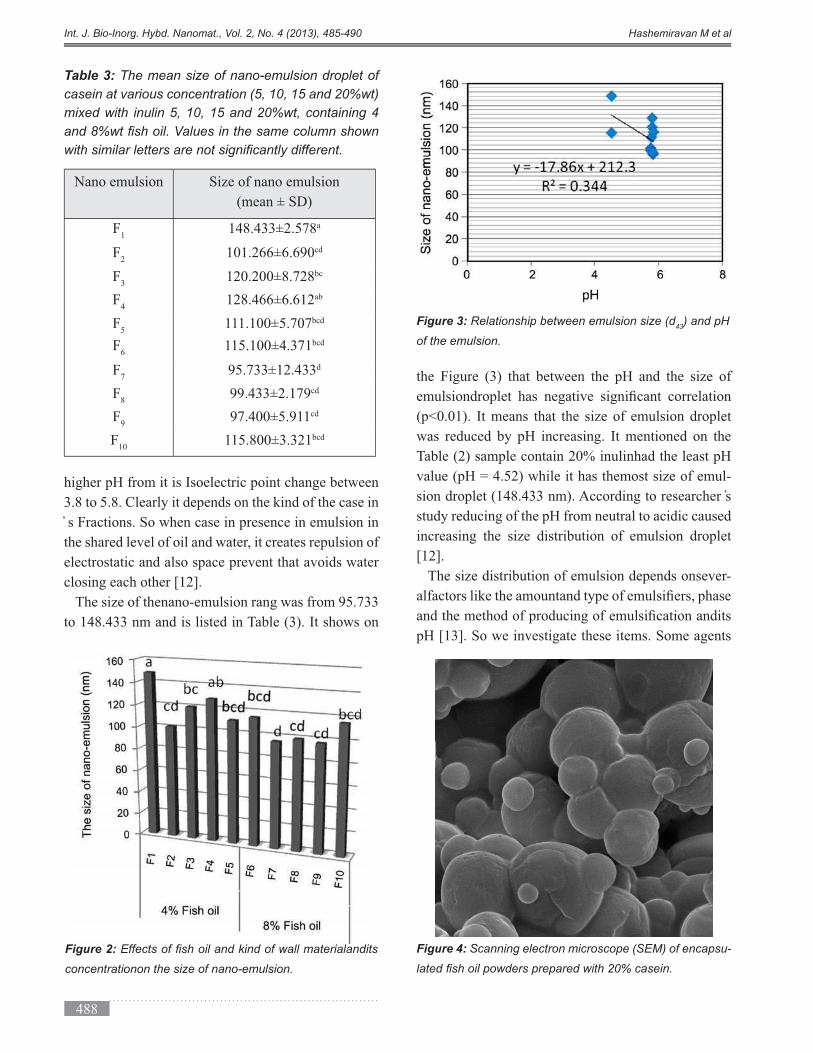
the Figure (3) that between the pH and the size of
(p<0.01). It means that the size of emulsion droplet
was reduced by pH increasing. It mentioned on the
Table (2) sample contain 20% inulinhad the least pH
value (pH = 4.52) while it has themost size of emul-
study reducing of the pH from neutral to acidic caused
increasing the size distribution of emulsion droplet
[12].
The size distribution of emulsion depends onsever-
pH [13]. So we investigate these items. Some agents
Table 3: The mean size of nano-emulsion droplet of
casein at various concentration (5, 10, 15 and 20%wt)
mixed with inulin 5, 10, 15 and 20%wt, containing 4
Nano emulsion Size of nano emulsion
F1
a
F2
cd
F3
bc
F4
ab
F5
111.100±5.707bcd
F6
115.100±4.371bcd
F7
d
F cd
F cd
F10
bcd
Figure 2:
concentrationon the size of nano-emulsion.
Figure 3: Relationship between emulsion size (d43
) and pH
of the emulsion.
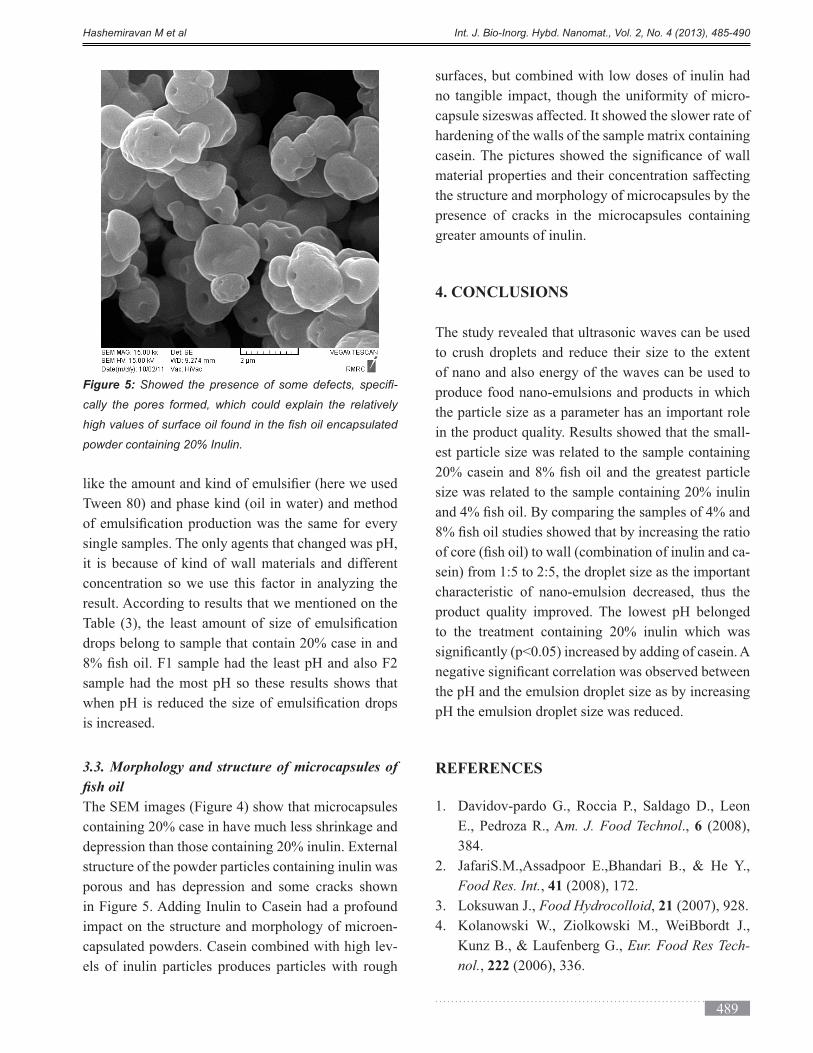
Figure 4: Scanning electron microscope (SEM) of encapsu-
Hashemiravan M et al Int. J. Bio-Inorg. Hybd. Nanomat., Vol. 2, No. 4 (2013), 485-490
single samples. The only agents that changed was pH,
it is because of kind of wall materials and different
concentration so we use this factor in analyzing the
result. According to results that we mentioned on the
drops belong to sample that contain 20% case in and
sample had the most pH so these results shows that
is increased.
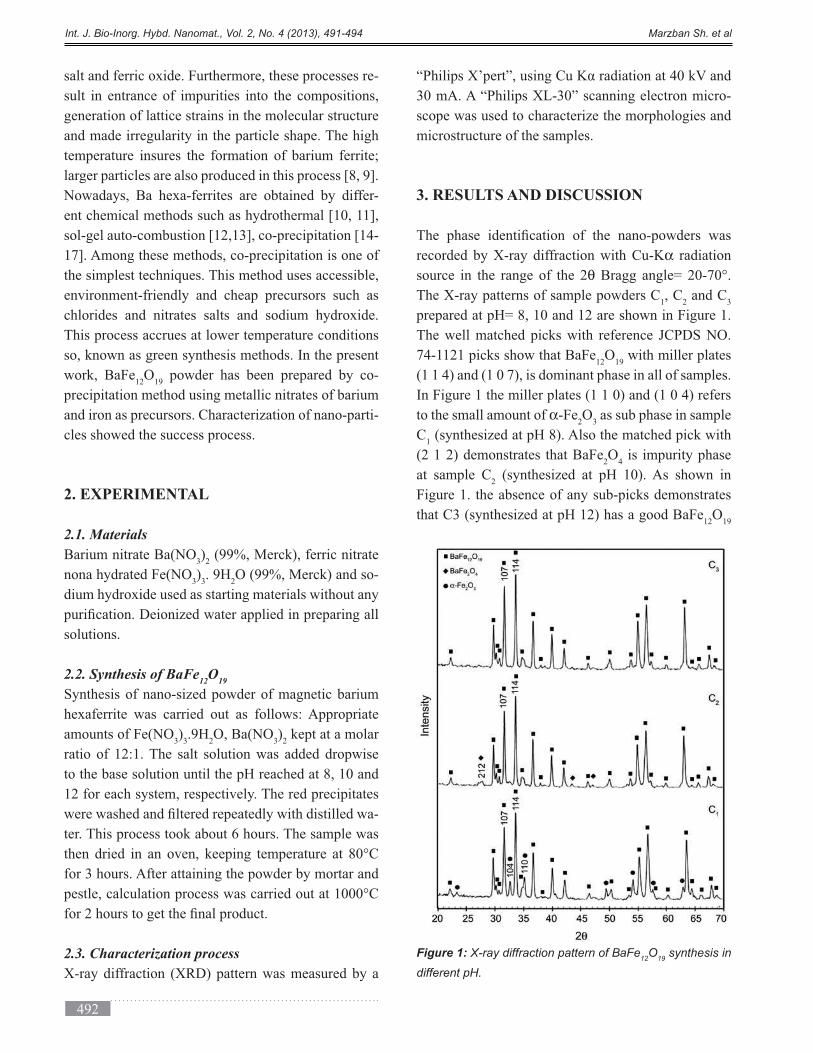
3.3. Morphology and structure of microcapsules of
The SEM images (Figure 4) show that microcapsules
containing 20% case in have much less shrinkage and
structure of the powder particles containing inulin was
porous and has depression and some cracks shown
in Figure 5. Adding Inulin to Casein had a profound
impact on the structure and morphology of microen-
capsulated powders. Casein combined with high lev-
els of inulin particles produces particles with rough
surfaces, but combined with low doses of inulin had
no tangible impact, though the uniformity of micro-
capsule sizeswas affected. It showed the slower rate of
material properties and their concentration saffecting
the structure and morphology of microcapsules by the
presence of cracks in the microcapsules containing
greater amounts of inulin.
4. CONCLUSIONS
The study revealed that ultrasonic waves can be used
of nano and also energy of the waves can be used to
produce food nano-emulsions and products in which
the particle size as a parameter has an important role
in the product quality. Results showed that the small-
est particle size was related to the sample containing
size was related to the sample containing 20% inulin
-
sein) from 1:5 to 2:5, the droplet size as the important
characteristic of nano-emulsion decreased, thus the
product quality improved. The lowest pH belonged
to the treatment containing 20% inulin which was
the pH and the emulsion droplet size as by increasing
pH the emulsion droplet size was reduced.
REFERENCES
E., Pedroza R., Am. J. Food Technol., 6
Food Res. Int., 41
3. Loksuwan J., Food Hydrocolloid, 21
Eur. Food Res Tech-
nol., 222 (2006), 336.
Figure 5: -
cally the pores formed, which could explain the relatively
powder containing 20% Inulin.

Int. J. Bio-Inorg. Hybd. Nanomat., Vol. 2, No. 4 (2013), 485-490 Hashemiravan M et al
Food Hydrocolloid, 18 (2004),
Korean J. Food Sci.
Technol., 32 (2000), 132.
7. Klinkesorn U., Sophanodora P., Chinachoti P.,
Food Hydro-
colloid, 19 (2005), 1044.
Ann. Fac. Medic., 21
Food Hydrocolloid, 21
Petrovsky N., J. Exc. Food Chem., 1 (2010), 27.
Dairy Science and Technology
Handbook, VCH Publisher; Eurika, California,
USA.
Food
Hydrocolloid, 16 (2003), 153.
Langmuir,
1 (2002), 26.

International Journal of Bio-Inorganic Hybrid Nanomaterials
ABSTRACT
Synthesis of BaFe12
O19
magnetic nano particles via precipitation in different pH conditions have been reported. The
certain molar ratio of Fe/Ba = 12 selected and sodium hydroxide was used as a precipitant agent. X-ray Diffraction
(XRD), Scanning Electron Microscopy (SEM) and vibrating sample magnetometer (VSM) were used to consider
the structural, morphological and magnetic properties of barium hexaferrite nano-particles, respectively. Results
demonstrated that pH plays an important role in phase composition; so affected sample properties. The broad
hysteresis loop shows that the barium hexaferrite powder was in good crystalline nature.
Keyword: Barium Hexaferrite; Co-precipitaion; pH; Magnetic Properties; Nanoparticles; Hard Ferrites; XRD.
(*) Corresponding Author - e-mail: [email protected].
Barium ferrites are well known as a hard magnetic ma-
-
-
ties such as chemical stability, corrosion resistivity and
high coercive force. Because of these they could not be
-
and can be considered as a superposition of R and S
[3]. They have potential application in contrast agent in
magnetic resonance imaging (MRI), recording media,
radar absorbing material and as microwave absorber
materials [4-6]. Some of the other applications are ap-
barium ferrite nanoparticles, such as ball milling rout,
requires a high calcination temperature around 1200-
pH and Properties of Synthesized Barium Hexa-Ferrite
by Co-precipitation Method
Shaghayagh Marzban1*, Saeid Abedini Khorrami2
1 M.Sc. Student, Department of Chemistry, Tehran North Branch, Islamic Azad University, Tehran, Iran
2 Associate Professor, Department of Chemistry, Tehran North Branch, Islamic Azad University, Tehran, Iran
1. INTRODUCTION
Int. J. Bio-Inorg. Hybd. Nanomat., Vol. 2, No. 4 (2013), 491-494 ISSN: 2251-8533
Int. J. Bio-Inorg. Hybd. Nanomat., Vol. 2, No. 4 (2013), 491-494 Marzban Sh. et al
-
sult in entrance of impurities into the compositions,
generation of lattice strains in the molecular structure
and made irregularity in the particle shape. The high
temperature insures the formation of barium ferrite;
-
ent chemical methods such as hydrothermal [10, 11],
sol-gel auto-combustion [12,13], co-precipitation [14-
17]. Among these methods, co-precipitation is one of
the simplest techniques. This method uses accessible,
environment-friendly and cheap precursors such as
This process accrues at lower temperature conditions
so, known as green synthesis methods. In the present
work, BaFe12
O powder has been prepared by co-
precipitation method using metallic nitrates of barium
and iron as precursors. Characterization of nano-parti-
cles showed the success process.
2. EXPERIMENTAL
2.1. Materials
Barium nitrate Ba(NO3)
2
nona hydrated Fe(NO3)
3 2-
solutions.
2.2. Synthesis of BaFe12
O19
Synthesis of nano-sized powder of magnetic barium
amounts of Fe(NO3)
3 2O, Ba(NO
3)
2 kept at a molar
ratio of 12:1. The salt solution was added dropwise
12 for each system, respectively. The red precipitates
-
ter. This process took about 6 hours. The sample was
for 3 hours. After attaining the powder by mortar and
2.3. Characterization process
30 mA. A “Philips XL-30” scanning electron micro-
scope was used to characterize the morphologies and
microstructure of the samples.
3. RESULTS AND DISCUSSION
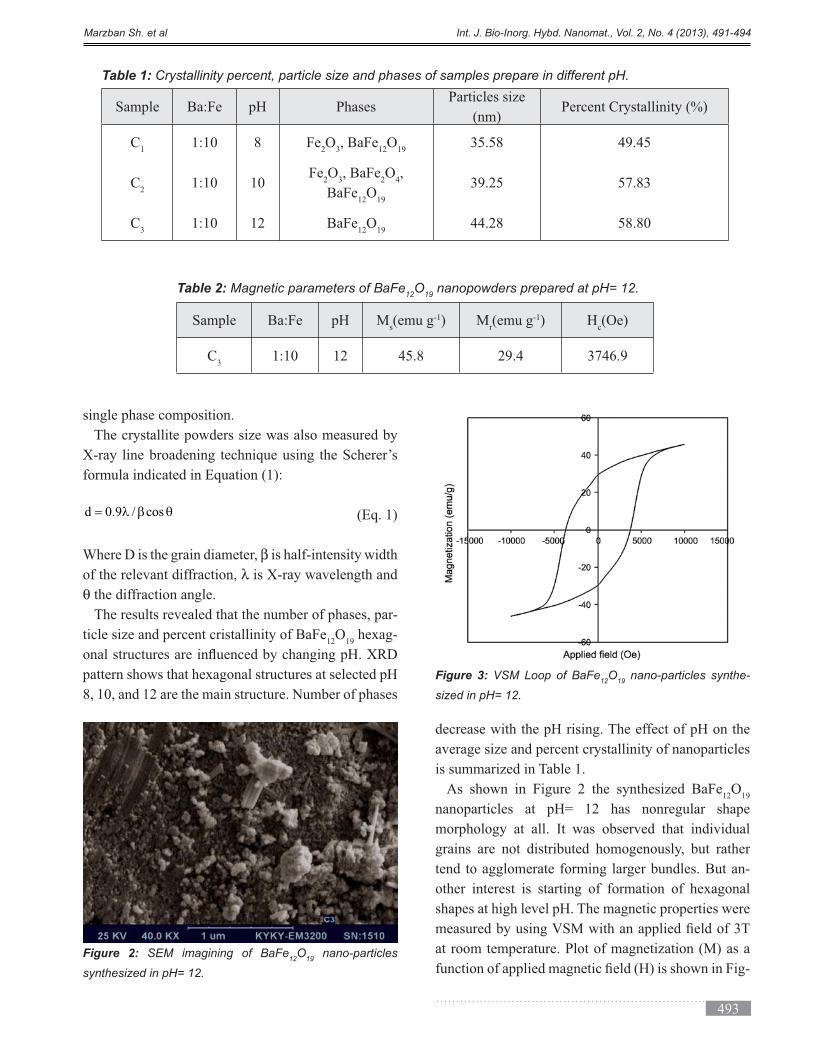
recorded by X-ray diffraction with Cu-Kα radiation
source in the range of the 2θ
The X-ray patterns of sample powders C1, C
2 and C
3
74-1121 picks show that BaFe12
O with miller plates
(1 1 4) and (1 0 7), is dominant phase in all of samples.
In Figure 1 the miller plates (1 1 0) and (1 0 4) refers
to the small amount of α-Fe2O
3 as sub phase in sample
C1
(2 1 2) demonstrates that BaFe2O
4 is impurity phase
at sample C2 (synthesized at pH 10). As shown in
Figure 1. the absence of any sub-picks demonstrates
that C3 (synthesized at pH 12) has a good BaFe12
O
Figure 1: X-ray diffraction pattern of BaFe12
O19
synthesis in
different pH.
Marzban Sh. et al Int. J. Bio-Inorg. Hybd. Nanomat., Vol. 2, No. 4 (2013), 491-494
single phase composition.
The crystallite powders size was also measured by
X-ray line broadening technique using the Scherer’s
formula indicated in Equation (1):
(Eq. 1)
β is half-intensity width
of the relevant diffraction, λ is X-ray wavelength and
θ the diffraction angle.
The results revealed that the number of phases, par-
ticle size and percent cristallinity of BaFe12
O -
decrease with the pH rising. The effect of pH on the
average size and percent crystallinity of nanoparticles
is summarized in Table 1.
As shown in Figure 2 the synthesized BaFe12
O
nanoparticles at pH= 12 has nonregular shape
morphology at all. It was observed that individual
grains are not distributed homogenously, but rather
tend to agglomerate forming larger bundles. But an-
shapes at high level pH. The magnetic properties were
at room temperature. Plot of magnetization (M) as a
-
Sample Ba:Fe pH PhasesParticles size
(nm)Percent Crystallinity (%)
C1
1:10 Fe2O
3, BaFe
12O
C2
1:10 10Fe
2O
3, BaFe
2O
4,
BaFe12
O
C3
1:10 12 BaFe12
O
Sample Ba:Fe pH Ms(emu g-1) M
r(emu g-1) H
c(Oe)
C3
1:10 12
Table 1: Crystallinity percent, particle size and phases of samples prepare in different pH.
Table 2: Magnetic parameters of BaFe12
O19
nanopowders prepared at pH= 12.
Figure 2: SEM imagining of BaFe12
O19
nano-particles
synthesized in pH= 12.
Figure 3: VSM Loop of BaFe12
O19
nano-particles synthe-
sized in pH= 12.
Int. J. Bio-Inorg. Hybd. Nanomat., Vol. 2, No. 4 (2013), 491-494 Marzban Sh. et al
results demonstrated the formation of the pure barium
-
tion magnetization (Ms), remanent magnetization (M
r)
and cervicitis (Hc) of sample C
3, reported in Table 2.
Even though from the SEM analysis particles are not
uniformly distributed but the particle size and particle
morphology are the main reasons for the low coerciv-
ity (Hc
4. CONCLUSIONS
-
sized successfully by co-precipitation technique. Re-
sults demonstrate that pH plays an important role in
the phase formation process. As by pH value increas-
ing, the main phase composition growing up and at
last single phase obtained at pH= 12. Magnetic prop-
erties of sample C3 as a hard magnet, by single phase
REFERENCES
JAMME, 27
2 Valenzuela R., Phys. Res. Inter.
3. Pullar R.C., Prog. Mater. Sci., 57
Appl. Surf. Sci., 259
5. Ozah S., Bhattacharyya N.S., J. Magn. Mater.,
342
Zhai J., Adv. Powder Technol., 24
7. Aksit A.C., Onar N., Ebeoglugil M.F., Birlik I.,
Celik E., Ozdemir E., J. appl. Polym. Sci., 113
Materials, North-Holland, Amsterdam, 3
J. Magn. Mater., 301
Mater. Chem.
Phys., 127 (2011), 415.
11. Janasi S.R., Emura M., Landgraf F.J.G., Rodrigues
J. Magn. Mater., 238
Ind. Eng. Chem.
Res., 39
13. Mali A., Ataie A., J. Al. Com., 399 (2005), 245.
14. (a) Packiaraj G., Nital P., Jotania R.B., J. Biomed.
Bioeng., 1
Adv. Mater. Res., 3052 (2011),
J. Colloid. Inter f. Sci., 235
16. Mallick K.K., Shepherd Ph., Green R.J., J. Eur.
Ceram. Soc., 27 (2007), 2045.
17. Rashad M.M., Ibrahim I.A., J. Magn. Mater., 323
International Journal of Bio-Inorganic Hybrid Nanomaterials
ABSTRACT
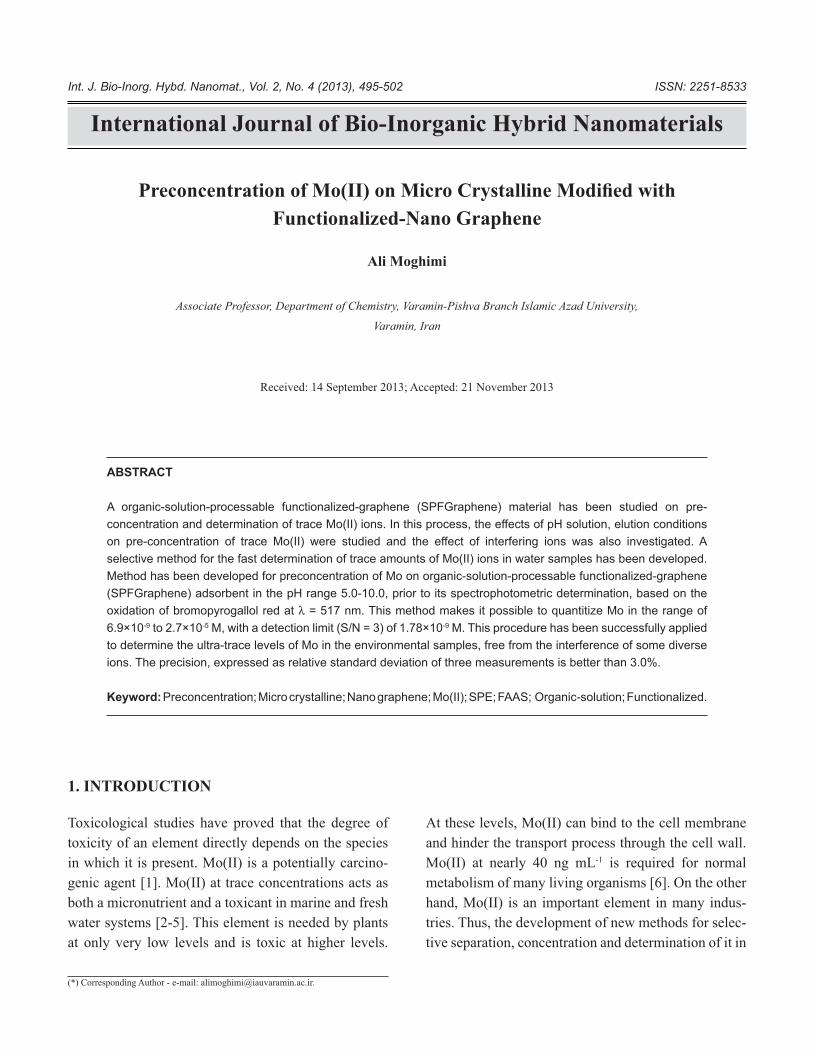
A organic-solution-processable functionalized-graphene (SPFGraphene) material has been studied on pre-
concentration and determination of trace Mo(II) ions. In this process, the effects of pH solution, elution conditions
on pre-concentration of trace Mo(II) were studied and the effect of interfering ions was also investigated. A
selective method for the fast determination of trace amounts of Mo(II) ions in water samples has been developed.
Method has been developed for preconcentration of Mo on organic-solution-processable functionalized-graphene
oxidation of bromopyrogallol red at λ
6.9×10⁻⁹ -9 M. This procedure has been successfully applied
to determine the ultra-trace levels of Mo in the environmental samples, free from the interference of some diverse
Keyword: Preconcentration; Micro crystalline; Nano graphene; Mo(II); SPE; FAAS; Organic-solution; Functionalized.
(*) Corresponding Author - e-mail: [email protected].
in which it is present. Mo(II) is a potentially carcino-
genic agent [1]. Mo(II) at trace concentrations acts as
water systems [2-5]. This element is needed by plants
At these levels, Mo(II) can bind to the cell membrane
and hinder the transport process through the cell wall.
Mo(II) at nearly 40 ng mL-1 is required for normal
metabolism of many living organisms [6]. On the other
hand, Mo(II) is an important element in many indus-
tries. Thus, the development of new methods for selec-
tive separation, concentration and determination of it in
Functionalized-Nano Graphene
Ali Moghimi
Associate Professor, Department of Chemistry, Varamin-Pishva Branch Islamic Azad University,
Varamin, Iran
Received: 14 September 2013; Accepted: 21 November 2013
1. INTRODUCTION
Int. J. Bio-Inorg. Hybd. Nanomat., Vol. 2, No. 4 (2013), 495-502 ISSN: 2251-8533
Int. J. Bio-Inorg. Hybd. Nanomat., Vol. 2, No. 4 (2013), 495-502 Moghimi A
sub-micro levels in different industrial, medicinal and
environmental samples is of continuing interest.
The determination of Mo(II) is usually carried out
spectrometry (AAS) [7] as well as spectrometric
alternatives for traditional classic methods due to se-
lective removal of trace amounts of metal ions from
the most appropriative preformation features of SPE
is achieved by using octadecyl silica membrane disks.
The octadecyl silica membrane disks involves short-
er sample processing time and decreased plugging due
to the large cross-sectional area of the disk and small
channeling resulting from the use of sorbent with
smaller particle size and a greater mechanical stability
of the sorbent bed [13].
-
brane disks with suitable compounds for selective
determination of chromium [14] and lead [11]. Mean-
while, other investigators have successfully utilized
-
toring trace amounts of lead [15], copper [16], silver
Ce [22] and UO2 [12].
The used ligand is new and fairly selective and will
not interfere in the determination process of Mo(II).
Absorption spectrophotometry method (after precon-
centration) was applied for determination of Mo based
Various effective parameters have been evaluated,
and the developed procedure has been successfully
employed for the quantitation of ultra-trace amounts
of Mo in water sample.
2. EXPERIMENTAL
2.1. Apparatus
The glass column with 10 mm i.d. and 200 mm height
was used to make preconcentration column. An
-
ing the absorption spectra. A spectrophotometer (Per-
kin-Elmer model 35) with 10 mm glass cuvette was
Controlling the reaction temperature was done by a
and a stopwatch was used for recording the reaction
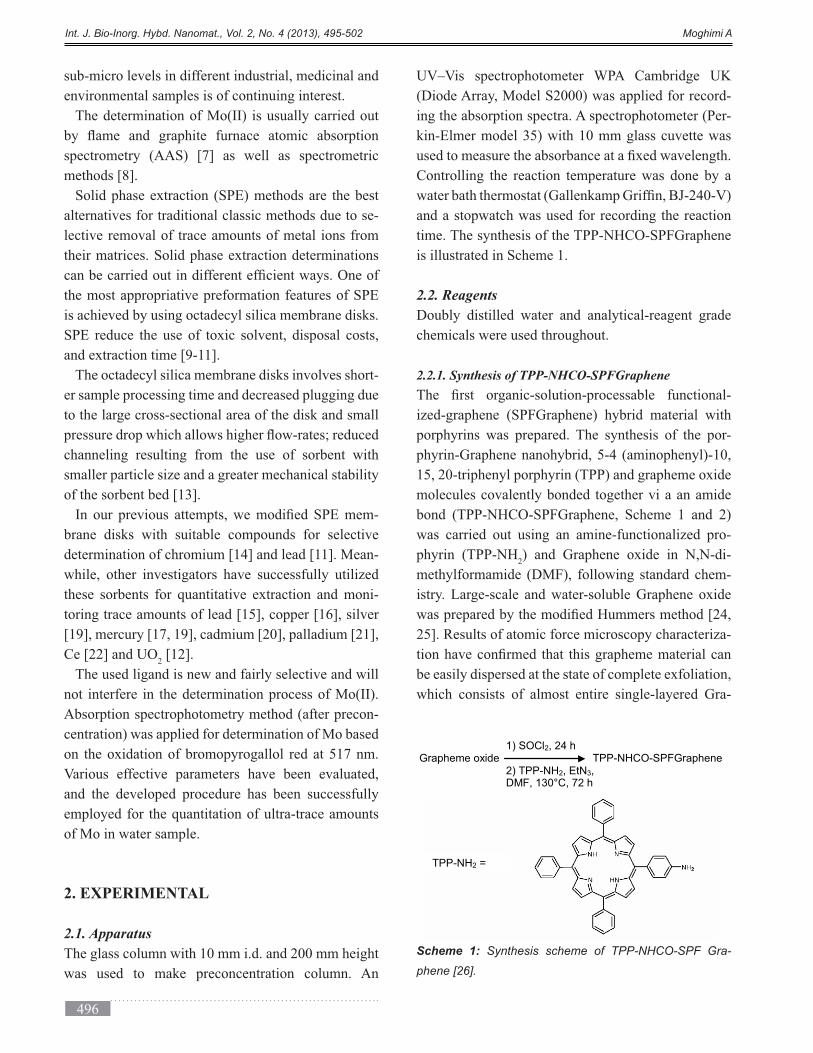
time. The synthesis of the TPP-NHCO-SPFGraphene
is illustrated in Scheme 1.
2.2. Reagents
chemicals were used throughout.
2.2.1. Synthesis of TPP-NHCO-SPFGraphene
-
ized-graphene (SPFGraphene) hybrid material with
porphyrins was prepared. The synthesis of the por-
phyrin-Graphene nanohybrid, 5-4 (aminophenyl)-10,
molecules covalently bonded together vi a an amide
bond (TPP-NHCO-SPFGraphene, Scheme 1 and 2)
was carried out using an amine-functionalized pro-
phyrin (TPP-NH2
-
-
25]. Results of atomic force microscopy characteriza-
which consists of almost entire single-layered Gra-
1) SOCl2, 24 hGrapheme oxide TPP-NHCO-SPFGraphene
2) TPP-NH2, EtN ,
TPP-NH2 =
Scheme 1: Synthesis scheme of TPP-NHCO-SPF Gra-
phene [26].
Moghimi A Int. J. Bio-Inorg. Hybd. Nanomat., Vol. 2, No. 4 (2013), 495-502
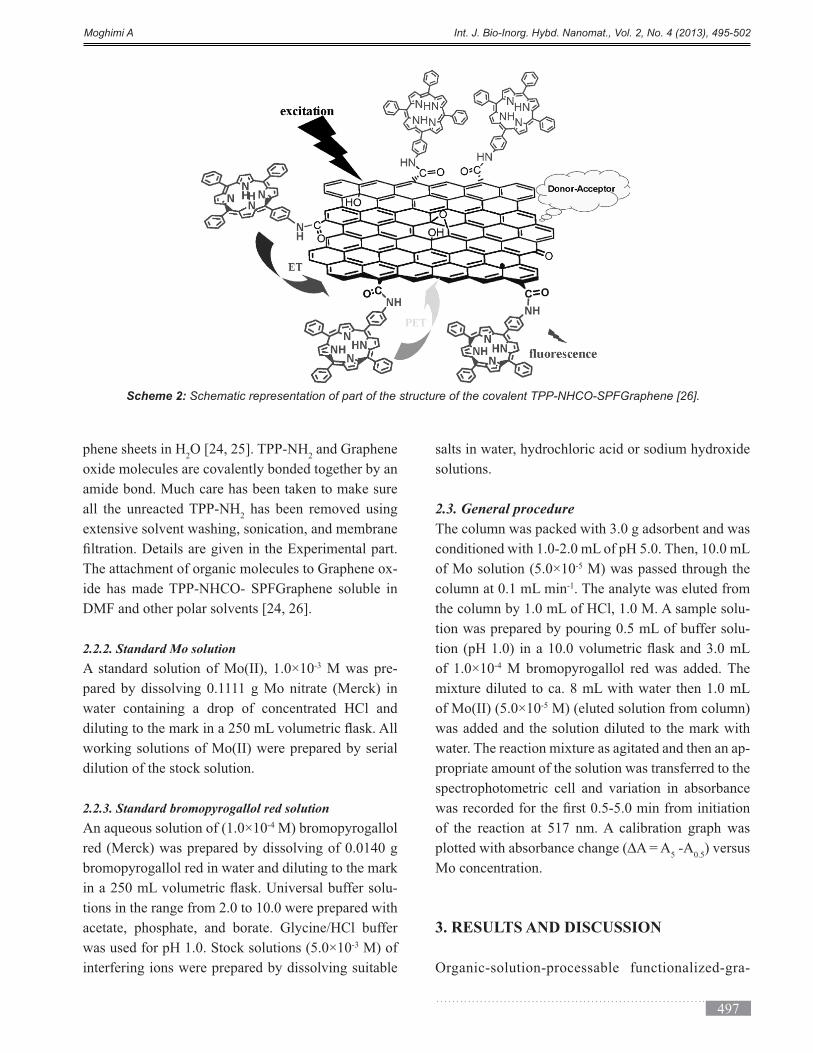
phene sheets in H2O [24, 25]. TPP-NH
2 and Graphene
amide bond. Much care has been taken to make sure
all the unreacted TPP-NH2 has been removed using
-
ide has made TPP-NHCO- SPFGraphene soluble in
2.2.2. Standard Mo solution
A standard solution of Mo(II), 1.0×10⁻³ M was pre-
pared by dissolving 0.1111 g Mo nitrate (Merck) in
water containing a drop of concentrated HCl and
working solutions of Mo(II) were prepared by serial
dilution of the stock solution.
2.2.3. Standard bromopyrogallol red solution
An aqueous solution of (1.0×10⁻⁴ M) bromopyrogallol
red (Merck) was prepared by dissolving of 0.0140 g
bromopyrogallol red in water and diluting to the mark
-
tions in the range from 2.0 to 10.0 were prepared with
acetate, phosphate, and borate. Glycine/HCl buffer
was used for pH 1.0. Stock solutions (5.0×10⁻³ M) of
interfering ions were prepared by dissolving suitable
solutions.
2.3. General procedure
The column was packed with 3.0 g adsorbent and was
conditioned with 1.0-2.0 mL of pH 5.0. Then, 10.0 mL
of Mo solution (5.0×10⁻⁵ M) was passed through the
column at 0.1 mL min-1. The analyte was eluted from
the column by 1.0 mL of HCl, 1.0 M. A sample solu-
tion was prepared by pouring 0.5 mL of buffer solu-
of 1.0×10⁻⁴ M bromopyrogallol red was added. The
of Mo(II) (5.0×10⁻⁵ M) (eluted solution from column)
was added and the solution diluted to the mark with
-
propriate amount of the solution was transferred to the
spectrophotometric cell and variation in absorbance
of the reaction at 517 nm. A calibration graph was
plotted with absorbance change (∆A = A5 -A
0.5) versus
Mo concentration.
3. RESULTS AND DISCUSSION
Organic-solution-processable functionalized-gra-
Scheme 2: Schematic representation of part of the structure of the covalent TPP-NHCO-SPFGraphene [26].
Int. J. Bio-Inorg. Hybd. Nanomat., Vol. 2, No. 4 (2013), 495-502 Moghimi A
phene (SPFGraphene) with the following structure
(Scheme 1) is a new chelating agent which can form
-
dentate bisamide ligand on microcrystalline naphtha-
lene, Mo(II) can be adsorbed. Then desorption of Mo
is carried out by using a strong inorganic acid. The
Mo(II) concentrations were determined spectrophoto-
metrically after passing solution through the column.
-
photometric procedure should be studied.
3.1. Effect of variables on the determination of Mo
Bromopyrogallol red with following structure Figure
-
tion decreases with time, at λ = 517 nm. The change in
the signal is proportional to Mo concentration. Figure
3 shows the absorption spectra of bromopyr-ogallol
-
rophotometric determination) on eluted Mo solution
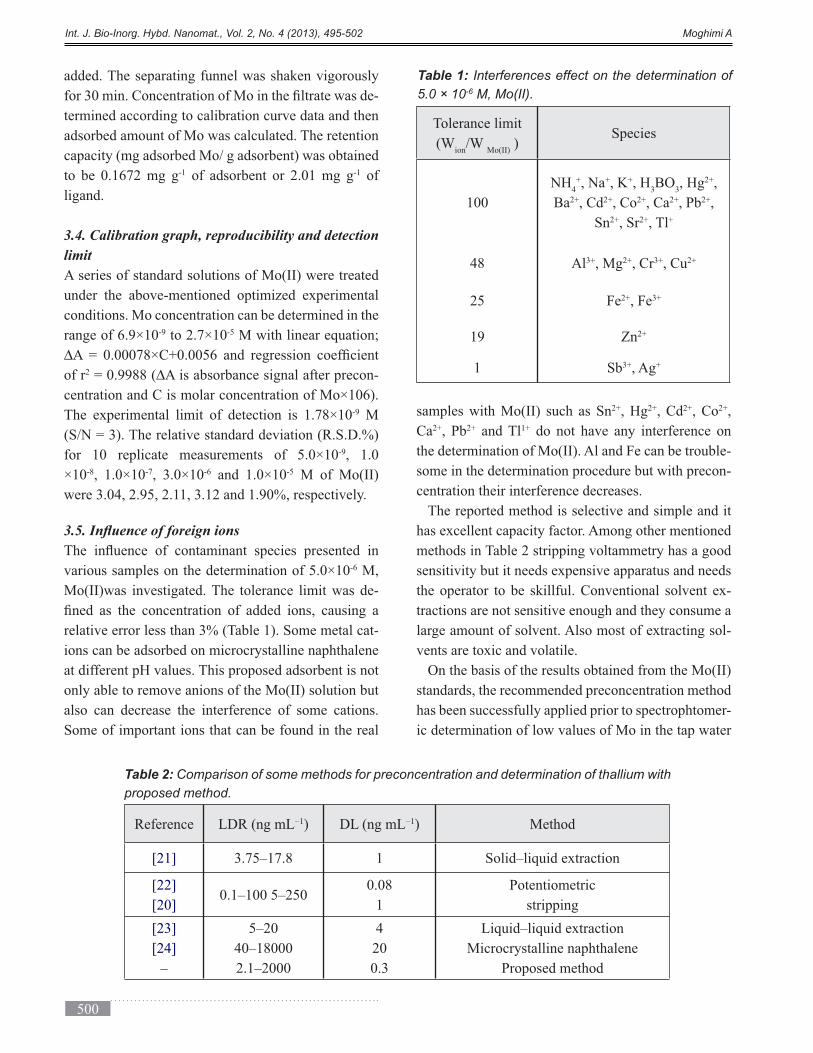
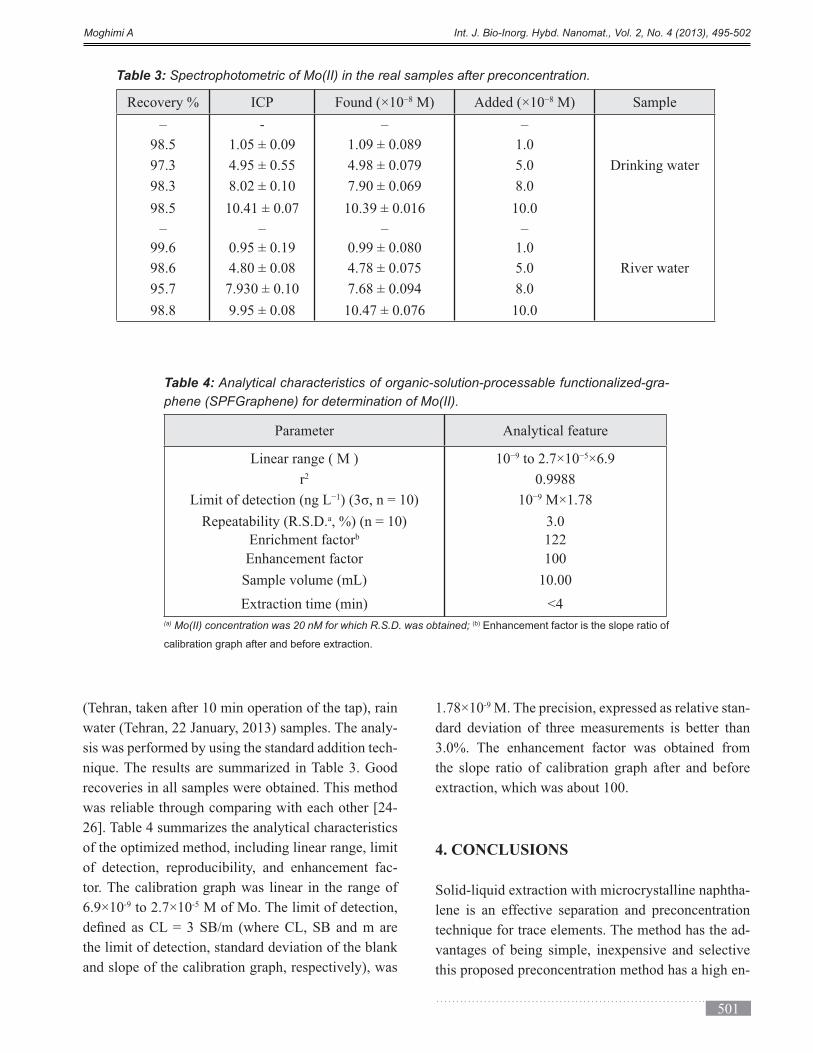
was done at different pH values (1.0-5.0). Figure 2
shows the effect of pH on the net absorbance (∆A).
higher pH values cause decreasing in the signal. At
-
rogallol red increases, thus the reaction rate and ∆A
decreased. Therefore the pH of 1.0 was selected for
-
centration on the reaction rate was tested at pH 1.0
with 1.0×10⁻⁵
seen that the best concentration for bromopyrogallol
Figure 1: Structure of Bromopyrogallol red structure.
Figure 2: Effect of pH on the reaction rate. Conditions: bro-
mopyrogallol red, 1.0×10⁻⁵ M; Mo(II), 1.0×10⁻⁵ M; tempera-
ture, 30°C; measuring time, 5.0 min from initiation of the
reaction.
Figure 3: Effect of bromopyrogallol red concentration on the
reaction rate. Conditions: pH 1.0; Mo(II), 1.0×10⁻⁵ M; tem-
perature, 30°C; measuring time, 5.0 min from initiation of
the reaction.
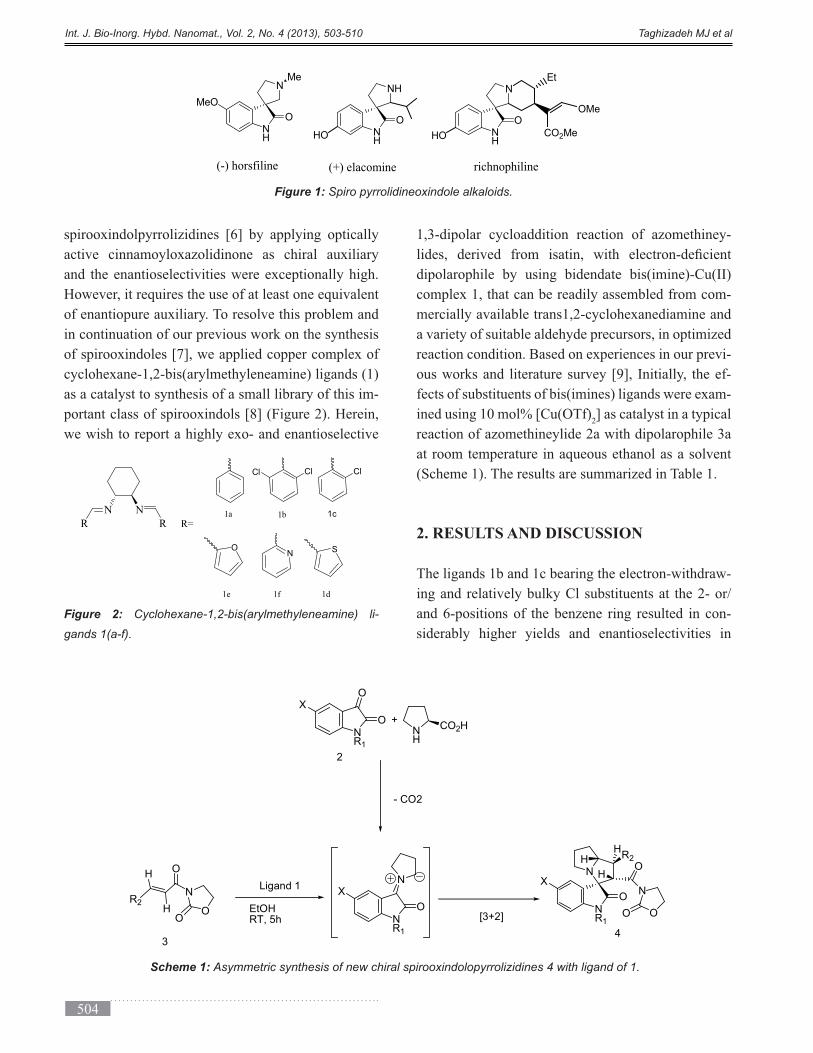
Figure 4: Effect of temperature on the rate of reaction. Con-
ditions: pH 1.0; Mo(II), 1.0×10⁻⁵ M; bromopyrogallol red,
3.0×10⁻⁵ M; measuring time, 5.0 min from initiation of the
reaction.

Moghimi A Int. J. Bio-Inorg. Hybd. Nanomat., Vol. 2, No. 4 (2013), 495-502
red is 3.0×10⁻⁵ M. At higher values the aggregation of
bromopyrogallol red causes the reaction rate to be de-
(∆ -
timum conditions otherwise as previously described.
Figure 4 shows that with increasing temperature up to
∆A signal or the rate of reaction increases. So
bromopyrogallol red can be decomposed.
3.2. Effect of variables on the preconcentration
-
amined in range of 1.0-10.0, and the results are shown
in Figure 5. The results show that in the pH range of
5.0-10.0, the analyte was adsorbed on microcrystal-
line naphthalene quantitate and the recovery was more
be formed on adsorbent (at acidic media, active sites
of ligand will be protonated) and at high pH values,
Mo will precipitate on the column (precipitating in-
stead of adsorption will occur). In order to obtain the
best conditions for determination after preconcentra-
tion and to prevent the precipitation of Mo (especially
at high concentrations), the most acidic pH from this
of analyte retention time was investigated by passing
10.0 mL of Mo(II) (5.0×10⁻⁵ M) solution in the pH 5.0
-
ment with the passed solution. The results show that
microcrystalline naphthalene quantitatively. The best -1. As the Mo
-
chloric acid was selected to desorb the adsorbed ana-
lyte. Figure 6 shows that Mo(II) can be desorbed from
the adsorbent by elution with 1.0 mL, HCl, 1.0 M.
For investigating the ability of microcrystalline naph-
thalene to adsorb Mo(II) after sequential elusions,
the preconcentration process was repeated for many
times. It was indicated that the results were satisfac-
tory, even by using one column for 10 times, with-
out changing the packing. The different volumes of
Mo solution, 1.0×10 M in the range of 10-1000 mL
were passed through the column and the signal of each
eluted solution was compared with calibration curve
data which is achieved from determination method.
The obtained signals of concentrated Mo solutions
presented that a preconcentration factor of 100 can be
achieved by this method. The effect of ionic strength
on the sensitivity was studied. The sensitivity would
be slightly changed with increasing the ionic strength
3.3. Retention capacity of the adsorbent
The retention capacity of organic-solution-process-
able functionalized-graphene (SPFGraphene) adsor-
bent was determined by a batch method. The 20 mL
solution of Mo(II) 1.0×10⁻⁴ M in pH 5.0 was trans-
ferred into a separating funnel and 3 g adsorbent was
Figure 5: Effect of pH on the preconcentration recovery.
Conditions: Mo(II), 5.0×10⁻⁶ -1;
optimum conditions for determination of Mo(II).
Figure 6: Effect of HCl concentration for elution conditions:
Mo(II), 5.0×10⁻⁶ M; Ph 1.0; HCl, 1.0 mL; optimum conditions
for determination of Mo(II).
500
Int. J. Bio-Inorg. Hybd. Nanomat., Vol. 2, No. 4 (2013), 495-502 Moghimi A
added. The separating funnel was shaken vigorously
-
termined according to calibration curve data and then
adsorbed amount of Mo was calculated. The retention
capacity (mg adsorbed Mo/ g adsorbent) was obtained
to be 0.1672 mg g-1 of adsorbent or 2.01 mg g-1 of
ligand.
3.4. Calibration graph, reproducibility and detection
limit
A series of standard solutions of Mo(II) were treated
conditions. Mo concentration can be determined in the
to 2.7×10⁻⁵ M with linear equation;
∆
of r2 ∆A is absorbance signal after precon-
centration and C is molar concentration of Mo×106).
M
for 10 replicate measurements of 5.0×10 , 1.0
×10 , 1.0×10⁻⁷, 3.0×10⁻⁶ and 1.0×10⁻⁵ M of Mo(II)
various samples on the determination of 5.0×10⁻⁶ M,
Mo(II)was investigated. The tolerance limit was de-
relative error less than 3% (Table 1). Some metal cat-
ions can be adsorbed on microcrystalline naphthalene
at different pH values. This proposed adsorbent is not
only able to remove anions of the Mo(II) solution but
also can decrease the interference of some cations.
Some of important ions that can be found in the real
samples with Mo(II) such as Sn , Hg , Cd , Co ,
Ca , Pb and Tl do not have any interference on
the determination of Mo(II). Al and Fe can be trouble-
some in the determination procedure but with precon-
centration their interference decreases.
The reported method is selective and simple and it
methods in Table 2 stripping voltammetry has a good
-
tractions are not sensitive enough and they consume a
-
On the basis of the results obtained from the Mo(II)
standards, the recommended preconcentration method
has been successfully applied prior to spectrophtomer-
ic determination of low values of Mo in the tap water
SpeciesTolerance limit
ion Mo(II) )
NH4
, Na , K , H3BO
3, Hg ,
Ba , Cd , Co , Ca , Pb ,
Sn , Sr , Tl
100
Al , Mg , Cr , Cu
Fe , Fe25
Zn
Sb , Ag1
Method))Reference
1[21]
Potentiometric
stripping10.1–100 5–250
[22]
[20]
Microcrystalline naphthalene
Proposed method
4
20
0.3
5–20
2.1–2000
[23]
[24]
–
Table 1: Interferences effect on the determination of
5.0 × 10⁻⁶ M, Mo(II).
Table 2: Comparison of some methods for preconcentration and determination of thallium with
proposed method.
501
Moghimi A Int. J. Bio-Inorg. Hybd. Nanomat., Vol. 2, No. 4 (2013), 495-502
(Tehran, taken after 10 min operation of the tap), rain
water (Tehran, 22 January, 2013) samples. The analy-
sis was performed by using the standard addition tech-
nique. The results are summarized in Table 3. Good
recoveries in all samples were obtained. This method
was reliable through comparing with each other [24-
26]. Table 4 summarizes the analytical characteristics
of the optimized method, including linear range, limit
of detection, reproducibility, and enhancement fac-
tor. The calibration graph was linear in the range of
to 2.7×10⁻⁵ M of Mo. The limit of detection,
the limit of detection, standard deviation of the blank
and slope of the calibration graph, respectively), was
-
dard deviation of three measurements is better than
3.0%. The enhancement factor was obtained from
the slope ratio of calibration graph after and before
4. CONCLUSIONS
-
lene is an effective separation and preconcentration
technique for trace elements. The method has the ad-
this proposed preconcentration method has a high en-
Table 3: Spectrophotometric of Mo(II) in the real samples after preconcentration.
SampleAdded (×10 M)Found (×10 M)ICPRecovery %
––-–
1.0
5.0
10.010.41 ± 0.07
––––
1.0
River water5.0
10.010.47 ± 0.076
Analytical featureParameter
10 to 2.7×10 ×Linear range ( M )
r2
10 M×Limit of detection (ng L
3.0a, %) (n = 10)
122Enrichment factorb
100Enhancement factor
10.00Sample volume (mL)
<4
Table 4: Analytical characteristics of organic-solution-processable functionalized-gra-
phene (SPFGraphene) for determination of Mo(II).
(a) Mo(II) concentration was 20 nM for which R.S.D. was obtained; (b) Enhancement factor is the slope ratio of
calibration graph after and before extraction.

502
Int. J. Bio-Inorg. Hybd. Nanomat., Vol. 2, No. 4 (2013), 495-502 Moghimi A
richment factor (100) which develops possibility of
determining concentration levels as low as sub micro
amounts of Mo with eliminating the interference of
some diverse ions. The selected determination proce-
dure (after preconcentration) is convenient, sensitive
and fairly selective.
ACHNOWLEDGMENTS
The authors wish to thank the chemistry department
of Varamin branch Islamic Azad University for
REFERENCES
1. Izatt R.M., Bradshaw J.S., Nielsen S.A., Lamb
Chem. Rev., 85
2. Izatt R.M., Pawlak K., Bradshaw J.S., Bruening
R.L., Chem. Rev., 91
3. Izatt R.M., Pawlak K., Bradshaw J.S., Bruening
R.L., Chem. Rev., 95
A., Isaia F., Lippolis V., Schroder M., Verani G., J.
Chem. Soc., Dalton Trans
-
lanova F.A., Garau A., Isaia F., Lippolis V., Kive-
kas R., Muns V., Schroder M., Verani G., J. Chem.
Soc., Dalton Trans
6. Gomes M.M., Hidalgo Garcia M.M., Palacio Cor-
villo M.A., Analyst, 120
Anal. Chem., 61
Talanta, 44
Talanta, 44
10. Mahmoud M.E., Talanta, 45
11. Mahmoud M., Anal. Chim. Acta, 398
In: Proceeding of the 25th
FACSS Conference, Austin, TX, USA, and 11–15
October.
Anal. Chim. Acta,
230
14. Moghimi A., Ghiasi R., Abedin A.R., Ghammamy
S., Afr. J. Pure Appl. Chem., 3
15. Moghimi A., Chin. J. Chem., 25 (10) (2007), 640.
Ma-
ter. Sci. Res. India, 3 (1a) (2006), 27.
17. Moghimi A., Abdouss M., Afr. J. Pure Appl.
Chem., 6
Talanta, 48
J.
Appl. Polym. Sci, 110
20. Tabarzadi M., Abdouss M., Hasani S.A., Shoush-
tary A.M., Matwiss U., Werkstofftech, 41 (4)
(2010), 221.
Ind.
Eng. Res., 43 (2004), 2060.
22. Nayebi P., Moghimi A., Orient. J. Chem., 22 (3)
(2006), 507.
-
mi A., Aghabozorg H., Ganjali M. R., Microchem.
J., 69 (2001), 1.
24. Ganjali M.R., Pourjavid M.R., Hajiagha Babaei
L., Niasari M.S., Quim Nova, 27 (2004), 213.
25. Moghimi A., Shabanzadeh M., JCHR, 2 (2)
(2012), 7.
26. Tang C., Tracz A., Kruk M., Zhang R., Smilgies
J. Am.
Chem. Soc., 127

International Journal of Bio-Inorganic Hybrid Nanomaterials
ABSTRACT
The catalytic highly regio- diastereo-, and enantioselective synthesis of a small library of spiropyrrolizidineoxindoles
Keyword:
Three-component reaction; Proline; Sarcosine.
(*) Corresponding Author - e-mail: [email protected].
Catalytic asymmetric multicomponent reaction (CAM-
chirality economy and environmental benignity. In ad-
dition, this strategy has manifested as a powerful tool
diversity [1]. It is therefore desirable to utilize and de-
velop this method for the synthesis of important het-
[4] (Figure 1). Asymmetric multicomponent 1,3 dipo-
lar cycloaddition of azomethineylides with alkenes can
be a great interest and useful strategies for stereoselec-
tive synthesis and develop of these class of molecules
and compounds having similar structure [5].
Three-Component Procedure for the Synthesis Chiral
Spirooxindolopyrrolizidines via Catalytic Highly Enantioselective
1,3-Dipolar Cycloaddition of Azomethineylides
and 3-(2-Alkenoyl)-1,3-Oxazolidin-2-ones
Mohammad Javad Taghizadeh1*, Khosrow Jadidi2
1 Ph.D.Student, Department of Chemistry, University of Imam Hossein, Tehran, Iran
2 Ph.D., Department of Chemistry, University of Shahid Beheshti, Tehran, Iran
1. INTRODUCTION
Int. J. Bio-Inorg. Hybd. Nanomat., Vol. 2, No. 4 (2013), 503-510 ISSN: 2251-8533
504
Int. J. Bio-Inorg. Hybd. Nanomat., Vol. 2, No. 4 (2013), 503-510 Taghizadeh MJ et al
However, it requires the use of at least one equivalent
in continuation of our previous work on the synthesis
as a catalyst to synthesis of a small library of this im-
1,3-dipolar cycloaddition reaction of azomethiney-
dipolarophile by using bidendate bis(imine)-Cu(II)
-
a variety of suitable aldehyde precursors, in optimized
-
-
-
ined using 10 mol% [Cu(OTf)2] as catalyst in a typical
reaction of azomethineylide 2a with dipolarophile 3a
at room temperature in aqueous ethanol as a solvent
(Scheme 1). The results are summarized in Table 1.
2. RESULTS AND DISCUSSION
The ligands 1b and 1c bearing the electron-withdraw-
ing and relatively bulky Cl substituents at the 2- or/
and 6-positions of the benzene ring resulted in con-
siderably higher yields and enantioselectivities in
NH
NMe
O
MeO
NH
NH
O
HO NH
N
O
HO
Et
OMe
CO2Me
(-) horsfiline ( ) elacomine richnophiline
Figure 1: Spiro pyrrolidineoxindole alkaloids.
NR1
X
O
O
+NH
CO2H
NR1
NX
O
R2H
H
HO
N
NR1
X
O
N
EtOHRT, h
- CO2
2
[ +2] OO
O
N
OO
H
HR2
Ligand 1
4
Figure 2: Cyclohexane-1,2-bis(arylmethyleneamine) li-
gands 1(a-f).
Scheme 1: Asymmetric synthesis of new chiral spirooxindolopyrrolizidines 4 with ligand of 1.
NN
RR R=
N
ClCl Cl
SO
1a 1b 1c
1e 1f 1d
505
Taghizadeh MJ et al Int. J. Bio-Inorg. Hybd. Nanomat., Vol. 2, No. 4 (2013), 503-510
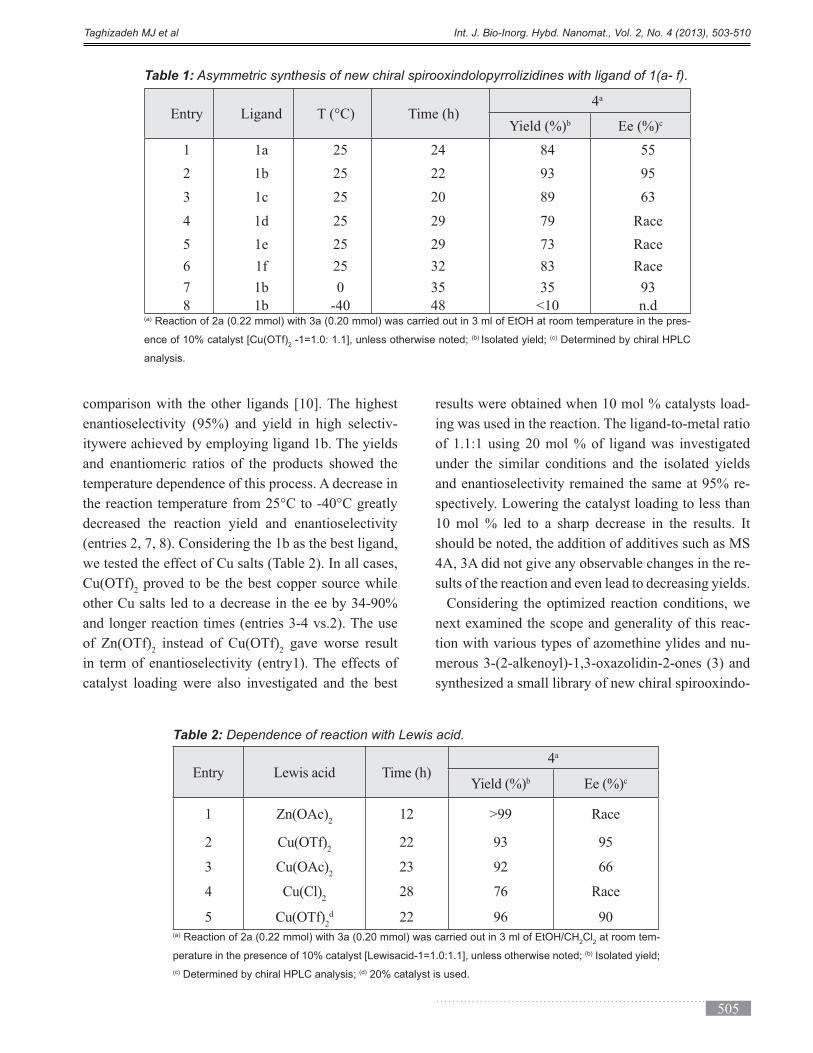
comparison with the other ligands [10]. The highest
-
itywere achieved by employing ligand 1b. The yields
and enantiomeric ratios of the products showed the
temperature dependence of this process. A decrease in
decreased the reaction yield and enantioselectivity
we tested the effect of Cu salts (Table 2). In all cases,
Cu(OTf)2 proved to be the best copper source while
and longer reaction times (entries 3-4 vs.2). The use
of Zn(OTf)2 instead of Cu(OTf)
2 gave worse result
in term of enantioselectivity (entry1). The effects of
catalyst loading were also investigated and the best
results were obtained when 10 mol % catalysts load-
ing was used in the reaction. The ligand-to-metal ratio
of 1.1:1 using 20 mol % of ligand was investigated
under the similar conditions and the isolated yields
-
spectively. Lowering the catalyst loading to less than
10 mol % led to a sharp decrease in the results. It
should be noted, the addition of additives such as MS
4A, 3A did not give any observable changes in the re-
sults of the reaction and even lead to decreasing yields.
Considering the optimized reaction conditions, we
-
tion with various types of azomethine ylides and nu-
-
Entry Ligand Time (h)4a
b Ee (%)c
1 1a 25 24 55
2 1b 25 22
3 1c 25 20 63
4 1d 25 Race
5 1e 25 73 Race
6 1f 25 32 Race
7 1b 0 35 35
1b -40 <10 n.d
Table 1: Asymmetric synthesis of new chiral spirooxindolopyrrolizidines with ligand of 1(a- f).
(a) -
ence of 10% catalyst [Cu(OTf)2 -1=1.0: 1.1], unless otherwise noted; (b) Isolated yield; (c) Determined by chiral HPLC
analysis.
Entry Lewis acid Time (h)4a
b Ee (%)c
1 Zn(OAc)2
12 Race
2 Cu(OTf)2
22
3 Cu(OAc)2
23 66
4 Cu(Cl)2
76 Race
5 Cu(OTf)2
d 22
Table 2: Dependence of reaction with Lewis acid.
(a)2Cl
2 at room tem-
perature in the presence of 10% catalyst [Lewisacid-1=1.0:1.1], unless otherwise noted; (b) Isolated yield;
(c) Determined by chiral HPLC analysis; (d) 20% catalyst is used.

506
Int. J. Bio-Inorg. Hybd. Nanomat., Vol. 2, No. 4 (2013), 503-510 Taghizadeh MJ et al
lopyrrolizidines 4a-j (Table 3).
The structures of cycloadducts were assigned from
their elemental and spectroscopic analyses including
IR, 1H NMR, 13C NMR, and mass spectral data. The
observation of two characteristic triplets and one dou-
blet in the 1
unambiguously the formation of a new pyrrolizidine
-
reochemistry of products 4 that was carried out here
using several NMR spectroscopy techniques. The
ORTEP view of single crystal X-ray analysis of 4g
with atomic numbering is shown in Figure 3. On the
basis of X-ray structure of 4, we can now assign the
(C13). X-ray crystallographic analysis of compound
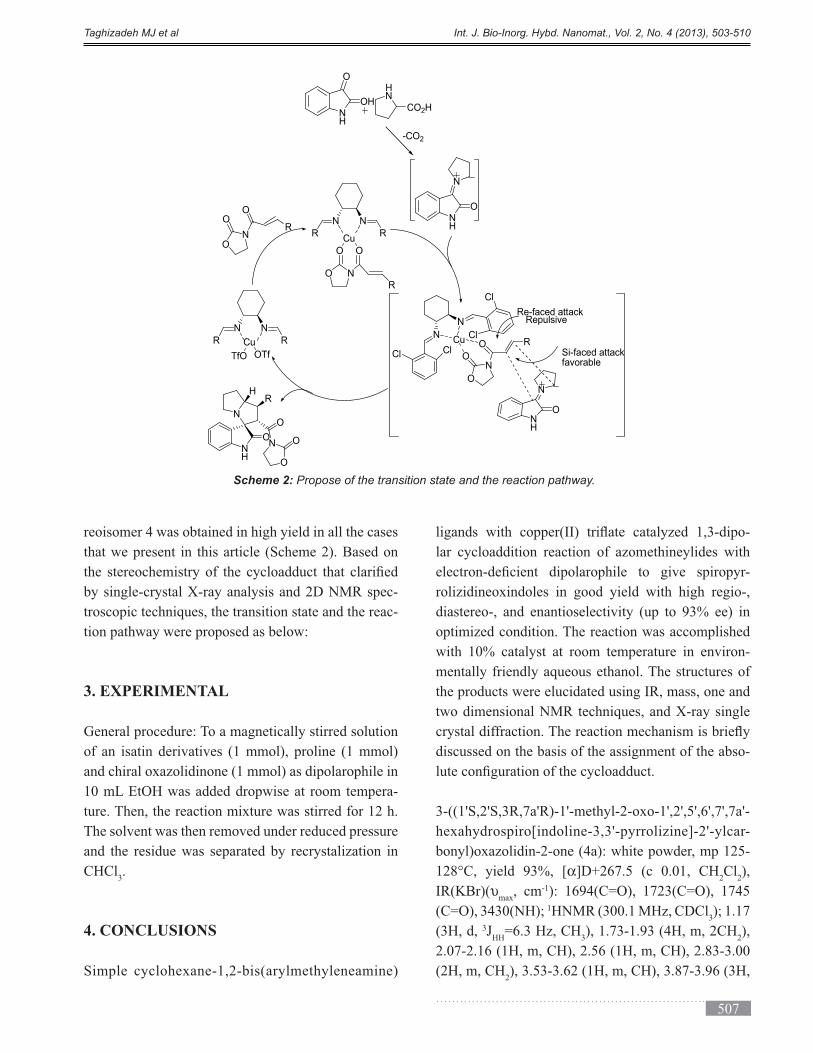
Because reactions of most non-stabilized azome-
HOMO (dipole)-LUMO(dipolarophile) controlled [11],
thus, in order to obtain an increased reaction rate, the
3-Cu(OTf)2
dipolarophileto form square planner geometry [12].
On the other hand, condensation of isatin derivative
-
dition of activated dipolarophileswithazomethineylide
-
rolizidine 4 which contain contiguous stereogenic
-
isomers could be prepared theoretically, only diaste-
Entry X R1
R2
Product
1 H H Me 4a
2 H H Ph 4b
3 H Me Me 4c
4 H Et Ph 4d
5 H Bn Me 4e
6 Br H Me 4f
7 Br Me Me 4g
Br Et Me 4h
10 Br Me Ph 4i
11 NO2
H Me 4j
Table 3: Asymmetric synthesis of new chiral spirooxindolopyrrolizidines de-
rivaitives 4.
Figure 3: ORTEP diagram of one of the four crystallograph-
ic independent molecules in the asymmetric unit of 4g. Ther-
mal ellipsoids are at 30% probability level.
507
Taghizadeh MJ et al Int. J. Bio-Inorg. Hybd. Nanomat., Vol. 2, No. 4 (2013), 503-510
reoisomer 4 was obtained in high yield in all the cases
that we present in this article (Scheme 2). Based on
-
troscopic techniques, the transition state and the reac-
tion pathway were proposed as below:
3. EXPERIMENTAL
General procedure: To a magnetically stirred solution
of an isatin derivatives (1 mmol), proline (1 mmol)
10 mL EtOH was added dropwise at room tempera-
The solvent was then removed under reduced pressure
and the residue was separated by recrystalization in
CHCl3.
4. CONCLUSIONS
-
lar cycloaddition reaction of azomethineylides with
-
optimized condition. The reaction was accomplished
with 10% catalyst at room temperature in environ-
mentally friendly aqueous ethanol. The structures of
the products were elucidated using IR, mass, one and
two dimensional NMR techniques, and X-ray single
discussed on the basis of the assignment of the abso-
-
α2Cl
2),
IR(KBr)(υ , cm-1
(C=O), 3430(NH); 13); 1.17
(3H, d, 3JHH
=6.3 Hz, CH3 2
),
(2H, m, CH2
NH
N
O
R
O
N
O
O
H
NH
HN
CO2H
O
OH
NH
N
O
NN
RRCu
OO
O N
R
NN
R RCu
OTfTfO
ON
OO
R
N
N
Cl
Cl
Cu
O
NO
O R
Re-faced attackRepulsive
Cl
Cl
NH
N
O
Si-faced attackfavorable
-CO2
Scheme 2: Propose of the transition state and the reaction pathway.
Int. J. Bio-Inorg. Hybd. Nanomat., Vol. 2, No. 4 (2013), 503-510 Taghizadeh MJ et al
m, CH and CH2), 4.13-4.21 (1H, m, CH), 4.31 (1H, d,
3JHH
s, NH); 13
3 3),
2
3C=O); MS, 352 (M
-
α2Cl
2),
IR(KBr)(υ , cm-1
(C=O), 3430(NH); 1
3);
1.77-2.02 (4H, m, 2CH2), 2.67 (1H, m, CH), 3.15
OCH2
3JHH
13
3
(4C, 4CH2
OCH2
(M ,7), 200 (100), 131 (70).
α2Cl
2),
IR(KBr) (υ , cm-1
(C=O); 1
3); 1.16 (3H, d,
3JHH
=6.3 Hz, CH3), 1.72-2.13 (4H, m, 2CH
2), 2.57
3.16 (3H, s, NCH3
m, CH and CH2), 4.11 (1H, m, CH), 4.21 (1H, m,
3JHH
3JHH
(1H, m, CH), 7.14 (1H, d, 3JHH
m, CH); 13
3); 16.4 (1C,
CH3), 24.7, 26.4, 27.6, 43.1, 62.7 (5C, 5CH
2), 41.2
(1C, NCH3
,
α
(c 0.01, CH2Cl
2) IR(KBr) (υ , cm-1): 1613(C=O),
1HNMR (300.1 MHz,
3
3JHH
=7.2 Hz, CH3), 1.76-2.01 (4H,
m, 2CH2), 2.67 (1H, m, CH), 3.13 (1H, m, CH), 3.61
2), 4.46
3JHH
13
3
(1C, CH3 2
), 35.0
(1C, NCH2
OCH2
(M
α
0.01, CH2Cl
2), IR(KBr) (υ , cm-1): 1616(C=O),
1HNMR (300.1 MHz,
3); 1.15 (3H, d, 3J
HH=6.6 Hz, CH
3
(4H, m, 2CH2), 2.65(1H, m, CH), 3.16 (1H, m, CH),
2
4.11(2H, m, CH2), 4.52(1H, m, CH), 4.76 (1H, d,
3JHH
3JHH
5.13 (1H, d, 3JHH
Ar-H); 13
3); 15.5(1C, CH
3),
2
3CH), 54.3 (1C, NCH2 2
), 72.1(1C),
α
(c 0.01, CH2Cl
2), IR(KBr) (υ , cm-1): 1614(C=O),
1HNMR (300.1
3); 1.15 (3H, d, 3J
HH=6.7 Hz, CH
3), 1.76-
2), 2.07-2.17 (1H, m, CH
2), 2.57 (1H,
2), 3.56 (1H, dt, 2J
HH=12
Hz, 3JHH 2
),

Taghizadeh MJ et al Int. J. Bio-Inorg. Hybd. Nanomat., Vol. 2, No. 4 (2013), 503-510
4.16 (1H, dt, 2JHH
=12 Hz, 3JHH
=6 Hz, CH), 4.31 (1H, d, 3J
HH
3JHH
(1H, m, Ar-H), 7.47 (1H, d, 3JHH
(1H, s, NH); 13
3); 16.1(1C,
CH3), 24.2, 27.4, 41.2, 42.7, 62.5 (5C, 5CH
2
, M
α
(c 0.01, CH2Cl
2), IR(KBr) (υ , cm-1): 1614(C=O),
1HNMR (300.1 MHz,
3); 1.16 (3H, d, 3J
HH=5.1 Hz, CH
3), 1.76-2.17
(4H, m, 2CH2 2
),
3.14(3H, s, NCH3), 3.66 (1H, m, CH), 3.04 (3H, m,
CH and CH2), 4.17 (1H, m, CH), 4.37 (1H, d, 3J
HH
Hz, CH), 6.67 (1H, d, 3JHH
s, Ar-H), 7.43 (1H, d, 3JHH
13CNMR
3); 16.4(1C, CH
3), 24.5, 27.7, 41.3,
2), 42.4(1C, NCH
3
, M
(M , M
3-((1'S,2'S,3R,7a'R)-5-bromo-1-ethyl-1'-methyl-
α
(c 0.01, CH2Cl
2), IR(KBr) (υ , cm-1): 1611(C=O),
1HNMR (300.1 MHz,
3); 1.15 (3H, d, 3J
HH 3
3JHH
=7 Hz, CH3 2
(1H, m, CH2
CH2
3JHH
=7 Hz, CH2), 3.56 (1H, dt,
2JHH
=12 Hz, 3JHH
and CH2), 4.16 (1H, dt, 2J
HH=12 Hz, 3J
HH=6 Hz, CH),
4.31 (1H, d, 3JHH
3JHH
Hz, Ar-H), 7.27 (1H, m, Ar-H), 7.47 (1H, d, 3JHH
Hz, Ar-H); 13
3); 12.4 (1C,
CH3), 16.1(1C, CH3
5CH2), 35.1 (1C, NCH
2
MS, 462, 464 (M , M , M
60), 131 (100).
α
(c 0.01, CH2Cl
2), IR(KBr) (υ , cm-1): 1614(C=O),
1HNMR (300.1 MHz,
3); 1.77-2.02 (4H, m, 2CH
2), 2.67 (1H, m, CH),
3.15 (1H, m, CH), 3.24 (3H, s, NMe), 3.61 (1H, m,
2, 2CH), 4.46 (1H, m,
3JHH
m, Ar-H); 13
3); 24.4, 27.4,
2), 42.1 (1C, NCH
3
2), 72.1(1C), 110.6,
, M
, M
-
α
(c 0.01, CH2Cl
2), IR(KBr)(υ , cm-1): 1615(C=O),
1HNMR (300.1
3
3JHH
=6.6 Hz, CH3), 1.67-
2 2) 2.52 (1H,
m, CH), 2.66 (2H, m, CH2
CH2
3JHH
4JHH
3JHH
4JHH
=313CNMR (300.1 MHz,
3 3
(5C, 5CH2
,
REFRENCES
Angew. Chem. Int. Ed.,

510
Int. J. Bio-Inorg. Hybd. Nanomat., Vol. 2, No. 4 (2013), 503-510 Taghizadeh MJ et al
44 (2005), 1602. (b) Catalytic Asymmetric Mul-
ticomponent Reactions.
Sons.
2. Jossang A., Jossang P., Hadi H.A., Sevenet T.,
Bodo B., J. Org. Chem., 56
Can. J. Chem.,
50
The Alkaloids, R.H.F. Man-
-
ford C.V., Scheidt K.A., Angew. Chem., Int. Ed.,
46
Lin G., Curr. Drug Metab., 12
Pharmazie, 66 (2011),
Pharmazie, 64
Adv. Food
Nutr. Res., 45 -
nor C.C.J., J. Nat. Prod., 44
J. Am. Chem. Soc., 127 (2005),
J. Med. Chem., 49
(2006), 3432. (c) Shangary S. et al., Proc. Natl.
Acad. Sci. U.S.A., 105
6. Taghizadeh M.J., Arvinnezhad H., Samadi S.,
Jadidi K., Javidan A., Notash B., Tetrahedron Let-
ters, 53
7. (a) Azizian J., Asadi A., Jadidi K., Synth. Com-
mun., 31 (2001), 2727. (b) Azizian J., Jadidi
Synth. Commun.,
30
M., Jadidi K., Indian J. Chem., Sect B, 39 (2000),
304. (d) Azizian J., Morady A.V., Jadidi K., Meh-
Synth. Commun., 30 (2000),
537. (e) Azizian J., Soozangarzadeh S., Jadidi
K., Synth. Commun., 31
K., Ghahremanzadeh R., BazgirA.,Tetrahedron,
65
R., Bazgir A., J. Comb. Chem., 11
(h) Mehrdad M., Faraji L., Jadidi K., Eslami P.,
Sureni H., Monatsh. Chem., 142
Jadidi K., Ghahremanzadeh R., Mirzaei P., Bazgir
A., J. Heterocycl. Chem., 48 (2011), 1014. (j) Mo-
emeni M., Arvinnezhad H., Samadi S., Tajbakhsh
M., Jadidi K., Khavasi H.R., J. Heterocycl. Chem.,
49
J.
Am. Chem. Soc., 127
Zhang X., Raghunath M., Org. Lett., 7 (2005),
4241. (c) Llamas T., Arrayas R.G., Carretero J.C.,
Org. Lett., 8
Angew. Chem. Int. Ed., 45
Org. Lett., 5 (2003),
5043. (f) Gothelf A.S., Gothelf K.V., Hazell R.G.,
Jorgensen K.A., Angew. Chem. Int. Ed., 41 (2002),
J.
Am. Chem. Soc., 124 (2002), 13400.
Termhedmn
Leuers, 34
Miyazaki S., and Otani T., Tetrahedron Lett., 45
10. (a) Jacobsen E.N., Kakiuchi F., Konsler R.G.,
Larrow J.F., Tokunaga M., Tetrahedron Lett., 38
J. Org.
Chem., 63
K.B., Jacobsen E.N., Angew. Chem. Int. Ed., 38
-
son S.R., Jacobsen E.N., J. Am. Chem. Soc., 112
Tetrahedron Asymmetry, 8 -
bauer R., Jacobsen E.N., Angew. Chem. Int. Ed.,
39 (2000), 3604.
11. Gothelf K.V., Jorgensen K.A., Chem. Rev., 98
Tetrahedron
Lett., 34
International Journal of Bio-Inorganic Hybrid Nanomaterials
ABSTRACT
Skeletal muscle may develop adaptive chaperone and enhancementdefense system through daily exercise
stimulation. The present study investigated resistance and exhaustion training alters the expression of chaper
one proteins. These proteins function to maintain homeostasis, facilitate repair from injury and provide protection.
Exercise-induced production of HSPs in skeletal muscle and peripheral leukocytes and, it may provide insight into
the mechanisms by which exercise can provide increased protection against stressors. The aim of this study was
part in the intervention volunteered to give blood samples. Levels of chaperone proteins weremeasured in response
but decreased after resistance training. The data showed that human skeletal muscle responds to the stress of
a single period of Progressive trainingby up regulating and resistance training by down regulating expression of
Keyword:
(*) Corresponding Author - e-mail: [email protected].
Living cells are continually challenged by conditions
which cause acute and chronic stress. Heat shock pro-
teins (HSP) are a class of functionally related proteins
to elevated temperatures or other stress. Molecular
chaperones such as heat shock proteins (HSPs) are
known to contribute to reducing cellular damage. HSPs
havemultiple functions in maintaining intracellular in-
tegrity viaprotection, repair and even control of cell
death signaling [1-3]. They play an important role in
proteins interactions such as folding and assisting in the
establishment of proper protein conformation and pre-
The Effect of Resistance and Progressive Training on
HSP 70 and Glucose
Farah Nameni
Assistant Professor, Department of Physical Education, Varamin-Pishva Branch, Islamic Azad University,
Varamin, Iran
1. INTRODUCTION
Int. J. Bio-Inorg. Hybd. Nanomat., Vol. 2, No. 4 (2013), 511-515 ISSN: 2251-8533
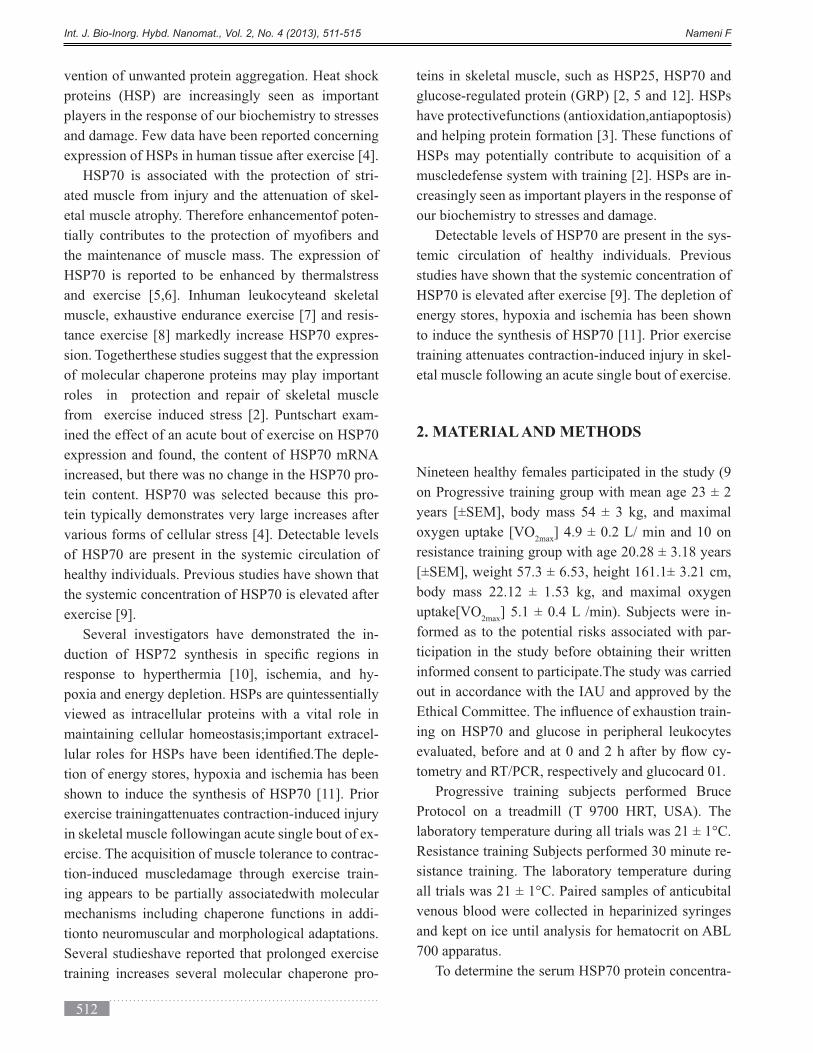
512
Int. J. Bio-Inorg. Hybd. Nanomat., Vol. 2, No. 4 (2013), 511-515 Nameni F
vention of unwanted protein aggregation. Heat shock
proteins (HSP) are increasingly seen as important
players in the response of our biochemistry to stresses
and damage. Few data have been reported concerning
HSP70 is associated with the protection of stri-
ated muscle from injury and the attenuation of skel-
etal muscle atrophy. Therefore enhancementof poten-
HSP70 is reported to be enhanced by thermalstress
-
-
of molecular chaperone proteins may play important
roles in protection and repair of skeletal muscle
-
increased, but there was no change in the HSP70 pro-
tein content. HSP70 was selected because this pro-
tein typically demonstrates very large increases after
of HSP70 are present in the systemic circulation of
healthy individuals. Previous studies have shown that
the systemic concentration of HSP70 is elevated after
Several investigators have demonstrated the in-
response to hyperthermia [10], ischemia, and hy-
viewed as intracellular proteins with a vital role in
-
-
shown to induce the synthesis of HSP70 [11]. Prior
-
ercise. The acquisition of muscle tolerance to contrac-
-
ing appears to be partially associatedwith molecular
mechanisms including chaperone functions in addi-
tionto neuromuscular and morphological adaptations.
training increases several molecular chaperone pro-
teins in skeletal muscle, such as HSP25, HSP70 and
glucose-regulated protein (GRP) [2, 5 and 12]. HSPs
and helping protein formation [3]. These functions of
HSPs may potentially contribute to acquisition of a
muscledefense system with training [2]. HSPs are in-
creasingly seen as important players in the response of
our biochemistry to stresses and damage.
-
temic circulation of healthy individuals. Previous
studies have shown that the systemic concentration of
training attenuates contraction-induced injury in skel-
2. MATERIAL AND METHODS
on Progressive training group with mean age 23 ± 2
[±SEM], weight 57.3 ± 6.53, height 161.1± 3.21 cm,
uptake[VO ] 5.1 ± 0.4 L /min). Subjects were in-
formed as to the potential risks associated with par-
ticipation in the study before obtaining their written
informed consent to participate.The study was carried
out in accordance with the IAU and approved by the
-
ing on HSP70 and glucose in peripheral leukocytes
-
tometry and RT/PCR, respectively and glucocard 01.
Progressive training subjects performed Bruce
Resistance training Subjects performed 30 minute re-
sistance training. The laboratory temperature during
venous blood were collected in heparinized syringes
and kept on ice until analysis for hematocrit on ABL
700 apparatus.
To determine the serum HSP70 protein concentra-
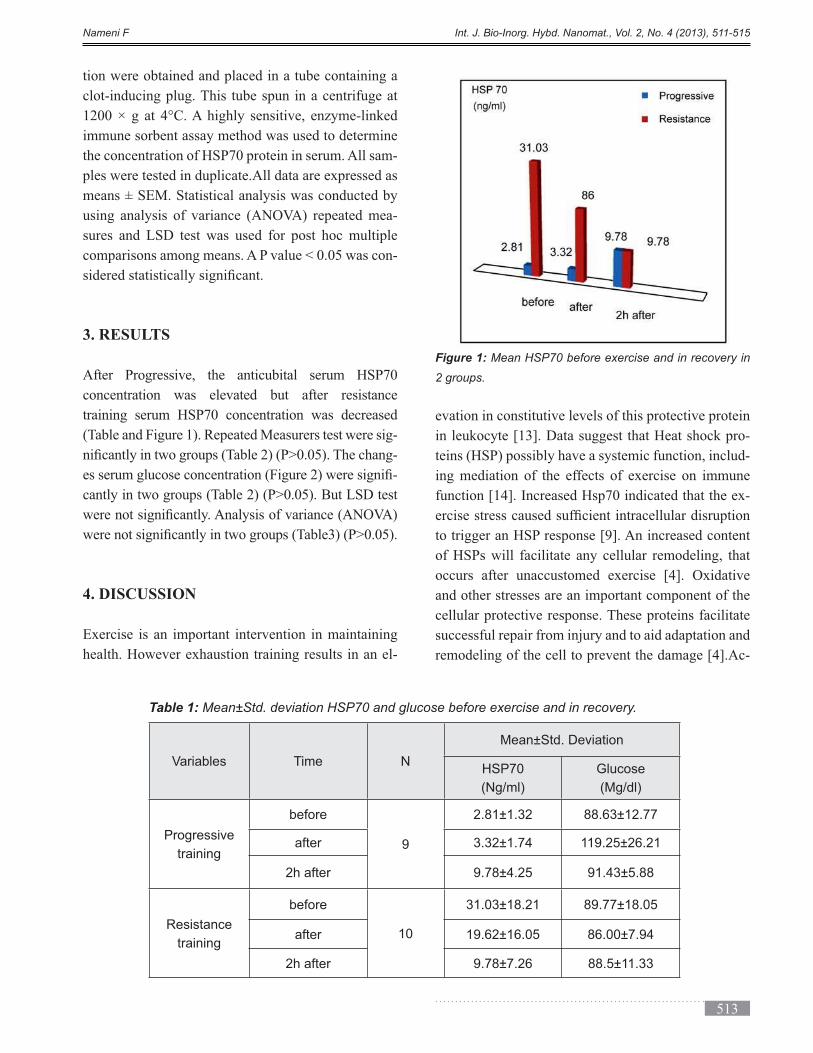
513
Nameni F Int. J. Bio-Inorg. Hybd. Nanomat., Vol. 2, No. 4 (2013), 511-515
tion were obtained and placed in a tube containing a
clot-inducing plug. This tube spun in a centrifuge at
immune sorbent assay method was used to determine
the concentration of HSP70 protein in serum. All sam-
means ± SEM. Statistical analysis was conducted by
using analysis of variance (ANOVA) repeated mea-
comparisons among means. A P value < 0.05 was con-
3. RESULTS
After Progressive, the anticubital serum HSP70
concentration was elevated but after resistance
training serum HSP70 concentration was decreased
(Table and Figure 1). Repeated Measurers test were sig-
-
-
4. DISCUSSION
-
evation in constitutive levels of this protective protein
-
teins (HSP) possibly have a systemic function, includ-
-
of HSPs will facilitate any cellular remodeling, that
and other stresses are an important component of the
cellular protective response. These proteins facilitate
successful repair from injury and to aid adaptation and
remodeling of the cell to prevent the damage [4].Ac-
Figure 1: Mean HSP70 before exercise and in recovery in
2 groups.
Variables Time N
Mean±Std. Deviation
(Ng/ml)
Glucose
(Mg/dl)
Progressive
training
before
9after
2h after
Resistance
training
before
10after
2h after
Table 1: Mean±Std. deviation HSP70 and glucose before exercise and in recovery.
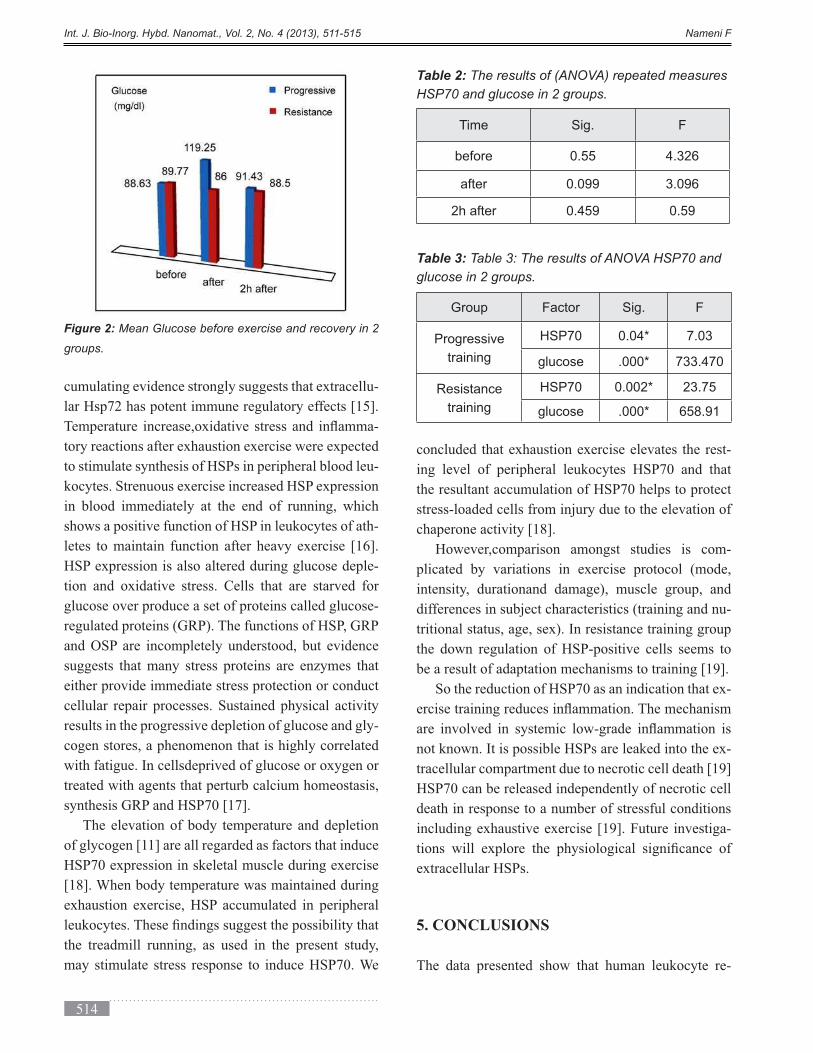
514
Int. J. Bio-Inorg. Hybd. Nanomat., Vol. 2, No. 4 (2013), 511-515 Nameni F
-
lar Hsp72 has potent immune regulatory effects [15].
-
to stimulate synthesis of HSPs in peripheral blood leu-
in blood immediately at the end of running, which
shows a positive function of HSP in leukocytes of ath-
-
glucose over produce a set of proteins called glucose-
regulated proteins (GRP). The functions of HSP, GRP
and OSP are incompletely understood, but evidence
suggests that many stress proteins are enzymes that
either provide immediate stress protection or conduct
cellular repair processes. Sustained physical activity
results in the progressive depletion of glucose and gly-
cogen stores, a phenomenon that is highly correlated
treated with agents that perturb calcium homeostasis,
synthesis GRP and HSP70 [17].
The elevation of body temperature and depletion
of glycogen [11] are all regarded as factors that induce
the treadmill running, as used in the present study,
-
ing level of peripheral leukocytes HSP70 and that
the resultant accumulation of HSP70 helps to protect
stress-loaded cells from injury due to the elevation of
However,comparison amongst studies is com-
intensity, durationand damage), muscle group, and
differences in subject characteristics (training and nu-
the down regulation of HSP-positive cells seems to
-
-
HSP70 can be released independently of necrotic cell
death in response to a number of stressful conditions
-
5. CONCLUSIONS
The data presented show that human leukocyte re-
Table 2: The results of (ANOVA) repeated measures
HSP70 and glucose in 2 groups.
Time Sig. F
before
after 0.099
2h after
Table 3: Table 3: The results of ANOVA HSP70 and
glucose in 2 groups.
Group Factor Sig. F
Progressive
training
0.04*
glucose .000*
Resistance
training
0.002*
glucose .000*
Figure 2: Mean Glucose before exercise and recovery in 2
groups.
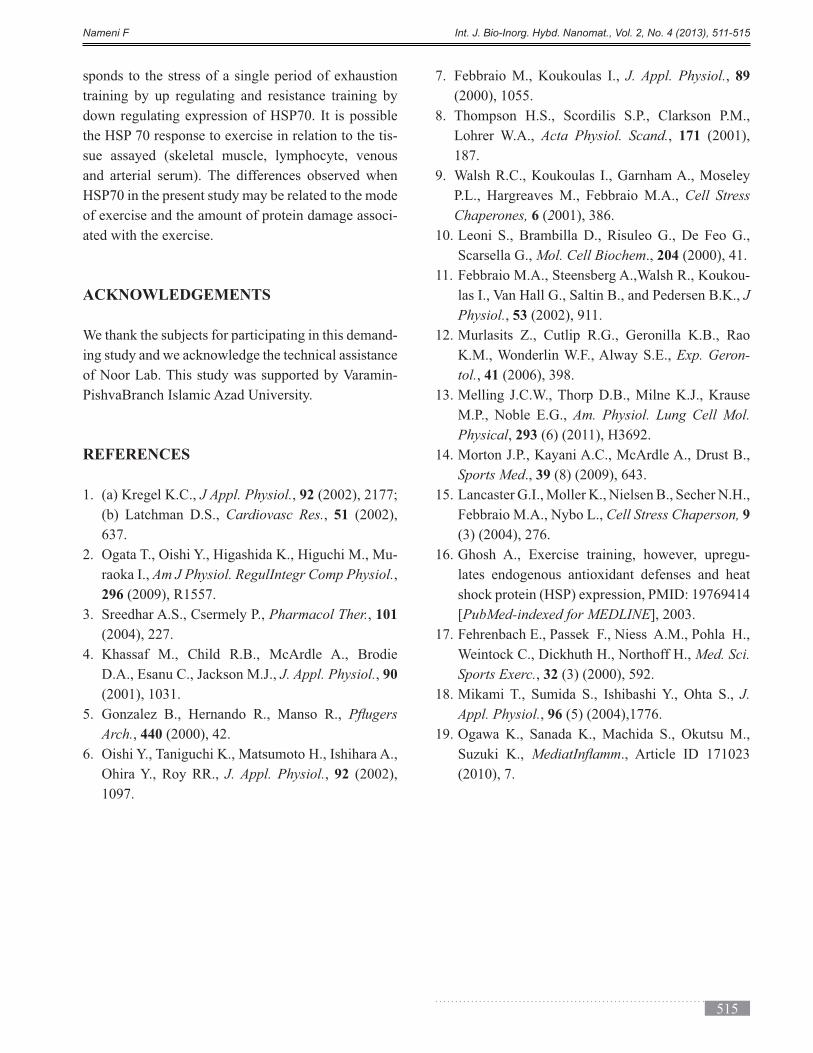
515
Nameni F Int. J. Bio-Inorg. Hybd. Nanomat., Vol. 2, No. 4 (2013), 511-515
training by up regulating and resistance training by
-
sue assayed (skeletal muscle, lymphocyte, venous
and arterial serum). The differences observed when
HSP70 in the present study may be related to the mode
-
ACKNOWLEDGEMENTS
-
ing study and we acknowledge the technical assistance
of Noor Lab. This study was supported by Varamin-
PishvaBranch Islamic Azad University.
REFERENCES
1. (a) Kregel K.C., J Appl. Physiol., 92 (2002), 2177;
Cardiovasc Res., 51 (2002),
637.
-
raoka I., Am J Physiol. RegulIntegr Comp Physiol.,
296
3. Sreedhar A.S., Csermely P., Pharmacol Ther., 101
(2004), 227.
4. Khassaf M., Child R.B., McArdle A., Brodie
J. Appl. Physiol., 90
(2001), 1031.
5. Gonzalez B., Hernando R., Manso R.,
Arch., 440 (2000), 42.
J. Appl. Physiol., 92 (2002),
7. Febbraio M., Koukoulas I., J. Appl. Physiol., 89
(2000), 1055.
Acta Physiol. Scand., 171 (2001),
P.L., Hargreaves M., Febbraio M.A., Cell Stress
Chaperones, 6 (2
Scarsella G., Mol. Cell Biochem., 204 (2000), 41.
-
las I., Van Hall G., Saltin B., and Pedersen B.K., J
Physiol., 53
12. Murlasits Z., Cutlip R.G., Geronilla K.B., Rao
Exp. Geron-
tol., 41
M.P., Noble E.G., Am. Physiol. Lung Cell Mol.
Physical, 293
Sports Med., 39
15. Lancaster G.I., Moller K., Nielsen B., Secher N.H.,
Febbraio M.A., Nybo L., Cell Stress Chaperson, 9
(3) (2004), 276.
-
[PubMed-indexed for MEDLINE], 2003.
17. Fehrenbach E., Passek F., Niess A.M., Pohla H.,
Med. Sci.
Sports Exerc., 32
J.
Appl. Physiol., 96 (5) (2004),1776.
Suzuki K.,
(2010), 7.
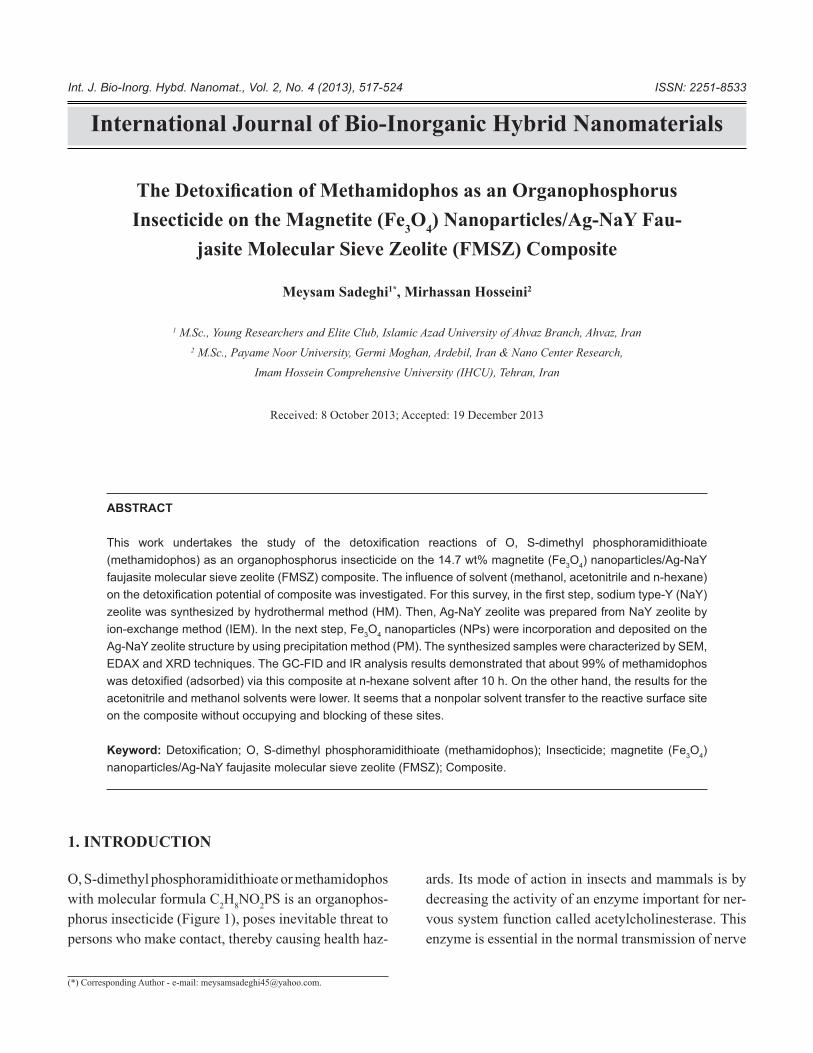
International Journal of Bio-Inorganic Hybrid Nanomaterials
ABSTRACT
O4) nanoparticles/Ag-NaY
zeolite was synthesized by hydrothermal method (HM). Then, Ag-NaY zeolite was prepared from NaY zeolite by
ion-exchange method (IEM). In the next step, Fe O4 nanoparticles (NPs) were incorporation and deposited on the
Ag-NaY zeolite structure by using precipitation method (PM). The synthesized samples were characterized by SEM,
EDAX and XRD techniques. The GC-FID and IR analysis results demonstrated that about 99% of methamidophos
acetonitrile and methanol solvents were lower. It seems that a nonpolar solvent transfer to the reactive surface site
on the composite without occupying and blocking of these sites.
Keyword: O4)
nanoparticles/Ag-NaY faujasite molecular sieve zeolite (FMSZ); Composite.
(*) Corresponding Author - e-mail: [email protected].
O, S-dimethyl phosphoramidithioate or methamidophos
with molecular formula C2H NO
2PS is an organophos-
phorus insecticide (Figure 1), poses inevitable threat to
persons who make contact, thereby causing health haz-
ards. Its mode of action in insects and mammals is by
decreasing the activity of an enzyme important for ner-
vous system function called acetylcholinesterase. This
enzyme is essential in the normal transmission of nerve
dophos as an Organophosphorus
Insecticide on the Magnetite (Fe3O
4) Nanoparticles/Ag-NaY Fau-
jasite Molecular Sieve Zeolite (FMSZ) Composite
Meysam Sadeghi1*, Mirhassan Hosseini2
1 M.Sc., Young Researchers and Elite Club, Islamic Azad University of Ahvaz Branch, Ahvaz, Iran
2 M.Sc., Payame Noor University, Germi Moghan, Ardebil, Iran & Nano Center Research,
Imam Hossein Comprehensive University (IHCU), Tehran, Iran
1. INTRODUCTION
Int. J. Bio-Inorg. Hybd. Nanomat., Vol. 2, No. 4 (2013), 517-524 ISSN: 2251-8533
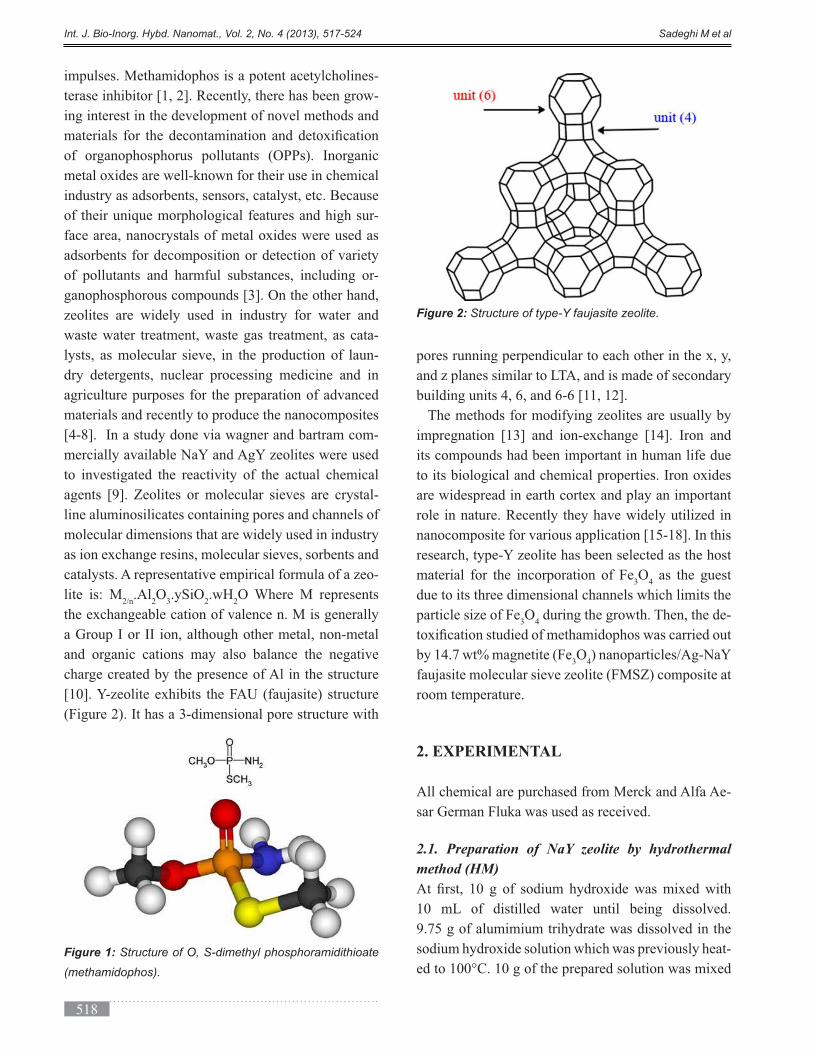
Int. J. Bio-Inorg. Hybd. Nanomat., Vol. 2, No. 4 (2013), 517-524 Sadeghi M et al
impulses. Methamidophos is a potent acetylcholines-
terase inhibitor [1, 2]. Recently, there has been grow-
ing interest in the development of novel methods and
of organophosphorus pollutants (OPPs). Inorganic
industry as adsorbents, sensors, catalyst, etc. Because
of their unique morphological features and high sur-
adsorbents for decomposition or detection of variety
of pollutants and harmful substances, including or-
ganophosphorous compounds [3]. On the other hand,
zeolites are widely used in industry for water and
waste water treatment, waste gas treatment, as cata-
lysts, as molecular sieve, in the production of laun-
dry detergents, nuclear processing medicine and in
agriculture purposes for the preparation of advanced
materials and recently to produce the nanocomposites
-
to investigated the reactivity of the actual chemical
-
line aluminosilicates containing pores and channels of
molecular dimensions that are widely used in industry
catalysts. A representative empirical formula of a zeo-
lite is: M2/n
.Al2O
3.ySiO
2.wH
2
a Group I or II ion, although other metal, non-metal
and organic cations may also balance the negative
charge created by the presence of Al in the structure
(Figure 2). It has a 3-dimensional pore structure with
and z planes similar to LTA, and is made of secondary
building units 4, 6, and 6-6 [11, 12].
The methods for modifying zeolites are usually by
its compounds had been important in human life due
role in nature. Recently they have widely utilized in
material for the incorporation of Fe3O
4 as the guest
due to its three dimensional channels which limits the
particle size of Fe3O
4 during the growth. Then, the de-
by 14.7 wt% magnetite (Fe3O
4
faujasite molecular sieve zeolite (FMSZ) composite at
room temperature.
2. EXPERIMENTAL
All chemical are purchased from Merck and Alfa Ae-
sar German Fluka was used as received.
2.1. Preparation of NaY zeolite by hydrothermal
method (HM)
10 mL of distilled water until being dissolved.
-Figure 1: Structure of O, S-dimethyl phosphoramidithioate
(methamidophos).
Figure 2: Structure of type-Y faujasite zeolite.
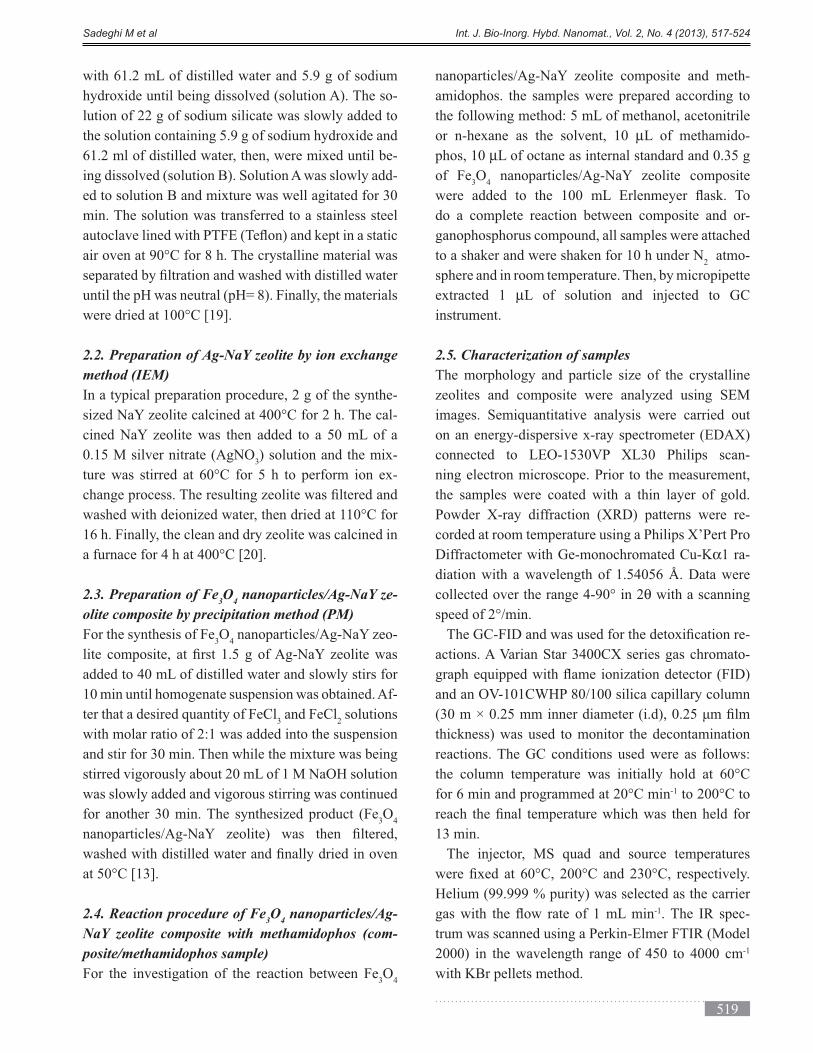
Sadeghi M et al Int. J. Bio-Inorg. Hybd. Nanomat., Vol. 2, No. 4 (2013), 517-524
-
lution of 22 g of sodium silicate was slowly added to
-
ing dissolved (solution B). Solution A was slowly add-
min. The solution was transferred to a stainless steel
2.2. Preparation of Ag-NaY zeolite by ion exchange
method (IEM)
In a typical preparation procedure, 2 g of the synthe-
-
0.15 M silver nitrate (AgNO3
-
-
16 h. Finally, the clean and dry zeolite was calcined in
2.3. Preparation of Fe3O
4 nanoparticles/Ag-NaY ze-
olite composite by precipitation method (PM)
For the synthesis of Fe3O
4-
added to 40 mL of distilled water and slowly stirs for
10 min until homogenate suspension was obtained. Af-
ter that a desired quantity of FeCl3 and FeCl
2 solutions
with molar ratio of 2:1 was added into the suspension
stirred vigorously about 20 mL of 1 M NaOH solution
was slowly added and vigorous stirring was continued
for another 30 min. The synthesized product (Fe3O
4
2.4. Reaction procedure of Fe3O
4 nanoparticles/Ag-
NaY zeolite composite with methamidophos (com-
posite/methamidophos sample)
For the investigation of the reaction between Fe3O
4
-
amidophos. the samples were prepared according to
the following method: 5 mL of methanol, acetonitrile
µL of methamido-
phos, 10 µL of octane as internal standard and 0.35 g
of Fe3O
4
do a complete reaction between composite and or-
ganophosphorus compound, all samples were attached
to a shaker and were shaken for 10 h under N2 atmo-
sphere and in room temperature. Then, by micropipette
µL of solution and injected to GC
instrument.
2.5. Characterization of samples
The morphology and particle size of the crystalline
zeolites and composite were analyzed using SEM
images. Semiquantitative analysis were carried out
connected to LEO-1530VP XL30 Philips scan-
ning electron microscope. Prior to the measurement,
the samples were coated with a thin layer of gold.
-
corded at room temperature using a Philips X’Pert Pro
α1 ra-
θ with a scanning
-
actions. A Varian Star 3400CX series gas chromato-
thickness) was used to monitor the decontamination
reactions. The GC conditions used were as follows:
-1
13 min.
The injector, MS quad and source temperatures
-1. The IR spec-
trum was scanned using a Perkin-Elmer FTIR (Model
2000) in the wavelength range of 450 to 4000 cm-1
with KBr pellets method.
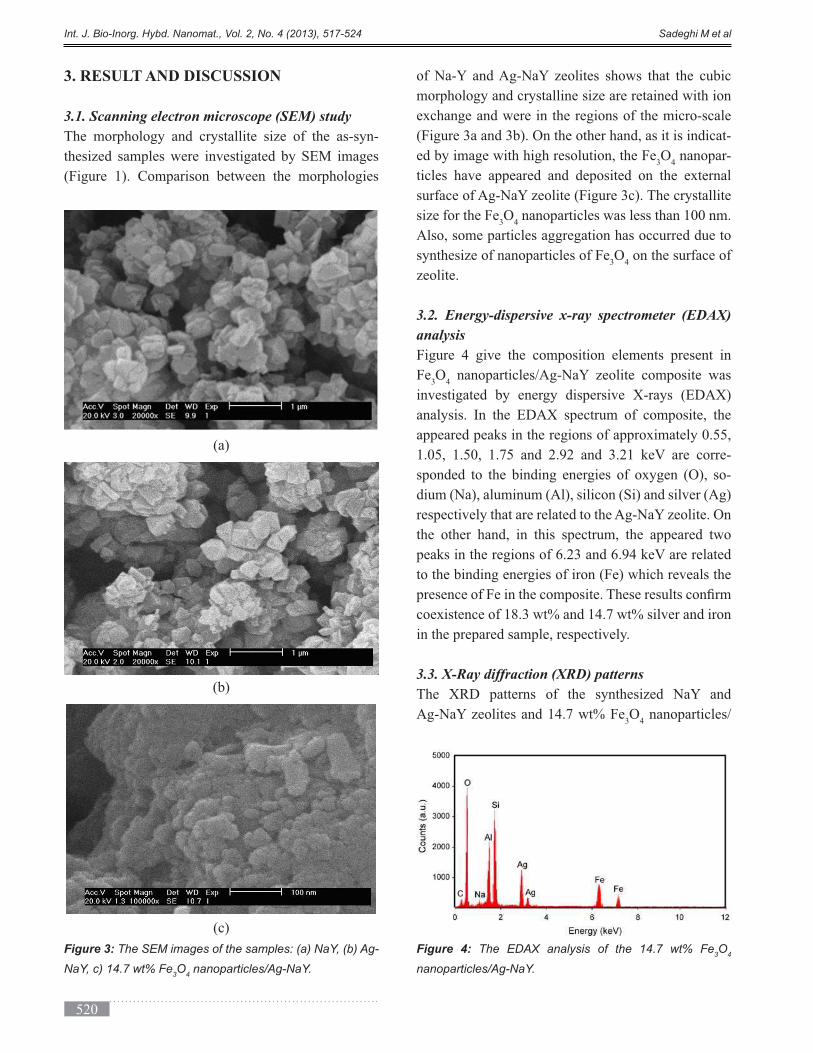
520
Int. J. Bio-Inorg. Hybd. Nanomat., Vol. 2, No. 4 (2013), 517-524 Sadeghi M et al
3. RESULT AND DISCUSSION
3.1. Scanning electron microscope (SEM) study
The morphology and crystallite size of the as-syn-
thesized samples were investigated by SEM images
(Figure 1). Comparison between the morphologies
morphology and crystalline size are retained with ion
(Figure 3a and 3b). On the other hand, as it is indicat-
ed by image with high resolution, the Fe3O
4 nanopar-
size for the Fe3O
4 nanoparticles was less than 100 nm.
Also, some particles aggregation has occurred due to
synthesize of nanoparticles of Fe3O
4 on the surface of
zeolite.
3.2. Energy-dispersive x-ray spectrometer (EDAX)
analysis
Figure 4 give the composition elements present in
Fe3O
4
-
-
dium (Na), aluminum (Al), silicon (Si) and silver (Ag)
the other hand, in this spectrum, the appeared two
to the binding energies of iron (Fe) which reveals the
in the prepared sample, respectively.
3.3. X-Ray diffraction (XRD) patterns
3O
4 nanoparticles/
(a)
(b)
(c)
Figure 3: The SEM images of the samples: (a) NaY, (b) Ag-
NaY, c) 14.7 wt% Fe3O
4 nanoparticles/Ag-NaY.
Figure 4: The EDAX analysis of the 14.7 wt% Fe3O
4
nanoparticles/Ag-NaY.
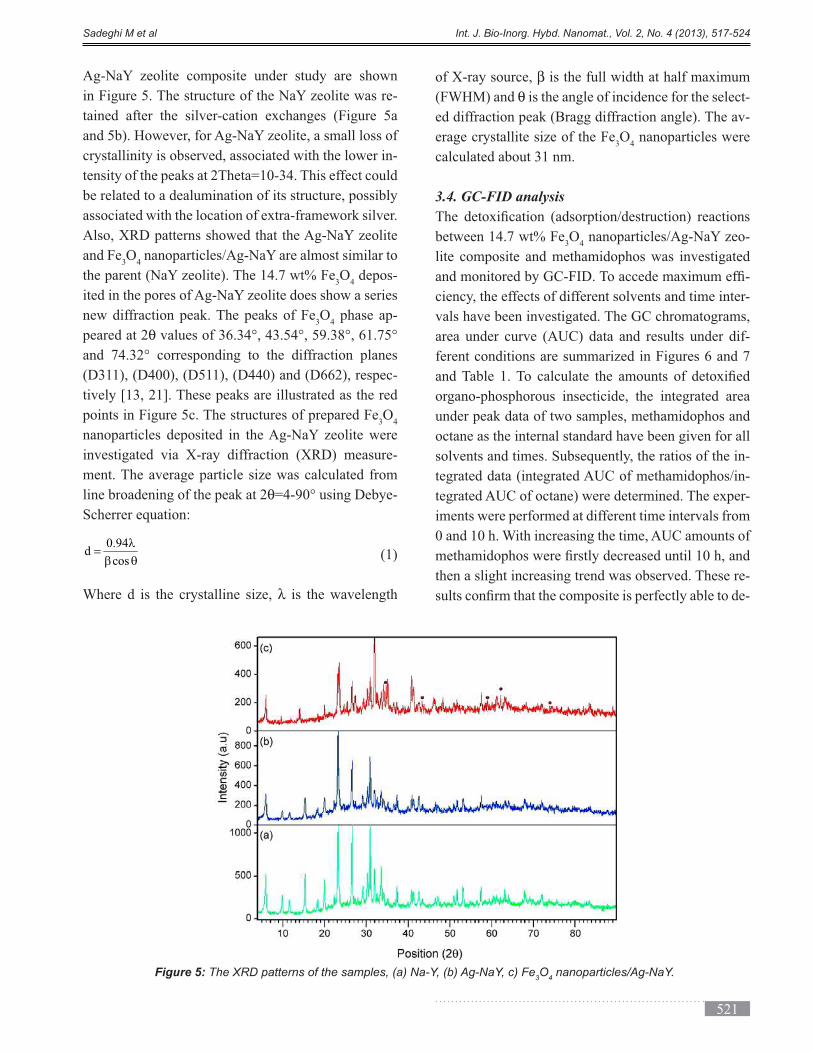
521
Sadeghi M et al Int. J. Bio-Inorg. Hybd. Nanomat., Vol. 2, No. 4 (2013), 517-524
-
crystallinity is observed, associated with the lower in-
tensity of the peaks at 2Theta=10-34. This effect could
be related to a dealumination of its structure, possibly
and Fe3O
4
3O
4 depos-
new diffraction peak. The peaks of Fe3O
4 phase ap-
peared at 2θ
-
tively [13, 21]. These peaks are illustrated as the red
points in Figure 5c. The structures of prepared Fe3O
4
-
ment. The average particle size was calculated from
line broadening of the peak at 2θ
Scherrer equation:
(1)
λ is the wavelength
of X-ray source, β
θ is the angle of incidence for the select-
ed diffraction peak (Bragg diffraction angle). The av-
erage crystallite size of the Fe3O
4 nanoparticles were
calculated about 31 nm.
3.4. GC-FID analysis
between 14.7 wt% Fe3O
4-
lite composite and methamidophos was investigated
-
ciency, the effects of different solvents and time inter-
vals have been investigated. The GC chromatograms,
area under curve (AUC) data and results under dif-
ferent conditions are summarized in Figures 6 and 7
organo-phosphorous insecticide, the integrated area
under peak data of two samples, methamidophos and
octane as the internal standard have been given for all
solvents and times. Subsequently, the ratios of the in-
tegrated data (integrated AUC of methamidophos/in-
-
iments were performed at different time intervals from
then a slight increasing trend was observed. These re-
-
dcos
Figure 5: The XRD patterns of the samples, (a) Na-Y, (b) Ag-NaY, c) Fe3O
4 nanoparticles/Ag-NaY.

522
Int. J. Bio-Inorg. Hybd. Nanomat., Vol. 2, No. 4 (2013), 517-524 Sadeghi M et al
lower for acetonitrile and methanol as the solvents.
Notwithstanding the transition state must be involved
in the polar reaction, polar solvent hinders the reac-
tion's progress.
It could be construed from GC analysis that polar
solvent can compete with the reaction sites presented
on the surface of the composite including Bronsted
)
sites. In particular, the blocking of Lewis acid sites
would hinder the coordination of methamidophos.
Since methanol is considered as such a strong hin-
drance to the reaction, this points out to the fact that
isopropanol simply blocks access to the surface of the
catalyst.
3.5. FT-IR spectrum
The FT-IR spectrum of the 14.7 wt% Fe3O
4 nanopar-
Figure 6: The GC chromatograms for methamidophos-Fe3O4 nanoparticles/Ag-NaY sample.
Solvent SampleAUC/Octane
(1)
AUC/
methamidophos (2)
Ratio
(AUC 2/AUC 1) (%)
Methanola 356489 333567 100.00
b 356246 234605 70.34
Acetonitrilea 397726 332461 100.00
b
a 410687 405992 100.00
b 000000 000000 00.00
Table 1: The GC analysis results in the presence of different solvents, (a) zero time (the blank solution)
and (b) after 10 h.
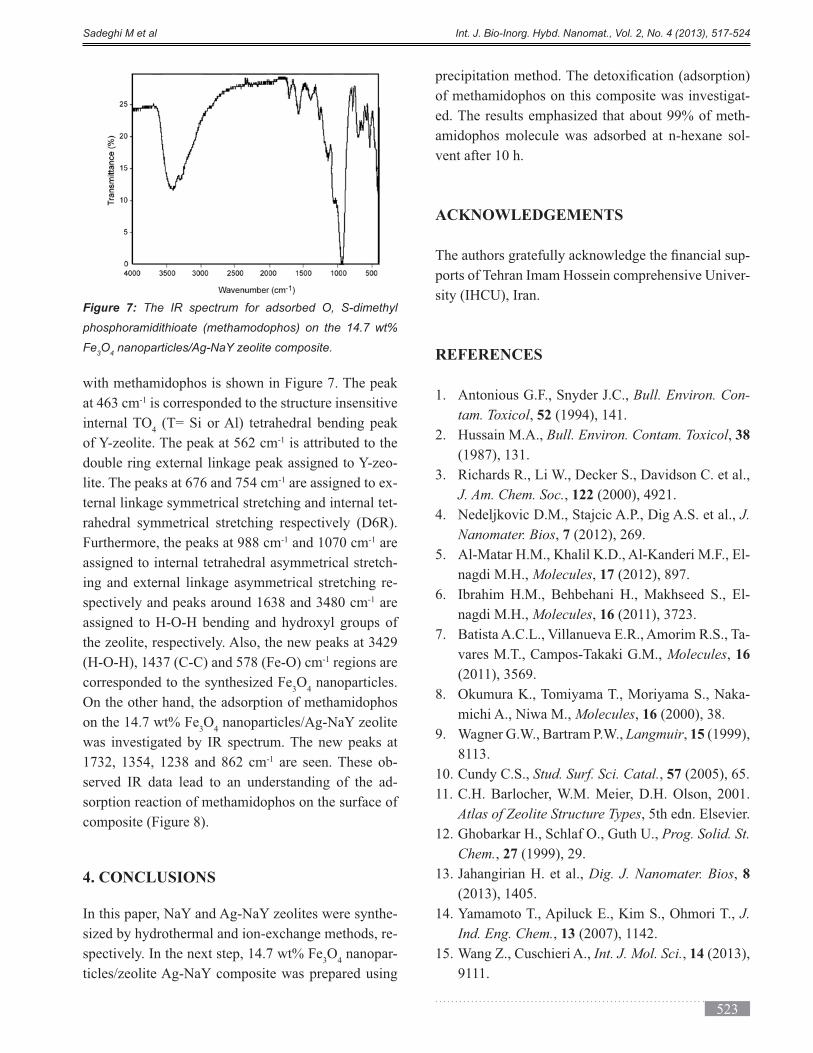
523
Sadeghi M et al Int. J. Bio-Inorg. Hybd. Nanomat., Vol. 2, No. 4 (2013), 517-524
with methamidophos is shown in Figure 7. The peak
at 463 cm-1 is corresponded to the structure insensitive
internal TO4 (T= Si or Al) tetrahedral bending peak
-1 is attributed to the
-
lite. The peaks at 676 and 754 cm-1 -
ternal linkage symmetrical stretching and internal tet-
-1 and 1070 cm-1 are
assigned to internal tetrahedral asymmetrical stretch-
--1 are
-1 regions are
corresponded to the synthesized Fe3O
4 nanoparticles.
On the other hand, the adsorption of methamidophos
on the 14.7 wt% Fe3O
4
was investigated by IR spectrum. The new peaks at -1 are seen. These ob-
served IR data lead to an understanding of the ad-
sorption reaction of methamidophos on the surface of
4. CONCLUSIONS
-
-
3O
4 nanopar-
of methamidophos on this composite was investigat-
-
-
vent after 10 h.
ACKNOWLEDGEMENTS
-
ports of Tehran Imam Hossein comprehensive Univer-
sity (IHCU), Iran.
REFERENCES
1. Antonious G.F., Snyder J.C., Bull. Environ. Con-
tam. Toxicol, 52
2. Hussain M.A., Bull. Environ. Contam. Toxicol, 38
J. Am. Chem. Soc., 122
J.
Nanomater. Bios, 7
-
nagdi M.H., Molecules, 17
6. Ibrahim H.M., Behbehani H., Makhseed S., El-
nagdi M.H., Molecules, 16 (2011), 3723.
7. Batista A.C.L., Villanueva E.R., Amorim R.S., Ta-
vares M.T., Campos-Takaki G.M., Molecules, 16
-
michi A., Niwa M., Molecules, 16
Langmuir, 15
10. Cundy C.S., Stud. Surf. Sci. Catal., 57 (2005), 65.
Atlas of Zeolite Structure Types, 5th edn. Elsevier.
12. Ghobarkar H., Schlaf O., Guth U., Prog. Solid. St.
Chem., 27
13. Jahangirian H. et al., Dig. J. Nanomater. Bios, 8
(2013), 1405.
J.
Ind. Eng. Chem., 13 (2007), 1142.
Int. J. Mol. Sci., 14 (2013),
Figure 7: The IR spectrum for adsorbed O, S-dimethyl
phosphoramidithioate (methamodophos) on the 14.7 wt%
Fe3O
4 nanoparticles/Ag-NaY zeolite composite.

524
Int. J. Bio-Inorg. Hybd. Nanomat., Vol. 2, No. 4 (2013), 517-524 Sadeghi M et al
16. Khandanlou R., Ahmad M., Shameli K., Kalantari
K., Molecules, 18
17. Granitzer P., Rumpf K., Materials, 4
-
Dig. J.
Nanomater. Bios, 7
US Pat. No. 3
US Pat. No. 25
(2006), 57.
21. Ghandoor H.E., Zidan H.M., Mostafa M.H., Ismail
I.M., Int. J. Electrochem. Sci., 7 (2012), 5734.