international finance real world economic activity data collection economic theory models economic...
Post on 19-Dec-2015
215 views
TRANSCRIPT

International Finance
Real World Economic Activity
Data Collection
Economic Theory Models
EconomicAnalysis

International Finance
The Quantity Theory
PQ=MVEquation 1
V
1=k whereQ, k=
P
MEquation 2
Q
V= with M,=P
MQ
V=P
Equation 3

International Finance
Quantity Theory of Price Adjustment
M
P
Q
t*
time
M0
2 M0
P0
2P0
Q0Q0
Q0
time
time

International Finance
Extreme Macro Instability
Bolivian Inflation and Monetary Growth
0
5000
10000
15000
20000
25000
82 84 86 88 90 92
Year
Percentage Rate of Change
Inflation
Monetary Growth

International Finance
The Purchasing Power Parity
Equation 4
Equation 5
P E=P fd
M
M=M
M=P
P=Ef
d
ff
dd
f
d
International Finance
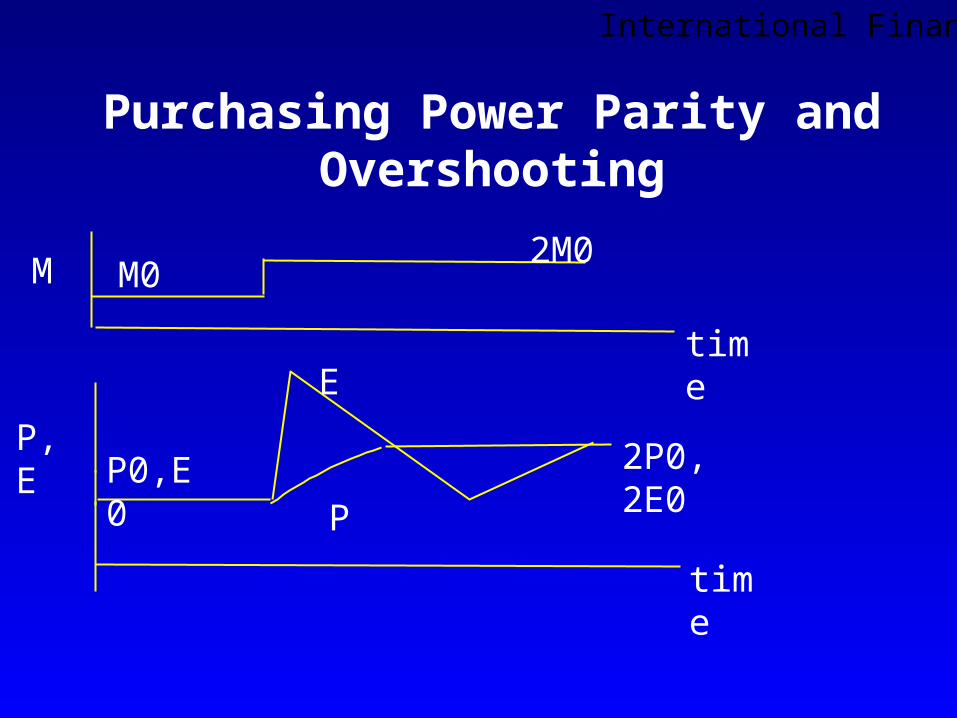
Purchasing Power Parity and Overshooting
M
P,E
M0
2M0
P0,E0
E
P
2P0, 2E0
time
time

International Finance
Unpleasant Monetarist Arithmetic
Equation 6
P
B+
P
M=
P
T
P
iB+
P
G

International Finance
Unpleasant Monetarist Arithmetic:Sargent and Wallace: P* vs P**
time
Money,Bonds
Bonds
t*
time
time
P*P**
Money
Deficit
PriceLevel

International Finance
The Absorption Model of the Balance of Trade
Equation 7 IMEX+TG+I+C=Y
I+C=A whereG),(T+A)(Y=G)(T+I)+(CY=IMEX
Equation 8

International Finance
United States Current Account and Fiscal Balance, 1968-1992
-400-350-300-250-200-150-100
-500
50
68 70 80 90
Year
Trade Balance
Fiscal Balance

International Finance
Further Implications
Equation 9BOT = EX - e . p* IM
Current Act = BOT + e . i* Kf,d - i Kd,f
Equation 10
dffd KeKCapAccount ,, Equation 11
NFA = e. Kf,d-Kd,f
Equation 12

International Finance
Balance of Payments
BOP = Current Account + Capital Account
Under fixed exchange rates only:Change in Foreign Exchange Reserves = BOP

International Finance
Fiscal and External Balances, USA
-400
-300
-200
-100
0
100
200
1961
1965
1969
1973
1977
1981
1985
1989
Year
Billions of US Dollars
Fiscal Balance
Balance ofPayments
Trade Balance
Net Foreign AssetPos

International Finance
Organization and Characteristics of FOREX Markets
• Spot and forward markets
• Many buyers and sellers, so no buyer or seller dominates
• Transactions are quick, buy/sell decisions have to be made very quickly
• Low transactions costs
• Open virtually 24/7.

International Finance
Reasons to Use FOREX Markets
• Export and Import Transactions
• Triangular arbitrage in the Spot Market
• Hedging on foreign investment
• Forward speculation
• Interest arbitrage
• Engage in a speculative attack on a foreign currency (aka “hedge fund” management)

International Finance
Demand and Supply ofForeign Exchange
R($,DM)
DM
US Demand for DM
German Supply of DM
R*

International Finance
Responses to Overvaluation:Devaluation and Fiscal
ContractionR($,DM)
DM
US Demand for DM
German Supply of DM
R* New US Demand
Trade Deficit
R**

International Finance
Conditions for a Devaluation to “Work” , or not!
• Marshall-Lerner conditions must hold: elasticity of foreign demand for export good and elasticity of domestic demand for import good must sum to value greater than unity.
• Example: imports are oil, exports are wheat. Devaluation may actually make BOT worse! People will still buy oil and just need so much wheat. Elasticity pessimism.

International Finance
Further conditions why devalution may not work
• Issue of contractionary devaluation: imports may be inputs in production so devaluation may cause a fall in investment, employment, output
• Harberger-Laursen-Metzler effect: devaluation worsens income, so net saving falls quickly, so there is a savings-investment imbalance, and the trade balance falls.

International Finance
Multiple Equilibria in ForEx Market
Supply
Demand
A
B
C
DM
R

International Finance
J-Curve Dynamics
time
Trade Balance
0
Devaluation

International Finance
Triangular Arbitrage
Equation 13
Equation 14
Equation 15
R(£,$) = 1/R($,£)
R(£,DM) = R(£,$) R($,DM)
R(£,DM) = R($,DM) = .5 & R($,£) = 2 .25.

International Finance
Covered Interest Parity
K dollars K(1+r)
K/R sterling (K/R)(1+r*)
(K/R)(1+r*) FR
buyspot
sellforward
US investment
UK investment

International Finance
Covered Interest Rate Parity
Equation 16
Equation 17
Equation 18
K(1+r) = (K/R)(1+r*) FR
R (1+r)/(1+r*) = FR
R (1+r)/(1+r*)- [(1+r*)/(1+r*)] R = FR – R
Equation 19 (r-r*)/(1+r*) = (FR-R)/R
Equation 20 (r-r*) = (FR-R)/R
(r-r*) = [E(Rt+1)-R]/REquation 21

International Finance
Measuring Capital Mobility
Equation 22
Equation 23
Equation 24
Equation 25
(r-r*) = [Rt+1-R]/R
r - = r* - *
r - r* = - *
(S - I) + (T - G) = (X - M)

International Finance
Real Exchange Rate
Non-tradeables
Tradeables
Real Exchange Rate
T*
NT*

International Finance
The Real Exchange Rate
Equation 26
Equation 27
Equation 28
P
*P R
P
P=REXRcpilesnontradeab
tradeables
P
R REXR
cpi
P
P REXRcpi
wpi

International Finance
U.S. Real Exchange Rate Swings, 79-81
Indices Based on Unit Labor Costs and CPI
00.20.40.60.8
11.21.41.61.8
79 80 81 82 83 84 85 86 87 88 89 90 91
Year
IndexReal Ex. Index-1
Real Ex. Index - 2

International Finance
Classification of Policy Regimes
MonetaryPolicy
FiscalPolicy
Exchange Rate Regime
Fixed FlexibleInstrument
WEAK
STRONG
STRONG
WEAK

International Finance
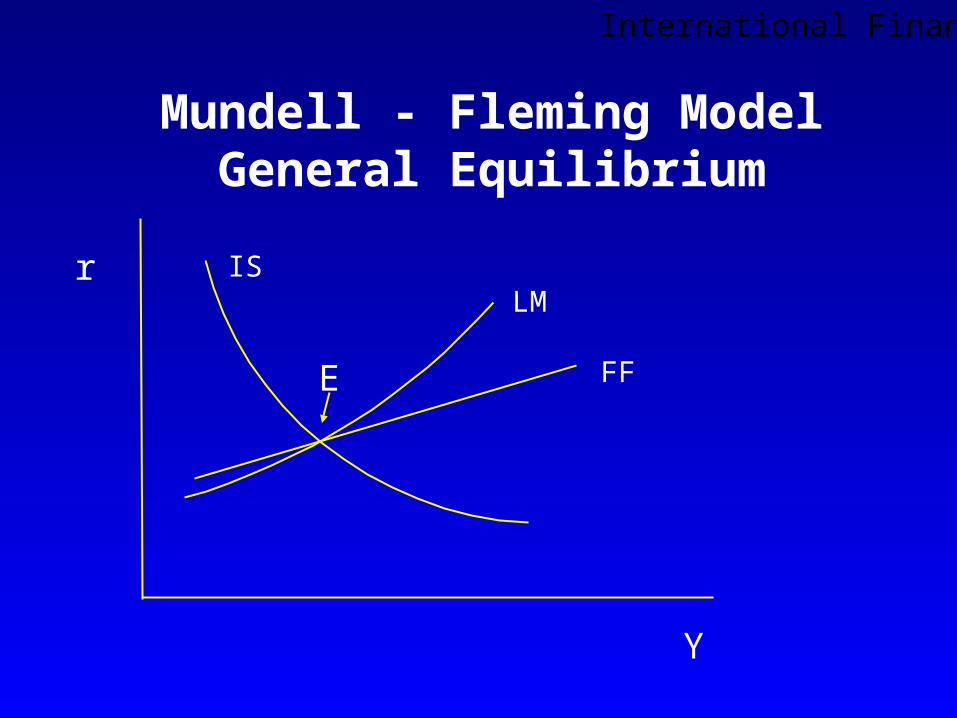
The Mundell-Fleming Model of Fixed Exchange Rates
Equation 29
IS Block: I(r) = S(y), I'<0, S'>0
LM Curve: M/P = L(y,r), Ly>0, Lr<0
FF Curve: BOP = EX - IM(y) + NKI(r), IM'>0, NKI'>0
International Finance
Mundell - Fleming ModelGeneral Equilibrium
r
Y
E
ISLM
FF

International Finance
Endogeneity of the Money Supply
Equation 30 M = Res = BOP(Y,r), BOPY < 0, BOPr > 0

International Finance
Mundell - Fleming ModelEffects of Monetary Expansion
r
Y
E
LM
LM’
FF
IS
E’

International Finance
Mundell - Fleming ModelEffects of Fiscal Expansion
r
Y
E
LM
LM’
FF
IS
IS’E’

International Finance
Mundell - Fleming ModelEffects of Devaluation
r
Y
E
LM
LM’
FF
IS
FF’

International Finance
Swan Diagram: Internal/External Balance
EE
II
r
G-T
A:external deficit, internal inflation.
B:external surplus, internal inflation

International Finance
The Dornbusch Model of Flexible Exchange Rates
Equation 31
DD (Demand) Block: y = -y *+ d(e-p), d > 0
LM (Liquidity-money) Block: m/p = l(y,r), ly>0, lr<0
AA (Asset Arbitrage) Block: e = r - r*

International Finance
Dornbusch Model: Basic Setup
DD
AA
p
e
A

International Finance
Dornbusch Model: Monetary Expansion with Overshooting
DD
AA
p
e
AA’
A
B
C

International Finance
Wicksell's Problem
Sweden
Denmark
Norway
wheat
fish
timber
ultimate flows
intermediate flows

International Finance
Bilateral Exchange Arrangements-Unbalanced Flows
A B
C D

International Finance
D’s Money as Medium of Exchange, Barter between A and B
A B
C D

International Finance
A’s and B’s Money as Media of Exchange
A B
C D

International Finance
Borrowing and Lending Strategies
r1
r2
r i
i1
i2
Borrowing Lending
Positive maturity transformation
Period 1
Period 2

International Finance
The Phillips Fixed-Coefficient Model of the Banking System
Equation 32
C + R = MB
D k = C
D r = R
k+r
1=
MB
D
D k + D r = MB
Equation 33

International Finance
Internal Structure of Eurodollar Market
Europe
USA
London
Lenders Borrowers

International Finance
Eurodollar Market and OPEC Recycling
OPECDeposits
LDCBorrowers
Europe
USA
London
Lenders Borrowers

International Finance
Manufacturing, Resources, and Service Sector Economy
O O'MR
D-mD-rD-s
Manufacturingemployment
ResourceemploymentServices
w w

International Finance
Manufacturing, Resources, and Service Sector Economy-Direct Deindustrialization Due to Boom in Resource Sector:
M-M': Direct De-industrialization Effect
O O'MR
D-mD-rD-s
M'
w
W’

International Finance
Manufacturing, Resources, and Service Sector Economy-Indirect Deindustrialization Due to Boom in Ensuring Service-Sector Boom:
M'-M'': Indirect De-industrialization Effect
O O'MR
D-mD-rD-s
w
w'
M'
w''
M''

International Finance
Key Macroeconomic Variables of the World Economy
Before and During Debt Crisis
-15-10
-505
101520
70-79 80-82 83-84
Years
LIBOR Rate
Inflation- Ind. Goods
Inflation- Commodity
OECD Growth

International Finance
Latin American Per-Capita Output Growth
-3-2-10
1234
62-80 80-84 84
Inflation
0
50
100
150
200
62-80 80-84 84
Gross Investment -GDP Ratio
0
5
10
15
20
25
62-80 80-84 84

International Finance
Structure of Latin American Debt in 1983
0
20
40
60
80
100
Billions of US Dollars
Total Debt
Bank Debt
US Bank Debt

International Finance
A
B
C
Nominal Value of Debt
Secondary Market Value

International Finance
Seignorage and Dollarization: Multiple Equilibria
Equation 34
Equation 35
M
M= with
P
M=tg
P
M
M
M=
P
M=tg
(A)a
(P)p
(M)m
,a=pm
eA=P
M
log
log
log

International Finance
Inflation Laffer Curve
(M/P)
Deficit
B
A

International Finance
Inflationary Dynamis in a Dollarized Indexed Economy
Manufacturing
50%wages
50%ImportComponent
Oil Shock
Price ofOutputCOLA
Indexed Gov'tDebt
Fiscal Deficit Monetary Growth
Dollarization
Devaluation

International Finance
Structure of Financial MarketsBanks
Foreign Exchange
CD's
T'Bills
Commercial Paper
Time and Saving Deposits
Long-term bonds
spot forward future call/put option
warrants and convertible bonds
Repurchase Agreements
Swaps:debt for equityDual currency bonds
Heaven and hell bonds
Parallel loans and currency swaps
Optioned and non-optioned equity
MortgagesMortgage-backed securities
Preferred stock
Stripped and zero coupon bonds
Prime and score securities
Poisoned pills
Acceptances
Figure 1:Instruments of Markets
Bonds
Equity

International Finance
Trading Structure in Financial Markets
Exchange-tradedOver-the-counter
Structured/embedded
FuturesSwaps
Options
Convertibles
Warrants
Figure 2

International Finance
Nikkei-linked bond with puts
Investor Issuer
Arranging bank
Investor
put
coupon,premiumput
premium
putpremium
Figure 3

International Finance
Equity derivative swap, two-sided
Bank A Bank Bdepreciation
appreciation
premium (upfront or LIBOR flow)
Figure 4

International Finance
Customized derivative swap
Investor Bank A
T-notes at 5%
5%
appreciation
appreciation in Nikkeiover 22,000
premium for call at 22,000
Figure 5

International Finance
Equity Derivative Swap with Embedded Options
Bank Y Bank X
LIBOR Prem
Index apprec.
Knock-out on Nikkei
Yen/$ Quanto
Figure 6

International Finance
Swap Credit Exposure: Regulatory Approach
OEM
Swap creditrisk
Mark tomarket
CEM
Swap creditriskSwap creditrisk
Swap creditrisk
Credit conversion
Figure 7

International Finance
Creation of a Differential Swap
CompanyY
Bank A Bank B
Bank C
i-US
i-DM less SPR
i-US
US fixed
DM fixedi-DM
i-DM and i-US: DM and US LIBOR
Figure 8