international construction costs 2017: cost …368131ad-e31b-4552-821b... · - dubai - doha -...
TRANSCRIPT

INTERNATIONAL CONSTRUCTION COSTS 2017: COST CERTAINTY IN AN UNCERTAIN WORLD

CONTE
NTS

CONTE
NTS
1.0 FOREWORD – EDEL CHRISTIE 2.0 CITY COST COMPARISON 2.1 SUMMARY 2.2 RESULTS TABLE: INTERNATIONAL COST COMPARISON
3.0 GLOBAL CONSTRUCTION MARKET TRENDS 3.1 TRENDS IN COMMODITIES 3.2 TRENDS IN CURRENCY 3.3 TEN OF THE MOST EXPENSIVE CONSTRUCTION PROJECTS IN 2017
4.0 REGIONAL CONSTRUCTION MARKET TRENDS 4.1 AMERICAS - NEW YORK 4.2 ASIA - HONG KONG - SINGAPORE - PROJECT SPOTLIGHT: OBOR 4.3 AUSTRALIA PACIFIC - MELBOURNE 4.4 EUROPE - FRANKFURT - LONDON - PARIS - PROJECT SPOTLIGHT: GRAND PARIS EXPRESS 4.5 MIDDLE EAST - DUBAI - DOHA - PROJECT SPOTLIGHT: DUBAI AL MAKTOUM AIRPORT
5.0 CONCLUSION
6.0 METHODOLOGY
7.0 FURTHER READING
8.0 CONTACT DETAILS

FORE
WORD
1.0

Capital costs associated with constructing the infrastructure and
buildings of tomorrow vary widely by location and remain hard to
predict. Fluctuating currencies and commodity prices, and unexpected political developments have added
to a complex and dynamic mix over the past 12 months. These factors add further dimensions
of risk to investment decision making, increasing the challenges
associated with securing certainty of outcome.
Edel Christie - Global Solutions Leader, Program Management
This latest edition of our annual International Construction Costs report details the relative cost of construction in 44 of the world’s major cities. Last year’s theme was ‘forewarned is forearmed’, where we highlighted that cost was one of the key factors that determine which developments go ahead and deliver positive outcomes. We made the case that access to reliable data and insight, combined with effective control, was a key part of the toolkit for successful delivery.
In 2017, our theme is Cost Certainty in an Uncertain World. Risk can result in increased costs, and given construction’s poor record in improving productivity, there is a possibility that growing uncertainty might become a barrier to the successful delivery of project investment. Given the significant shift in the political landscape seen in 2016, the challenge for businesses and government has increased in many markets. Meeting investment decision criteria and achieving predictable project outcomes may be increasingly challenging in many markets, but will remain essential if vital infrastructure investment is to be delivered.
Agility is a valuable capability in uncertain markets. The ability of investors and developers to flex their approaches to project procurement, finance and delivery will continue to be extremely valuable as politics and markets continue to be buffeted by both unexpected events and shifts in the business cycle. However, in seeking to be agile, developers and investors may have to relinquish some level of control over the detail of project delivery.
Ultimately the challenge for clients remains how to make smart investments in an increasingly uncertain world. Having access to high quality data and current, relevant market insight is one tool that will help clients to successfully navigate these challenges.

2.1 SUMMARY
World cities, including London and New York, continue to be some
of the most expensive locations in the world to build. However,
a slowdown in the rate of global growth, led by China and the
resource economies, such as Brazil and Saudi Arabia, points to wider
changes affecting the world’s construction markets.
2.0 CITY COST COMPARISON
The change in London’s position, from second most expensive to fourth, has been driven entirely by changes in exchange rates. Inflation remained relatively high in the UK during 2016. However, in other markets, such as in Chinese cities, a slowdown in previously high levels of construction inflation is also driving changes in the rankings.
There are some exceptions. Some US cities, New York, San Francisco and Denver for example are seeing high levels of activity and are likely to see continuing competition for contractors and construction labour. Amsterdam is also in the midst of a mini building boom which has seen relatively high levels of inflation in local markets. Simply by being one of the largest and fastest growing economies in the world, India is also seeing some cost escalation, albeit from a very low base. However, across some markets, weaker growth in demand and slow resource markets have helped to eliminate construction inflation from cities including Dubai, Sinagpore and Hong Kong.
Elsewhere, modest growth has been the theme in many locations in Europe and Asia where limited changes in construction workload have had correspondingly little impact on local prices. Whether such stability can be sustained through 2017 will be of crucial importance to consultants, contractors and other members of local construction supply chains.
In this year’s rankings our assessment is based on typical developments in city locations, illustrating the significant product quality, supply chain and cost differential factors specific to these locations, including London, Geneva, New York and Hong Kong. The findings also point to significant cost differentials within the Eurozone, with costs in Lisbon and Athens still at an almost 50% discount to Brussels, for example.

◄ ►
▲
▲
▼
◄ ►
◄ ►
◄ ►
◄ ►
◄ ►
▲
▲
▲
▲
▲
▲
▲
▲
▲
▲
▲
▲
▲
▲
▲
▲
▲
▲
▲
▲
▲
▼
▼
▼
▼
▼
▼
▼
▼
▼
▼
▼
▼
▼
◄ ►
0 50 100 150 200 250
JAKARTA 42
TAIPEI 40
MANILA 38
PRAGUE 36
SOFIA 33
ATHENS 32
LISBON 28
BRUNEI 27
ZAGREB 26
ANKARA 25
RIGA 24
MADRID 23
KIEV 22
SEOUL 21
DUBAI 19
JEDDAH 18
TOKYO 17
MILAN 16
DOHA 11
VIENNA 10
PARIS 9
MACAU 5
GENEVA 3
CENTRAL LONDON 4
KUALA LUMPUR 43
HONG KONG 2
BANGALURU 44
HO CHI MINH 41
BUCHAREST 37
FRANKFURT 8
STOCKHOLM 7
COPENHAGEN 6
BRUSSELS 12
AUCKLAND 13
MELBOURNE 14
SINGAPORE 15
AMSTERDAM 20
BELGRADE 30
SAO PAULO 31
SARAJEVO 34
SHANGHAI 35
BANGKOK 39
NEW YORK 1
▲ HIGHER RANKING = MORE COSTLY TO CONSTRUCT
◄ ► NON MOVER
▼ LOWER RANKING = LESS COSTLY TO CONSTRUCT
WARSAW 29
2.2 FIG. 1: RESULTS TABLE - INTERNATIONAL COST COMPARISON INDEX

3.1 COMMODITY TRENDS Commodity prices remained largely stable and at a low base through most of 2016. Whilst the mining and oil and gas industries felt the pain, for construction low prices helped keep a lid on inflationary pressure on input costs. Since October 2016, industrial commodity prices have staged a mini-recovery, increasing by around 15% in the 4 months since October 2016. Whilst crude oil prices have fluctuated by 50% in the past 12 months, these price movements have had a limited impact so far on prices charged on construction projects.
Looking forward, the question is whether the recent rapid adjustment in prices will continue, or whether a more stable pattern of supply
and demand will be re-established. According to latest World Bank forecasts, following action to correct supply and demand imbalances on many commodity markets, commodity prices will increase over the next five years. Crude oil is expected to make the biggest recovery, with prices now forecast to rise to around $60/bbl by 2018, a rise of over 100% from the low point seen in early 2016. However, $60/bbl is not enough to get above the level needed to enable many Gulf Oil producers to balance their budgets, which could weigh on a recovery in public spending programs that have been pared back over the past two years.
Whilst high levels of oil stocks could hold back the further recovery of oil prices, production constraints
3.0 GLOBAL CONSTRUCTION MARKET TRENDS
and low investment could result in further price increases in metals, particularly if demand from China continues to strengthen as it has over the past few months – the price of iron ore for example is expected to peak at $65/tonne during 2017 - 8% above its long term trend value.
Inevitably there is a high degree of uncertainty attached to these forecasts – associated not only with the potential for additional supply or geopolitical disruption but also further fall in demand. Furthermore, as seen following the fall in the value of sterling, the strength of a country’s currency relative to the dollar plays a key role in defining the local cost of commodity-based goods.
*Please note that the huge rise and fall in iron ore prices between 2009 and 2015 distort the data.
0
100
200
300
400
500
FORECAST
600
700
2005 2006 2007 2008 2009 2010 2011 2012 2013 2014 2015 2016 2017 2018 2019 2020 2021
Inde
x (B
ase
2005
= 1
00)
Coal, AustralianCrude oil, avg, spotAluminum Copper Iron ore
FIG. 2: WORLD COMMODITY PRICES 2005 - 2021*
Source: IMF and World Bank
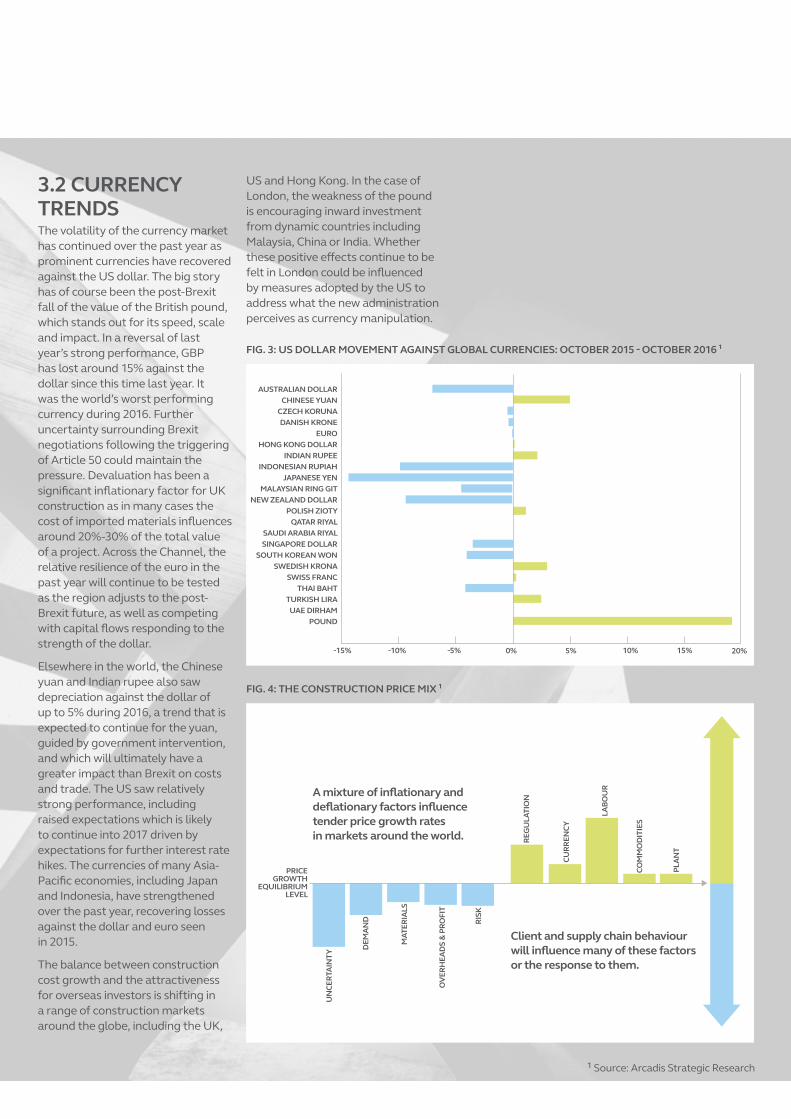
3.2 CURRENCY TRENDS The volatility of the currency market has continued over the past year as prominent currencies have recovered against the US dollar. The big story has of course been the post-Brexit fall of the value of the British pound, which stands out for its speed, scale and impact. In a reversal of last year’s strong performance, GBP has lost around 15% against the dollar since this time last year. It was the world’s worst performing currency during 2016. Further uncertainty surrounding Brexit negotiations following the triggering of Article 50 could maintain the pressure. Devaluation has been a significant inflationary factor for UK construction as in many cases the cost of imported materials influences around 20%-30% of the total value of a project. Across the Channel, the relative resilience of the euro in the past year will continue to be tested as the region adjusts to the post-Brexit future, as well as competing with capital flows responding to the strength of the dollar.
Elsewhere in the world, the Chinese yuan and Indian rupee also saw depreciation against the dollar of up to 5% during 2016, a trend that is expected to continue for the yuan, guided by government intervention, and which will ultimately have a greater impact than Brexit on costs and trade. The US saw relatively strong performance, including raised expectations which is likely to continue into 2017 driven by expectations for further interest rate hikes. The currencies of many Asia-Pacific economies, including Japan and Indonesia, have strengthened over the past year, recovering losses against the dollar and euro seen in 2015.
The balance between construction cost growth and the attractiveness for overseas investors is shifting in a range of construction markets around the globe, including the UK,
AUSTRALIAN DOLLARCHINESE YUAN
CZECH KORUNADANISH KRONE
EUROHONG KONG DOLLAR
INDIAN RUPEEINDONESIAN RUPIAH
JAPANESE YENMALAYSIAN RING GIT
NEW ZEALAND DOLLARPOLISH ZIOTY
QATAR RIYALSAUDI ARABIA RIYALSINGAPORE DOLLAR
SOUTH KOREAN WONSWEDISH KRONA
SWISS FRANCTHAI BAHT
TURKISH LIRAUAE DIRHAM
POUND
-15% -10% -5% 0% 5% 10% 15% 20%
UN
CERT
AIN
TY D
EMA
ND
MAT
ERIA
LS
A mixture of inflationary and deflationary factors influence tender price growth rates in markets around the world.
PRICEGROWTH
EQUILIBRIUMLEVEL
Client and supply chain behaviour will influence many of these factors or the response to them.
RISK
REG
ULA
TIO
N
CURR
ENCY
LABO
UR
PLA
NT
COM
MO
DIT
IES
OV
ERH
EAD
S &
PRO
FIT
US and Hong Kong. In the case of London, the weakness of the pound is encouraging inward investment from dynamic countries including Malaysia, China or India. Whether these positive effects continue to be felt in London could be influenced by measures adopted by the US to address what the new administration perceives as currency manipulation.
FIG. 4: THE CONSTRUCTION PRICE MIX ¹
FIG. 3: US DOLLAR MOVEMENT AGAINST GLOBAL CURRENCIES: OCTOBER 2015 - OCTOBER 2016 ¹
1 Source: Arcadis Strategic Research

3.3 FIG. 5: TEN OF THE HIGHEST VALUE CONSTRUCTION PROJECTS IN 2017 (TOTAL VALUE / US$BN)¹
CONSTRUCTION AND COST: 10 OF THE HIGHEST VALUE PROJECTS AND PROGRAMS AROUND THE WORLD No matter what city or country you’re in around the world, a fundamental truth is that the cost of constructing critical infrastructure and new buildings over the course of a long build phase is notoriously difficult to predict, making the challenge of providing cost and commercial certainty a vital one.
However difficult the process of construction, when completed, built assets generate a formidable economic contribution to the communities and cities within which they’re built. For example, in 2016 the built environment generated a huge US$36trillion of GDP globally. This is evidence that throughout history constructing built assets, from roads and railways to residential high-rises, is critical to national wealth.
Across the globe, governments are planning, constructing and redefining their built environments in order to create
thriving communities that improve quality of life for their citizens and generate better returns for the economy. This year’s International Construction Cost report highlights ten of the largest, most costly construction projects that are in flight in 2017 that are being created to benefit both the communities of those in which they exist, and the wider global economy.
For project spotlights on One Belt, One Road (OBOR), Grand Paris Metro, and Dubai Al Maktoum Airport, please visit the regional summary pages.
PROJECT OR PROGRAM LOCATION VALUE (US$ BN)
1. ONE BELT, ONE ROAD CHINA TO CENTRAL ASIA 150
2. DELHI MUMBAI INDUSTRIAL CORRIDOR DELHI TO MUMBAI, INDIA 90
3. DUBAI AL MAKTOUM AIRPORT DUBAI, UAE 33
4. GRAND PARIS EXPRESS PARIS, FRANCE 30
5. HINKLEY POINT C SOMERSET, UK 22
6. HUDSON YARDS NEW YORK CITY, UNITED STATES 20
7. JEDDAH ECONOMIC CITY JEDDAH, SAUDI ARABIA 20
8. CROSSRAIL LONDON, UK 20
9. BEIJING DAXING INTERNATIONAL AIRPORT BEIJING, CHINA 13
10. CHENGDU TIANFU INTERNATIONAL AIRPORT CHENGDU, CHINA 11
1 Source: Arcadis Strategic Research

4.0 REGIONAL CONSTRUCTION MARKET TRENDS
4.1 AMERICASContinuing growth in the US has been sustained despite a slowdown in investment in the oil and gas sector and a slight rise in interest rates. Job creation, low interest rates and GDP growth have supported steady rather than spectacular growth in the US construction sector. With the new US administration, expectations have risen with respect to a significant increase in investment in critical national infrastructure.
The strength of the US economy helped to underpin global growth as China’s rate of expansion faded in 2015, but the US is now growing at about 1.5% per year. Prior to the election, construction output growth was expected to increase at around 3% per year, driven by the housing market recovery in large metro areas such as Los Angeles and Houston. Housing continues to be a bright sector, but with build rates remaining 30% below the pre-crisis peak there should be potential for further growth.
CONSTRUCTION COST TRENDS FOR BUILDING AND INFRASTRUCTURE Commercial industrial manufacturing has been experiencing a renaissance in the US, partly as a result of low energy costs and increasing costs of imports from Asia, driven in part by higher wages. This is clearly a trend that will accelerate with renewed political support. Investors are able to consider manufacturing across sectors in the US due to further innovations in technology and sophisticated management systems in recent years. There will be continuing investment in manufacturing if the pace of “reshoring” accelerates.
Infrastructure such as roads, bridges and utilities is discussed as having massive market potential given the $3.6tn renewals program identified by the American Society of Civil Engineers in 2014. As more than
80% of US infrastructure is either in private or municipal ownership, funding models other than federal spending will need to be identified - suggesting that expectations raised during the election might be difficult to fulfill. The spread of the Public Private Partnership (PPP) model, now supported in 33 states, is likely to be one of the major vehicles used to attract infrastructure investment in the foreseeable future.
What are some of the construction cost challenges ahead for the US? Reusing existing building space can compromise the design process due to an existing building’s structure or envelope. Another challenge is the scarcity of talented, skilled workers who are being pulled from different sector’s project and raising labor costs. The hyper-competitive market means developers are seeking low cost construction delivery models like design-build and construction management which allows owners to share risk to release the project for an early construction start, even though not all design aspects are complete.
COMBATING CONSTRUCTION COST CHALLENGES ON THE HORIZON FOR THE AMERICAS Other countries in the Americas are facing different fortunes. Mexico, for example, has benefitted from increased competitiveness due to low energy and labor costs, but faces huge uncertainty with respect to the future of NAFTA and its wider relationship with the US. Brazil faces a tough future both politically and economically. New fiscal measures introduced by the current Brazilian president, Michel Temer, aim to return the economy to growth by 2017 with the hope that it will lead to a recovery in demand from the commercial and private residential sectors. However, prospects for investment in resource industries remain poor given continuing conditions of oversupply.

NEW YORK, USA RANKS # 1 / [NON-MOVER] The Big Apple is the most expensive place in the world to build. This trend is likely to continue into 2017 and beyond as large-scale construction projects and international investors drive development. New York’s dense environment, unique local regulatory requirements, labor shortages and lack of contractor competition means hard construction costs, across classes of construction, are up to 50% more expensive than other major cities like Chicago, Los Angeles, Seattle, or Boston. San Francisco is the second most expensive city for hard construction costs, due to their equally cramped environment, the rigorous seismic requirements and competition for contractors. The Houston market is a bargain, relatively speaking, as the city’s hard construction costs are currently 10% below the national average.
Owners, developers and builders must be smart about how they construct in this tough market and constantly look for ways to save on costs and do more with less. Sourcing an adequate pool of qualified contractors to bid at the outset of a project can be challenging. Contractors can selectively decide which projects to work on so there is a need for project owners to
aggressively market projects so that they are attractive to increase bidding competition. This can slow projects or even halt them completely, and it may be necessary to use alternative contractors with workers from outside the local area or sub-contractors, as top firms are often busy.
The construction management procurement approach allows contractors to buy materials and thoughtfully manage their integration into the project (i.e. just-in-time release) to stay in front of the project and optimize productivity. Building in such a dense urban environment like NYC means expertly handling material storage, transport and staging which requires key cost decisions such as the option of renting space or facing a complex delivery schedule which is likely to include a lack of proper laydown space. Modularized construction solutions may be the right answer for many in NYC to contain costs and keep the project moving. In New York City, contractors and developers must continue to take the lead in finding innovative, custom solutions to their build approach to mitigate the rising hard construction costs.

HONG KONG RANKS # 2 / [NON-MOVER] Hong Kong markets are stabilizing at peak levels of activity, which have seen projects affected by significant resourcing challenges. Output in 2015 reached yet another record – up by 100% compared with 2010. While big projects such as the Zhuhai Macau bridge link and the Guangzhou-Shenzhen High Speed Rail link are well advanced, new programs – the third runway at Chek Lap Kok, expansion of the East Kowloon central Business District and maintenance of a large-scale housing programme totalling 480,000 units over 10 years - are expected to sustain workload at current levels. Hong Kong’s residential, hospitality and commerce markets depend on mainland demand, which so far has been sustained.
The private sector represents around 30% of overall activity, so the health of the construction market is closely linked to wider Chinese markets. Operating at peak levels spells a problem for Hong Kong’s authorities because of the shortage of construction operatives available. This shortage, estimated to be over 10,000 people, has been driving up prices and delaying project completions. However, the ageing workforce and labour force problem is difficult to solve as solutions based on migrant labour are not acceptable to the local population. As a result, initiatives to increase industry productivity are gaining a higher profile in Hong Kong.
SINGAPORE RANKS # 15 / DOWN FIVE PLACES (PREVIOUSLY #10) Singapore’s construction market has seen a continuing correction since 2014 triggered by over-supply and a slowing economy. The residential sector has the highest vacancy levels since 2005 and public housing delivery has also been scaled back down to around 18,000 units compared with 22,000 delivered in 2014. 2017 is currently forecast to be between US$27bn and US$32bn - down on previous forecasts but representing a stable market after a steep correction. Sustained workload in the public sector in areas such as public housing and civil engineering has supported the industry during the correction, and as a result, prices have remained broadly stable.
Looking forward, continuing investment in aviation, metro, road and high-speed rail through projects such as the Changi Airport Terminal construction and High Speed Rail terminus is planned to sustain both the local industry and Singapore’s competitive position. Output is forecast to increase by about 2% per year, showing the trademark resilience of the economy. However, like Hong Kong, Singapore also faces a labour shortage. In an effort to incentivise local contractors to invest in their workforce, the Singapore government has increased the cost of levies charged on the wages of mid-skilled overseas workers to encourage talent retention in the city-state.
4.2 ASIA The effects of China’s continuing transition away from an investment-driven economy are having a particular impact on Asian markets that have previously seen Chinese inward investment. In some cases real estate markets are suffering from over-supply exacerbated by a slowdown in demand from Chinese tourists and investor occupiers. Whilst economic growth levels in emerging Asian economies such as Malaysia, Indonesia and Philippines are way in excess of the developed world, growth rates in established hubs including Hong Kong and Singapore are similar to those seen in the US and Eurozone.
Growth rates in many construction markets have eased significantly over the past 18 months as commercial and residential development rates have peaked. Whereas double-digit growth has been common across the region, expansion at around 5%-7% per year is the best prospect for many construction markets. Looking forward, demand is expected to be tied into large-scale investment in energy and transport infrastructure (such as the One Belt One Road project), much of which will need to be funded by PPP, and affordable housing, which will need central government support. Given the importance of private funding, the maintenance of investor confidence in the face of potential turbulence from China will be vital for the health of Asian construction markets.

PROJECT SPOTLIGHT: ONE BELT, ONE ROAD (OBOR) With an expected program lifespan of 13 years at a total value of US$150bn, the One Belt, One Road (OBOR) initiative, linking up Eurasian countries with China through Central Asia and across Southeast Asia, Oceania and North Africa, is a construction giant. Commissioned by Chinese leader Xi Jinping as part of a strategic approach to open up new avenues to sustain its appetite for growth, OBOR is a development strategy and framework that focuses on connectivity and cooperation among countries primarily between the People’s Republic of China and the rest of Eurasia. It proposes to do so through two main components, the land-based “Silk Road Economic Belt” (SREB) and oceangoing “Maritime Silk Road” (MSR).
The initiative calls for the integration of the region into a cohesive economic area through building infrastructure, increasing cultural exchanges, and broadening trade. There are several nodes, corridors and other elements of the belt. One of the earliest nodes to take shape was the New Eurasian Land Bridge, a railway that connects China to Central Europe through Kazakhstan and Eastern Europe. Economic corridors extend across the Eurasian land mass including in regions on the periphery like the Russian Far East.
The strategy, which as a mega-scale construction program, is being underpinned by the dedicated Asian Infrastructure Investment Bank (AIIB), underlines China’s push to take a bigger role in global affairs, and its need for priority capacity cooperation in areas such as steel manufacturing. Over the next two decades the initiative will be realised, and the impact of this massive construction project will be seen on the world stage.

MELBOURNE, AUSTRALIA RANKS # 14 / UP ONE PLACE (PREVIOUS #15) Ranked 14th globally in our International Construction Costs Survey, Melbourne sits in the top third of the most expensive cities to build in globally. Compared to cities in the traditional resource states of Western Australia and Queensland, Victoria’s capital Melbourne has significant public and private construction planned in the coming years. This is largely driven by the Victorian State Government’s commitment to infrastructure spend and addressing the needs of Melbourne as a global city.
Construction costs remain high in part due to Australia’s geographic isolation. Compared to Europe and the Americas, there is far less private sector competition to complete construction work and these companies import the majority of construction materials, which can fluctuate in price due to the Australian dollar and taxes. Adding to this, Melbourne like all Australian cities has a long history of powerful trade unions, which protect workers’ rights but can contribute to the cost of construction. Despite the cost, Melbourne has a strong plan for construction across rail, road-widening projects and new buildings underway.
4.3 AUSTRALIA PACIFICConstruction markets in Australia continue to be impacted by a big overhang caused by the slowdown in commodity markets, but infrastructure and housing markets remain strong in New South Wales and Victoria in particular. Prospects for growth are closely aligned to an ambitious A$184bn transport infrastructure plan focused on rail and motorway construction, though some of this relies on developer contributions, user payments and political commitment.
Growth of 1% was forecast for 2016, albeit output fell by nearly 4% in the second quarter and is down 10% in the year. The housing market has been a bright spot in Sydney and Melbourne in particular, with prices rising by about 30% since 2012, driven in part by high levels of overseas investment. Some analysts believe that the peak in the cycle has been reached although output continues to rise at around 4% per year. However, to contrast this, looking ahead, infrastructure is likely to be the brightest sector with road, metro and airport development providing the bulk of the opportunities, already seen through major programs such as the new Western Sydney Airport, Metro developments, and Melbourne’s Western Distributor highway project.

4.4 EUROPEDespite falling energy prices and quantitative easing, the Eurozone’s recovery remained weak in 2016, and a combination of political uncertainty and the impact of Brexit could knock future forecasts backwards. The European commission forecasted GDP growth of 1.6% in the euro area for 2016 and 2017, however due to slower growth in emerging markets, risks resulting from the economic rebalance in China, and rising interest rates in the US, the commission reports that risks to its forecast are increasing.
A further risk comes from the political scene, where many of the EU’s major markets, including Germany, France, Italy and the Netherlands, will see either a general election or a referendum in the next 12 months. Given the feverish nature of national politics in the EU, it is quite possible that even more instability will be added to the post-Brexit mix. A rebound in infrastructure investment had been expected in 2016, driven partly by the €350bn Juncker infrastructure investment plan. Analysis carried out in May 2016 suggests €11bn of project funding has been approved so far, although evidence that the Juncker funding is replacing rather than creating new investment means that a significant increase in overall infrastructure spend may not be realized.
Construction markets in Europe grew by 1.5% in 2015, with activity in Central and Eastern Europe growing at the fastest rate. However, current forecasts estimate an increase to 2.6% per year, with most growth coming from the six largest markets, including Spain and Poland, the latter of which received a high rate of construction investment alongside the UK. Spain and Hungary are all expected to see a rapid rate of growth following a steep decline in activity since the financial crisis.
FRANKFURT, GERMANY RANKS # 8 / [NON-MOVER] Real estate experts expect Frankfurt, as “the City of Banks”, to be on the winning side after Brexit. Although the banking industry is still concerned about the effects of the financial crisis and low interest rates, we expect Frankfurt to see a rise in speculative property purchases and construction activities due to relocation of companies from London to Frankfurt.
Whether in residential construction or commercial real estate, the demand for land and buildings in Frankfurt and the surrounding area is likely to rise further in the coming years. However, the weak Euro and increasing construction costs of recent years are being balanced by disproportionately high prices for new buildings caused by foreign investors from China, Russia and the US.
Against the background of a buoyant economy, record exports and all-time low borrowing rates, the German construction industry experienced a boom in 2016. The most sought after developments were logistics/industrial and residential. The demand for logistic and industrial properties is reaching unprecedented levels, with the churn in new lease agreements alone in Frankfurt for 2016 at a rate 44% higher than average, two thirds of which were for newly constructed properties. In the residential sector, historically low interest rates and high job security have increased purchase power for home buyers, and have made property a more attractive investment for savers. Rental demand for residential property in the cities is extremely high, with a shortfall of supply against demand in all categories, but particularly affordable housing and executive high-rise apartments.
LONDON, UK RANKS # 4 / DOWN TWO PLACES (PREVIOUS #2) London is one of the costliest cities in the world for construction. However, the nation’s recent Brexit vote has unleashed a wave of uncertainty which is bringing the balance of risk and reward under sharp focus in the market. An unpredictable outlook for future asset values and end user demand threatens development pipelines in some key commercial sectors. A resulting potential softening of tender prices, coupled with rising input costs, gives cause for concern that the industry could come under intensifying commercial pressure. As uncertainty escalates, increasingly clients will need to take greater risks on development decisions, whilst suppliers will need to take risks on pricing strategies.
Meanwhile, the UK construction skills crisis continues to take its toll on the capital with some sectors, such as infrastructure, particularly feeling the pinch. We estimate that, even excluding the potential impact of forthcoming migration controls, the house building and infrastructure sectors in London will need to recruit an extra 50,000 new people each year to meet needs. The government and industry will need to act swiftly to mitigate these risks and position the sector for the future opportunities of a post-Brexit boom.

PARIS, FRANCE RANKS # 9 / [NON-MOVER] In a European Union dominated by austerity and strict budgetary rules, examples of innovative investments in construction are scarce. However, in Paris a number of such investments are underway, in recognition of the fact that a well-performing infrastructure is the lifeblood of a country’s and a cities’ economic prospects.
Within the Paris historical city limits, Paris Rive Gauche and Clichy Batignolles are two major developments that combine infrastructure and new urban forms in an innovative way to invent the city of the future. Innovation has also been harnessed by the City government through a new form of urban competition. “Reinventing Paris” awarded 22 sites for development with no pre-established program based on an assessment of the social and environmental value-added. Arcadis has been involved in the process through the design of two
buildings, including “Mille Arbres” which is sure to become an iconic addition to Paris’s urban landscape.
Ultimately however it is thanks to the €28bn Grand Paris Express project that Paris is undergoing the greatest infrastructural metamorphosis since the days of Baron Haussmann – the creator of modern Paris. 200 kilometers of new high-speed metro lines with 68 new stations will create new connections and stimulate new areas for development on the perimeter of the most densely built-up areas.
PROJECT SPOTLIGHT: GRAND PARIS EXPRESS One of the largest infrastructure projects in Europe today, Grand Paris Express began construction in Paris in June 2016. The project, managed by a specially-formed entity, Société du Grand Paris (SGP), will cost an estimated €28bn of investment to 2030. The 200 kilometers of new metro lines will have capacity to carry two million passengers, creating new connections between underserved parts of the Paris metropolis. The main stations will become major development hubs, creating jobs and homes. The project’s backers expect it to generate €100 to €200bn of additional GDP for the Paris region and tax revenue of between €40bn and €80bn.
In its capacity as entity responsible for the delivery of Grand Paris Express, SGP commissioned an Arcadis joint venture for global operational project management of three lines of the Grand Paris Express. The services include program and project management, contract and procurement management, costs and risk analyses, technical advisory, BIM management and other tasks, with a full-time dedicated team of more than seventy Arcadis consultants.
4.5 MIDDLE EASTThe steep fall in the oil price since 2014 and the strength of the US dollar, continue to have a significant and long-term impact on construction markets in the Gulf Co-operation Council (GCC) countries. Over the last twelve months, deficits have continued to grow, particularly in oil-dependent economies such as Saudi Arabia and Kuwait. To address this challenge, several nations have trimmed back their public expenditure through cuts to spending programs and subsidies.
They’re also increasingly focused on the economic diversification agenda which is a central part of many of the National Visions across the region. In the medium to long-term, this focus on diversifying revenue streams will bring significant benefits. However, in the short-term, there’s a degree of uncertainty, with some industry analysts suggesting that member states like Qatar, Kuwait and the UAE need the price of oil to be US$65-70 per barrel to balance the books.
DUBAI, UAE RANKS # 19 / DOWN ONE PLACE (PREVIOUS #18) Recent developments in the UAE have demonstrated the wider impact of uncertainty associated with falling commodity markets on the local construction industry. Despite the significant levels of investment needed to help deliver Expo 2020 and to boost wider transport inter-connectivity, the development pipeline has taken a hit as a result of greater caution by local investors.
Traditionally, Dubai has benefited from strong residential, retail and hospitality markets however these sectors have cooled since 2014 and remained flat in 2016. Projects are now being initiated ahead of Expo 2020 but many of these will not
be procured until mid-2017 at the earliest, and could result in further weakness in construction inflation in early 2017.
Transport infrastructure remains a big priority in Dubai even though the existing infrastructure is some of the best in the world. This is hardly surprising though given the population of the Emirate is estimated to double in the next 13 years alone. Ambitious plans for rail, metro and airport expansion form the background to construction programs worth more than US$70bn. These will continue to be developed, although at a slower rate than initially planned.

DOHA, QATAR RANKS # 11 / UP ONE PLACE (PREVIOUS #12)Qatar continues to race towards the delivery of the 2022 FIFA World Cup™, and it could be argued that the wider slowdown in the GCC construction market has been beneficial, given the scale of the program still to be delivered. Despite the wider fall in energy prices, Qatar continues to experience positive GDP growth although at a slower rate than before. In 2017 the economy is expected to grow by ~3.9%.
Although we’ve seen a recent slowdown in the pace of delivery, infrastructure investment will continue to be a big priority as its central to both the delivery of the World Cup and the wider 2030
PROJECT SPOTLIGHT: DUBAI AL MAKTOUM AIRPORT Approved in 2014, the AED120bn (US$32.67bn) expansion project for Al Maktoum International Airport is expected to result in the world’s biggest airport, both in terms of size and passenger capacity, by 2050. It will also ease pressure on the nation’s first airport, Dubai International Airport, which is expected to witness 100 million passengers by the end of 2020, and has limited scope for further growth.The expansion will be executed in two phases over the next six to eight years. After the project’s completion, the airport will be able to handle more than 220 million passengers a year. The initial phase has been divided into two sub-phases, the first of which will see construction of a new 165,000m² terminal facility, offering a capacity of 35 million passengers a year, and two 385,000m² satellite concourses, and satellite terminals.
The second sub-phase will see the construction of two more runways with similar dimensions and capabilities, increasing the total number of runways at the airport to five. With construction at the airport itself enabling far greater capacity allowance, infrastructure needs to be put in place to transport passengers in and out of the airport and on and off the planes. Therefore, in addition to the new runways, six new train tracks will be built to connect the terminals with the concourses, with two each for departures, arrivals and transfers. Three stations will be constructed at each concourse, with another built at the west terminal.
Once complete, the Al Maktoum Airport will serve as the focal point for Dubai World Central, a purpose-built “airport city” located 23 miles outside of Dubai. The 54-square mile airport metropolis will feature everything from commercial, residential, and leisure developments, to state-of-the art cargo and air passenger facilities.
National Vision. Some projects have already been deferred or taken off the critical path however there’s still significant investment being planned including the world’s largest Greenfield port development, 8,500km of roads and a combined US$75bn rail and metro program.
As Qatar proceeds towards the World Cup, it continues to face infrastructure delivery challenges, including the sourcing of labour and materials, and local logistics that impact the pace of construction and development. The nation’s industry will also soon need to start planning for the slowdown in work that will inevitably follow the peak of World Cup-related expenditure.

5.0 CONCLUSION: DIGITAL ENABLEMENT OF COST CERTAINTY
It is increasingly important to leverage available data analytics and digital construction methods to develop a higher degree of cost certainty and investment confidence. A digitally enabled cost and project delivery framework allows for a more agile response to these shifts in investment fundamentals during project delivery as well as driving long term asset life-cycle performance.
With an increasingly volatile and uncertain geo-political
and economic landscape, the importance of monitoring and
controlling the cost life-cycle has never been more evident.
Fluctuating currency, commodity and politics can directly affect
project capital expenditure and supply chain performance
underpinning investment decisions; the events of 2016 show that these fundamentals can shift quickly and
unexpectedly .

FIG. 6: ARCADIS DIGITAL INTEGRATION THROUGHOUT COST LIFE-CYCLE MODEL
REDEF
INING ASSETS PLANNING ASSETS
OPERATING ASSETS
CREATING A
SSETS
CLOSE ESTIMATING BENCH
MARKIN
G
OPER
ATION
PROCUREMENT COST PLANNING
& MA
INTEN
AN
CE & EXECUTION & BUDGETIN
G
DIGITALLYINTEGRATED

The comparative cost assessment is based on a survey of construction costs in 44 locations undertaken by Arcadis, covering 13 building types. costs are representative of the local specification used to meet market need. The building solutions adopted in each location are broadly similar and as a result, the cost differential reported represents differences in specification as well as the cost of labor and materials – rather than significant differences in building function.
Costs in local currencies have been converted into a common currency for the purpose of the comparison, but no account has been taken of purchase power parity. High and low cost factors for each building type have been calculated relative to the UK, where average costs for south-east England = 100, using US dollar as the currency unit. The relative costs plotted in the chart represent the average high and low cost factor for each of the 13 buildings included in the sample. Construction costs are current in Q4 2016. Exchange rates were current on 5 October 2016.
6.0 METHODOLOGY
FIG.5 SOURCES – 3.3.
EDF: https://www.edfenergy.com/energy/nuclear-new-build-projects/hinkley-point-c
Crossrail: http://www.crossrail.co.uk
Wikipedia – https://en.wikipedia.org/wiki/Hudson_Yards,_Manhattan
Le Figaro – http://www.lefigaro.fr/conjoncture/2016/12/21/20002-20161221ARTFIG00006-grand-paris-les-chiffres-du-chantier-du-siecle-a-retenir.php
Airport Tech – http://www.airport-technology.com/projects/al-maktoum-international-airport-expansion-dubai/
McKinsey – http://www.mckinsey.com/global-themes/China/Chinas-one-belt-one-road-will-it-reshape-global-trade
Financial Times – https://ig.ft.com/sites/special-reports/one-belt-one-road/
Wikipedia https://en.wikipedia.org/wiki/One_Belt,_One_Road
Shanghaiist –http://shanghaiist.com/2016/05/28/chengdu_tianfu_international_airport_construction.php
Centre for Aviation – https://centreforaviation.com/profiles/newairports/beijing-daxing-international-airport
DMIC – http://delhimumbaiindustrialcorridor.com/
Wikipedia – https://en.wikipedia.org/wiki/Jeddah_Economic_City
THE AMERICAS CITY COMPARISON SOURCES – 4.1:
The data gathered for other US city comparison was accessed from the Marshall & Swift Valuation Service using published indices through the end of 2016.

7.0 RELATED MATERIAL
INTERNATIONAL CONSTRUCTION COSTS 2016
CITY INVESTOR GUIDE LONDON
GLOBAL BUILT ASSET PERFORMANCE INDEX 2016
CITY INVESTOR GUIDE SYDNEY
GLOBAL INFRASTRUCTURE INVESTMENT INDEX 2016
SUSTAINABLE CITIES INDEX 2016
The materials above can be downloaded at www.arcadis.com

Edel Christie Global Solutions Leader, Program Management
T +44 (0)20 781 225 584
@edelchristie
Edel Christie
Simon Rawlinson Head of Strategic Research
T +44 (0)20 7812 2319
@SimonRawl
Simon Rawlinson
Arcadis
@ArcadisGlobal
@ArcadisGlobal
Arcadis. Improving quality of life
www.arcadis.com
8.0 CONTACT US