international competitiveness and growth of the nigerian
TRANSCRIPT

Research in Applied Economics ISSN 1948-5433
2014, Vol. 6, No. 4
www.macrothink.org/rae 53
International Competitiveness and Growth of the Nigerian Economy:
A Structural VAR-Based Perspective
Alege, Philip O.1 & Okodua, Henry1,*
1Department of Economics and Development Studies, College of Development Studies, Covenant University, Ota, Nigeria
*Corresponding author: Department of Economics and Development Studies, College of Development Studies, Covenant University, Ota, Nigeria. E-mail: [email protected]
Received: January 25, 2014 Accepted: November 6, 2014 Published: November 30, 2014
doi:10.5296/rae.v6i4.4986 URL: http://dx.doi.org/10.5296/rae.v6i4.4986
Abstract
The empirical relationship between international competitiveness of the Nigerian economy and its consequences on economic growth dynamics was investigated in this study. Using export performance and real effective exchange rate as proxies for international competitiveness of the Nigerian economy, the relationship between international competitiveness of the Nigerian economy and its growth dynamics have been analytically explored in this study using the structural VAR framework. The study found that growth of real output contemporaneously responds positively to a positive shock to real effective exchange rate but responded contrary to theoretical expectation in the opposite direction to a positive shock to export performance. The structural/orthogonalized impulse response analysis and the forecast error variance decomposition results were largely consistent with theoretical expectations as well as the short-run SVAR results. These results suggest that there are no serious misalignment issues with the Nigerian currency but cast doubt on the ability of the current export structure of the Nigerian economy to be growth inducing.
Keywords: International competitiveness, growth dynamics, Nigerian economy, SVAR.
brought to you by COREView metadata, citation and similar papers at core.ac.uk
provided by Covenant University Repository

Research in Applied Economics ISSN 1948-5433
2014, Vol. 6, No. 4
www.macrothink.org/rae 54
1. Introduction
Competitiveness, since the dawn of the current trend of globalization in the 1980s, has become synonymous with the measure of performance or the potential of an economy. Thus, it has become elegant in the literature to project long-term growth and prosperity of an economy with reference to its state of competitiveness. According to World Economic Forum (2007:5), competitiveness is defined as the set of institutions, policies and factors that drive productivity and therefore set the sustainable current and medium-term levels of economic prosperity.
However, in determining the competitiveness of an economy, the macroeconomic, political, legal and social as well as microeconomic context needs to be considered. The latter involves improvement in the microeconomic capacity of the domestic economy and the sophistication of the local competition. Assessing the competitiveness of an economy based on macroeconomic framework is particularly important for small open economies, such as the Nigerian economy which relies on trade with the rest of the world in ensuring sustainable growth and development. Some of the macroeconomic factors that affect competitiveness include fiscal policy, local and foreign debt stocks, and monetary policy, external trade in goods and services, national savings, inflation, interest rate spread, real effective exchange rate as well as flow of development finances.
This paper focuses on the macroeconomic aspect of competitiveness of the Nigerian economy. Macroeconomic stability is an important element in the national competitiveness. In drawing inference from this statement, it is pertinent to note that the Monetary Policy Committee (MPC) of the Central Bank of Nigeria in 2008 observed that, although the Nigerian economy had achieved an appreciable level of stability, there were still some areas of concern including the upward oil and food prices movements, fiscal expansion and international financial conditions (CBN, 2008). These factors have implications for the performance of the economy, the transmission of international business cycles and even its competitiveness.
Consequently, this paper examines how competitive the Nigerian economy is in the face of domestic and international volatility. It also seeks to answer a number of research questions as follows: to what extent do uncertainties and volatility of the global economic environment impact on the growth of the Nigerian economy? What are the factors affecting the predictability of the Nigerian economy’s competitiveness in the presence of shocks.
After the present introduction, Section 2 assesses the macroeconomic performance and competitiveness of the Nigerian economy. Section 3 of the paper presents a brief review of the literature on competiveness and growth while section 4 is concerned with the methodology and the empirical model. Section 5 contains the empirical analysis as well as the results and Section 6 is the conclusion.

Research in Applied Economics ISSN 1948-5433
2014, Vol. 6, No. 4
www.macrothink.org/rae 55
2. Macroeconomic Performance and Competitiveness of the Nigerian Economy
Table 1 depicts the growth of GDP in recent years from 2001 to 2011 and some of its components. It shows that real GDP growth rate averaged 6.2 percent per annum during 2001-2005. This is in contrast to 7.4 percent in the period 2006-2010. This could indicate an improvement in the macroeconomic environment following higher oil export receipts and various policies to make the economy more investment-friendly. Inflation rate has dropped from an average of 15.7 percent in the first period to 10.1 percent in the second period. Persistence in this trend is expected to boost investment environment. The interest rate for most of the period remained below single digit, a development that is investment friendly. Growth rates of imports and exports have remained high averaging 33.5 percent and 28.9 percent during the first and second 5-year average respectively for import; and 41.6 percent and 39.4 percent during the first and second 5-year average respectively for exports. In addition, money supply has been growing at a very high rate reaching an average of 20.4 and 35.4 percent, respectively during the first and second period. Reserves in months were comfortably high over the periods averaging US$14303.4 million and US$45927.3million during the first and second period, respectively.
Table 1. Growth Rates of Selected Macroeconomic Variables (2001-2011)
year infl Yr Imr Exr Inr msr res(US$m) ds
2001 18.9 3.1 32.3 43.0 8.2 26.4 10646.6 5.8
2002 12.9 1.5 32.6 31.9 8.1 18.8 7566.806 2.8
2003 14.0 10.3 40.4 42.7 6.5 13.5 7415.087 2.7
2004 15.0 10.6 31.1 44.0 5.5 20.7 17256.54 2.2
2005 17.9 5.4 31.0 46.5 7.4 22.6 28632.05 9.0
5-year
average
15.7 6.2 33.5 41.6 7.1 20.4 14303.4 4.5
2006 8.2 6.2 27.7 42.9 7.2 36.4 42735.47 4.9
2007 5.4 6.4 25.9 41.0 6.7 64.2 51907.03 0.8
2008 11.6 6.0 31.2 42.8 3.5 52.5 53599.28 0.3
2009 11.5 7.0 29.7 35.0 5.1 14.4 45509.82 0.3
2010 13.7 8.0 29.9 35.2 11.1 9.3 35884.93 0.2
5-year
average
10.1 6.7 28.9 39.4 6.7 35.4 45927.3 1.3
2011 10.8 7.4 35.6 39.6 10.3175 13.6 0.2
Notes: infl: inflation; Yr: growth rate of real GDP; Imr: share of imports in GDP; Exr: share
of exports in GDP; Inr: Interest rate
Source: World Development Indicators, 2012
The relative competitive position of the Nigerian economy in the global dimension can be viewed through a comparative analysis with similar economies within and outside the African continent. The term “competition” should not be seen as a zero sum game such as competition among companies in the “battle” for the larger share of the market within an economy. Instead, it must be viewed by comparing the drivers and the facilitators of

Research in Applied Economics ISSN 1948-5433
2014, Vol. 6, No. 4
www.macrothink.org/rae 56
productivity improvement in similar other countries (Porter, 2008). In other words, nations compete in offering the most productive environment for business. Further, two factors can equally enhance competitiveness notably economic coordination among and economic integration with neighbouring countries.
In order to understand the relative competitiveness of the Nigerian economy, this paper refers to the Global Competitive Index (GCI), a composite index number, which is apparently the most comprehensive competitiveness index to date that measures the macroeconomic and microeconomic drivers of competitiveness among countries. In this respect, the GCI identifies nine pillars including: institutions (public and private); infrastructure; the macro-economic environment; health and primary education; higher education and training; goods market efficiency; labour market efficiency; financial market efficiency; technological readiness; market size; business sophistication; and innovation. According to Wikipedia (see: http://en.wikipedia.org/wiki/Competitiveness), competitiveness captures the awareness of both the limitations and challenges posed by global competition, at a time when effective government action is constrained by budgetary constraints and the private sector faces significant barriers to competing in domestic and international markets.
Monitoring the competitiveness ranking of an economy is a necessary ingredient in the process of policy formulation in modern small open economies. In this respect, this paper adopts the World Economic Forum (WEF) that publishes the Global Competitive Index (GCI), to place Nigeria among some comparable world economies. This index is made up of three components: the basic requirements (pillars 1-4); efficiency enhancers (pillars 5-10); and innovation and sophistication factors (pillars 11-12). Table 2 below shows the ranking of Nigeria among a total of 144 countries of the world. It also provides bases for comparing the Nigerian competitive position in relation to some intra-continental counterparts such as South Africa, Algeria and Egypt. When Nigeria is added to this group of countries they are given the acronym SANE. We also attempted a comparison of Nigeria’s competitive situation with key emerging market economies comprising: Brazil, Russia, India and China (BRIC).
Based on the GCI 2013 as shown in table 2, it could be seen that Nigeria takes 120th position in the overall ranking among 144 countries. Among its peer countries, that is, SANE and BRIC, it is the lowest. In relation to its peers, Nigeria ranks lowest in basic requirements at 136th position, 3rd from the bottom in efficiency enhancer and 4th from the rear in innovation and sophistication factors.
In particular, when the 3rd pillar (macroeconomic stability) is put into focus, Nigeria’s ranking stood at 46th position. On this factor, it is only the 4th best among the SANE and BRIC, but even ranks higher than U.K (115) and USA (117). On this score Egypt seems to be the worst of them all at 140th position followed closely by India at 110th, and South Africa at 95th position. Algeria came 3rd among the countries considered on this factor while it ranks 1st among the peer group (SANE) countries. In view of the macroeconomic difficulties adduced to in the preceding paragraph, it is surprising how Nigeria could have displaced U.K. and USA on the 3rd pillar. On a closer look at other pillars, it is evident that nowhere again has Nigeria’s ranking close to the aforementioned developed economies. This shows that
Research in Applied Economics ISSN 1948-5433
2014, Vol. 6, No. 4
www.macrothink.org/rae 57
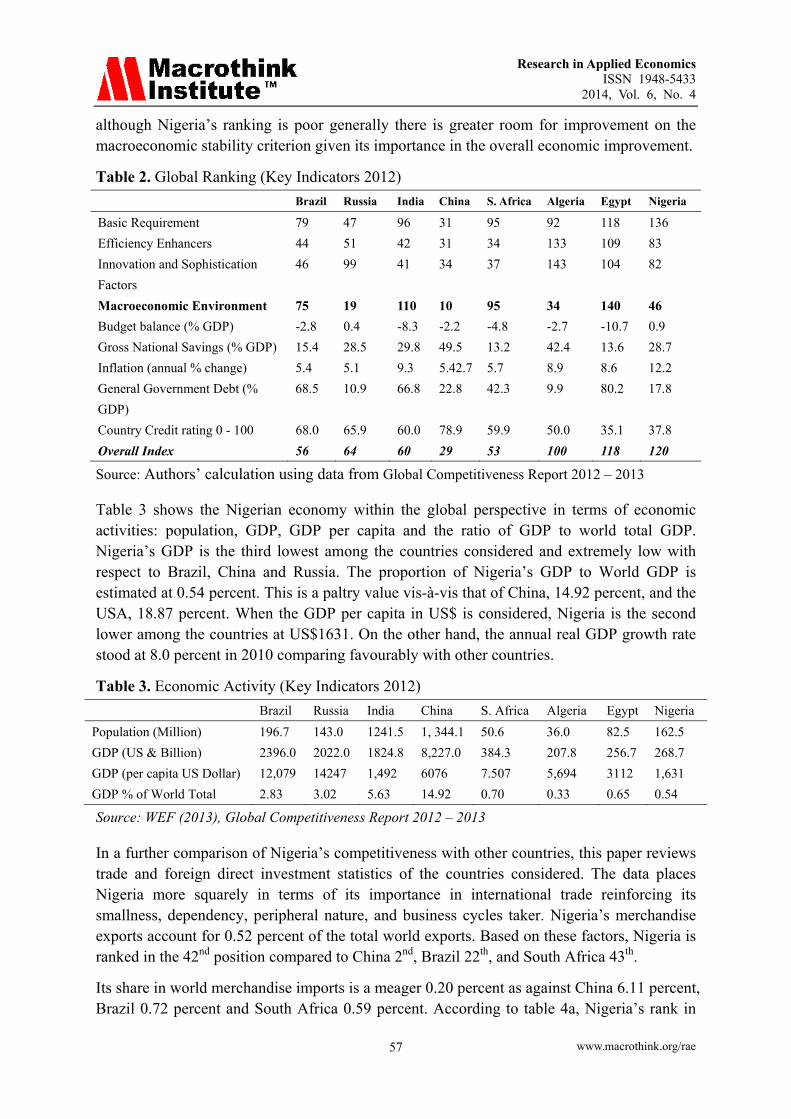
although Nigeria’s ranking is poor generally there is greater room for improvement on the macroeconomic stability criterion given its importance in the overall economic improvement.
Table 2. Global Ranking (Key Indicators 2012)
Brazil Russia India China S. Africa Algeria Egypt Nigeria
Basic Requirement 79 47 96 31 95 92 118 136
Efficiency Enhancers 44 51 42 31 34 133 109 83
Innovation and Sophistication
Factors
46 99 41 34 37 143 104 82
Macroeconomic Environment 75 19 110 10 95 34 140 46
Budget balance (% GDP) -2.8 0.4 -8.3 -2.2 -4.8 -2.7 -10.7 0.9
Gross National Savings (% GDP) 15.4 28.5 29.8 49.5 13.2 42.4 13.6 28.7
Inflation (annual % change) 5.4 5.1 9.3 5.42.7 5.7 8.9 8.6 12.2
General Government Debt (%
GDP)
68.5 10.9 66.8 22.8 42.3 9.9 80.2 17.8
Country Credit rating 0 - 100 68.0 65.9 60.0 78.9 59.9 50.0 35.1 37.8
Overall Index 56 64 60 29 53 100 118 120
Source: Authors’ calculation using data from Global Competitiveness Report 2012 – 2013
Table 3 shows the Nigerian economy within the global perspective in terms of economic activities: population, GDP, GDP per capita and the ratio of GDP to world total GDP. Nigeria’s GDP is the third lowest among the countries considered and extremely low with respect to Brazil, China and Russia. The proportion of Nigeria’s GDP to World GDP is estimated at 0.54 percent. This is a paltry value vis-à-vis that of China, 14.92 percent, and the USA, 18.87 percent. When the GDP per capita in US$ is considered, Nigeria is the second lower among the countries at US$1631. On the other hand, the annual real GDP growth rate stood at 8.0 percent in 2010 comparing favourably with other countries.
Table 3. Economic Activity (Key Indicators 2012)
Brazil Russia India China S. Africa Algeria Egypt Nigeria
Population (Million) 196.7 143.0 1241.5 1, 344.1 50.6 36.0 82.5 162.5
GDP (US & Billion) 2396.0 2022.0 1824.8 8,227.0 384.3 207.8 256.7 268.7
GDP (per capita US Dollar) 12,079 14247 1,492 6076 7.507 5,694 3112 1,631
GDP % of World Total 2.83 3.02 5.63 14.92 0.70 0.33 0.65 0.54
Source: WEF (2013), Global Competitiveness Report 2012 – 2013
In a further comparison of Nigeria’s competitiveness with other countries, this paper reviews trade and foreign direct investment statistics of the countries considered. The data places Nigeria more squarely in terms of its importance in international trade reinforcing its smallness, dependency, peripheral nature, and business cycles taker. Nigeria’s merchandise exports account for 0.52 percent of the total world exports. Based on these factors, Nigeria is ranked in the 42nd position compared to China 2nd, Brazil 22th, and South Africa 43th.
Its share in world merchandise imports is a meager 0.20 percent as against China 6.11 percent, Brazil 0.72 percent and South Africa 0.59 percent. According to table 4a, Nigeria’s rank in

Research in Applied Economics ISSN 1948-5433
2014, Vol. 6, No. 4
www.macrothink.org/rae 58
world imports was 53 behind China 2nd and South Africa 34nd. Imports are mainly raw materials, capital goods, and non-durable consumer items. Most of the imports are from the European Union, representing about 33 percent, while USA and China account for 15 percent and 7 percent respectively. Table 4 also shows that Nigeria is a marginal player in the flow of foreign direct investment. In 2005, FDI inflow to Nigeria was a paltry US$4978million and only 0.51 percent of the world total. Table 4b depicts the situation described above in 2010.
Table 4a. Nigeria Economy in the Global Context in 2005
Brazil Russia India China S. Africa Algeria Egypt Nigeria
Real GDP Growth 3.2 6.4 9.3 11.3 5.3 5.1 4.5 6.5
Trade to World Trade 0.92 1.79 1.13 6.67 0.57 0.31 0.14 0.36
Merchandise Export
Share in World Exports
Rank in World Exports
118529 243799 99620 761953 56261 46002 10652 55145
1.13 2.32 0.95 7.2 0.54 0.44 0.10 0.52
22 10 29 4 43 45 64 42
Merchandise import
Share in World imports
Rank in World imports
77628 137977 142842 660206 64192 20357 19816 21314
0.72 1.28 1.32 6.11 0.59 0.19 0.18 0.20
20 17 10 2 34 50 47 53
Services exports
Share in World exports
16048 24970 52527 74404 5046 2507 14643 1793
0.63 0.97 2.05 2.90 0.44 0.10 0.57 0.07
Services imports
Share in services imports
24356 38745 47287 83796 12125 4783 10508 6624
0.99 1.57 1.92 3.40 0.49 0.19 0.43 0.27
FDI (US$million)
%World FDI inflows
%LDCs FDI in flow
15066 12886 7622 72406 6647 1081 5376 4978
1.54 1.31 0.78 7.38 0.68 0.11 0.55 0.51
210 180 106 1009 93 15.1 75 69
Source: UNTAD Handbook of Statistics (2013)
Table 4b. Nigeria Economy in the Global Context in 2010
Brazil Russia India China S.
Africa
Algeria Egypt Nigeria
Real GDP Growth (%) 7.5 4.3 9.6 10.4 2.8 3.33 5.1 7.8
Trade to World Trade (%) 1.28 1.02 1.87 9.96 0.59 0.32 0.26 0.40
Merchandise Export
Share in World Exports (%)
201915 400420 226392 1578270 85700 57050 26437 77844
1.32 2.62 0.95 10.3 0.56 0.37 0.17 0.51
Merchandise import
Share in World imports
191537 273614 350098 1396200 96249 41000 52923 44129
1.24 1.77 2.27 9.05 0.62 0.27 0.34 0.29
Services exports
Share in World exports
31821 44981 123762 171203 14004 3566 23807 3081
0.83 1.17 3.23 4.46 0.37 0.10 0.62 0.08
Services imports
Share in services imports
62592 73682 116842 193321 18456 11906 14718 21332
1.70 2.0 3.17 5.25 0.50 0.32 0.40 0.58
FDI (US$ million)
%World FDI inflows
%LDCs FDI in flow
48507 43288 24159 114734 1228 2264 6386 6099
3.71 3.31 1.85 8.77 0.09 0.17 0.49 0.47
287 256.15 142.96 678.93 7.27 13.40 37.79 36.09
Source: UNTAD Handbook of Statistics (2013)
Research in Applied Economics ISSN 1948-5433
2014, Vol. 6, No. 4
www.macrothink.org/rae 59
3. A Brief Review of the Literature on Competiveness and Growth
An appropriate definition of competiveness is often elusive to conceive as the term itself is subject to many interpretations or even abuse in the literature. However, a number of definitions have been attempted in the literature. Martin et al. (2006) provide a framework that describes competitiveness as a firm’s capacity to compete, grow and be profitable. Competitiveness has also been defined in a broader sense as the inclination and skills to compete, to win and retain position in the market, to increase market share and profitability, and eventually to consolidate commercially successful activities (Filó, 2007). There is no doubt that the Filó definition of competitiveness is also very appropriate to the firm-level competition as it directly gives the impression of entities in a winner-loser relationship. However, its usefulness becomes highly debatable when applied to national economies. This is because competition between countries is largely regarded as potentially mutually beneficial, while competition between companies within the same industry is more often a zero sum game (Krugman, 1996). There is also the concept of regional competitiveness which according to Meyer-Stamer (2008) is the ability of a locality or region to generate high and rising incomes and improve livelihoods of the people living there. This definition is welfare oriented as it places an emphasis on the close link between competitiveness and prosperity for a people living within a specific region. The World Economic Forum (WEF) defines national competitiveness as the set of institutions, policies and factors that determine the level of productivity of a country (Schwab and Porter, 2007).
It regards productivity as what is required to set the sustainable level and path of prosperity that a country can achieve. This means that the level of income of country’s citizens will tend to grow with the level of competitiveness of the economy. Competitiveness of an economy is also closely associated with the rates of return to investment (a key driver of economic growth) in the economy. The more competitive an economy is, the more likely it is to grow faster over the medium to long term. The WEF definition of competitiveness is adopted as the working definition for this study. This is because it provides the links between the micro (firm-level) and macro (country-level) competitiveness.
A number of authors include the variables real exchange rate (RER), real effective exchange rate (REER) and export unit values (export prices) as measures of trade competitiveness based on relative prices and costs (see: Durand and Giorno 1987; Turner, Philip, and Jozef van‘t dack 1993; and Marsh and Tokarick 1994). These three measures are essentially measures of trade performance that capture prices or costs of the portions of the economy that are exposed to international competition, and they use a measure of exchange rates to convert prices or costs into a common currency. Moreover, the real exchange rate, as well as the real effective exchange rate (REER), are used as measures of the degree of misalignment of the currency which enhances or reduces international competitiveness of the affected economy.
The importance of international trade in economic growth cannot be over-emphasized. Interestingly, Ezeala-Harrison (1999) described international trade as the engine of economic growth and international competitiveness as the fuel that empowers that engine to run. Hatsopoulos, Krugman and Summers (1990), argues that competitiveness of economies

Research in Applied Economics ISSN 1948-5433
2014, Vol. 6, No. 4
www.macrothink.org/rae 60
translates into trade balance with rising living standard or real income. However, they contend also that export success can also be achieved at the cost of diminished real income, in which case does not reflect competitiveness. When export success is accompanied with a constant level of welfare gain then an economy will be said to be competitive.
A country’s market share of exports and their accompanying economic benefits can only be maintained if the required level of competitiveness is retained. Cas (1988) believes that export competitiveness of a country is closely associated with its trade performance. Rugman and D’Cruz, (1989) asserted that a country that suffers a loss in its export share or gets increased import penetration has become less competitive. Some authors have cautioned on the interpretation of the link between trade performance and export competitiveness which should never be misconstrued as this really does not exist, this is because both terms are equal at the country level. Markusen (1987) showed that such misconception resulted in large current account deficits in the U.S. during the 1980’s as it was interpreted as a loss of U.S. competitiveness, which was not so anyway. According to Ezeala-Harrison (1995), results that are in conflict with the definition of productivity are often generated by a notion of competitiveness that is based on the trade performance definition.
From the literature, it is clear that international competitiveness of an economy is vital for trade and may be seen as analogous to a country’s export performance. Moreover, the goal of every policy on trade competitiveness at the country level is to improve the wellbeing of the people.
4. Methodology
The seminal study of Sims (1980) set the basis for VAR analysis in econometrics. The standard VAR analysis makes it possible to direct both the relative meaning and the dynamic effect of various disturbances on macroeconomic variables, by describing how a set of time series data was generated by random innovations in variables of interest. A standard vector autoregression (VAR) model is equivalent to a reduced form model where no explanations of the instantaneous relationships among variables are provided. These instantaneous relationships are naturally hidden in the error structure, and are therefore left completely un-interpreted.
Cooley and Leroy (1985) criticized the standard VAR methodology because of its lack of theoretical meaning or identification system. They argued that Sims did not openly justify the identification restrictions and asserted that a model recognized by this arbitrary procedure cannot be interpreted as a structural model. This is because different variable arrangements are likely to generate different structural parameters. They suggested that improving the structural parameters from an estimation procedure would require some restrictions. The Cooley and Leroy’s critique of Sims work on VAR models has since triggered further research by macroeconomists whose main emphases have been on the issue of identifying restrictions.
Sims (1981, 1986), Bernanke (1986), and Shapiro and Watson (1988) put forward a new

Research in Applied Economics ISSN 1948-5433
2014, Vol. 6, No. 4
www.macrothink.org/rae 61
class of econometric models that is now known as structural vector autoregression (SVAR) or identified VAR. Instead of identifying the (autoregressive) coefficients, identification in SVAR focuses on the errors of the system, which are interpreted as (linear combinations of) exogenous shocks. In addition, the SVAR brings multiple time-series analysis and economic theory together and helps to determine the dynamic response of estimated variables to various shocks that take place within an economy. In view of the strengths of the SVAR model, the general model of SVAR as advanced by Amisano and Giannini (1997) is employed in this study.
We begin the model specification by considering a system of simultaneous equations implied in vector form as follows:
Where:
is a vector of endogenous variables,
is the constant term,
is a vector of lagged values of ,
is a vector of random error of the disturbance terms
B is the square matrix of dimension (n×n), containing the structural parameters of the contemporaneous endogenous variables,
A(L) is a matrix polynomial in the lag operator L of length p, and
M is the square matrix (n×n) dimension. M contains the contemporaneous response of the variables to the innovations.
The first stage of SVAR analysis is the estimation of the reduced form or the standard VAR.
As the coefficients in the matrices of equation (1) are unknown and the variables have
temporary effects on each other, the model in this form cannot be completely identified. But,
it may be transformed into a reduced-form model by multiplying both sides of the equation
by the inverse matrices of B, which brings about the standard VAR representation as:

Research in Applied Economics ISSN 1948-5433
2014, Vol. 6, No. 4
www.macrothink.org/rae 62
The error terms are linear combinations of the orthogonalized shocks ( ), such that each
individual error term is serially uncorrelated and has a zero mean and a constant variance.
Note that is different from the disturbance terms and the error terms in
are
correlated with each other. Hence, this raises a dilemma that bothers on the recovering of the underlying structural disturbances from the estimated VAR. In VAR analysis the only source
of variation of variables is indicated by a vector of white noise , usually called a vector
of innovations (Amisano and Giannini, 1997).
We adopt a methodological approach that is consistent with those used in most applied SVAR studies, that includes estimating: the reduced form model; the short-run SVAR models; the long-run effect; the impulse-response function (IRF); and the forecast error variance of decomposition (FEVD). The SVAR framework is generally focused on how the innovations to one endogenous variable affect other endogenous variables. Also SVAR analysis is focused on the direction of instant correlation between innovation variables. Having short-run or long-run restrictions in the model only depends on whether shocks are transitory or permanent. Hence, we examine both the short-run and long-run SVAR models.
4.2 Model Specification and Identification of Restrictions
The SVAR model adopted in this study is applicable to a developing small open-economy. This SVAR model is comprised of a system of three equations, depicting the relationship between the major indicators of international competitiveness and the growth of the Nigerian economy. These include: the growth rate of real output or GDP (grwt), the real effective exchange rate (reer), and export performance measured by the ratio of Nigerian export to world export (xpfm). Data for these variables covering the period 1980 – 2012 were sourced from the World Bank World Development Indicators, online. Although the sample period appears a short time span (due to constraint of data availability) for robust results, we proceeded with the analyses since 33 observations satisfy the statistical requirement of a large sample size
Equation (1) is called a structural VAR as it is assumed to be determined by some underlying economic theory. Thus the structural model of this study is described by the following dynamic system of simultaneous equations (3 - 5):

Research in Applied Economics ISSN 1948-5433
2014, Vol. 6, No. 4
www.macrothink.org/rae 63
The variables: are endogenous variables. The exogenous error
terms: are independently and identically distributed with mean
zero and a constant variance . The exogenous error terms may be interpreted as
structural innovations. The realization of each structural innovation is known as capturing unexpected shocks to its dependent variable respectively, which themselves are uncorrelated
with the other unexpected shocks (εt). In equations (3 – 5), the endogeneity of
is determined by the values of coefficients, b.
The model (3 – 5) can be re-written in matrix form as follows:
Where i=1,2,….,n.
The reduced form of the VAR model in equation (2) is to be estimated first. This model does not have the instantaneous endogenous variables and is shown in equations (6 – 8) as follows:

Research in Applied Economics ISSN 1948-5433
2014, Vol. 6, No. 4
www.macrothink.org/rae 64
The coefficients, a, of the lagged variables in the structural VAR model vary from the coefficients, d, of the lagged variables in the reduced form VAR model. Without imposing a number of restrictions, the parameters in the SVAR model (3 – 5) cannot be identified. These restrictions will allow for the contemporaneous interaction between international competitiveness variables and growth dynamics of the Nigerian economy.
To impose restrictions, we can use short run SVAR models where current values affect each other (contemporaneous effect), meaning such changes have no long lasting effect; or long run SVAR models where one variable has a long lasting effect in which case, such variable does not return to its initial level. For the short run model, restrictions have to be placed on the A and B matrix, where A matrix is the one for emphasis. The B matrix places restrictions on the error structure. In order to identify a shock to the global competitiveness of the Nigerian economy, only the short-run parameter restrictions are applied in this study. This is because shocks to the competitiveness variables included in this study tend to be temporary (in which case variables tend to return to their initial levels after a shock) rather than permanent (in which case variables do not return to their initial levels over time after a shock). This is evident in the orthogonalised/structural impulse response functions where the response of the variable growth to shocks to export performance and real effective exchange rate tends to die out quickly within five periods.
Depending on the imposed restrictions, three types of SVAR models can be distinguished:
A model: B is set to
(Minimum number of restrictions for identification is ).

Research in Applied Economics ISSN 1948-5433
2014, Vol. 6, No. 4
www.macrothink.org/rae 65
B model: A is set to
(Minimum number of restrictions to be imposed for identification is ).
AB model: restrictions can be placed on both matrices
(Minimum number of restrictions for identification is: ).
Given matrix A and matrix B, and.
We may proceed to impose restrictions on matrices A and B. As previously defined, are
the VAR residuals, and are the structural shocks. Based on relevant theoretical
expectations, we assume a recursive ordering scheme. Therefore, setting A to a lower triangular matrix, and B to a diagonal/identity matrix, corresponds to a Choleski decomposition. The resulting parameter restrictions for the short run SVAR model specified in equations (3 – 5) are:
VAR residuals structural shocks
This implies that the reer equation does not contain contemporaneous values of xpfm, or grwt. So real effective exchange rate is not contemporaneously affected by export performance or growth of real output. Similar explanations apply to the other equation.
Another way of considering equation (9a) is as follows:
The resulting parameter restrictions for the short run SVAR model specified in equations (3 – 5) become;
(10b)
The variable, reer in this case does not respond contemporaneously to structural shocks to xpfm, or grwt. Export performance (xpfm) responds contemporaneously to structural shocks to reer, itself but not to growth (grwt). In a similar vein, growth of real output (grwt) responds contemporaneously to structural shocks to reer, xpfm and itself.

Research in Applied Economics ISSN 1948-5433
2014, Vol. 6, No. 4
www.macrothink.org/rae 66
5. Estimation and Results
Five variables were originally included in the specified empirical models these variables included trade openness and rate of inflation as well as the three variables included in equations (3 – 5). However, trade openness and rate of inflation were later dropped because the reduced form model failed to perform well with the inclusion of these two variables. Specifically, the estimated reduced form model was plagued with autocorrelation and also failed the VAR stability test.
Estimations began with the determination of the time series properties of each variable included in our estimation model. The Augmented Dickey Fuller (ADF) test for unit root revealed that grwt, reer and xpfm were individually I(0). The unit root test result is presented in Table 5(a).
Table 5(a). Unit Root Test Results for Stationarity of Variables
Variable Test statistic ADF critical value Order of integration
Remark
1% 5% 10%
grwt -2.964 -3.716 -2.986 -2.624 I(0) Stationary at level xpefm -2.781 -3.709 -2.983 -2.623 I(0) Stationary at level reer -2.631 -3.709 -2.983 -2.623 I(0) Stationary at level Note: all series are each stationary at level only when the 10% ADF critical value is applied Source: Authors’ computation using STATA 11
The unit root test was followed by the selection of optimal lag length using different selection criteria. The lag order of the VAR model was determined using the Akaike (AIC) and Hannan–Quinn (HQIC) information criteria. The results which are summarized in Table 5(b) strongly favoured four lags based on the AIC, HQIC, and even the FPE criteria. In this case the lag order that minimizes the value of the information criterion is selected as the optimum lag length.
Table 5(b). Lag Selection-Order Criteria
Sample: 1984 - 2012 Number of Obs = 29 lag LL LR df P FPE AIC HQIC SBIC 0 -237.426 3189.29 16.5811 16.6254 16.7225 1 -195.644 83.564 9 0.000 334.267 14.3203 14.4975 14.886 2 -178.931 33.426 9 0.000 201.112 13.7883 14.0984 14.7785 3 -155.736 46.39 9 0.000 80.1707 12.8094 13.2524 14.2238*4 -141.089 29.294* 9 0.001 61.0624* 12.4199* 12.9958* 14.2587 Endogenous: reer xpfm grwt Exogenous: _cons Source: Authors’ computation using STATA 11
The underlying VAR model was then estimated and relevant tests to determine its suitability were conducted. The Lagrange-Multiplier (LM) Test result presented in Table 6 strongly

Research in Applied Economics ISSN 1948-5433
2014, Vol. 6, No. 4
www.macrothink.org/rae 67
rejected the null of autocorrelation. The underlying VAR also satisfied the stability condition as all the eigenvalues were within the unit circle.
Table 6. Lagrange-Multiplier Test
lag chi2 df Prob > chi2 1 7.0927 9 0.62747 2 4.7013 9 0.85953 3 5.7142 9 0.76815 4 11.2441 9 0.25935 H0: no autocorrelation at lag order Source: Authors’ computation using STATA 11
Results for the estimated B-model are presented in Table7 below. We employed the recursive Cholesky restriction to identify the non-zero parameters above the growth of real output (grwt) equation.
Table 7. Estimated Coefficients of the Short-Run Variables
REER XPFM GRWT REER 1 0 0 XPFM -0.00080679 (0.00027)* 1 0 GRWT 0.0407693
(0.010227)* -23.303568 (5.89507)* 1
Note: *indicates significant at one percent level Source: Authors’ computation using STATA 11
The variable REER is thought of in this study as being determined by some exogenous factors only, such as the international prices of crude oil that is determined externally by international market conditions, (crude oil is Nigeria’s major export commodity). In this case, response of REER to own shock is restricted to one. A look at other variables contained in the results shown in Table 7 suggest that given a positive shock to real effective exchange rate (a measure of international competitiveness), export performance will respond contemporaneously with a marginal but significant decline. This is surprising given that an increase in exchange rate is analogous to a depreciation of the domestic currency. There are two possible explanations here. First, in the short run, firms may not have enough time to adjust sufficiently in response to this positive real effective exchange rate shock hence the marginal decline in export performance is indicative of loss in export value. The second explanation is connected with the low capacity of the Nigerian economy to produce tradable goods that will be competitive in the international market. This possibility may severely hinder the ability of the economy to respond adequately to a positive exchange rate shock. Response of export performance to own shock is restricted to one.
The growth of real output (GRWT) variable contemporaneously responds in the same direction to a positive shock to real effective exchange rate (REER) or international competitiveness. This is expected as it suggests that a depreciation of the domestic currency
Research in Applied Economics ISSN 1948-5433
2014, Vol. 6, No. 4
www.macrothink.org/rae 68
immediately induces an expansion of real output within the Nigerian economy. It also suggests that there are no serious misalignment issues with the Nigerian currency. The growth of real output (GRWT) variable, in contrast, contemporaneously responds in the opposite direction to a positive shock to export performance (XPFM), another measure of international competitiveness. Surprisingly, this result` is unexpected. In view of the above findings, it will be useful to remark at this point that this study has provided mixed evidence in support of the argument that international competiveness of the Nigerian economy is growth inducing within the short run horizon. While the real effective exchange rate follows the path of theoretical predictions by inducing growth when there is a depreciation of the local currency, the short-run role of export performance in explaining growth of the Nigerian economy surprisingly does not follow the prediction of theory. Given that natural resources dominate the exports of the Nigerian economy, one may then curiously ask whether the explanation for this finding is hidden in the export composition of the Nigerian economy. One other important question to ask also is how consistent are these findings with most other related studies?
5.1 Structural Identification Scheme
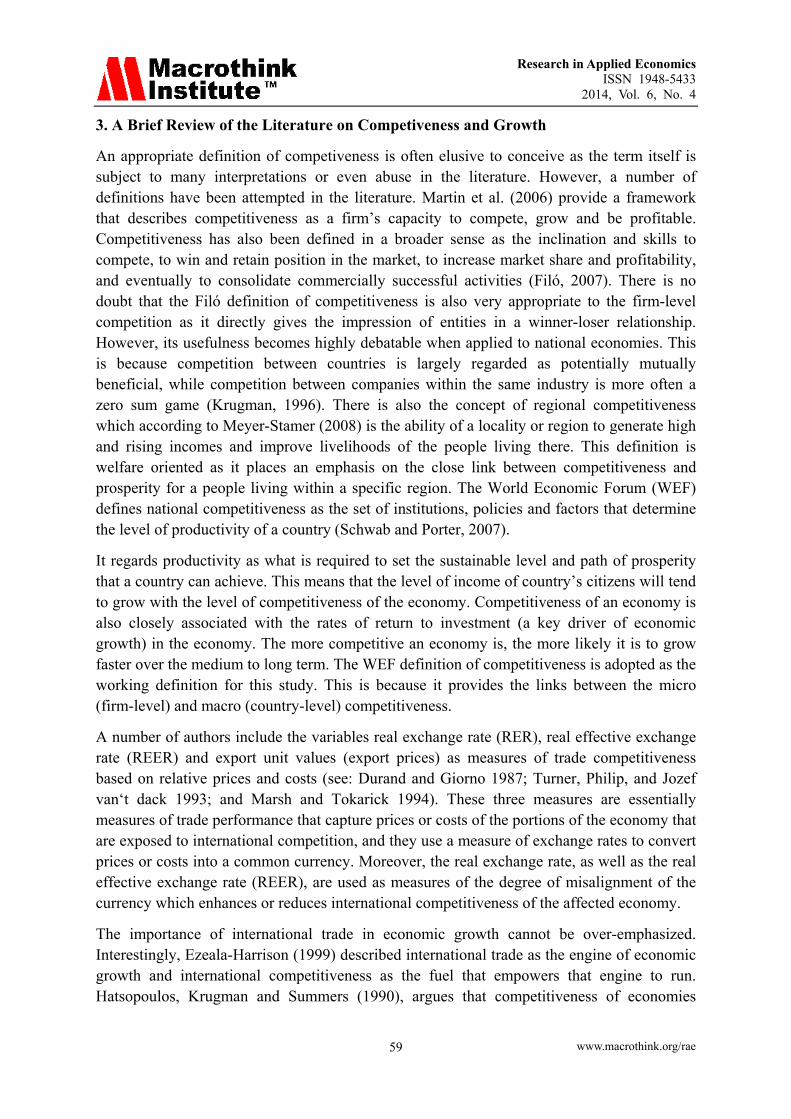
The impulse responses using the structural model specified in equations (3 – 5) are examined and discussed next. This is to further examine the dynamics of responses of each variable in the specified model to shocks to other variables over time. The IRFs in this case provide additional insights into the relationship between international competiveness of the Nigerian economy and real output growth. From figure 1, a shock to real effective exchange rate temporarily increases export performance. This positive response gradually declines until the fourth period when it hits its steady state value. Beyond period four, export performance falls below its steady state value and remains in the negative region until it dies out after period ten.
-.05
0
.05
.1
0 5 10 15
irf, reer, xpfm
95% CI for sirf 95% CI for oirf
structural irf orthogonalized irf
step
Graphs by irfname, impulse variable, and response variable
Figure 1. Response of export performance to a shock to real effective exchange rate, using structural and orthogonalised IRF

Research in Applied Economics ISSN 1948-5433
2014, Vol. 6, No. 4
www.macrothink.org/rae 69
The response of real output growth rate to a shock to real effective exchange rate is shown in figure 2. Real output growth rate initially responded negatively to a shock to real effective exchange rate but crossed its steady state value to the positive region in period two. Period three to eight saw real output growth rate return to the negative region before it finally disappeared around its steady state value. This result suggests that the future path of real output growth in Nigeria as a response to a positive shock to real effective exchange rate will remain similar to the contemporaneous results presented in Table 7 which is largely consistent with theoretical expectations.
-2
-1
0
1
2
0 5 10 15
irf, reer, grwt
95% CI for sirf 95% CI for oirf
structural irf orthogonalized irf
step
Graphs by irfname, impulse variable, and response variable
Figure 2. Response of real output growth rate to a shock to real effective exchange rate, using structural and orthogonalised IRF
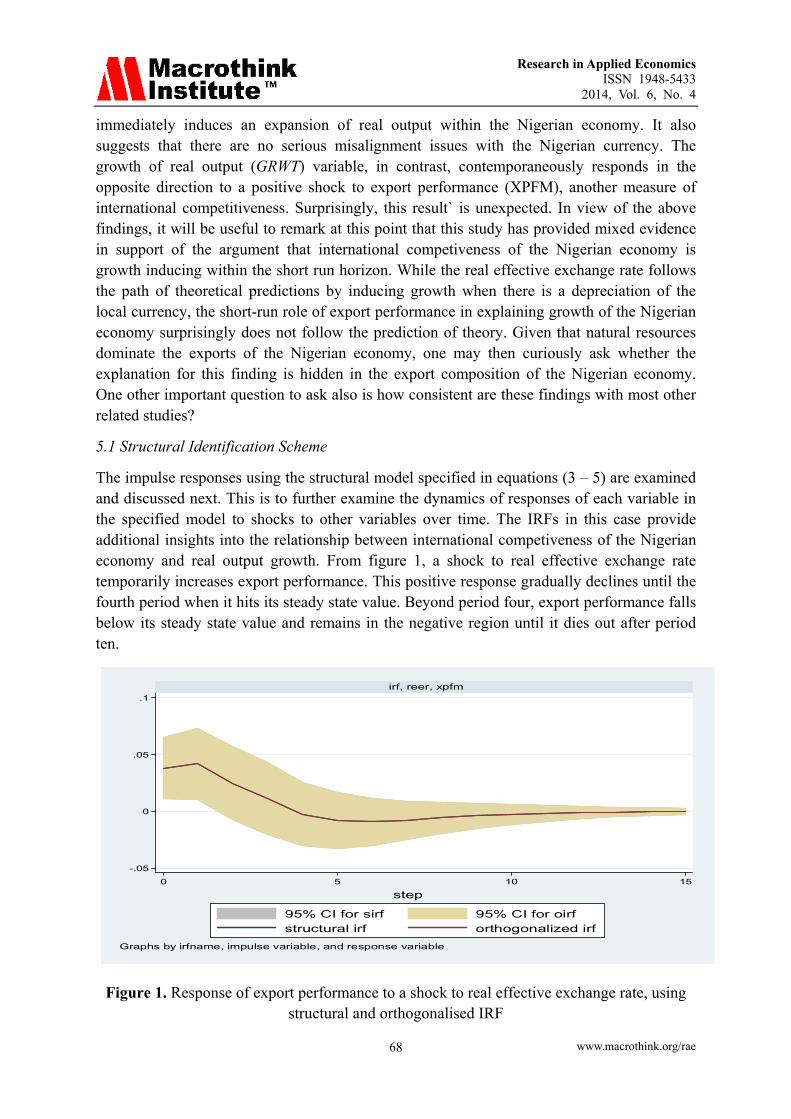
Response of real output growth rate to a shock to export performance also exhibited some transitory phenomenon as shown in figure 3. Real output growth rate responded positively to a positive shock to export performance in the first and third period following a shock to export performance. But this response crossed to the negative region in period four and remained there around its steady state value until the eight period when it began to die out.
Research in Applied Economics ISSN 1948-5433
2014, Vol. 6, No. 4
www.macrothink.org/rae 70
-1
0
1
2
3
0 5 10 15
irf, xpfm, grwt
95% CI for sirf 95% CI for oirf
structural irf orthogonalized irf
step
Graphs by irfname, impulse variable, and response variable
Figure 3. Response of real output growth rate to a shock to export performance, using
structural and orthogonalised IRF
When the above IRF results are compared with those of the structural parameters presented in Table 7, it immediately becomes clear that the estimates of the structural parameters are still subject to change over time. Real output growth will temporarily respond in line with theoretical predictions in the first few periods after a shock to export performance. This will however be short-lived as real output growth again falls into its negative region in the periods beyond the third. Therefore, the impulse response analyses are much more informative than those of the structural parameter estimates. Responses to own shocks by the three variables (reer, xpfm and grwt) exhibited transitory patterns similar to the ones presented above. These are however not reported here due to constraint of space but can be made available on request.
While the impulse response function allows a researcher to examine responses from a given variable induced by a shock to another or the same variable, the forecast error variance decomposition (FEVD) provides further evidence of interaction, by quantifying the contribution of the different shocks to the variance in the relevant variables on impact. In other words, the FEVD tells how much of a change in a variable is due to its own and other variables shocks. The results of the FEVD are presented in Table 8

Research in Applied Economics ISSN 1948-5433
2014, Vol. 6, No. 4
www.macrothink.org/rae 71
Table 8. Forecast Error Variance Decomposition
Period
FEVD (1) (2) (3) (4) (5) (6) (7) (8) (9)
1. 1 .216266 .112108 0 .783734 .297572 0 0 .590319
2. .948835 .296758 .105751 .000734 .703236 .412396 .050431 5.8e-06 .481853
3. .874394 .284774 .105044 .013131 .712457 .40661 .112475 .002769 .488346
4. .837295 .268613 .106724 .020874 .728479 .406764 .141831 .002908 .486512
5. .825245 .257369 .107805 .02084 .735951 .407522 .153915 .00668 .484673
6. .822606 .251391 .110614 .022712 .735859 .40704 .154682 .01275 .482346
(1) impulse = reer, and response = reer (2) impulse = reer, and response = xpfm (3) impulse = reer, and response = grwt (4) impulse = xpfm, and response = reer (5) impulse = xpfm, and response = xpfm (6) impulse = xpfm, and response = grwt (7) impulse = grwt, and response = reer (8) impulse = grwt, and response = xpfm (9) impulse = grwt, and response = grwt Source: Authors’ computation using STATA 11
The column labelled (2) shows forecast error variance decomposition of export performance for periods one to six with respect to real effective exchange rate shock. In period one of column (2) for instance, real effective exchange rate shocks explain about 29.68 percent of export performance variation on impact. In the column marked (3) for period one, a shock to real effective exchange rate triggered about 11.21 percent variation in growth rate of real output. These figures are indicative of a modest degree of interaction. In the column marked (6), a fairly more important degree of interaction can be observed with shocks to export performance accounting for about 26.76 percent and 41.24 percent of the variations in growth rate of real output in periods one and two respectively. It is important to first note here that although the variables in Table 8 relate to the same set of variables presented in Table 7, the FEVD results differ fundamentally from the estimates of the structural parameters in that FEVD results represent out–of–sample values. However, the relatively high degree of variation of the variable grwt in response to a shock to export performance requires some further comments. What this result suggests is that the present structure of exports from Nigeria will continue to induce less growth of the economy in subsequent periods. This raises some important questions on the quality of utilization of crude oil export proceeds by the Nigerian state.

Research in Applied Economics ISSN 1948-5433
2014, Vol. 6, No. 4
www.macrothink.org/rae 72
6. Concluding Remarks
The relationship between international competitiveness of the Nigerian economy and its growth dynamics have been analytically explored in this study using the structural VAR framework. The major findings that we consider both interesting and intriguing revealed some evidences of the existence of largely transitory relationships. Using export performance and real effective exchange rate as proxies for international competitiveness of the Nigerian economy, the study found that growth of real output contemporaneously responds in the same direction to a positive shock to real effective exchange rate. The growth of real output contemporaneously responds in the opposite direction to a positive shock to export performance. The study also found that a positive shock to real effective exchange rate instantaneously induces a marginal but significant negative response from export performance. The structural/orthogonalised impulse response analysis and the forecast error variance decomposition results were in many cases consistent with the short-run SVAR results suggesting that the structural estimates are sustainable over time. These also proved much more informative than the structural parameter estimates obtained from the short-run SVAR.
Apart from the growth – exports nexus, all the findings were individually consistent with theoretical expectations. The first possible explanation for the unexpected nature of results for the growth-export performance link is the dominance of crude oil in the export structure of the Nigerian economy. The second explanation may be indicative or strongly suggestive of poor utilization of export proceeds by the Nigerian state. These findings have implications for policy as follows; the current policy on foreign exchange may be continued as the study results have shown that there are no serious misalignment issues with the Nigerian currency. However, a policy of divestment from exports of primary products is required to make exports of the Nigerian economy more growth-oriented. There is also the need to pursue a policy that emphasizes real output growth in the utilization of revenue from crude oil exports. Such areas of emphasis should include massive investment in public infrastructure and other drivers of growth such as roads, energy, security, education and health.
References
Amisano, G., & Giannini, C., (1997). Topics in Structural VAR Econometrics(Second, revised and Enlarged Edition). Heidelberg: Springer, Berlin. http://dx.doi.org/10.1007/978-3-642-60623-6
Bernanke, B. (1986). Alternative Explanations of the Money-Income Correlation. Carnegie-Rochester Conference series on Public policy, 25, 49-100. http://dx.doi.org/10.1016/0167-2231(86)90037-0
Cas, A. (1988). Productivity growth and changes in the terms of trade in Canada” In. R. Feenstra (ed.), Empirical Methods for International Economics. Cambridge: MIT Press.
Central Bank of Nigeria (2008). The Monetary Policy Committee Report, No. 59. Retrieved

Research in Applied Economics ISSN 1948-5433
2014, Vol. 6, No. 4
www.macrothink.org/rae 73
from http://www.cenbank.org/.../2008/mpc/2059.pdf
Central Bank of Nigeria, CBN (2008). “The Monetary Policy Committee”, MPC Communique No 56, JUNE 2, 2008. Retrieved from http://www.cenbank.org/out/publications/communique/mpd/2008/mpc%20communique%20no%2056%20june%202%20press.pdf
Cooley, T., & Le Roy S. (1985). Atheoretical Macroeconomics: A critique. Journal of Monetary Economics, 283-308. http://dx.doi.org/10.1016/0304-3932(85)90038-8
Durand, M., & C. Giorno. (1987). Indicators of International Competitiveness: Conceptual Aspects and Evaluation. OECD Economic Studies, 9, 147-182.
Ezeala-Harrison, F. (1995). Canada’s global competitiveness challenge: Trade performances versus total factor productivity measures. The American Journal of Economics and Sociology. New York; January. http://dx.doi.org/10.1111/j.1536-7150.1995.tb02631.x
Ezeala-Harrison, F. (1999). Theory and policy of international competitiveness. London: Praeger.
Filó, C. (2007). Territorial Competitiveness and the Human Factors. International Conference of Territorial Intelligence, Huelva 2007 (CAENTI). Retrieved from http://www.territorial–intelligence.eu
Hatsopoulos, G. P., & Krugman, L. Summers. (1988). U.S. Competitiveness: Beyond the Trade Deficit. Science, 241, 299-307. http://dx.doi.org/10.1126/science.241.4863.299
Krugman, P. (1996) Making sense of the competitiveness debate. Oxford Review of Economic Policy, 12(3), 17-25. http://dx.doi.org/10.1093/oxrep/12.3.17
Markusen, J. R. (1987). Productivity, Competitiveness, Trade Performance, and Real Income. Ottowa: Economic Council of Canada for Minister of Supply and Services Canada.
Marsh, L.W., & S.P. Tokarick. (1994). “Competitiveness Indicators: A Theoretical and Empirical Assesssment”, IMF Working Paper No. 94/29, March.
Martin, R., Kitson, M., & P.Tyler. (2006). Regional Competitiveness. London: Routledge.
Meyer-Stamer, J. (2008). Systematic Competitiveness and Local Economic Development. In Shamin Bodhanya (ed.), Large Scale Systemic Change: Theories, Modelling and Practices. http://www.meyer-stamer.de/2008/Systemic+LED_SouthAfrica.pdf
Porter, M.E. (2008). The Five Competitive Forces That Shape Strategy. Harvard Business Review, January 2008, 79–93.
Rugman, A. M., & J. D’Cruz. (1989). Fast Forward: Improving Canada’s International Competitiveness. Toronto: Faculty of Management, University of Toronto.
Schwab, K., & Porter, M. E. (2007). The Global Competitiveness Report 2007-2008. World Economic Forum. Geneva, Switzerland.

Research in Applied Economics ISSN 1948-5433
2014, Vol. 6, No. 4
www.macrothink.org/rae 74
Shapiro, M., & Watson, M. W. (1988). Sources of business Cycle Fluctuations. NBER Macroeconomic Annual, MIT press, 3, 111-156.
Sims, C. A. (1981). An autoregressive index model for the U.S. 1948-1975, in J. Kmenta & J. B. Ramsey (eds.), Large-Scale Macro-Econometric Models, North-Holland, Amsterdam, pp. 283–327.
Sims, C. A. (1986). Are forecasting Models usable for Policy Analysis? Quarterly Review of the Federal Reserve Bank of Minneapolis, winter, 2-16.
Sims, C.A. (1980). Macroeconomics and reality. Econometrica, 48, 1-48. http://dx.doi.org/10.2307/1912017
Tashrifov, M. (2005). Monetary Policy Model of Tajikistan: A Structural Vector Autoregression Approach. Asia Pacific School of Economics and Government. Working Papers 05-9. The Australian National University
Turner, Philip, & Jozef van‘t dack. (1993). Measuring international price and cost competitiveness. BIS Economic Papers No. 39 (Basel: Bank for International Settlements).
World Economic Forum (2007), Global Risks Report. Retrieved from http://www.weforum.org/pdf/CSI/Global_Risks_2007.pdf
Copyright Disclaimer
Copyright for this article is retained by the author(s), with first publication rights granted to the journal.
This is an open-access article distributed under the terms and conditions of the Creative Commons Attribution license (http://creativecommons.org/licenses/by/3.0/).