international comparison of five institute systems · 2 international comparison of five institute...
TRANSCRIPT

International Comparison of Five Institute Systems

2 International Comparison of Five Institute Systems
>
International Comparison
of Five Institute Systems
Udgivet af:
Forsknings- og Innovationsstyrelsen
Forsknings- og Innovationsstyrelsen
Bredgade 40
1260 København K
Tlf: 35446200
Fax: 35446201
Publikationen kan hentes på www.fi.dk
ISBN (internet): 978-87-923-7278-9
Grafisk design: Formidabel
Øresund foto: Kriss Szkurlatowski

3 International Comparison of Five Institute Systems
>
International Comparison of Five Institute Systems
Tomas ÅströmMarie-Louise Eriksson
Lars NiklassonFaugert & Co Utvärdering AB
Erik ArnoldTechnopolis Ltd.
23 December 2008

4 International Comparison of Five Institute Systems
>
Summary 6
1. Introduction 9
1.1 Purpose 9
1.2 Scope 9
1.3 Methodology 9
1.4 The report 10
2. Five countries – five contexts 11
3. Business concept and strategy 17
4. Governance 18
5. Role in national innovation system 20
6. Financial performance 23
7. Capabilities 27
8. Dissemination and cooperation 28
8.1 The GTS System 28
8.2 The IRECO Group 29
8.3 The SINTEF Group 30
8.4 The Fraunhofer Society 31
8.5 TNO 32
9. Basic funding 33
9.1 The GTS System 33
9.2 The IRECO Group 33
9.3 The SINTEF Group 34
9.4 The Fraunhofer Society 34
9.5 TNO 35
9.6 Types of RTO funding 35
10. Discussion and conclusions 37
10.1 Context and role 37
10.2 Organisation and governance 38
10.3 Competence development 39
10.4 Competence exploitation 40
10.5 The case for basic funding 42
Appendix A. The GTS System 44
A.1. National business structure 44
A.2. Introduction 45
A.3. Role in National Innovation System 49
A.4. Economy 54
A.5. Capabilities 58
A.6. Knowledge dissemination 60
A.7. Appendix 63
Table of Contents

5 International Comparison of Five Institute Systems
>
Appendix B. The IRECO Group 68
B.1. National business structure 68
B.2. Introduction 71
B.3. Role in National Innovation System 78
B.4. Economy 80
B.5. Capabilities 84
B.6. Knowledge dissemination 86
Appendix C. The SINTEF Group 88
C.1. National business structure 88
C.2. Introduction 90
C.3. Role in National Innovation System 95
C.4. Economy 98
C.5. Capabilities 101
C.6. Knowledge dissemination 103
C.7. Appendix 105
Appendix D. The Fraunhofer-Gesellschaft 107
D.1. National business structure 107
D.2. Introduction 109
D.3. Role in National Innovation System 114
D.4. Economy 118
D.5. Capabilities 120
D.6. Knowledge dissemination 121
D.7. Appendix 123
Appendix E. TNO 125
E.1. National business structure 125
E.2. Introduction 127
E.3. Role in National Innovation System 131
E.4. Economy 134
E.5. Capabilities 137
E.6. Knowledge dissemination 138
E.7. Appendix 139
6 International Comparison of Five Institute Systems
>
Five institute systems, or research and technology organisations (RTOs), have been compared as part of an international evaluation of the Danish GTS System. The RTOs studied are Denmark’s GTS System, Norway’s SINTEF Group, Sweden’s IRECO Group, the Netherlands’ TNO and Germany’s Fraunhofer-Gesellschaft.
An initial comparison of national statistics reveals that the five national contexts are not dramatically different and that any difference in the share of SMEs is marginal. While GTS, SINTEF and TNO are responsible for significant proportions of the total R&D carried out in their respective nations, the Fraunhofer Society and IRECO carry a relative weight only a third of this trio. The R&D intensity (the proportion of non-commissioned R&D in total turnover) ranges from 43% for the Fraunhofer Society, via TNO, IRECO and SINTEF, to 17% for the GTS System. The basic government funding of the five RTOs ranges from 34% for TNO to 8% for SINTEF; the Scandinavians all have a basic funding level of 10±2%, whereas TNO and the Fraunhofer Society enjoy basic funding three times as high. While the international share of total turnover spans from 9% for the Fraunhofer Society, via SINTEF and IRECO, to 22% for TNO, the GTS System excels with 43%. The high levels of basic funding for the Fraunhofer Society and TNO may be seen as signs of these RTOs being accepted as strategically important in the respective national innovation system (NIS).
We find that the five RTOs’ business concepts, strategies and dissemination methods are quite similar and observe that considering what the RTOs are tasked with, it would be surprising if there were significant differences in these respects. All five RTOs profess to focus on SMEs and it appears as if their customer portfolios are dominated by SMEs, but they probably all have considerably larger turnover from large enterprises than from the more numerous SMEs.
It appears as if an RTO’s legal form in practice is of secondary importance, since the different forms appearing in this study do not seem to affect operations in any obvious way. In terms of ownership, the GTS institutes stand out due to the complete lack of common ownership. Moreover, the institutes have no thematic coherence and the individual institutes merely have a (minimum) quality level and performance contract funding in common, meaning that group coherence is weak and probably fragile. The other four RTOs have more or less unified structures with proper possibilities for owners (or equivalent) and management to exert control, meaning that the GTS System is the only RTO (of those studied) that remains scattered from ownership, management and strategic points of view. This is probably not to the GTS System’s advantage on an increasingly competitive global market, but the Danish GTS quality assurance system probably is. Regardless of legal form and organisational model, it is clear that governments effectively control RTOs with funding instruments, basic and other, meaning that the degree of formal government control in effect is of little importance. Although governments have good possibilities to manage the RTOs, they do not necessarily do so. To strategically manage an RTO, a strategy is required.
Summary

7 International Comparison of Five Institute Systems
>
Previous studies have unambiguously awarded RTOs an important role in the innovation system and found that there is no evidence to support the idea that universities can substitute for what RTOs do, nor do universities in practice supply the same services as RTOs. For an RTO to prosper and be able to supply qualified services, there is a strong need to continuously develop. However, performing in-house R&D is not the only way to renew and develop knowledge and competence. To this end, RTOs increasingly cooperate more closely with universities. Altogether, such cooperation – which is mutually beneficial – may result in significant invisible subsidies. Most of this cooperation, as well as most of an RTO’s competence development in general, takes place in national or international collaborative R&D projects. The technology “import” achieved through for example participation in the EU’s framework programmes (FP) may be particularly powerful and participation also builds networks and provides opportunities for benchmarking. However, in almost all cases, funding for R&D projects – whether national or international – does not pay the full costs of the work to be carried out. It is well known that RTOs decline to participate in for example FP projects, since they are unable to co-fund their participation. From a national technology acquisition point of view, this is obviously an undesirable situation.
An RTO’s competence development and exploitation cycle typically evolves through a series of steps, as illustrated by a three-stage model:Stage 1: Generation or acquisition of knowledge and competence.Stage 2: Cooperation with customers and partners in further developing and exploiting the knowledge in a precompetitive setting.Stage 3: Transferral of mature knowledge to customers on commercial terms.
In practice, stage 1 and stage 2 cannot be conducted on commercial terms and public funding is thus required. In theory, stage 3 ought to be pursuable on commercial terms, but in practice this holds reasonably true only when the customer is a large enterprise with both money and absorption capacity. When the potential customer is an SME, a public subsidy is most of the time an absolute necessity.
What in practice sets an RTO apart from a regular consultancy is the constant need for renewal of competence and capabilities as well as society’s expectation that it is to work with unprofitable customers. In practice, an RTO therefore needs at least two forms of basic funding, one more or less discretionary and one in response to societal and industry needs. Discretionary funding is required for strategic investments in knowledge and equipment independent of needs perceived by society and existing customers. The other type, strategically targeted funding, is for knowledge generation in fields of relevance to society and industry. Whether unconstrained or socially directed basic funding produces better RTOs remain an unanswered question, but there is clearly a need for a combination of the two. Fortunately, applied RTOs constantly receive signals from their customers and the research community that help them stay on track.

8 International Comparison of Five Institute Systems
>
A healthy, strong and for society and the NIS useful RTO requires sustained government commitment. While this translates into significant and sustainable funding, it does not necessarily require government ownership. However, it does require unambiguous rhetoric repeatedly stating the RTO’s critical role in the NIS; not at the expense of universities, but as a system-critical complement.

9 International Comparison of Five Institute Systems
>
1.1 PurposeAs part of an international evaluation of the Danish GTS System1, the Danish Ministry of Science, Technology and Innovation, through the Danish Agency for Science, Technology and Innovation, has commissioned a horizontal comparison of five research institute systems in five different countries. This report, which consists of a main report and five appended case studies, is one of three separate studies undertaken to support the work of an international expert panel in its evaluation of the GTS System.
1.2 ScopeFollowing initial discussions between the Agency and the consultant, the five research and technology organisations (RTOs) studied are:
The GTS System (Denmark)• The SINTEF Group (Norway)• The IRECO Group (Sweden)• The TNO (Netherlands)• The Fraunhofer-Gesellschaft (Germany) •
It should be noted that the purpose of the comparison is to assess differences between the systems as such, not between individual institutes within the systems or groups. The profiles of the individual institutes are therefore only briefly introduced in the case studies and are not delved into in the main report.
1.3 MethodologyThe five case studies on which this main report is based have essentially been compiled as desk-top studies of openly available documentation and web sites, including official statistical data on the host countries. In the course of the assignment, representatives of the RTOs have graciously assisted us with additional information in response to a multitude of contacts by telephone and e-mail. The various forms of information and data thus supplied have clearly improved the case studies and thus the entire report. Some information gaps nevertheless still remain where our requests for information for one reason or another have been unsuccessful. The case studies have been proofread by representatives of the respective RTO, in all cases but one by more than one individual. We are indeed grateful for the assistance kindly provided by the RTOs.
The case studies form the foundation for the elaborate horizontal analysis of the five RTOs presented in this main report. While every effort has been made to make fair and correct horizontal comparisons, it is inevitable that we have not been 100% successful in this endeavour; where we are aware of such flaws that we have been unable to eliminate they are noted in the report, but it is possible that additional imperfections have slipped through.
1 ”Udkast til Kommissorium for international evaluering af GTS”, 13 June, 2008.
1 Introduction

10 International Comparison of Five Institute Systems
>
1.4 The reportThis main report commences with a basic comparison of the national contexts in which the five RTOs operate. Following on this national comparison are several chapters wherein the RTOs are horizontally compared, where possible quantitatively, but with only moderate discussion, most of which is saved for the analyses in Chapters 9 and 10. Appendix A - Appendix E contain the five case studies.
11 International Comparison of Five Institute Systems
>
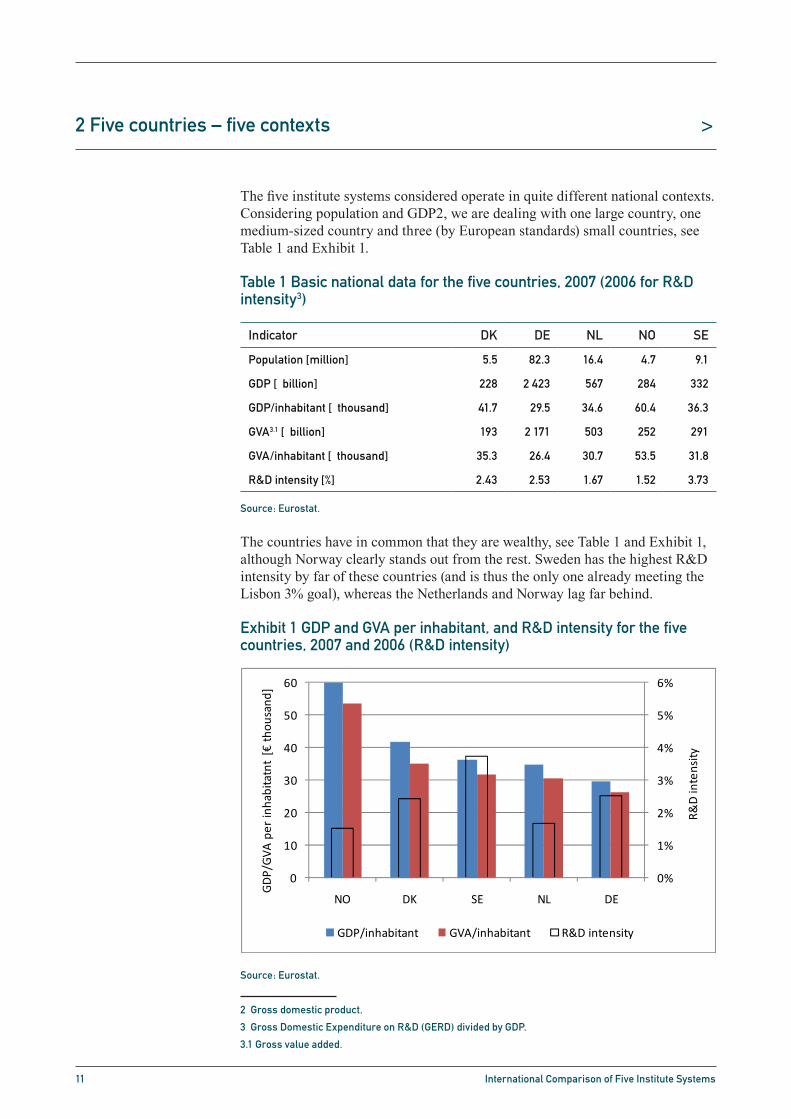
The five institute systems considered operate in quite different national contexts. Considering population and GDP2, we are dealing with one large country, one medium-sized country and three (by European standards) small countries, see Table 1 and Exhibit 1.
Table 1 Basic national data for the five countries, 2007 (2006 for R&D intensity3)
Source: Eurostat.
The countries have in common that they are wealthy, see Table 1 and Exhibit 1, although Norway clearly stands out from the rest. Sweden has the highest R&D intensity by far of these countries (and is thus the only one already meeting the Lisbon 3% goal), whereas the Netherlands and Norway lag far behind.
Exhibit 1 GDP and GVA per inhabitant, and R&D intensity for the five countries, 2007 and 2006 (R&D intensity)
Source: Eurostat.
2 Gross domestic product.
3 Gross Domestic Expenditure on R&D (GERD) divided by GDP.
3.1 Gross value added.
2 Five countries – five contexts
Indicator DK DE NL NO SE
Population [million] 5.5 82.3 16.4 4.7 9.1
GDP [€ billion] 228 2 423 567 284 332
GDP/inhabitant [€ thousand] 41.7 29.5 34.6 60.4 36.3
GVA3.1 [€ billion] 193 2 171 503 252 291
GVA/inhabitant [€ thousand] 35.3 26.4 30.7 53.5 31.8
R&D intensity [%] 2.43 2.53 1.67 1.52 3.73
International Comparison of Five Institute Systems 5
2. Five countries – five contexts
The five institute systems considered operate in quite different national contexts. Con-sidering population and GDP2, we are dealing with one large country, one medium-sized country and three (by European standards) small countries, see Table 1 and Ex-hibit 1.
Table 1 Basic national data for the five countries, 2007 (2006 for R&D inten-sity3). Source: Eurostat.
Indicator DK DE NL NO SE
Population [million] 5.5 82.3 16.4 4.7 9.1
GDP [€ billion] 228 2 423 567 284 332
GDP/inhabitant [€ thousand] 41.7 29.5 34.6 60.4 36.3
GVA4 [€ billion] 193 2 171 503 252 291
GVA/inhabitant [€ thousand] 35.3 26.4 30.7 53.5 31.8
R&D intensity [%] 2.43 2.53 1.67 1.52 3.73
The countries have in common that they are wealthy, see Table 1 and Exhibit 1, al-though Norway clearly stands out from the rest. Sweden has the highest R&D intensity by far of these countries (and is thus the only one already meeting the Lisbon 3% goal), whereas the Netherlands and Norway lag far behind.
Exhibit 1 GDP and GVA per inhabitant, and R&D intensity for the five coun-tries, 2007 and 2006 (R&D intensity). Source: Eurostat.
0%
1%
2%
3%
4%
5%
6%
0
10
20
30
40
50
60
NO DK SE NL DE
R&D intensity
GDP/GVA
per inhabitatnt [€
thou
sand
]
GDP/inhabitant GVA/inhabitant R&D intensity
2 Gross domestic product. 3 Gross Domestic Expenditure on R&D (GERD) divided by GDP. 4 Gross value added.

12 International Comparison of Five Institute Systems
>
The countries also – from a coarse perspective – have rather similar industry structures, see Exhibit 2.
Exhibit 2 Share of each county’s GVA stemming from the respective NACE branch groupings of Table 2, 2007.
Source: Eurostat.
Table 2 Descriptions of NACE codes used in Exhibit 2
Source: Eurostat.
International Comparison of Five Institute Systems 6
The countries also – from a coarse perspective – have rather similar industry struc-tures, see Exhibit 2.
Exhibit 2 Share of each county’s GVA stemming from the respective NACE branch groupings of Table 2, 2007. Source: Eurostat.
0
5
10
15
20
25
30
35
40
A‐B C‐E F G‐I J‐K I‐P
% of total
DK DE NL NO SE
Table 2 Descriptions of NACE codes used in Exhibit 2. Source: Eurostat.
NACE codes NACE description
A–B Agriculture, hunting, forestry and fishing
C–E Total industry (excluding construction)
F Construction
G–I Wholesale and retail trade, repair of motor vehicles, motorcycles andpersonal and household goods; hotels and restaurants; transport, storage and communication
J–K Financial intermediation; real estate, renting and business activities
L–P Public administration and defence, compulsory social security; edu-cation; health and social work; other community, social and personal service activities; private households with employed persons
Subdividing the total industry grouping in Exhibit 2, into sectors and focusing on the ones that dominate in the five countries, results in Exhibit 3. Considering the coun-tries one by one, a simplified analysis of the industrial structure yields:
Denmark: The food and electricity sectors are of major importance, followed by chemicals, machinery, and electrical and optical equipment. Fairly wide industry base (from a sectoral perspective)
Germany: The vehicles and chemicals sectors are of major importance, followed by electricity, electrical and optical equipment, machinery, metals and food. Wide industry base (from a sectoral perspective)
Netherlands: Very high dependency on the chemicals sector and to a lesser de-gree the food sector; other sectors of significantly lesser importance. Narrow in-dustry base (from a sectoral perspective)
NACE codes NACE description
A–B Agriculture, hunting, forestry and fishing
C–E Total industry (excluding construction)
F Construction
G–I Wholesale and retail trade, repair of motor vehicles, motorcycles and personal and household goods; hotels and restaurants; transport, storage and communication
J–K Financial intermediation; real estate, renting and business activities
L–P Public administration and defence, compulsory social security; education; health and social work; other community, social and personal service activities; private households with employed persons

13 International Comparison of Five Institute Systems
>
Subdividing the total industry grouping in Exhibit 2, into sectors and focusing on the ones that dominate in the five countries, results in Exhibit 3. Considering the countries one by one, a simplified analysis of the industrial structure yields:
Denmark: The food and electricity sectors are of major importance, • followed by chemicals, machinery, and electrical and optical equipment. Fairly wide industry base (from a sectoral perspective)Germany: The vehicles and chemicals sectors are of major importance, • followed by electricity, electrical and optical equipment, machinery, metals and food. Wide industry base (from a sectoral perspective)Netherlands: Very high dependency on the chemicals sector and to a lesser • degree the food sector; other sectors of significantly lesser importance. Narrow industry base (from a sectoral perspective)Norway: Extremely strong dependency on the oil and gas extraction sector • and to a lesser degree the food sector (mainly fish-related); other sectors of significantly lesser importance. Very narrow industry base (from a sectoral perspective)Sweden: The vehicles sector is of major importance, followed by metals, • machinery, electrical and optical equipment, electricity, chemicals and paper. Wide industry base (from a sectoral perspective)
• Exhibit 3 Share of industrial turnover for each country’s dominating sectors within mining, manufacturing and energy (NACE codes C–E in Exhibit 2).
See Table 3 for precise description of sectors. 2005 (or latest available year). Source: OECD.stat.
International Comparison of Five Institute Systems 7
Norway: Extremely strong dependency on the oil and gas extraction sector and to a lesser degree the food sector (mainly fish-related); other sectors of significantly lesser importance. Very narrow industry base (from a sectoral perspective)
Sweden: The vehicles sector is of major importance, followed by metals, machin-ery, electrical and optical equipment, electricity, chemicals and paper. Wide indus-try base (from a sectoral perspective)
Exhibit 3 Share of industrial turnover for each country’s dominating sectors within mining, manufacturing and energy (NACE codes C–E in Exhibit 2). See Table 3 for precise description of sectors. 2005 (or latest available year). Source: OECD.stat.
0%5%
10%15%20%25%30%35%40%45%
% of total
DK DE NL NO SE
Table 3 Descriptions of NACE codes used in Exhibit 3. Source: OECD.Stat.
Simplifiednotation
ISIC3code
Full description
Oil 10-12 Mining of Energy Materials
Food 15-16 Food products, beverages and tobacco
Paper 21-22 Paper, paper products, printing and publishing
Chemicals 23-25 Energy products, chemicals and plastic products
Metals 27-28 Basic metals and fabricated metal products
Machinery 29 Manuf. of machinery and equipment n.e.c.
Electr. & opt. 30-33 Electrical and optical equipment
Vehicles 34-35 Transport equipment
Electricity 40-41 Electricity, gas and water supply

14 International Comparison of Five Institute Systems
>
Table 3 Descriptions of NACE codes used in Exhibit 3
Source: OECD.Stat.
Looking at the countries’ enterprise demography, we note that the difference between shares of SMEs4 in each country’s total enterprise population is quite small, see Exhibit 4; Norway and Sweden have the highest shares of SMEs and Germany the lowest.
Exhibit 4 Share of enterprises (counts) with less than 250 employees, 2005
Source: OECD.Stat.
4 The OECD data list number of enterprises with less and more than 250 employees, meaning that only
one of several criteria in the Commission’s SME definition is fulfilled. NB: the data do not include agricul-
ture and fishing.
Simplified notation
ISIC3 code Full description
Oil 10-12 Mining of Energy Materials
Food 15-16 Food products, beverages and tobacco
Paper 21-22 Paper, paper products, printing and publishing
Chemicals 23-25 Energy products, chemicals and plastic products
Metals 27-28 Basic metals and fabricated metal products
Machinery 29 Manuf. of machinery and equipment n.e.c.
Electr. & opt. 30-33 Electrical and optical equipment
Vehicles 34-35 Transport equipment
Electricity 40-41 Electricity, gas and water supply
International Comparison of Five Institute Systems 8
Looking at the countries’ enterprise demography, we note that the difference between shares of SMEs5 in each country’s total enterprise population is quite small, see Ex-hibit 4; Norway and Sweden have the highest shares of SMEs and Germany the lowest.
Exhibit 4 Share of enterprises (counts) with less than 250 employees, 2005. Source: OECD.Stat.
99,0%
99,2%
99,4%
99,6%
99,8%
100,0%
NO SE NL DK DE
While Table 1 and Exhibit 1 stated each country’s R&D intensity (GERD/GDP), Exhibit 5 provides further clues as to how R&D is funded. The Exhibit shows that Sweden’s outstanding R&D intensity is contributed by industry and the government in an ap-proximate 3:1 proportion, while in Norway the proportion is 1:1. For Denmark, Ger-many and OECD as a whole, the proportion is roughly the same, 1:2. Data for the Netherlands are missing, but we know from Table 1 that its R&D intensity is 1.7%. Ex-hibit 6 further illustrates the large investments of Sweden, Denmark and to some ex-tent Norway in the university sector (HERD6), which is considerably higher than in Germany, EU-15 and OECD. Data for the Netherlands are unavailable also in this case. Such emphasis on the university sector may be seen as being at the expense of the in-stitute sector (among others; GOVERD7). Exhibit 7 shows that private investments in university R&D increases worldwide, but the trend is obviously the strongest in Ger-many, whereas industry in the Scandinavian countries, particularly Denmark, lag far behind in this respect.
5 The OECD data list number of enterprises with less and more than 250 employees, meaning that only one of several criteria in the Commission’s SME definition is fulfilled. NB: the data do not include agriculture and fishing.
6 Expenditure on R&D in the Higher Education Sector. 7 Government Intramural Expenditure on R&D.

15 International Comparison of Five Institute Systems
>
While Table 1 and Exhibit 1 stated each country’s R&D intensity (GERD/GDP), Exhibit 5 provides further clues as to how R&D is funded. The Exhibit shows that Sweden’s outstanding R&D intensity is contributed by industry and the government in an approximate 3:1 proportion, while in Norway the proportion is 1:1. For Denmark, Germany and OECD as a whole, the proportion is roughly the same, 1:2. Data for the Netherlands are missing, but we know from Table 1 that its R&D intensity is 1.7%. Exhibit 6 further illustrates the large investments of Sweden, Denmark and to some extent Norway in the university sector (HERD5), which is considerably higher than in Germany, EU-15 and OECD. Data for the Netherlands are unavailable also in this case. Such emphasis on the university sector may be seen as being at the expense of the institute sector (among others; GOVERD6). Exhibit 7 shows that private investments in university R&D increases worldwide, but the trend is obviously the strongest in Germany, whereas industry in the Scandinavian countries, particularly Denmark, lag far behind in this respect.
Exhibit 5 Relation between private and public research expenditure, 2005. No data available for the Netherlands
Source: OECD Main science and technology indicators 2007–1.
5 Expenditure on R&D in the Higher Education Sector.
6 Government Intramural Expenditure on R&D.
International Comparison of Five Institute Systems 9
Exhibit 5 Relation between private and public research expenditure, 2005. No data available for the Netherlands. Source: OECD Main science and technol-ogy indicators 2007–1.
0,0%
0,5%
1,0%
1,5%
2,0%
2,5%
3,0%
0,0% 0,2% 0,4% 0,6% 0,8% 1,0% 1,2%
BERD
/GDP
(HERD+GOVERD)/GDP
SE
DKDEOECD
NO
Exhibit 6 Relation between HERD and GOVERD, 2005. No data available for the Netherlands. Source: OECD Main science and technology indicators 2007–1.
0% 20% 40% 60% 80% 100%
OECD
EU‐15
SE
NO
NL
DE
DK
HERD GOVERD

16 International Comparison of Five Institute Systems
>
Exhibit 6 Relation between HERD and GOVERD, 2005. No data available for the Netherlands.
Source: OECD Main science and technology indicators 2007–1.
Exhibit 7 Share of HERD funded by industry
Source: OECD Main science and technology indicators 2007–1.
International Comparison of Five Institute Systems 9
Exhibit 5 Relation between private and public research expenditure, 2005. No data available for the Netherlands. Source: OECD Main science and technol-ogy indicators 2007–1.
0,0%
0,5%
1,0%
1,5%
2,0%
2,5%
3,0%
0,0% 0,2% 0,4% 0,6% 0,8% 1,0% 1,2%
BERD
/GDP
(HERD+GOVERD)/GDP
SE
DKDEOECD
NO
Exhibit 6 Relation between HERD and GOVERD, 2005. No data available for the Netherlands. Source: OECD Main science and technology indicators 2007–1.
0% 20% 40% 60% 80% 100%
OECD
EU‐15
SE
NO
NL
DE
DK
HERD GOVERD
International Comparison of Five Institute Systems 10
Exhibit 7 Share of HERD funded by industry. Source: OECD Main science and technology indicators 2007–1.
0% 2% 4% 6% 8% 10% 12% 14% 16%
DK
NO
SE
OECD
EU
NL
DE
2005 or latest available year 1981 or latest available year

17 International Comparison of Five Institute Systems
>
Although expressed in different ways, the five RTOs essentially have in common the business concept to provide knowledge-based support for the development of the activities of private and public customers and society as a whole. The RTOs’ services are to enhance the competitiveness of their customers and society through sustainable and environmentally conscious growth. The RTOs instrument in achieving this is to disseminate research-based applied knowledge to their customers and to help them implement this knowledge in their own operations. This knowledge may either be developed by the RTOs themselves or by other R&D providers. From an innovation-systems perspective, the institute systems all place themselves in-between the university sector and industry and they tend to market themselves as intermediaries, interpreters or “bridge builders” between the two “sides”.
Also the RTOs’ strategies vary in wording, emphasis and structure, but they all boil down to a number of common focus areas, including:
Customers: Close and lasting relations with customers, including public • ones, are sought, in some cases through membership programmes; SMEs are said to be the main focus and often are in terms of number of customers, but large enterprises dominate private turnoverScience: Services are based on research, development and innovation • activities; strategic partnerships with other knowledge providers and in particular with universities are soughtGlobalisation: Ever-fiercer competition among the RTOs’ customers • and in-between the increasingly globalised RTOs themselves require continuously enhanced international competitivenessSustainability: The society as a whole is to benefit, meaning that • environmental concerns receive high attention from both the RTOs’ customers and by RTOs themselvesEmployees: The human capital is an RTO’s most important asset and • therefore needs to be carefully nurtured, both to keep the personnel content and to ensure that its competence is continuously developed so that it stays abreast with international developments and the RTO thus maintains its technical and scientific competitivenessIndependence and impartiality: Two important, often crucial, qualities for • many customers, particularly when it comes to testing and certification
3 Business concept and strategy

18 International Comparison of Five Institute Systems
>
To a significant degree, the governance models employed depend on historical developments. The Fraunhofer Society, TNO and SINTEF are more than half a century old and have for the greater part grown organically (although there have been acquisitions and mergers as well). While the decentralised Fraunhofer Society consists of a large number of quite independent institutes in Germany and worldwide, TNO and SINTEF are more unified (and much smaller) organisations (although they both have a history of being more decentralised than they currently are). Historical developments in Denmark and Sweden have been quite different and have resulted in a plethora of different research institutes that the respective governments have attempted to structure, partly through Darwinian starvation. In Denmark, this process started already in the 1970s through the 1973 Act on technological service that introduced the GTS certification procedure. This procedure ensures that the institutes in the GTS Group share a common (minimum) level of quality, but thematic Group coherence is absent and there is no common ownership of the institutes. In Sweden, the IRECO holding company was set up in 1997, but it then had a diffuse role and a limited mandate. Restructuring picked up pace in the beginning of the 2000s, starting with a starvation phase followed by an attempt to include the majority of the surviving institute-like organisations into the Group. The IRECO Group now has a two-tiered structure aiming to create thematically coherent “sub-Groups”, but there is no common quality criterion, meaning that standards and operations vary. Given that most institutes are so far minority owned by IRECO, Group-level management is weak. It deserves to be mentioned that restructuring of the Swedish institute sector is far from completed and that the research and innovation bill presented on 23 October 2008 proposes that IRECO should get additional clout in restructuring the nation’s institute sector.
As an eingetragener Verein (“registered association”), the Fraunhofer Society is – just like TNO – a non-profit association. In contrast, IRECO and SINTEF, including their subsidiaries, are technically limited and thus tax-paying companies, although they reinvest their entire profits (less tax) in their own operations. The GTS institutes are a mix of foundations and limited companies (that also reinvest their entire profits).
The degree of formal independence from government varies considerably, from the Fraunhofer Society’s full independence to TNO, the Management and Supervisory Boards of which are appointed by royal decree following recommendation by the government. SINTEF and several GTS institutes are partly or fully owned and/or controlled by state universities, while (indirect) government ownership of the individual IRECO institutes varies between 25 and 100%7. Two of the four IRECO sub-Groups are majority owned by membership organisations, mainly consisting of private enterprises. Although “industry” thus technically and collectively owns these sub-Groups, the membership organisations have proven to be weak owners unwilling and unable to shoulder full shareholder responsibilities.
7 The only “IRECO institute” that is fully government-owned is not yet formally part of the Group, but has
for several years been scheduled to become part of it and the IRECO case study and the data hereinafter
therefore take the liberty of including it in the Group already.
4 Governance

19 International Comparison of Five Institute Systems
>
Despite the differences in formal control between the five nations’ RTOs, the governments in practice exert control through their funding instruments and mainly through the basic funding instrument(s). As an example, Swedish institute restructuring has taken place without the government initially having any ownership share in most of the individual institutes (most were initially independent foundations that were not established by the government), despite the fact that the basic grant is quite low (see further Chapter 6) and at the time when restructuring started in earnest was even lower than it is today. The threat of losing this meagre source of funding was further augmented by a thinly disguised threat of being closed out of all forms of government funding, i.e. also the more important project funding, and this effectively put an end to any further serious thoughts of remaining outside of the IRECO Group. Similar arguments apply also in the other countries.
In terms of strategic direction, the individual institutes’ autonomy is significant, especially within the GTS and IRECO Groups as well as within the Fraunhofer Society. The main criteria in effect seem to be that you need to keep your customers happy and to make a small profit, but as long as you do, the subject of the services is of little relevance. Being rather unified organisations, the degree of freedom is likely somewhat lower within the units of TNO and SINTEF, but the aforementioned criteria surely apply also in these two RTOs.

20 International Comparison of Five Institute Systems
>
The RTOs typically have a number of roles in the national innovation system (NIS), including:
Mediator of knowledge: While the universities may produce excellent • research, industry often tends to consider it as being incomprehensible and not very useful. The RTOs thus have a role as mediator, or bridge builder, between universities and industry, both in terms of making university research “comprehensible” but also to make university researchers aware of industrial needsImporter of knowledge: In the open-innovation• 8 context, the importance of staying up to date with international developments rapidly increases. The RTOs involvement in international programmes, mainly the EU’s framework programmes, are powerful means of “importing” knowledge to enhance their services, as is of course following development in the open scientific literatureCreator of knowledge: To be credible knowledge resources as well as to • retain its qualified personnel, the RTOs also need to develop their own knowledge, i.e. to carry out in-house R&D – usually of more mission-oriented character than universities (although there are exceptions to this general rule)Supplier of knowledge: Arguably one of the most important differences • between universities and RTOs is that the latter offer customised and timely services in a consultancy-like manner. While universities need to consider the educational commitments to graduate students, RTOs have a greater freedom, indeed are required, to act businesslike. Given that most RTO employees are not graduate students and personnel turnover thus is considerable lower than at a university, the RTOs also have a much better possibility to maintain continuity in knowledge and expertise. While the RTOs’ customers mainly are private and public enterprises, also agencies, ministries etc. are customers who for example buy advisory servicesInfrastructure provider: With a wide customer base, RTOs may possess • and maintain equipment that is too costly to acquire for many enterprises. Customers may thus access such equipment through purchase of services, and in some cases also through rental of equipmentIndependent and impartial testing and certification provider: Although • the RTOs sell their services to customers that then own the results, they also have a separate role as certification and testing providers, wherein they have to act as an independent and impartial body rather than a conventional consultancy
8 Henry W. Chesbrough, Open Innovation, Harvard Business School Press, Boston, MA, 2003.
5 Role in national innovation system

21 International Comparison of Five Institute Systems
>
While all five RTOs have a certain element of all these roles in their operations, the weighting between roles varies significantly, partly due to variations in the extent of basic funding and R&D intensity. Another important element in this context is of course the presence in the NIS of other providers of similar services. The RTOs compete both with commercial providers of “RTO-like” services and with universities, but the extent of such competition is highly contextually dependent, both in national and sectoral terms. In the case of GTS, the RTOs are explicitly forbidden to compete with private enterprises in the parts of their businesses that benefit from basic funding. In relation to universities, the RTOs complain that the playing field is not level, since some universities occasionally sell their services at marginal cost; this at least applies in Sweden. To a so far limited but increasing degree, the RTOs also compete with each other as their customers source services on a global marketplace.
The weight each RTO carries in its respective national marketplace vary considerably. Exhibit 8 attempts to provide a measure of each RTO’s relative importance in the NIS. At the one extreme, GTS, SINTEF and TNO are responsible for significant proportions of the R&D in their respective nations, while the Fraunhofer Society and IRECO carry a weight only a third of the aforementioned trio. The Exhibit also illustrates that most RTOs’ relative roles have been rather stable over the period studied; IRECO’s apparent increase is due to the acquisition of additional institutes, not to organic growth. In contrast, SINTEF’s relative importance is in slow decline, despite a rapidly increasing turnover; Norway’s GERD has grown even faster.
Exhibit 8 Share of RTO turnover in the respective nation’s GERD9. “FhG” denotes the Fraunhofer Society.
Source: Case studies10 and Eurostat.
9 Gross Domestic Expenditure on R&D.
10 The original sources are provided in the captions in the respective case studies; this also applies to
all subsequent references to “Source: Case studies”.
International Comparison of Five Institute Systems 15
in Sweden. To a so far limited but increasing degree, the RTOs also compete with each other as their customers source services on a global marketplace.
The weight each RTO carries in its respective national marketplace vary considerably. Exhibit 8 attempts to provide a measure of each RTO’s relative importance in the NIS. At the one extreme, GTS, SINTEF and TNO are responsible for significant proportions of the R&D in their respective nations, while the Fraunhofer Society and IRECO carry a weight only a third of the aforementioned trio. The Exhibit also illustrates that most RTOs’ relative roles have been rather stable over the period studied; IRECO’s apparent increase is due to the acquisition of additional institutes, not to organic growth. In contrast, SINTEF’s relative importance is in slow decline, despite a rapidly increasing turnover; Norway’s GERD has grown even faster.
Exhibit 8 Share of RTO turnover in the respective nation’s GERD10. “FhG” de-notes the Fraunhofer Society. Source: Case studies11 and Eurostat.
0%
1%
2%
3%
4%
5%
6%
7%
2003 2004 2005 2006
Share of RTO
turno
ver in GERD
GTS SINTEF IRECO FhG TNO
Exhibit 9 shows the RTOs’ relative weights in relation to domestic turnover (where the previous Exhibit used total turnover for normalisation). The only notable difference is that the GTS System’s relative importance is almost halved, since its international sales are so large, se further Chapter 6.
10 Gross Domestic Expenditure on R&D. 11 The original sources are provided in the captions in the respective case studies; this also ap-
plies to all subsequent references to “Source: Case studies”.

22 International Comparison of Five Institute Systems
>
Exhibit 9 shows the RTOs’ relative weights in relation to domestic turnover (where the previous Exhibit used total turnover for normalisation). The only notable difference is that the GTS System’s relative importance is almost halved, since its international sales are so large, se further Chapter 6.
Exhibit 9 Share of RTO national turnover in the respective nation’s GERD.
Source: Case studies and Eurostat.
International Comparison of Five Institute Systems 16
Exhibit 9 Share of RTO national turnover in the respective nation’s GERD. Source: Case studies and Eurostat.
0%
1%
2%
3%
4%
5%
6%
2003 2004 2005 2006Share of RTO
national turno
ver in GERD
GTS SINTEF IRECO FhG TNO

23 International Comparison of Five Institute Systems
>
To make the horizontal RTO comparisons as fair as possible, data are with one exception normalised. This one exception is Exhibit 10, the purpose of which is merely to provide a background on the significant differences in size between the five RTOs studied.
Exhibit 10 Total turnover, 2007.
Source: Case studies and OECD.Stat (exchange rate).
Although their legal forms vary, the RTOs are all in effect non-profit organisations. With the occasional exception, GTS, SINTEF, IRECO and TNO nevertheless all make a small profit (which is reinvested) in the period 2003–2007, see Exhibit 11.
Exhibit 11 Profit as share of turnover.
Source: Case studies.
International Comparison of Five Institute Systems 17
6. Financial performance
To make the horizontal RTO comparisons as fair as possible, data are with one excep-tion normalised. This one exception is Exhibit 10, the purpose of which is merely to provide a background on the significant differences in size between the five RTOs studied.
Exhibit 10 Total turnover, 2007. Source: Case studies and OECD.Stat (ex-change rate).
0
200
400
600
800
1 000
1 200
1 400
GTS SINTEF IRECO FhG TNO
€million
Although their legal forms vary, the RTOs are all in effect non-profit organisations. With the occasional exception, GTS, SINTEF, IRECO and TNO nevertheless all make a small profit (which is reinvested) in the period 2003–2007, see Exhibit 11.
Exhibit 11 Profit as share of turnover. Source: Case studies.
‐10%
‐8%
‐6%
‐4%
‐2%
0%
2%
4%
6%
8%
10%
12%
2003 2004 2005 2006 2007Profit/turnover
GTS SINTEF IRECO FhG TNO
6 Financial performance
24 International Comparison of Five Institute Systems
>
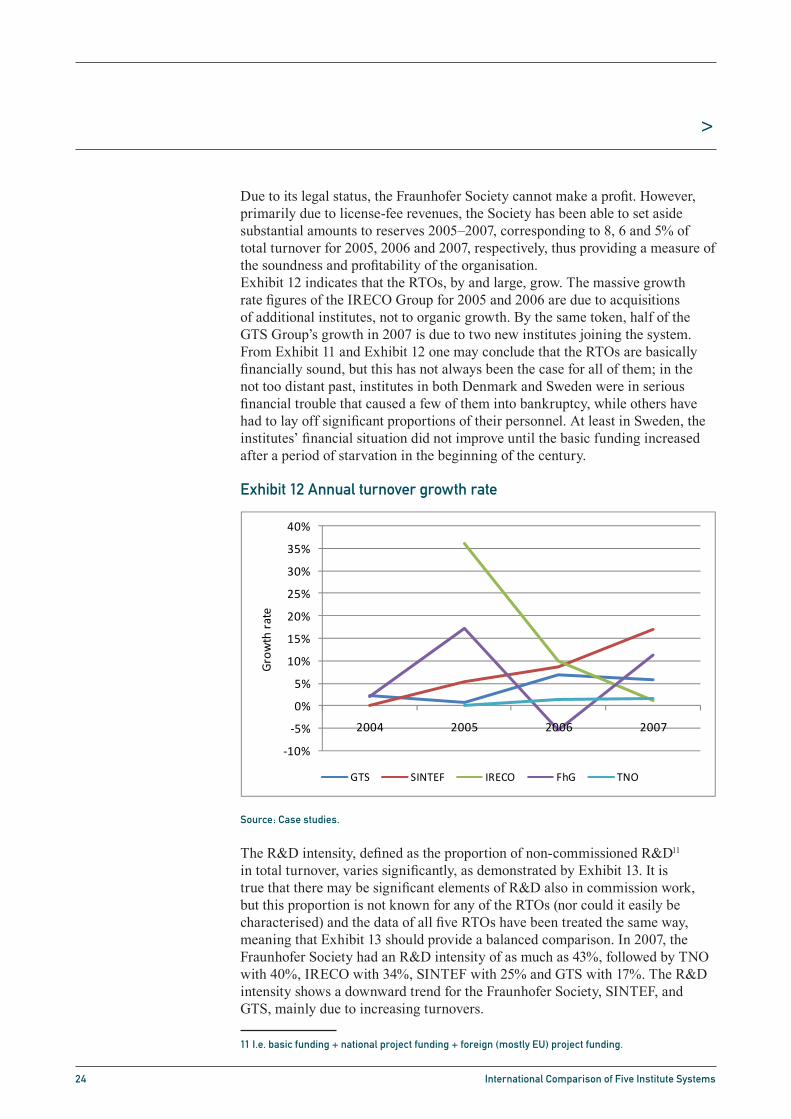
Due to its legal status, the Fraunhofer Society cannot make a profit. However, primarily due to license-fee revenues, the Society has been able to set aside substantial amounts to reserves 2005–2007, corresponding to 8, 6 and 5% of total turnover for 2005, 2006 and 2007, respectively, thus providing a measure of the soundness and profitability of the organisation.Exhibit 12 indicates that the RTOs, by and large, grow. The massive growth rate figures of the IRECO Group for 2005 and 2006 are due to acquisitions of additional institutes, not to organic growth. By the same token, half of the GTS Group’s growth in 2007 is due to two new institutes joining the system. From Exhibit 11 and Exhibit 12 one may conclude that the RTOs are basically financially sound, but this has not always been the case for all of them; in the not too distant past, institutes in both Denmark and Sweden were in serious financial trouble that caused a few of them into bankruptcy, while others have had to lay off significant proportions of their personnel. At least in Sweden, the institutes’ financial situation did not improve until the basic funding increased after a period of starvation in the beginning of the century.
Exhibit 12 Annual turnover growth rate
Source: Case studies.
The R&D intensity, defined as the proportion of non-commissioned R&D11 in total turnover, varies significantly, as demonstrated by Exhibit 13. It is true that there may be significant elements of R&D also in commission work, but this proportion is not known for any of the RTOs (nor could it easily be characterised) and the data of all five RTOs have been treated the same way, meaning that Exhibit 13 should provide a balanced comparison. In 2007, the Fraunhofer Society had an R&D intensity of as much as 43%, followed by TNO with 40%, IRECO with 34%, SINTEF with 25% and GTS with 17%. The R&D intensity shows a downward trend for the Fraunhofer Society, SINTEF, and GTS, mainly due to increasing turnovers.
11 I.e. basic funding + national project funding + foreign (mostly EU) project funding.
International Comparison of Five Institute Systems 18
Due to its legal status, the Fraunhofer Society cannot make a profit. However, primar-ily due to license-fee revenues, the Society has been able to set aside substantial amounts to reserves 2005–2007, corresponding to 8, 6 and 5% of total turnover for 2005, 2006 and 2007, respectively, thus providing a measure of the soundness and profitability of the organisation.
Exhibit 12 indicates that the RTOs, by and large, grow. The massive growth rate fig-ures of the IRECO Group for 2005 and 2006 are due to acquisitions of additional in-stitutes, not to organic growth. By the same token, half of the GTS Group’s growth in 2007 is due to two new institutes joining the system. From Exhibit 11 and Exhibit 12 one may conclude that the RTOs are basically financially sound, but this has not al-ways been the case for all of them; in the not too distant past, institutes in both Den-mark and Sweden were in serious financial trouble that caused a few of them into bankruptcy, while others have had to lay off significant proportions of their personnel. At least in Sweden, the institutes’ financial situation did not improve until the basic funding increased after a period of starvation in the beginning of the century.
Exhibit 12 Annual turnover growth rate. Source: Case studies.
‐10%
‐5%
0%
5%
10%
15%
20%
25%
30%
35%
40%
2004 2005 2006 2007
Growth rate
GTS SINTEF IRECO FhG TNO
The R&D intensity, defined as the proportion of non-commissioned R&D12 in total turnover, varies significantly, as demonstrated by Exhibit 13. It is true that there may be significant elements of R&D also in commission work, but this proportion is not known for any of the RTOs (nor could it easily be characterised) and the data of all five RTOs have been treated the same way, meaning that Exhibit 13 should provide a bal-anced comparison. In 2007, the Fraunhofer Society had an R&D intensity of as much as 43%, followed by TNO with 40%, IRECO with 34%, SINTEF with 25% and GTS with 17%. The R&D intensity shows a downward trend for the Fraunhofer Society, SINTEF, and GTS, mainly due to increasing turnovers.
12 I.e. basic funding + national project funding + foreign (mostly EU) project funding.

25 International Comparison of Five Institute Systems
>
Exhibit 13 R&D intensity
Source: Case studies.
Exhibit 14 reveals that at 34% in 2007, TNO had the highest level of basic funding, followed by the Fraunhofer Society at 29%; both with overall negative gradients. The Scandinavian RTOs have only about a third as high basic funding; in 2007, IRECO had 11%, GTS 10% and SINTEF 8%. It is of course possible to turn the argument around and commend SINTEF, GTS and IRECO for managing to maintain such a high level of commercial turnover despite fairly low R&D intensities and very low levels of basic funding.
Exhibit 14 Share of basic funding in total turnover.
Source: Case studies.
International Comparison of Five Institute Systems 19
Exhibit 13 R&D intensity. Source: Case studies.
0%
5%
10%
15%
20%
25%
30%
35%
40%
45%
50%
2003 2004 2005 2006 2007
R&D intensity
GTS SINTEF IRECO FhG TNO
Exhibit 14 reveals that at 34% in 2007, TNO had the highest level of basic funding, followed by the Fraunhofer Society at 29%; both with overall negative gradients. The Scandinavian RTOs have only about a third as high basic funding; in 2007, IRECO had 11%, GTS 10% and SINTEF 8%. It is of course possible to turn the argument around and commend SINTEF, GTS and IRECO for managing to maintain such a high level of commercial turnover despite fairly low R&D intensities and very low levels of basic funding.
Exhibit 14 Share of basic funding in total turnover. Source: Case studies.
0%
5%
10%
15%
20%
25%
30%
35%
40%
2003 2004 2005 2006 2007
Basic fund
ing/turnover
GTS SINTEF IRECO FhG TNO
Exhibit 15 shows the international proportion in turnover. The international propor-tion includes both commercial turnover and project grants. At a massive 43% (2007) and still rising (at an average annual increase of 4.7% since 2003), the GTS institutes are in a class of their own. In 2007, TNO’s international sales were 22%, IRECO’s 19%, SINTEF 14% and the Fraunhofer Society 9%. While SINTEF’s international sales es-sentially remain constant, the Fraunhofer Society’s exports increase slowly. Interest-ingly, TNO’s 2007 Annual Report states that “TNO is among the most internationally oriented [RTOs]”.

26 International Comparison of Five Institute Systems
>
Exhibit 15 shows the international proportion in turnover. The international proportion includes both commercial turnover and project grants. At a massive 43% (2007) and still rising (at an average annual increase of 4.7% since 2003), the GTS institutes are in a class of their own. In 2007, TNO’s international sales were 22%, IRECO’s 19%, SINTEF 14% and the Fraunhofer Society 9%. While SINTEF’s international sales essentially remain constant, the Fraunhofer Society’s exports increase slowly. Interestingly, TNO’s 2007 Annual Report states that “TNO is among the most internationally oriented [RTOs]”.
Exhibit 15 Share of international sales in total turnover.
Source: Case studies.
The proportion international sales is of course partly dependent upon the size of the home market. One would thus expect GTS, SINTEF, IRECO and to some degree TNO to have large international sales, and as far we can ascertain from Exhibit 15, this holds true. The lower proportion for the Fraunhofer Society indirectly supports this argument, since its home market is an order of magnitude greater that for the Scandinavian RTOs and four times larger than TNO’s: its international sales thus realistically ought to be considerably lower. Since most customers first search nearby when looking for the type of services that RTOs offer, a high proportion international sales may be seen as a good indicator of international competitiveness. On the other hand, the Fraunhofer Society’s considerably lower international sales should not be taken as a sign of lower international competitiveness; by all accounts, the Fraunhofer Society is certainly international competitiveness. Another possible explanation for the high international sales of the GTS System is that its low level of basic funding actually may force them to entertain foreign customers to make ends meet.
International Comparison of Five Institute Systems 20
Exhibit 15 Share of international sales in total turnover. Source: Case studies.
0%
5%
10%
15%
20%
25%
30%
35%
40%
45%
2003 2004 2005 2006 2007
International sales/turno
ver
GTS SINTEF IRECO FhG TNO
The proportion international sales is of course partly dependent upon the size of the home market. One would thus expect GTS, SINTEF, IRECO and to some degree TNO to have large international sales, and as far we can ascertain from Exhibit 15, this holds true. The lower proportion for the Fraunhofer Society indirectly supports this argument, since its home market is an order of magnitude greater that for the Scandi-navian RTOs and four times larger than TNO’s: its international sales thus realistically ought to be considerably lower. Since most customers first search nearby when look-ing for the type of services that RTOs offer, a high proportion international sales may be seen as a good indicator of international competitiveness. On the other hand, the Fraunhofer Society’s considerably lower international sales should not be taken as a sign of lower international competitiveness; by all accounts, the Fraunhofer Society is certainly international competitiveness. Another possible explanation for the high in-ternational sales of the GTS System is that its low level of basic funding actually may force them to entertain foreign customers to make ends meet.

27 International Comparison of Five Institute Systems
>
At 28%, SINTEF boasts the highest share of doctorates by far, which is likely due to its symbiotic relation with NTNU (Norway’s leading engineering university). The 27% figure for IRECO is inflated by the fact that it co-reports doctorates and licentiates12, meaning that a comparable figure would be quite a bit lower, perhaps as much as half that shown in the Exhibit. Interestingly, the share of doctorates is considerably lower for GTS, but it shows a strongly increasing trend; +8% per annum between 2003 and 2007. Qualitative data on the educational background of the Fraunhofer Society’s and TNO’s personnel has not been made available. Data on the educational background of other personnel categories varies in categorisation to the extent that a horizontal comparison between RTOs is not possible.
Exhibit 16 Share of doctorates in total personnel.
Source: Case studies.
12 A licentiate degree is roughly equivalent to “half a doctorate” (assuming the starting point is a ma-
sters’ degree).
International Comparison of Five Institute Systems 21
7. Capabilities
At 28%, SINTEF boasts the highest share of doctorates by far, which is likely due to its symbiotic relation with NTNU (Norway’s leading engineering university). The 27% figure for IRECO is inflated by the fact that it co-reports doctorates and licentiates13,meaning that a comparable figure would be quite a bit lower, perhaps as much as half that shown in the Exhibit. Interestingly, the share of doctorates is considerably lower for GTS, but it shows a strongly increasing trend; +8% per annum between 2003 and 2007. Qualitative data on the educational background of the Fraunhofer Society’s and TNO’s personnel has not been made available. Data on the educational background of other personnel categories varies in categorisation to the extent that a horizontal com-parison between RTOs is not possible.
Exhibit 16 Share of doctorates in total personnel. Source: Case studies.
0%
5%
10%
15%
20%
25%
30%
2003 2004 2005 2006 2007
Share of doctorates in employee
s
GTS SINTEF IRECO FhG TNO
13 A licentiate degree is roughly equivalent to “half a doctorate” (assuming the starting point is a masters’ degree).
7 Capabilities

28 International Comparison of Five Institute Systems
>
The techniques used to maintain more or less intimate and continuous relationships with their customers and other R&D providers are quite similar for the five RTOs and are further discussed under separate headers below. Cooperation is closely related to dissemination, since the most effective means of dissemination is project-wise cooperation. Quantitative data on other forms of dissemination, such publications, patents and spin-offs are scantily available and where numbers are reported, it is typically done in a way that makes it difficult or impossible to make a fair horizontal comparison, for which reason we have abstained entirely from attempting to do so except for patent applications. Exhibit 17 thus shows that the number of patent applications per 1 000 employees varies greatly for the four RTOs that report such numbers. Such differences are unlikely to be due to differences in innovative capabilities and are more likely a sign of different policies on IPR issues; the huge increase for TNO’s in 2007 could possibly indicate such a shift. It is however noteworthy that the GTS System is much less prone to apply for patents than the other RTOs, which perhaps partly can be attributed to the lower R&D intensity and the lower educational level obvious from pervious Exhibits. Qualitative data on the number of patent applications of the Fraunhofer Society has not been made available.
Exhibit 17 Patent applications per 1 000 employees
Source: Case studies.
8.1 The GTS SystemDissemination of knowledge and information is an integral part of the services offered by the GTS institutes. Apart from these services, the GTS institutes are engaged in several other types of knowledge dissemination activities, including so-called “non-commercial” interaction with its customers. By paying a nominal membership fee, customers may participate in a range of activities, such as branch-specific networks, branch-specific and/or target-oriented newsletters,
8 Dissemination and cooperation
International Comparison of Five Institute Systems 22
8. Dissemination and cooperation
The techniques used to maintain more or less intimate and continuous relationships with their customers and other R&D providers are quite similar for the five RTOs and are further discussed under separate headers below. Cooperation is closely related to dissemination, since the most effective means of dissemination is project-wise coop-eration. Quantitative data on other forms of dissemination, such publications, patents and spin-offs are scantily available and where numbers are reported, it is typically done in a way that makes it difficult or impossible to make a fair horizontal compari-son, for which reason we have abstained entirely from attempting to do so except for patent applications. Exhibit 17 thus shows that the number of patent applications per 1 000 employees varies greatly for the four RTOs that report such numbers. Such dif-ferences are unlikely to be due to differences in innovative capabilities and are more likely a sign of different policies on IPR issues; the huge increase for TNO’s in 2007 could possibly indicate such a shift. It is however noteworthy that the GTS System is much less prone to apply for patents than the other RTOs, which perhaps partly can be attributed to the lower R&D intensity and the lower educational level obvious from pervious Exhibits. Qualitative data on the number of patent applications of the Fraun-hofer Society has not been made available.
Exhibit 17 Patent applications per 1 000 employees. Source: Case studies.
0
5
10
15
20
25
30
35
40
45
50
2003 2004 2005 2006 2007
Patent app
lications /10
00 employee
s
GTS SINTEF IRECO FhG TNO
8.1 The GTS System
Dissemination of knowledge and information is an integral part of the services offered by the GTS institutes. Apart from these services, the GTS institutes are engaged in sev-eral other types of knowledge dissemination activities, including so-called “non-commercial” interaction with its customers. By paying a nominal membership fee, cus-tomers may participate in a range of activities, such as branch-specific networks, branch-specific and/or target-oriented newsletters, establishment of branch- and product-specific homepages, non-scientific publications, meetings and “open-house” events, as well as professional and technical committees attached to the institutes.
Cooperation between GTS institutes and Danish universities and government research institutes is an important part of the GTS System’s assignment, since it is partly their task to constitute a bridge between academia and industry. In 2007, there were 312

29 International Comparison of Five Institute Systems
>
establishment of branch- and product-specific homepages, non-scientific publications, meetings and “open-house” events, as well as professional and technical committees attached to the institutes.
Cooperation between GTS institutes and Danish universities and government research institutes is an important part of the GTS System’s assignment, since it is partly their task to constitute a bridge between academia and industry. In 2007, there were 312 informal and 248 formal cooperation activities between the GTS institutes and the Danish universities. There are several forms of cooperation:
Cooperation through ownership• Formalised cooperation contracts, including exchange of employees, use • of laboratory facilities and supervision of studentsInnovation networks, which aim to enhance collaboration with industry • and universities and colleges. GTS institutes participate in 18 such networks and coordinate five Innovation consortia, wherein GTS institutes are knowledge mediators to • strengthen and increase the innovation pace in Danish industry
In terms of publications, the GTS System produces a modest output considering its R&D turnover and in recent years production of both scientific and conference papers has decreased. The decline should be seen in light of the decrease in R&D intensity (cf. Exhibit 13). Exhibit 17 indicates that in recent years, the production of patent applications has increased slowly, but remains at a very low level. Meanwhile, the number of licensing agreements increased with a factor of 15 between 2006 and 2007 due to one of the institutes experiencing a major breakthrough with one of their licences.
The number of spin-offs established by the GTS institutes themselves ranges from 1 to 3 per year, while the number of spin-offs that have received assistance in establishing themselves has been between 3 and 4 per year for the last four years.
8.2 The IRECO GroupThere are no central dissemination activities from the IRECO Group. Instead, it is each institute’s responsibility to communicate its services, competencies and results to its customers. Arguably the most important and effective means of dissemination and cooperation activities are the institutes’ membership programmes (that only some of the institutes have), wherein collaborative R&D and dissemination activities take place. The institutes also arrange open (and sometimes closed) courses, “open houses”, seminars, conferences and publish periodical newsletters. Some of the institutes also certify or audit their customers’ activities. Scientific papers and conference presentations are two other important instruments for dissemination, as is of course their websites, which still are the most active at the level of the individual institutes.

30 International Comparison of Five Institute Systems
>
Cooperation with universities is essential to the institutes. Thus, universities provide the institutes with knowledge both through participating in joint projects and by providing doctoral training. Institutes, on the other hand, are able to provide industry networks and to act as “focusing devices” that communicate areas of industrial problems and interest to universities. Powerful public instruments in university cooperation include institute excellence centres and EU projects. For institutes which pursue research of a more explorative character, the interaction with academia is naturally more important and often leads to shared personnel (graduate students, adjunct professors etc.). Furthermore, the institutes that are co-located with universities have generally developed strong ties with universities. In 2007, the IRECO institutes used 21% of their basic “competence grants” for university collaboration.
The production of publications remains rather stable over between 2005 and 2007. The same essentially holds true for patent applications (cf. Exhibit 17) and the relative level of patent applications is very high.
It appears as if spinning off knowledge to start new enterprises is not highly prioritised throughout the IRECO Group. The exception is SICT, one of four sub-Groups, which reports that since its establishment in 2004, it has contributed to the development of 30 new companies with a turnover of SEK800 million.
8.3 The SINTEF GroupSINTEF’s main dissemination activities are through project-wise collaboration with its customers and through scientific publications. Other dissemination activities include SINTEF’s web site and seminars. In addition, there is the popular scientific Gemini journal, which is published by NTNU in collaboration with SINTEF.
A significant characteristic of SINTEF is its close cooperation with NTNU. NTNU is represented in SINTEF’s governing bodies and SINTEF has its origins in the university. Collaboration takes place through sharing of employees, which means that SINTEF’s employees teach at NTNU and that NTNU personnel work on SINTEF projects. SINTEF and NTNU also use each other’s laboratories and instruments. In addition, there are regular management meetings and joint monitoring of research focus areas.
At the research group level, collaboration is manifested in Gemini centres, which aim to ensure strategic cooperation between scientific groups with parallel interests. The objective of these centres is to build critical mass and to enhance quality in order to develop internationally competitive research activities. There are 21 such centres, 18 of which have been established jointly with NTNU, two with the University of Oslo, and one with the St. Olav Hospital in Trondheim.
Changed reporting categories between annual reports make it difficult to draw any definite conclusions on trends, but production is very high and does not appear to vary significantly between years.

31 International Comparison of Five Institute Systems
>
Although SINTEF engages in commercialisation of knowledge through supporting start up of new enterprises, the institute’s main effort lies in supporting the development of existing enterprises.
8.4 The Fraunhofer SocietyContract research with industry is a main activity of the Fraunhofer Society. To introduce new firms to such cooperation, the Society arranges Technology Days tailored to each company’s needs. In the Pact for Research and Innovation, the Society has assumed the task of conceiving and implementing innovation clusters, the purpose of which is to pool the strengths of a region and activate them in solving demanding tasks. In addition to industry and universities, the networks include local non-university research institute. Through this initiative, the Society provides impetus for further development of regional centres of excellence, and supports the regions’ skills and expertise. Innovation clusters primarily serve as instruments to help develop existing strengths.
The Fraunhofer Society is setting up the Fraunhofer Technology Academy as an umbrella for its educational offerings. It includes seminars and certain programmes in collaboration with specific universities: Executive MBA für Technologiemanager, Master of Environmental Sciences, Master Online Bauphysik and Online Postgraduate Course Software For Embedded Systems). The Society is an important intermediary between universities and SMEs, where basic research is applied in projects for particular needs. Institute directors often have chairs at universities, which leads to a flow of research results and people from the universities to the Society. Of particular importance are the intimate ties with selected universities, which represent a key element in the integration of the Society in the scientific community as a whole.
The Fraunhofer Society is one of the most important patent applicants in Germany with patent applications relating to 650 inventions in 2007. It has more than 2 500 active granted patents. License-fee revenues were €94 million in 2007, much of which relates to the technologies for the audio format MP3, which is an innovation owned by the Society. A new patent strategy aims to build and exploit a market-oriented patent portfolio. Qualitative data on the number of publications of the Fraunhofer Society has not been made available.
The Fraunhofer Society actively encourages the formation of start-up companies as spin-offs from the institutes and by supporting cooperative ventures between spin-off companies and the institutes by a variety of means. The Fraunhofer Venture Group maintains a network of contacts to business consultants, certified public accountants and public and private venture capital firms, who are in a position to offer new companies targeted support during the early investment phase. The Venture Group supported 34 new spin-off projects in 2007. A total of eight companies have been created with the assistance of the Group. The Society holds equity investments in 65 companies. In 2007, assets worth €6 million were sold. The Society is in the process of setting up a private investment fund that will be able to offer professional investment management of venture capital for the launch and initial growth phases of start-up companies.

32 International Comparison of Five Institute Systems
>
8.5 TNOMany big companies are TNO partners. Within the open-innovation concept, TNO tries to have an even more strategic role. For SMEs, the Dutch system of innovation vouchers provide them with funding to buy services from for example TNO. A small business research program is set up to develop product concepts into commercial products. In 2007, 28 such product concepts were put on offer to SMEs.
Eight people from TNO are lecturers in the vocational school system, which provides professional education and supports innovation in SMEs. 58 employees held professorships.
Together with universities TNO has established some 30 knowledge centres to develop knowledge in selected fields. These knowledge centres function as innovation centres, where companies also participate.
The number of patents applications increased notably in 2007 (cf. Exhibit 17) and are at a high level. Qualitative data on the number of publications of TNO has not been made available.
TNO Companies have holdings in companies that are spin-offs from TNO; a majority share in about 50 companies and a minority share in 36 companies. Six new companies emerged in 2007, while the goal is to establish ten new start-ups per year.
33 International Comparison of Five Institute Systems
>
The government funding systems of the five RTOs are quite different and so is the resulting relative magnitude of the RTOs’ basic funding, which is summarised in Exhibit 14. The systems and principles for allocation of basic funding are elaborated upon in the following sections. It is noteworthy that the systems, with the exception of the Fraunhofer Society’s, are all being re-evaluated and/or are undergoing change.
9.1 The GTS SystemThe GTS institutes can apply for basic funding through performance contracts, which aim to enhance the institutes’ knowledge base and competencies in order to enable them to supply the latest technological knowledge to Danish enterprises. It is the Ministry of Science, Technology and Innovation that decides which institutes are to receive authorisation. To become authorised, an institute must fulfil certain requirements concerning its economic, organisational and professional conditions. Following a 2006 call, the Ministry accepted two out of 13 applicants as new GTS institutes. The GTS System involves three-year performance contracts that consider knowledge dissemination, SME services, impact on innovation in industry, cooperation with other R&D providers in Denmark and abroad, as well as contributions to the national technological infrastructure.
9.2 The IRECO GroupThe IRECO Group’s “competence grants” are awarded following a closed-call procedure, wherein the institutes’ applications are scored according to a number of criteria, including excellent industrially relevant capabilities, cooperation with universities, cooperation with SMEs, commercialisation, international activities and restructuring of the institute sector. 50% of funding is distributed in relation to fulfilment of these criteria and 50% in relation to each institute’s turnover, but the competence grant must remain between 4 and 11% of the institute’s turnover. An evaluation of the system showed that in reality the institutes’ turnover largely determines how much money they are granted since institutes with a high turnover also score well in the criteria. In addition to the competence grants, a few individual institutes receive other targeted basic funding; in 2007 the competence grants constituted 55% of total basic funding in 2006 and 70%13.
In the new Swedish funding scheme, “strategic competence development funding”, proposed in the recent Research and Innovation Bill, funding will mainly be allocated based on the institutes’ turnover and their ability to fulfil their own objectives. The proposition is that 70–90% of funding will be allocated according to turnover and their ability to fulfil their own objectives. Impact assessments will be conducted each year, with in-depth assessments every 5–6 years. Objectives will differ between the institutes as they are very heterogeneous. The remaining 10–30% of government funding will be allocated to specifically targeted programmes. A new holding company, that is to succeed IRECO, is to decide which targeted programmes to introduce.
13 The bulk of additional basic funding is for standardisation and research in experimental technologies
as well as in metrology and benefits one single institute.
9 Basic funding

34 International Comparison of Five Institute Systems
>
9.3 The SINTEF GroupThe basic funding of the SINTEF Group consists of an unconditional basic grant and grants from strategic institute programmes, where the latter is applied for in competition among Norwegian RTOs. It has been argued that the synergies with NTNU, e.g. that some NTNU employees work on applied research at SINTEF and SINTEF employees work on basic research in NTNU, means that SINTEF’s total basic funding in practice may be up to three times as high as that seen in the Group’s profit and loss accounts14.
There is a proposal for a new basic funding system for the Norwegian RTO sector. The new system has three parts, a basic grant that is a percentage of the previous year’s basic grant, an indicator-based basic grant (i.e. performance contract) and grants for strategic knowledge and competence projects. The indicator-based basic grant would be granted based on indicators of quality and relevance and would constitute incentives for long-term competence development. The institutes would themselves decide how the funding would be allocated. The strategic knowledge and competence projects would be granted in competition or in dialogue between institutes, ministries and RCN and would be used when RCN and ministries would want to ensure development of competencies within thematic areas not covered by the indicator-based grants, i.e. where they see a need of detailed and direct governing of the competence development of the institute in order to create a well-functioning commission market.
9.4 The Fraunhofer SocietyThe research contracts provide most of the funding for the institutes, often 70–80% of the annual budget. The rest is basic public funding, of which 90% is federal and 10% comes from the particular Land (state) wherein the institute is located. The funding arrangements are referred to as a Drittellösung, where a third each is provided by basic funding, public contracts and private contracts. The amount of basic funding is related to the amount of contract funding in a “pound-for-pound” model which rewards entrepreneurial behaviour; the more contracts, the more basic funding. The formula increases the percentage of basic funding with the level of industrial contracts, which means that the exact amounts differ among the institutes depending on the level of industrial contracts. The model can be described as a very open performance contract. It is a funding arrangement which makes the Fraunhofer Society highly dependent on the market, and contributes to its entrepreneurial inclinations.
14 Erik Arnold, Neil Brown, Annelie Eriksson, Tommy Jansson, Alessandro Muscio, Johanna Nählinder
and Rapela Zaman, “The Role of Industrial Research Institutes in the National Innovation System”, VIN-
NOVA, VA 2007:12, 2007.

35 International Comparison of Five Institute Systems
>
9.5 TNOThe relationship between TNO and the Dutch government is much of a planning arrangement. According to the Dutch government, programming of demand means that, based on consultations with several stakeholders, an inventory is made of the needs of all involved parties at TNO, which are ministries, enterprises but also societal organisations. As a result, long-term research programmes are introduced, with a duration ranging from four to ten years. Within these long-term programmes, procedures for interim evaluations and adjustments are included. In this way, it is possible to intervene and adjust the programme whenever necessary. Programming of demand also results in strategic planning for TNO for a period of four years. Funding for TNO is based on twelve themes, each of which is related to economic and social knowledge issues faced by its customers. Each theme has an active network of organisations and companies operating, with one ministry directing operations. After input from TNO, the Dutch government defines the themes, which may consist of one or more programmes. In addition, there is a knowledge-development programme crossing the theme boundaries. In 2007, almost all funding by the Dutch ministries was tied to specific themes. Only 13% of public funding was for knowledge development crossing theme boundaries.
9.6 Types of RTO fundingIn studying the five RTOs’ funding situations, we have identified six different types of RTO funding:
Unconditional basic funding1. Performance-related basic funding, either based on turnover, or fulfilment 2. of criteria, or a combinationStrategically targeted basic funding for RTOs, applied for in competition 3. with other RTOsStrategically targeted basic funding for RTOs, allocated by funding 4. agency (cf. TNO’s twelve themes)Expansion/restructuring basic funding5. Other public R&D funding, applied for in competition with other R&D 6. providers
Table 4 summarises some characteristics of these forms of funding and Table 5 attempts to illustrate the types of funding that applies for each of the five RTOs. Given our assignment’s limitations in scope and resources, we cannot be certain that this table should not contain additional Xs; an empty table cell consequently does not necessarily mean that there is no such funding component.

36 International Comparison of Five Institute Systems
>
Table 4 Characteristics of different types of institute funding
Table 5 The RTOs’ different types of funding. “X” denotes that such a funding component is present
Note that this is not a complete mapping
For the five RTOs studied, the dominating types of basic funding are performance-related and strategically targeted funding, both competitive and allocated. There seems to be a trend towards increased focus onto performance-related funding, which is likely related to an increased belief in the value of competition. Concurrently, there is among the funding agencies a desire to retain some influence over how funding is used, which is evidenced by the use of strategically targeted funding. In this respect, the Dutch system is at the extreme end of the control scale, while the Scandinavian systems allow for more bottom-up influence.
Type of funding Competitive component
Freedom in use of funding
1. Unconditional basic funding No Full
2. Performance-related basic funding Yes Full
3. Strategically targeted basic funding for RTOs, competitive
Yes Some
4. Strategically targeted basic funding for RTOs, allocated
No Limited
5. Expansion/restructuring basic funding Varies Some
6. Other public R&D funding Yes Some
Type of funding GTS IRECO SINTEF FhG TNO
1. Unconditional basic funding X X
2. Performance-related basic funding
X X X
3. Strategically targeted basic funding for RTOs, competitive
X X X
4. Strategically targeted basic funding for RTOs, allocated
X
5. Expansion/restructuring basic funding
X
6. Other public R&D funding X X X X X

37 International Comparison of Five Institute Systems
>
10.1 Context and roleIn Chapter 2 we found that the five national contexts are not dramatically different and that any difference in the share of SMEs is marginal. In Chapter 5, we noted that GTS, SINTEF and TNO are responsible for significant proportions of the total R&D in their respective nations, while the Fraunhofer Society and IRECO carry a weight only a third of this trio (cf. Exhibit 8). In Germany, this may partly be explained by the Fraunhofer Society being only one of several institute systems, while IRECO’s weak role is an acknowledged weakness in the NIS resulting from the “Swedish model”, which assumes that the university system is capable of satisfying all society’s and industry’s external R&D needs. The low weight for IRECO is to a degree also a result of Sweden’s considerably higher R&D expenditure than the other four nations, cf. Exhibit 1. Exhibit 6 also illustrate that Denmark and Sweden invest proportionally less in the RTO sector than in the university sector. The lower weight of the IRECO institutes in Sweden could conceivably also be due to a lower need from an industry that invests heavily in in-house R&D (cf. Exhibit 5). Although this is possible, it appears unlikely as the only explanation, considering that 20 enterprises account for close to 70% of BERD, meaning that a significant portion of the rest of the nation’s enterprises ought to have a need for externally sourced R&D services. It is inevitable that the relative importance of an RTO to some degree also is limited by the magnitude of basic funding, although there are strategies to partly circumvent such limitations, as further discussed in Section 10.5.
In Chapter 3 we noted that the five RTOs’ business concepts, strategies and dissemination methods are quite similar. This should not come as a surprise considering that they are all RTOs and have been selected because they are similar enough for a comparison to be relevant, and considering that the national contexts are also alike. Indeed, considering what the RTOs are tasked with, it would be surprising if their business concepts, strategies and dissemination methods were dramatically different. What does differ is the weighting between different roles in the respective NIS. To a large degree, such differences are due to market forces, i.e. issues of demand and competition, but the government of course has an influence on this through its funding instruments, e.g. in funding parallel RTO systems or subsidising SME services. Another important factor is the RTO’s historical origins. The high level of basic funding for the Fraunhofer Society and TNO may be seen as signs of these RTOs being accepted as strategically important in the respective NIS. In contrast, the erratic developments of the GTS System and the IRECO Group are likely due to limited or at least inconsistent interest from their governments, which in turn likely is partly responsible for their low levels of basic funding.
All five RTOs profess to focus on SMEs, but we lack consistent quantitative information on their customers. It is nevertheless clear that SMEs dominate the customer portfolios of the GTS System (88%), SINTEF (50–70%) and the Fraunhofer Society (>50%), and it is probably safe to assume that similar customer patterns apply also to the IRECO Group and TNO, considering that they explicitly target SMEs as customers. For the one RTO that publishes quantitative customer data, we learn that the GTS System’s customers encompass approximately 30 000 Danish businesses and institutions, 88% of which are SMEs. This means that around 9% of all Danish enterprises
10 Discussion and conclusions

38 International Comparison of Five Institute Systems
>
are customers of a GTS institute. While Denmark does not have a greater prop0rtion SMEs than the other countries in this study, it seems as if the GTS System has a greater proportion SMEs as customers than the other four RTOs. Although SMEs may dominate in number of customers, the RTOs probably all have considerably larger turnover from large enterprises than from the more numerous SMEs.
10.2 Organisation and governanceIt appears as if an RTO’s legal form in practice is of secondary importance, since the different forms appearing in this study do not seem to affect operations in any obvious way. The limited companies of course pay tax on their profits, but on the other hand, since profits are small, so is the tax. A difference that indeed has been noted is that the Fraunhofer Society’s legal status limits the organisation’s possibilities to raise capital and use credit facilities.
In terms of ownership, the GTS institutes stand out due to the complete lack of common ownership. Moreover, the institutes have no thematic coherence and the individual institutes merely have a (minimum) quality level and performance contract funding in common, meaning that group coherence is weak and probably fragile. The other four RTOs have more or less unified structures with proper possibilities for owners (or equivalent) and management to exert control, although this does not necessarily mean that control possibilities are exercised, as the IRECO case illustrates. Since the IRECO Group now gradually is being transformed into a “proper” RTO group with boosted financial muscle, it is obvious that the GTS System is the only RTO (of those studied) that remains scattered from ownership, management and strategic points of view. This is probably not to the GTS System’s advantage on an increasingly competitive global market. On the other hand, the Danish GTS quality assurance system probably is an advantage, but it ought to be implementable also in a unified RTO group; the quality assurance system appears to have no equivalent in at least Sweden and Norway.
Regardless of legal form and organisational model, it is clear that governments effectively control RTOs with funding instruments, basic and other, meaning that the degree of formal government control in effect is of little importance. Although governments have good possibilities to manage the RTOs, they do not necessarily do so. To strategically manage an RTO, a strategy is required; Sweden is an example of where such a strategy has been absent for a long time, although the situation belatedly appears to be changing.
Some of the individual institutes in the IRECO Group have been majority owned by membership associations through which members, mainly private enterprises, collectively owned the institute. This form of collective ownership still exists, but in most cases the membership associations are now minority owners. The Swedish experiences suggest that industry ownership, at least as practiced in the IRECO Group, is ineffective when the going gets tough. Industry owners, whether exercising ownership directly or through membership associations, have proven unlikely to shoulder the full responsibilities as owners. Particularly membership associations have no capital and little strategic direction (for obvious reasons).

39 International Comparison of Five Institute Systems
>
10.3 Competence developmentPrevious studies have unambiguously awarded RTOs an important role in the innovation system. For example, it has been argued that RTOs help companies move “one step beyond” their existing capabilities, thus reducing the risks associated with innovation to allow a faster rate of economic development. While RTOs and universities both overlap and cooperate in knowledge production, they are complements and not substitutes, having different skills and core capabilities. Enterprises normally cooperate with RTOs when they need directly applicable knowledge and with universities in order to obtain human resources. There is no evidence to support the idea that universities can substitute for what RTOs do, nor do universities in practice supply the same services as RTOs.15
However, for an RTO to prosper and be able to supply qualified services, there is a strong need to continuously develop, or else it will gradually – and rather quickly – become a consulting firm, which probably also will have problems maintaining its profitability. This is the main motivation for public support of RTOs and more specifically basic funding. One can also, based on economic theory, argue that the more fundamental or long-term research is, the greater the market failure associated with its production. This is why society pays 100% for basic research (mainly carried out by universities) and much less for close-to-market projects; RTOs’ strategic R&D tends to be somewhere in-between the two extremes. There is a crude association between the share of income RTOs get from basic funding and the extent to which they engage in more fundamental R&D, but it is complicated both by invisible “knowledge subsidies” (such as that SINTEF enjoys through its symbiotic relation with NTNU and similarly the close relationship between the institute YKI within the SP sub-Group of IRECO and KTH) and by differences in customs and practices. Given their low basic funding, for example, the IRECO Group does a surprisingly large amount of knowledge generation. And there are also significant variations within each institute system; for example, the GTS institute Bioneer, as well as IRECO’s YKI, are much more research-intensive than the others, but their respective share of basic funding is not dramatically different.
As mentioned in Chapter 5, performing in-house R&D is not the only way to renew and develop knowledge and competence. RTOs tend to increase their efforts to cooperate more closely with universities for a number of reasons:
To gain access to their R&D results, so as to be able to exploit them • commerciallyTo be able to retain and develop its own personnel by providing more • challenging work, by securing the possibility to have in-house graduate students, by allowing staff to be adjunct professors etc.To achieve or increase critical mass• To “borrow” some of the research “quality seal” of universities• To be able to recruit qualified researchers•
15 Erik Arnold et al., op. cit.

40 International Comparison of Five Institute Systems
>
Altogether, such cooperation – which is mutually beneficial – may result in significant invisible subsidies, as discussed above with SINTEF and YKI as examples. Most of this cooperation, as well as most of an RTO’s competence development in general, takes place in national or international collaborative R&D projects. The technology “import” achieved through participation in the EU’s framework programmes may be particularly powerful and participation in such projects also builds networks and provides opportunities for benchmarking. However, in almost all cases, funding for R&D projects – whether national or international – does not pay the full costs of the work to be carried out. Universities generally manage to deal with such insufficient funding through a combination of basic government funding (which is much larger than for the average RTO’s), maintaining a portfolio of thematically related project grants that co-fund each other, and a “relaxed” view on timekeeping and cost reporting. In most cases, an RTO’s ways to cope are limited to use of its (much smaller) basic grant and to attempt to maintain a portfolio of related projects, since “creative” bookkeeping is not possible in limited companies. This is the main reason why a meagre basic grant can be devastating to an RTO’s possibilities for renewal of competence and capabilities. It is well known that RTOs decline to participate in for example FP projects, since they are unable to co-fund their participation. From a national technology acquisition point of view, this is obviously an undesirable situation. So far, the co-funding requirement for RTOs participating in FP projects has in most cases been 50% of the full project costs, but starting in FP7 the requirement has been reduced to 25%. This is surely a welcome development, but the need for substantial basic funding remains if it is not to limit RTOs’ participation in FP projects.
10.4 Competence exploitationAn RTO’s competence development and exploitation cycle typically evolves through a series of steps, as illustrated by a three-stage model:
In stage 1, the RTO generates or acquires knowledge and competence. • Basic knowledge may be generated using basic funding only, but most of the time activities are at least partly funded by R&D projects and therefore usually takes place in collaboration with enterprises and other R&D providers. Collaborative projects are also a means to acquire knowledge from project partners, often foreign ones.In stage 2, the RTO cooperates with its customers and partners in further • developing and exploiting the generated or acquired knowledge, in most cases together with leading-edge users in the same country. Collaboration partners are usually enterprises and sometimes also public-sector actors engaging in precompetitive R&D. This stage is often semi-commercial and thus funded through a blend of public and private funding.In stage 3, the RTO takes the now more mature knowledge and transfers it • to less technologically capable customers through consulting and more or less standardised services. Sometimes stage 3 is quite profitable, but it is not necessarily the favourite work of researchers and it gets close to what commercial consultants can do, so there is a natural limit to how much an RTO does in this stage. A typical stage-3 customer would be an SME, but a complication arises in that RTOs generally find it difficult to work with SMEs on purely commercial terms, since SMEs are unlikely to want (or
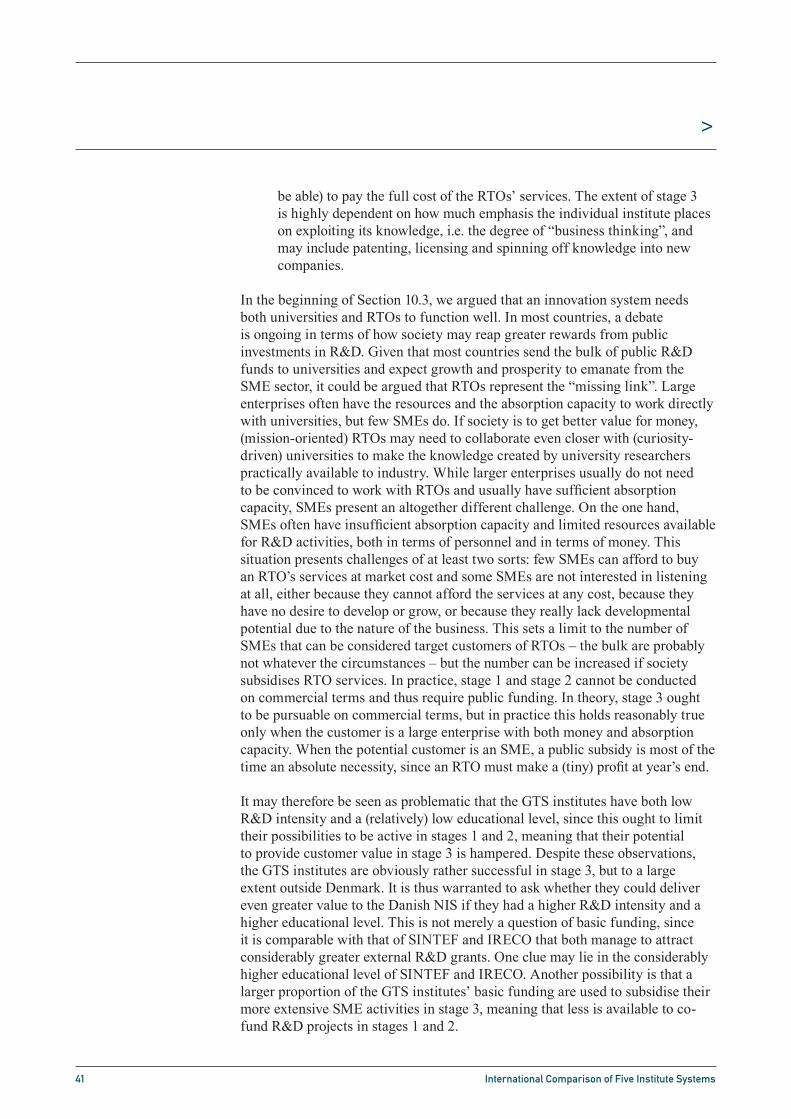
41 International Comparison of Five Institute Systems
>
be able) to pay the full cost of the RTOs’ services. The extent of stage 3 is highly dependent on how much emphasis the individual institute places on exploiting its knowledge, i.e. the degree of “business thinking”, and may include patenting, licensing and spinning off knowledge into new companies.
In the beginning of Section 10.3, we argued that an innovation system needs both universities and RTOs to function well. In most countries, a debate is ongoing in terms of how society may reap greater rewards from public investments in R&D. Given that most countries send the bulk of public R&D funds to universities and expect growth and prosperity to emanate from the SME sector, it could be argued that RTOs represent the “missing link”. Large enterprises often have the resources and the absorption capacity to work directly with universities, but few SMEs do. If society is to get better value for money, (mission-oriented) RTOs may need to collaborate even closer with (curiosity-driven) universities to make the knowledge created by university researchers practically available to industry. While larger enterprises usually do not need to be convinced to work with RTOs and usually have sufficient absorption capacity, SMEs present an altogether different challenge. On the one hand, SMEs often have insufficient absorption capacity and limited resources available for R&D activities, both in terms of personnel and in terms of money. This situation presents challenges of at least two sorts: few SMEs can afford to buy an RTO’s services at market cost and some SMEs are not interested in listening at all, either because they cannot afford the services at any cost, because they have no desire to develop or grow, or because they really lack developmental potential due to the nature of the business. This sets a limit to the number of SMEs that can be considered target customers of RTOs – the bulk are probably not whatever the circumstances – but the number can be increased if society subsidises RTO services. In practice, stage 1 and stage 2 cannot be conducted on commercial terms and thus require public funding. In theory, stage 3 ought to be pursuable on commercial terms, but in practice this holds reasonably true only when the customer is a large enterprise with both money and absorption capacity. When the potential customer is an SME, a public subsidy is most of the time an absolute necessity, since an RTO must make a (tiny) profit at year’s end.
It may therefore be seen as problematic that the GTS institutes have both low R&D intensity and a (relatively) low educational level, since this ought to limit their possibilities to be active in stages 1 and 2, meaning that their potential to provide customer value in stage 3 is hampered. Despite these observations, the GTS institutes are obviously rather successful in stage 3, but to a large extent outside Denmark. It is thus warranted to ask whether they could deliver even greater value to the Danish NIS if they had a higher R&D intensity and a higher educational level. This is not merely a question of basic funding, since it is comparable with that of SINTEF and IRECO that both manage to attract considerably greater external R&D grants. One clue may lie in the considerably higher educational level of SINTEF and IRECO. Another possibility is that a larger proportion of the GTS institutes’ basic funding are used to subsidise their more extensive SME activities in stage 3, meaning that less is available to co-fund R&D projects in stages 1 and 2.
42 International Comparison of Five Institute Systems
>
10.5 The case for basic fundingGiven that there is a need for basic funding to enhance competence development and exploitation, one might suspect that the quality of an RTO’s services would be proportional to the degree of basic funding. If that were correct, the Fraunhofer Society and TNO ought to be considerably “better” than their Scandinavian colleagues (cf. Exhibit 14). Whether this is true or not is impossible to answer in a limited study such as this one, but there are indications that the Scandinavians have developed different strategies to cope with what most pundits would agree is inadequate basic funding. An obvious observation is that the Scandinavians, and particularly IRECO, to a certain degree manage to compensate with other forms of public funding (cf. Exhibit 13), both national and European. The GTS institutes have developed their export markets to an impressive extent. Assuming that they increase their sale of services to foreign customers because they make a profit, this profit may be seen as an indirect subsidy of their national activities, which is their raison d’être. Yet another strategy is obviously SINTEF’s symbiotic relationship with NTNU, which is an invisible subsidy. The IRECO Group’s international turnover is rather high and so is its R&D intensity (there is a correlation: 35–40% (depending on year) of its international turnover is R&D grants) and one could thus argue that the Group manages to compensate for meagre basic funding by being very good at writing proposals and by successfully selling its services on foreign commercial markets. An obvious hypothesis is that the IRECO institutes must have learnt to master the technique of clustering projects for co-funding purposes. The question is if either of these survival strategies is sustainable in the long run. The Scandinavians are nevertheless at an obvious disadvantage compared to their continental colleagues.
What in practice sets an RTO apart from a regular consultancy is the constant need for renewal of competence and capabilities as well as society’s expectation that it is to work with unprofitable customers. Both of these features are impossible to pursue on purely commercial terms. In practice, an RTO therefore needs at least two forms of basic funding, one more or less discretionary and one (or more) in response to societal and industry needs. Discretionary funding (types 1 and 2 in Table 4) is required for strategic investments in knowledge and equipment independent of needs perceived by society and existing customers. The other type, strategically targeted funding (types 3 and 4 in Table 4), is for knowledge generation in fields of relevance to society and industry. One extreme is TNO, where ministries determine what themes TNO should work on based on their perception of societal and industry needs (type 4). In other cases, the funding mechanism may require that other parties co-fund and/or participate in the work, meaning that enterprises and/or other R&D providers help decide what the RTO should work on (type 3). Sometimes a members’ association assists in determining priorities. This practice definitely causes lock-in and the question is whether this is useful – by keeping the RTO relevant – or a barrier, for example in preventing the RTO from diversifying or keeping up with new technologies and new customers. These are all focusing devices that focus the RTO’s attention on areas of need. Whether socially directed or unconstrained basic funding produces better RTOs remain an unanswered question, but there is clearly a need for a combination of the two. Fortunately, applied RTOs constantly receive signals from their customers and the research community that help them stay on

43 International Comparison of Five Institute Systems
>
track. In the stress between the universities on one side and the market on the other, the RTOs have rich data about strategic options and needs. What they do with that knowledge, of course, depends in no small part on the quality of their management.
A healthy, strong and for society and the NIS useful RTO requires sustained government commitment. While this translates into significant and transparent funding – both basic funding and project funding available on competitive terms without sudden changes in funding systems – it does not necessarily require government ownership, as the Fraunhofer example illustrates. However, it does require unambiguous rhetoric repeatedly stating the RTO’s critical role in the NIS; not at the expense of universities, but as a system-critical complement.

44 International Comparison of Five Institute Systems
>
A.1. National business structureDanish industry is characterised by a high specialisation in low-tech industrial products such as clothing, furniture and foodstuffs16. Exhibit 18 illustrates that the most important private sectors in Denmark by value added are financial intermediation, wholesale and retail trade, and industry. However, looking at the proportion of enterprises active in different sectors, the picture is quite different, see Exhibit 19; perhaps most notable is that enterprises in agriculture and fishing, as well as in construction are small, while enterprises in industry are large. Denmark has a substantial number of SMEs; 98.5% of the country’s nearly 300 000 enterprises have less than 50 employees, see Exhibit 20.
Exhibit 18 Share of total value added by sector 2007
Source: Eurostat
The Trend Chart report for 2006 identifies the three main challenges for the Danish innovation system17. Firstly, slow progress in human capital formation, which has been met by comprehensive and ambitious policy measures. The second challenge is the threat of labour shortage; policy measures focusing on increasing the number of working years have been introduced. The third challenge is to create a more balanced innovation policy mix, as the current one tends to focus on science-based sectors and “high-technology research” within fields such as nanotechnology, information technology and biotechnology. According to the Trend Chart report “this strategy fails to sufficiently take the characteristics of the Danish innovation system into consideration”18.
16 Jesper Lindgaard Christensen, Bent Dalum, Birgitte Gregersen, Björn Johnson, Bengt-Åke Lundvall
and Mark Tomlinson, “The Danish Innovation System”, Department of Business Studies Aalborg Univer-
sity, Denmark DRAFT February 2005.
17 European Trend Chart on Innovation: Annual Innovation Policy Trends and Appraisal Report Denmark
2006, European Commission, 2006.
18 European Trend Chart on Innovation: Annual Innovation Policy Trends and Appraisal Report Denmark
2006, European Commission, 2006.
Appendix A. The GTS System
International Comparison of Five Institute Systems 36
Appendix AThe GTS System
A.1. National business structure
Danish industry is characterised by a high specialisation in low-tech industrial prod-ucts such as clothing, furniture and foodstuffs17. Exhibit 18 illustrates that the most important private sectors in Denmark by value added are financial intermediation, wholesale and retail trade, and industry. However, looking at the proportion of enter-prises active in different sectors, the picture is quite different, see Exhibit 19; perhaps most notable is that enterprises in agriculture and fishing, as well as in construction are small, while enterprises in industry are large. Denmark has a substantial number of SMEs; 98.5% of the country’s nearly 300 000 enterprises have less than 50 employ-ees, see Exhibit 20.
Exhibit 18 Share of total value added by sector 2007. Source: Eurostat
Agriculture, fishing; 1% Manufacturing;
20%
Construction; 6%
Wholesale and retail trade;
22%
Financial intermediation;
25%
Public administration, defence; 27%
The Trend Chart report for 2006 identifies the three main challenges for the Danish innovation system18. Firstly, slow progress in human capital formation, which has been met by comprehensive and ambitious policy measures. The second challenge is the threat of labour shortage; policy measures focusing on increasing the number of working years have been introduced. The third challenge is to create a more balanced innovation policy mix, as the current one tends to focus on science-based sectors and “high-technology research” within fields such as nanotechnology, information tech-nology and biotechnology. According to the Trend Chart report “this strategy fails to
17 Jesper Lindgaard Christensen, Bent Dalum, Birgitte Gregersen, Björn Johnson, Bengt-Åke Lundvall and Mark Tomlinson, “The Danish Innovation System”, Department of Business Studies Aalborg University, Denmark DRAFT February 2005.
18 European Trend Chart on Innovation: Annual Innovation Policy Trends and Appraisal Re-port Denmark 2006, European Commission, 2006.
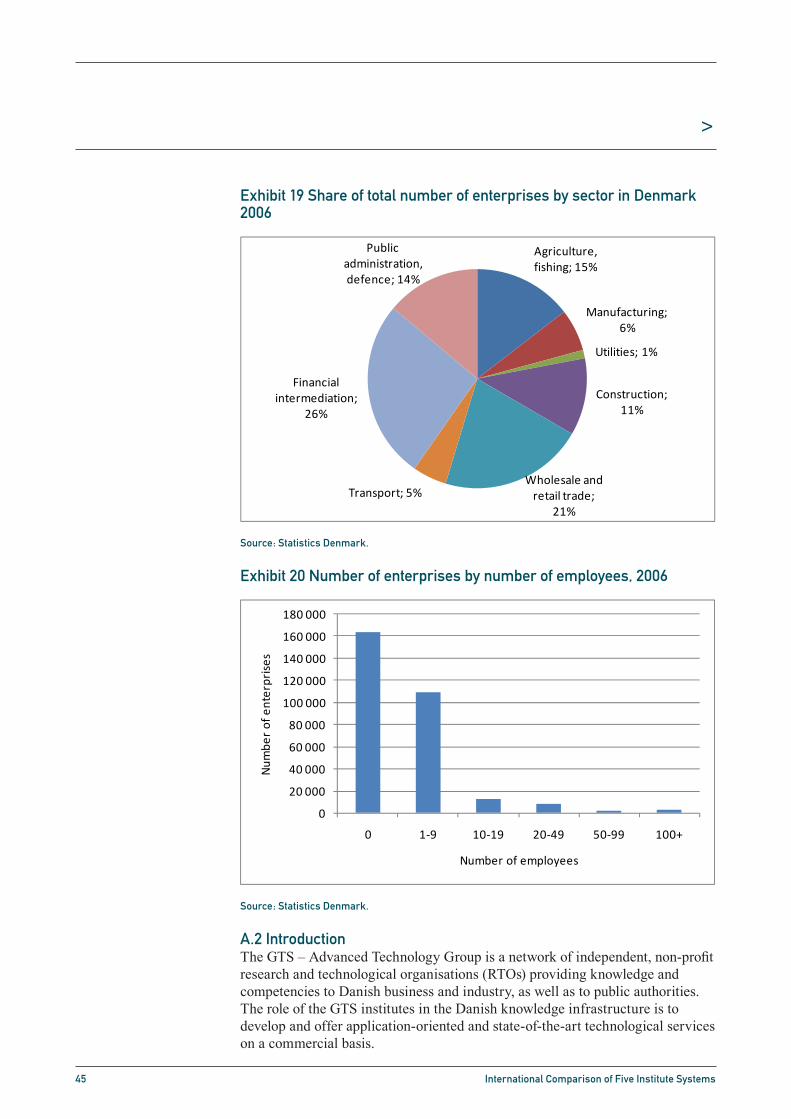
45 International Comparison of Five Institute Systems
>
Exhibit 19 Share of total number of enterprises by sector in Denmark 2006
Source: Statistics Denmark.
Exhibit 20 Number of enterprises by number of employees, 2006
Source: Statistics Denmark.
A.2 IntroductionThe GTS – Advanced Technology Group is a network of independent, non-profit research and technological organisations (RTOs) providing knowledge and competencies to Danish business and industry, as well as to public authorities. The role of the GTS institutes in the Danish knowledge infrastructure is to develop and offer application-oriented and state-of-the-art technological services on a commercial basis.
International Comparison of Five Institute Systems 37
sufficiently take the characteristics of the Danish innovation system into considera-tion”19.
Exhibit 19 Share of total number of enterprises by sector in Denmark 2006. Source: Statistics Denmark.
Agriculture, fishing; 15%
Manufacturing; 6%
Utilities; 1%
Construction; 11%
Wholesale and retail trade;
21%
Transport; 5%
Financial intermediation;
26%
Public administration, defence; 14%
Exhibit 20 Number of enterprises by number of employees, 2006. Source: Sta-tistics Denmark.
0
20 000
40 000
60 000
80 000
100 000
120 000
140 000
160 000
180 000
0 1‐9 10‐19 20‐49 50‐99 100+
Num
ber of enterprises
Number of employees
19 European Trend Chart on Innovation: Annual Innovation Policy Trends and Appraisal Re-port Denmark 2006, European Commission, 2006.

46 International Comparison of Five Institute Systems
>
By being part of a system of public certification, the GTS institutes can apply for basic funding through performance contracts, which aim to enhance the institutes’ knowledge base and competencies in order to enable them to supply the latest technological knowledge to Danish enterprises. It is the Ministry of Science, Technology and Innovation (hereinafter “the Ministry”) that decides which institutes are to receive authorisation. To become authorised, an institute must fulfil certain requirements concerning its economic, organisational and professional conditions. The nine authorised GTS institutes in the GTS network are:
Institute for Agro Technology and Food Innovation (AgroTech)• Alexandra Institute• Bioneer• Danish Institute of Fire and Security Technology (DBI)• Danish Electronics, Lights & Acoustics (DELTA)• Danish National Metrology Institute (DFM)• DHI Water and Environment• FORCE Technology• Danish Technological Institute (DTI)•
The institutes differ significantly in size, technological profile, R&D-intensity, customer base and kind of services offered.
Business concept and strategyTo receive authorisation, an RTO has to submit a strategy to the Ministry indicating clearly how the goals set will be met. In addition to individual strategies, the GTS network has developed a common strategy:
The GTS institutes offer knowledge and consultancy, co-operation on technological and market-related innovation, testing, optimisation, quality assurance, certifications and benchmarking – all of which contribute to enhancing the international competitiveness of the business sector and benefit society in general.19
Moreover, the network has also developed a common mission, as well as objectives and values to guide the institutes in their work, see further Section 10.5.
GovernanceDue to its public certification, the GTS System is governed by a number of guiding principles put forth in the Act on Technology and Innovation20. These principles constitute the base for the authorisation and co-financing of the institutes. GTS stands for “Godkendt Teknologisk Service” (Approved Technological Service), which refers to the Ministry’s authorisation.
19 “From knowledge to value”, www.teknologiportalen.dk.
20 Lov nr. 419 af 6 juni 2002 om Teknologi og innovation.

47 International Comparison of Five Institute Systems
>
The authorisation is valid for three years at a time and encompasses a number of requirements concerning the institute’s economic, organisational and professional structure (see Section 10.5). It is also specified that any profits are to be reinvested in the institute.
The legal form of the GTS institutes is either independent foundation or limited company owned by industry and/or universities, see Table 6.
Table 6 Legal form of GTS institutes, 2008
The GTS institutes are organised in a network with a central body which serves as the professional and industrial organisation for the institutes. Its main tasks are to represent the common interests of the institutes in relation to any outside parties and to facilitate internal cooperation on technological, professional, administrative and managerial matters.
The GTS network’s supreme body is the Board of Directors which consists of the chief executive officers of the GTS institutes. The Board elects chairman and vice-chairman every year and appoints the managing director of the central body of the network. The managing director ensures that the GTS System’s overall objectives and political decisions are realised in the daily operations21.
The chief executive officers of the individual institutes are appointed by the respective institute boards, the members of which in turn are appointed by shareholders, staff of the GTS institutes and/or representatives of organisations engaged in the specific institute. The routines differ between the institutes.
HistoryThe first Danish research and technology organisation, the Danish Technological Institute (Teknologisk Institut), was established in 1906. The aim of this institute was to mediate new technology to industry by mainly focusing on vocational training and counselling. The institute was established by industry with financial support from the government.
21 cordis.europa.eu/erawatch/
Independent foundation Limited company
DBI AgroTech
DELTA Alexandra Institute
DHI Bioneer
FORCE DFM
DTI

48 International Comparison of Five Institute Systems
>
In the 1940s, several RTOs were established by The Danish Academy of Technical Sciences (ATV). These institutes differed from the Technological Institute in the sense that they focused on specific technological fields, such as welding, electronics, corrosion, hydraulics, and acoustics (leading to institutes with names such as Svejsecentralen, Elektronikcentralen, Korrosioncentralen, Dansk Hydraulisk Institut and Lydteknisk Laboratorium).
In 1973 two new acts regulating the proposed RTO-system meant that the Danish RTOs gradually were merged into a single system22. At this time, there were two large RTOs, Teknologisk Institut and Jysk Teknologisk Institut, and a number of smaller ones. The general view among the central actors was that the Danish RTOs would benefit from acting as one system and under similar conditions. It was in connection with these two new acts that the concept of GTS was introduced, including the specific requirements that the institutes had to fulfil in order to become part of the GTS System.
The RTOs within the GTS System were expected to disseminate technological knowledge. The research activities pursued by the RTOs would be co-financed through other public funds and by paying customers. Meanwhile, the new board for technological service would only support research and development activities which were directed towards solutions to concrete problems and the creation of knowledge that could be transformed into technological services23.
The GTS System remained fairly stable for the next 15 years. However, in the end of the 1980s, the Council for Technology (Teknologirådet), which was responsible for the GTS System, began a process of restructuring of the institutes. This process resulted in several larger mergers (but in some cases also the opposite with a splitting up of an existing RTO into three new institutes24). Concurrently, government support to the GTS System was reduced.
In 1992, the GTS institutes set up a branch association, Institutrådet, which is still active under the name GTS.
In 2001, the political responsibility for the GTS System was moved from the Ministry of Business to the newly established Ministry of Science, Technology and Innovation. As a consequence, the GTS System became more closely related to the research system and the universities, which provided for more research-based innovation activities.
22 Lov om teknologisk service, 1973, and Lov om statens tekniske prøvenævn, 1973.
23 In more detail, state support included: base funding for 3-5 year contracts for activities which
included cooperation among different target groups, dissemination of new knowledge, standardisation
activities; focusing on specific industry political issues or the introduction of completely new technology;
reduction of counselling costs for SMEs and costs for educational activities targeting non-academics;
support to specific projects; support to projects in accordance with competitive conditions within
prioritised themes; loans to construction work and equipment. (Source: Material supplied by the GTS
Network, 2008.)
24 Statsprøveanstalten was divided into Brandteknisk Institut, Teknologisk Institut and FORCE Techno-
logy.

49 International Comparison of Five Institute Systems
>
Between 1995 and 2006, half of the GTS institutes left the system due to bankruptcies, mergers or because they joined other technology service systems. In 2006, the Ministry opened a call for new GTS institutes. Thirteen institutes applied and two were accepted in 2007: AgroTech and the Alexandra Institute. Today there are nine RTOs in the GTS System, the specialties of which are further described in Section 10.5.
A.3 Role in National Innovation System
A.3.1. Types of servicesThe services offered by the GTS institutes range from knowledge, technology and consultancy, co-operation on technological and market-related innovation, testing, optimisation, quality assurance, certification and benchmarking25. Exhibit 21 illustrates that on the Danish market, services with high knowledge content dominate. Second and third most important in terms of domestic turnover are education and training, and testing and experiments.
Exhibit 21 GTS institutes’ national turnover by type of service, 2006
Source: Data supplied by the GTS Network, 2008.
Education and trainingThe GTS institutes have a long tradition of offering different types of education and training. In fact, the institutes have the largest supply of courses and training in Denmark outside the public sector26. The institutes offer both traditional open courses and custom-made courses. In addition, they also offer other types of education, such as courses in business development and training for instructors. Moreover, the institutes produce training material that is used by the institutes and their customers, both private and public ones.
25 www.teknologiportalen.dk
26 Material supplied by the GTS Network, 2008.
International Comparison of Five Institute Systems 41
Exhibit 21 GTS institutes’ national turnover by type of service, 2006. Source: Data supplied by the GTS Network, 2008.
Services with low R&D
content; 7%
Education and training; 18%
Inspection and control; 5%
Certification, labelling and approval; 3%
Management services; 11%
Testing and experiments;
17%
Measuring and calibration; 8%
Services with high knowledge content; 27%
Commissioned R&D; 4%
Education and training The GTS institutes have a long tradition of offering different types of education and training. In fact, the institutes have the largest supply of courses and training in Den-mark outside the public sector27. The institutes offer both traditional open courses and custom-made courses. In addition, they also offer other types of education, such as courses in business development and training for instructors. Moreover, the institutes produce training material that is used by the institutes and their customers, both pri-vate and public ones. The content of the courses range from documentation of the par-ticipants’ competencies, including examination and diplomas, others include introduc-tions to new technologies or legislation.
Unique equipment and facilities The GTS institutes have invested substantially in unique facilities and equipment, in-cluding larger laboratories and experimental equipment that amount to a value of DKK1.6 billion. Customers may buy time or services in e.g. test-laboratories or flexible production equipment in their own development processes.28
Certification, testing, inspection and control Together with the previous GTS institute Dansk Standard, the GTS institutes consti-tute the main actors among the Danish accreditation laboratories and organisations, although they are not the only ones. The Danish accreditation laboratories and organi-sations are to perform calibration of measurement instruments, testing of products, and certification of businesses’ management systems or inspection of specific work tasks. The GTS institutes mainly perform certification, testing, inspection and control within their own technological specialties, although there are examples of accredita-tion work related to more general areas such as developing a well-functioning quality organisation. The accreditation services offered by the GTS institutes are important for the development of Danish industry and businesses. They also constitute an important resource for Danish research institutes that are not always able to invest in the kind equipment needed.29
27 Material supplied by the GTS Network, 2008. 28 Ibid. 29 Ibid.

50 International Comparison of Five Institute Systems
>
The content of the courses range from documentation of the participants’ competencies, including examination and diplomas, others include introductions to new technologies or legislation.
Unique equipment and facilitiesThe GTS institutes have invested substantially in unique facilities and equipment, including larger laboratories and experimental equipment that amount to a value of DKK1.6 billion. Customers may buy time or services in e.g. test-laboratories or flexible production equipment in their own development processes.27
Certification, testing, inspection and controlTogether with the previous GTS institute Dansk Standard, the GTS institutes constitute the main actors among the Danish accreditation laboratories and organisations, although they are not the only ones. The Danish accreditation laboratories and organisations are to perform calibration of measurement instruments, testing of products, and certification of businesses’ management systems or inspection of specific work tasks. The GTS institutes mainly perform certification, testing, inspection and control within their own technological specialties, although there are examples of accreditation work related to more general areas such as developing a well-functioning quality organisation. The accreditation services offered by the GTS institutes are important for the development of Danish industry and businesses. They also constitute an important resource for Danish research institutes that are not always able to invest in the kind equipment needed.28
MetrologyThe Danish Board of Security is politically responsible for the organisation of metrology in Denmark. The scientific work is coordinated by DFM. The metrology services are provided by four GTS institutes (DFM, FORCE, DTI and DELTA) and two other institutes (Risø–DTU and Institut for Produktion og Ledelse at the Danish University of Technology).29
StandardisationThe GTS institutes have a long tradition of standardisation, both nationally and internationally. The Danish Enterprise and Construction Authority is responsible for the organisation of standardisation, while the work is coordinated by former GTS institute Dansk Standard. Because the cost of participating in standardisation work has increased rapidly, the GTS institutes have been forced to prioritise in which instances they will participate in the work. In this process, participation in international standardisations has been prioritised.30
27 Ibid.
28 Ibid.
29 Ibid.
30 Ibid.
51 International Comparison of Five Institute Systems
>
A.3.2. Relations to other national R&D suppliersPreviously, the division of labour among the knowledge producers in the national innovation system (NIS) of was rather sharp. However, in the process of restructuring the national innovation policy governance to enhance coordination and cooperation between the actors in the NIS, emphasis has also been placed on increased interaction between the public research system, including the universities, government research institutes, hospitals and the technological service system (i.e. the GTS network)31. Nonetheless, there is still a certain division of labour between the different actors in the system. The universities’ main focus is on education and research, whereas the previous government research institutes (now integrated into the universities) mainly produce research-based knowledge and information to policymakers. In this division of labour, the role of the GTS institutes is to deliver technological knowledge to businesses, public authorities and institutes and to constitute a bridge between the universities’ research and businesses32. However, given that there is some overlap between the GTS institutes and other suppliers of R&D services in the NIS (both public and private), there is also a certain degree of competition between actors. In this respect, the GTS institutes may not compete with private-sector suppliers in the fields of activity funded through their performance contracts.
Accordingly, the GTS System’s two main functions in the NIS are33:
To maintain and develop a basic technological infrastructure: so that firms have access to basic technological competences that they are not in possession of themselves and which are not available on the market. This entails for example standardisation activities, access to equipment, testing, courses and other basic technological services.
To create technological innovation and renewal in industry: through development and dissemination of new technological knowledge, e.g. new methods, concepts and services, the technological service can facilitate development of new knowledge-based products, service offerings and processes in enterprises.
31 European Trend Chart on Innovation, Annual Innovation Policy Trends and Appraisal Report, Den-
mark, 2006, European Commission, 2006.
32 Material supplied by the GTS Network, 2008.
33 Translated from “Retningslinier for Godkendt Teknologisk Service i Danmark”, Ministeriet for Viden-
skab, Teknologi og Udvikling, 2005:4.
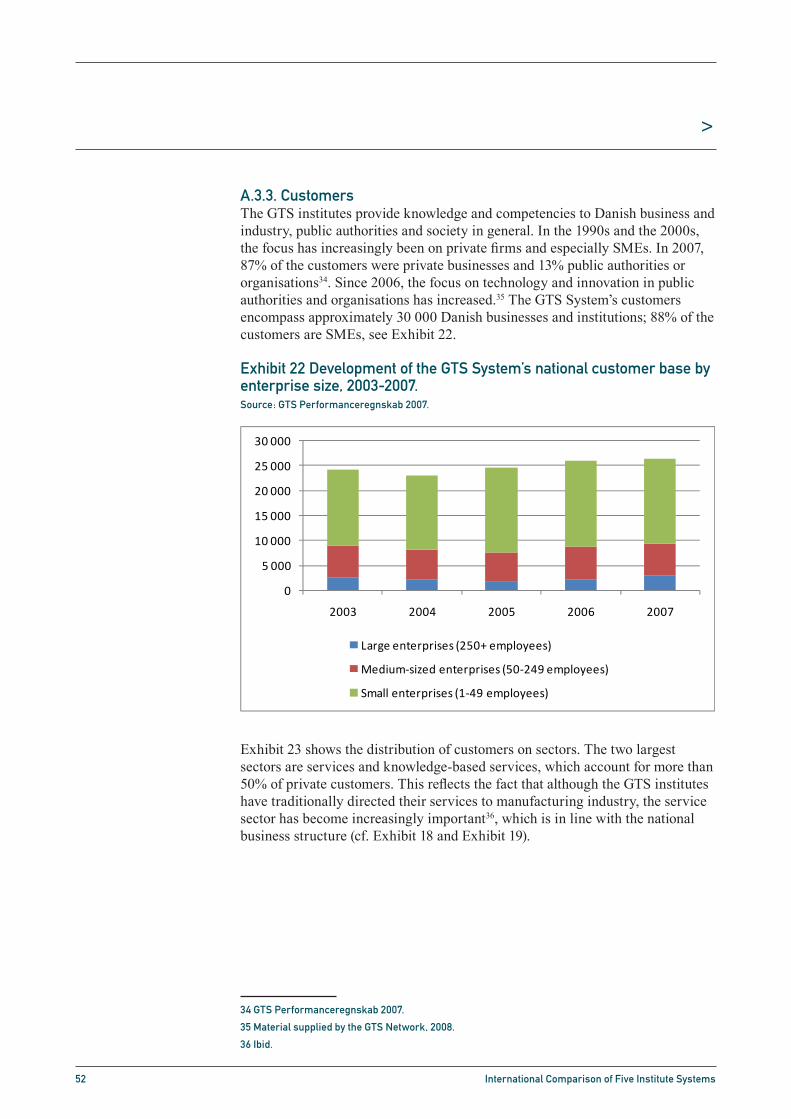
52 International Comparison of Five Institute Systems
>
A.3.3. CustomersThe GTS institutes provide knowledge and competencies to Danish business and industry, public authorities and society in general. In the 1990s and the 2000s, the focus has increasingly been on private firms and especially SMEs. In 2007, 87% of the customers were private businesses and 13% public authorities or organisations34. Since 2006, the focus on technology and innovation in public authorities and organisations has increased.35 The GTS System’s customers encompass approximately 30 000 Danish businesses and institutions; 88% of the customers are SMEs, see Exhibit 22.
Exhibit 22 Development of the GTS System’s national customer base by enterprise size, 2003-2007. Source: GTS Performanceregnskab 2007.
Exhibit 23 shows the distribution of customers on sectors. The two largest sectors are services and knowledge-based services, which account for more than 50% of private customers. This reflects the fact that although the GTS institutes have traditionally directed their services to manufacturing industry, the service sector has become increasingly important36, which is in line with the national business structure (cf. Exhibit 18 and Exhibit 19).
34 GTS Performanceregnskab 2007.
35 Material supplied by the GTS Network, 2008.
36 Ibid.
International Comparison of Five Institute Systems 43
A.3.3. Customers
The GTS institutes provide knowledge and competencies to Danish business and in-dustry, public authorities and society in general. In the 1990s and the 2000s, the focus has increasingly been on private firms and especially SMEs. In 2007, 87% of the cus-tomers were private businesses and 13% public authorities or organisations35. Since 2006, the focus on technology and innovation in public authorities and organisations has increased.36 The GTS System’s customers encompass approximately 30 000 Dan-ish businesses and institutions; 88% of the customers are SMEs, see Exhibit 22.
Exhibit 22 Development of the GTS System’s national customer base by enter-prise size, 2003-2007. Source: GTS Performanceregnskab 2007.
0
5 000
10 000
15 000
20 000
25 000
30 000
2003 2004 2005 2006 2007
Large enterprises (250+ employees)
Medium‐sized enterprises (50‐249 employees)
Small enterprises (1‐49 employees)
Exhibit 23 shows the distribution of customers on sectors. The two largest sectors are services and knowledge-based services, which account for more than 50% of private customers. This reflects the fact that although the GTS institutes have traditionally directed their services to manufacturing industry, the service sector has become in-creasingly important37, which is in line with the national business structure (cf. Ex-hibit 18 and Exhibit 19).
35 GTS Performanceregnskab 2007. 36 Material supplied by the GTS Network, 2008. 37 Ibid.
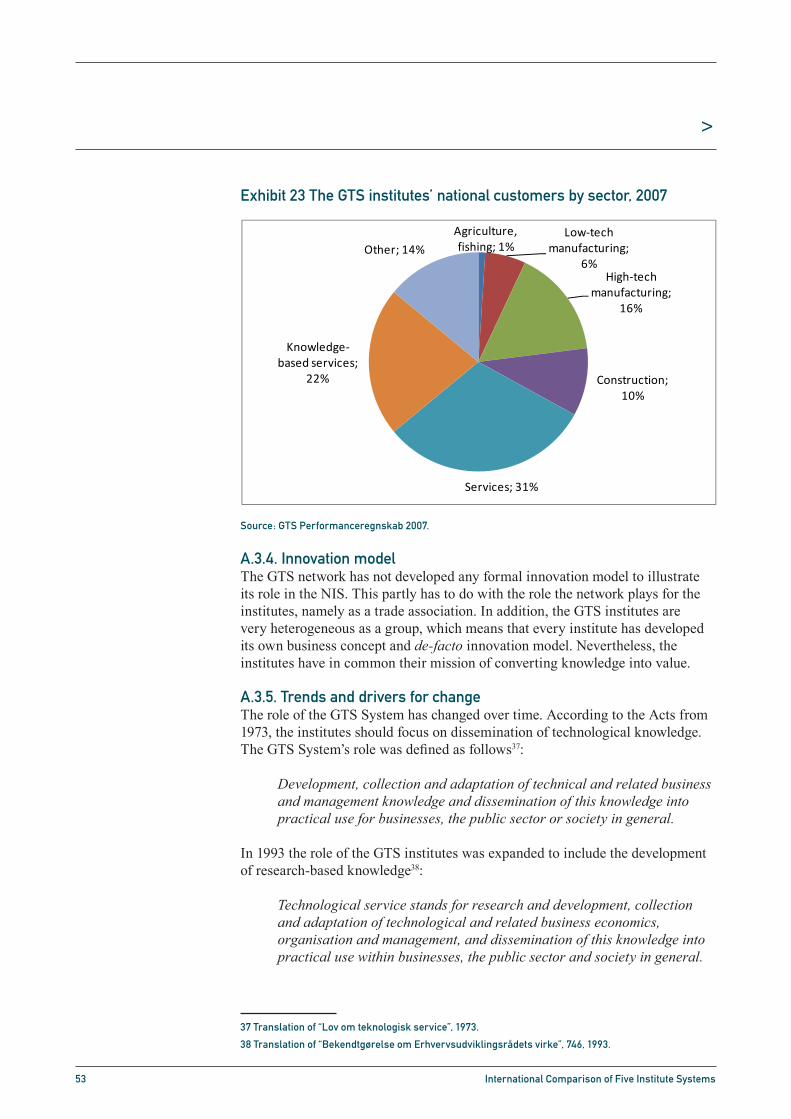
53 International Comparison of Five Institute Systems
>
Exhibit 23 The GTS institutes’ national customers by sector, 2007
Source: GTS Performanceregnskab 2007.
A.3.4. Innovation modelThe GTS network has not developed any formal innovation model to illustrate its role in the NIS. This partly has to do with the role the network plays for the institutes, namely as a trade association. In addition, the GTS institutes are very heterogeneous as a group, which means that every institute has developed its own business concept and de-facto innovation model. Nevertheless, the institutes have in common their mission of converting knowledge into value.
A.3.5. Trends and drivers for changeThe role of the GTS System has changed over time. According to the Acts from 1973, the institutes should focus on dissemination of technological knowledge. The GTS System’s role was defined as follows37:
Development, collection and adaptation of technical and related business and management knowledge and dissemination of this knowledge into practical use for businesses, the public sector or society in general.
In 1993 the role of the GTS institutes was expanded to include the development of research-based knowledge38:
Technological service stands for research and development, collection and adaptation of technological and related business economics, organisation and management, and dissemination of this knowledge into practical use within businesses, the public sector and society in general.
37 Translation of “Lov om teknologisk service”, 1973.
38 Translation of “Bekendtgørelse om Erhvervsudviklingsrådets virke”, 746, 1993.
International Comparison of Five Institute Systems 44
Exhibit 23 The GTS institutes’ national customers by sector, 2007. Source: GTS Performanceregnskab 2007.
Agriculture, fishing; 1%
Low‐tech manufacturing;
6%High‐tech
manufacturing; 16%
Construction; 10%
Services; 31%
Knowledge‐based services;
22%
Other; 14%
A.3.4. Innovation model
The GTS network has not developed any formal innovation model to illustrate its role in the NIS. This partly has to do with the role the network plays for the institutes, namely as a trade association. In addition, the GTS institutes are very heterogeneous as a group, which means that every institute has developed its own business concept and de-facto innovation model. Nevertheless, the institutes have in common their mission of converting knowledge into value.
A.3.5. Trends and drivers for change
The role of the GTS System has changed over time. According to the Acts from 1973, the institutes should focus on dissemination of technological knowledge. The GTS Sys-tem’s role was defined as follows38:
Development, collection and adaptation of technical and related busi-ness and management knowledge and dissemination of this knowledge into practical use for businesses, the public sector or society in general.
In 1993 the role of the GTS institutes was expanded to include the development of re-search-based knowledge39:
Technological service stands for research and development, collection and adaptation of technological and related business economics, organi-sation and management, and dissemination of this knowledge into prac-tical use within businesses, the public sector and society in general.
In 1996, the reference made to “practical use” was changed into “commercial use”.
In 2008, the Board of Research and Innovation described the GTS System as40:
The GTS institutes […] gather, create and develop technological compe-tencies and disseminate this knowledge to Danish industry. They are at
38 Translation of “Lov om teknologisk service”, 1973. 39 Translation of “Bekendtgørelse om Erhvervsudviklingsrådets virke”, 746, 1993. 40 www.fi.dk/innovation/samspil-mellem-forskning-og-erhvervsliv/godkendt-teknologisk-
service.

54 International Comparison of Five Institute Systems
>
In 1996, the reference made to “practical use” was changed into “commercial use”.
In 2008, the Board of Research and Innovation described the GTS System as39:
The GTS institutes […] gather, create and develop technological competencies and disseminate this knowledge to Danish industry. They are at the same time bridge-builders to knowledge institutions in Denmark and abroad. […] The aim of the GTS institutes efforts is to strengthen technological services in Denmark as a basis for development and exploitation of technological, management and professional knowledge as well as to increase innovation capabilities in industry.
In conclusion, the role of the GTS System has changed from focusing on dissemination of technological knowledge which may be transformed into practically useful knowledge, to also include research-based knowledge creation that should not only be practically but also commercially useful. In practice, this has meant a change from primarily developing technological services to supporting specific development and dissemination activities with concrete and implementable goals.
A.4. Economy
A.4.1. Economic performanceIn 2007 the total turnover of the GTS institutes was DKK2 462 million, see Exhibit 24. Turnover has steadily grown in the period, but half of the growth in 2007 was due to two new institutes being added the GTS network in 2007; AgroTech and the Alexandra Institute thus contributed DKK34 and 37 million, respectively, to total turnover. The institutes have collectively maintained a profit margin of 0.7–2.8% of turnover, see Exhibit 24.
39 www.fi.dk/innovation/samspil-mellem-forskning-og-erhvervsliv/godkendt-teknologisk-service.
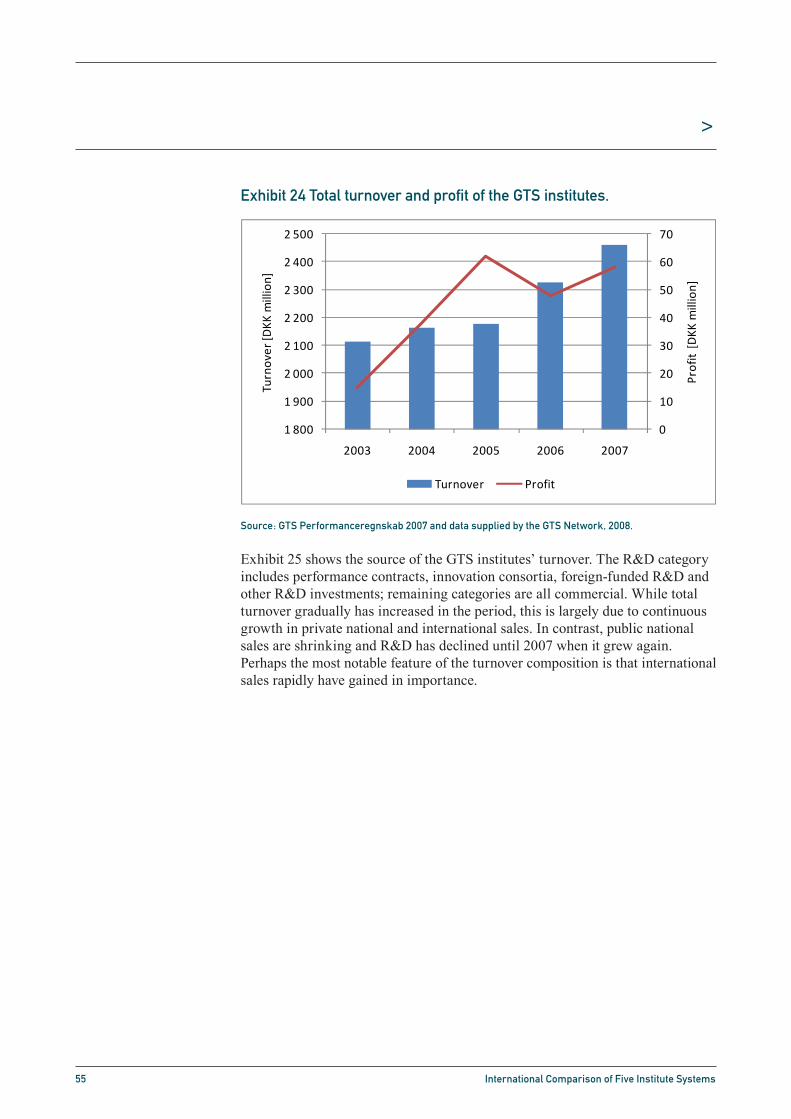
55 International Comparison of Five Institute Systems
>
Exhibit 24 Total turnover and profit of the GTS institutes.
Source: GTS Performanceregnskab 2007 and data supplied by the GTS Network, 2008.
Exhibit 25 shows the source of the GTS institutes’ turnover. The R&D category includes performance contracts, innovation consortia, foreign-funded R&D and other R&D investments; remaining categories are all commercial. While total turnover gradually has increased in the period, this is largely due to continuous growth in private national and international sales. In contrast, public national sales are shrinking and R&D has declined until 2007 when it grew again. Perhaps the most notable feature of the turnover composition is that international sales rapidly have gained in importance.
International Comparison of Five Institute Systems 45
the same time bridge-builders to knowledge institutions in Denmark and abroad. […] The aim of the GTS institutes efforts is to strengthen techno-logical services in Denmark as a basis for development and exploitation of technological, management and professional knowledge as well as to increase innovation capabilities in industry.
In conclusion, the role of the GTS System has changed from focusing on dissemination of technological knowledge which may be transformed into practically useful knowl-edge, to also include research-based knowledge creation that should not only be prac-tically but also commercially useful. In practice, this has meant a change from primar-ily developing technological services to supporting specific development and dissemi-nation activities with concrete and implementable goals.
A.4. Economy
A.4.1. Economic performance
In 2007 the total turnover of the GTS institutes was DKK2 462 million, see Exhibit 24. Turnover has steadily grown in the period, but half of the growth in 2007 was due to two new institutes being added the GTS network in 2007; AgroTech and the Alexandra Institute thus contributed DKK34 and 37 million, respectively, to total turnover. The institutes have collectively maintained a profit margin of 0.7–2.8% of turnover, see Exhibit 24.
Exhibit 24 Total turnover and profit of the GTS institutes. Source: GTS Per-formanceregnskab 2007 and data supplied by the GTS Network, 2008.
0
10
20
30
40
50
60
70
1 800
1 900
2 000
2 100
2 200
2 300
2 400
2 500
2003 2004 2005 2006 2007
Profit [D
KK million]
Turnover [D
KK million]
Turnover Profit
Exhibit 25 shows the source of the GTS institutes’ turnover. The R&D category in-cludes performance contracts, innovation consortia, foreign-funded R&D and other R&D investments; remaining categories are all commercial. While total turnover gradually has increased in the period, this is largely due to continuous growth in pri-vate national and international sales. In contrast, public national sales are shrinking and R&D has declined until 2007 when it grew again. Perhaps the most notable fea-ture of the turnover composition is that international sales rapidly have gained in im-portance.
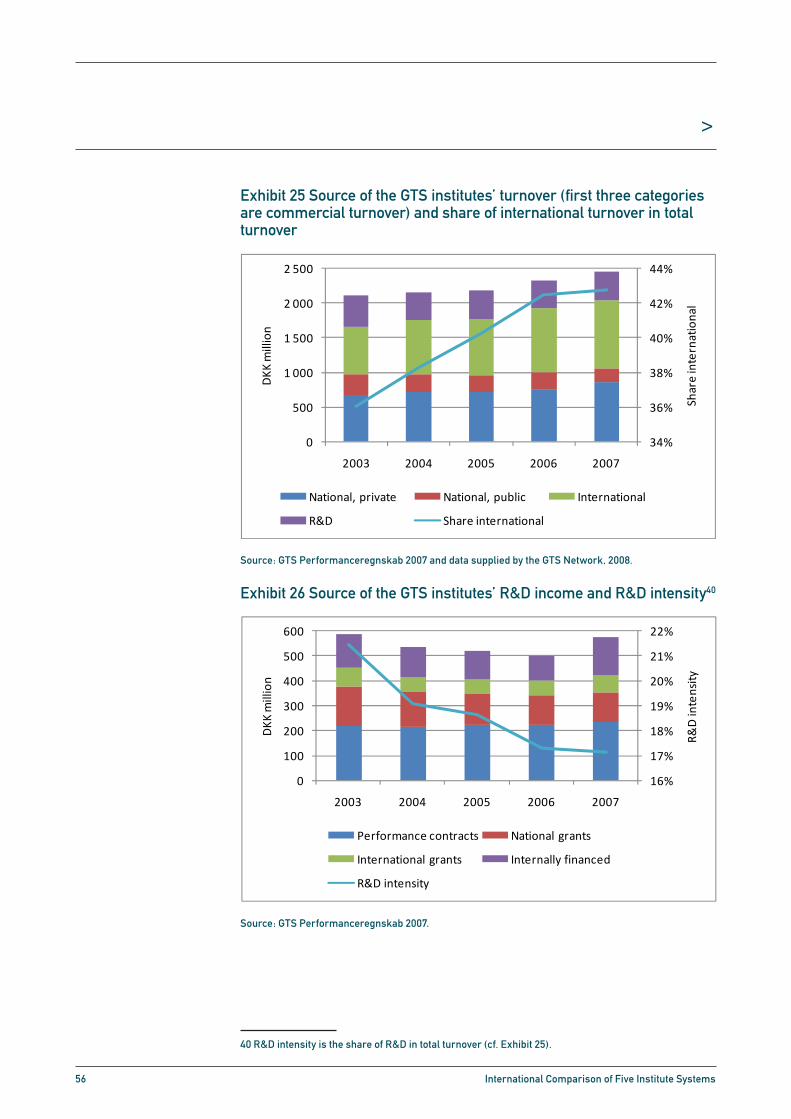
56 International Comparison of Five Institute Systems
>
Exhibit 25 Source of the GTS institutes’ turnover (first three categories are commercial turnover) and share of international turnover in total turnover
Source: GTS Performanceregnskab 2007 and data supplied by the GTS Network, 2008.
Exhibit 26 Source of the GTS institutes’ R&D income and R&D intensity40
Source: GTS Performanceregnskab 2007.
40 R&D intensity is the share of R&D in total turnover (cf. Exhibit 25).
International Comparison of Five Institute Systems 46
Exhibit 25 Source of the GTS institutes’ turnover (first three categories are commercial turnover) and share of international turnover in total turnover. Source: GTS Performanceregnskab 2007 and data supplied by the GTS Net-work, 2008.
34%
36%
38%
40%
42%
44%
0
500
1 000
1 500
2 000
2 500
2003 2004 2005 2006 2007
Share international
DKK
million
National, private National, public International
R&D Share international
Exhibit 26 Source of the GTS institutes’ R&D income and R&D intensity41.Source: GTS Performanceregnskab 2007.
16%
17%
18%
19%
20%
21%
22%
0
100
200
300
400
500
600
2003 2004 2005 2006 2007
R&D intensity
DKK
million
Performance contracts National grants
International grants Internally financed
R&D intensity
In 2007 the GTS System’s overall R&D investment increased significantly in absolute terms, but this increase is due to the institutes’ internal funding (e.g. past profits). (The R&D category in Exhibit 25 corresponds to Performance contracts + National grants + International grants in Exhibit 26.) Over the period studied, the R&D inten-sity is nevertheless in continuous decline, see Exhibit 26; the institutes’ goal is 20–
41 R&D intensity is the share of R&D in total turnover (cf. Exhibit 25).

57 International Comparison of Five Institute Systems
>
In 2007 the GTS System’s overall R&D investment increased significantly in absolute terms, but this increase is due to the institutes’ internal funding (e.g. past profits). (The R&D category in Exhibit 25 corresponds to Performance contracts + National grants + International grants in Exhibit 26.) Over the period studied, the R&D intensity is nevertheless in continuous decline, see Exhibit 26; the institutes’ goal is 20–25%41. According to the GTS System’s 2007 annual report, all institutes showed an increase of the internally financed R&D and this may be interpreted as a concerted effort to strengthen the institutes’ competence development.
Exhibit 27 shows the development of the GTS institutes’ international income and its share of total grants (National grants + International grants; cf. Exhibit 26) for 2003–2007. The EU’s framework programmes strongly dominate international income. In absolute terms, international income peaked in 2001 (in FP5: 1998–2002) and reached a low point in 2004 (in FP6: 2002–2006); it has gradually recovered in latter years. In relative terms, international income has rapidly gained in importance from a low point 2004. A limiting factor for the GTS institutes is the scarcity of available matching funding; in this respect, the situation has improved in FP7 since the co-funding requirement for institutes has decreased to 25% from the 50% that applied in previous FPs.
Exhibit 27 International income for R&D and its relative importance
Source: GTS Performanceregnskab 2007 and data supplied by the GTS Network, 2008.
41 GTS Performanceregnskab 2007.
International Comparison of Five Institute Systems 47
25%42. According to the GTS System’s 2007 annual report, all institutes showed an increase of the internally financed R&D and this may be interpreted as a concerted effort to strengthen the institutes’ competence development.
Exhibit 27 shows the development of the GTS institutes’ international income and its share of total grants (National grants + International grants; cf. Exhibit 26) for 2003–2007. The EU’s framework programmes strongly dominate international income. In absolute terms, international income peaked in 2001 (in FP5: 1998–2002) and reached a low point in 2004 (in FP6: 2002–2006); it has gradually recovered in latter years. In relative terms, international income has rapidly gained in importance from a low point 2004. A limiting factor for the GTS institutes is the scarcity of available matching funding; in this respect, the situation has improved in FP7 since the co-funding requirement for institutes has decreased to 25% from the 50% that applied in previous FPs.
Exhibit 27 International income for R&D and its relative importance. Source: GTS Performanceregnskab 2007 and data supplied by the GTS Network, 2008.
26%
28%
30%
32%
34%
36%
0
50
100
150
200
250
2000 2001 2002 2003 2004 2005 2006 2007
Share international
DKK
million
Total grants International grants Share international
A.4.2. State funding principles
The income received through the performance contracts are to be used to create, de-velop and disseminate new and existing knowledge and technology to businesses and public institutions, but funding may also be used to invest in technological infrastruc-ture, e.g. laboratories, equipment and testing facilities. The income has declined in the period 2003–2007 (from 10.3% of total turnover to 9.5%) and in 2007, the GTS insti-tutes received DKK234 millions, which corresponds to 55% of total R&D income. Con-sequently, the performance contracts constitute an important income source for com-petence development.
The success criteria of the performance contracts are43:
The extent and impact of dissemination of knowledge
Service to SMEs and especially the number of new customers
42 GTS Performanceregnskab 2007. 43 “Retningslinier for Godkendt Teknologisk Service i Danmark”, Ministeriet for Videnskab,
Teknologi og Udvikling, 2005: 21.

58 International Comparison of Five Institute Systems
>
A.4.2. State funding principlesThe income received through the performance contracts are to be used to create, develop and disseminate new and existing knowledge and technology to businesses and public institutions, but funding may also be used to invest in technological infrastructure, e.g. laboratories, equipment and testing facilities. The income has declined in the period 2003–2007 (from 10.3% of total turnover to 9.5%) and in 2007, the GTS institutes received DKK234 millions, which corresponds to 55% of total R&D income. Consequently, the performance contracts constitute an important income source for competence development.
The success criteria of the performance contracts are42:
The extent and impact of dissemination of knowledge• Service to SMEs and especially the number of new customers• The development of new services that create value and innovation in • enterprisesStrategic cooperation and partnerships with universities and other • research organisationsCooperation with leading foreign knowledge environments and use of • international knowledgeParticipation in projects focusing on technological infrastructure and • which can be characterised as a public good, e.g. within the areas of standardisations, metrology and education
A.5. Capabilities
A.5.1. PersonnelIn 2007, the GTS institutes had slightly more than 2 900 employees, up from a low point in 2005, see Exhibit 28. Since 2005, the growth rate has been around 4%, although it should be kept in mind that in 2007, AgroTech and the Alexandra Institute added 90 employees to the group, thus accounting for 70% of the increase in employees between 2006 and 2007. The share of employees with a doctorate increases over the period and the growth rate also increases. The same applies for employees with an MSc degree or higher (i.e. including those with doctorates). Apparently, the GTS institutes strive to increase the level of education, which may be required in order to stay up to date and be at the forefront of technological developments.
42 “Retningslinier for Godkendt Teknologisk Service i Danmark”, Ministeriet for Videnskab, Teknologi og
Udvikling, 2005: 21.

59 International Comparison of Five Institute Systems
>
Exhibit 28 Educational background of GTS personnel
Source: GTS Performanceregnskab 2007
A.5.2. R&D effortAs illustrated by Exhibit 26, the institutes’ research intensity has declined continuously between 2003 and 2007, which is a worrying development. Although admittedly a blunt indicator, the institutes’ participation in collaborative R&D projects declined from 526 in 2006 to 455 in 2007; correspondingly, participation in international collaborative R&D projects declined from 179 to 127. Participation in innovation consortia remained unchanged at 3443. Participation in projects with the EU’s framework programmes has varied significantly. In FP5 (1998–2002), the GTS institutes participated in 25 projects and in FP6 (2002–2006) in 73 projects; so far, they are involved in 8 projects in FP7 (2007–2013)44. Exhibit 27 illustrates that income – a more relevant indicator than number of participations – has varied notably over the years.
A.5.3. Competence developmentCompetence development within the GTS institutes is the responsibility of each institute and is mainly achieved through internal and collaborative R&D projects. Participation in collaborative projects within the EU’s research programmes, and the resulting networks, is seen as an important means of competence development45.
43 GTS Performanceregnskab 2007.
44 Data supplied by the GTS Network, 2008.
45 Interview Ragnar Heldt Nielsen, Director GTS network, 2008-10-16.
International Comparison of Five Institute Systems 48
The development of new services that create value and innovation in enterprises
Strategic cooperation and partnerships with universities and other research or-ganisations
Cooperation with leading foreign knowledge environments and use of interna-tional knowledge
Participation in projects focusing on technological infrastructure and which can be characterised as a public good, e.g. within the areas of standardisations, metrology and education
A.5. Capabilities
A.5.1. Personnel
In 2007, the GTS institutes had slightly more than 2 900 employees, up from a low point in 2005, see Exhibit 28. Since 2005, the growth rate has been around 4%, al-though it should be kept in mind that in 2007, AgroTech and the Alexandra Institute added 90 employees to the group, thus accounting for 70% of the increase in employ-ees between 2006 and 2007. The share of employees with a doctorate increases over the period and the growth rate also increases. The same applies for employees with an MSc degree or higher (i.e. including those with doctorates). Apparently, the GTS insti-tutes strive to increase the level of education, which may be required in order to stay up to date and be at the forefront of technological developments.
Exhibit 28 Educational background of GTS personnel. Source: GTS Perfor-manceregnskab 2007
0
500
1 000
1 500
2 000
2 500
3 000
2003 2004 2005 2006 2007
Num
ber of employee
s
Doctorates MSc or equivalent Other technical Administrative
A.5.2. R&D effort
As illustrated by Exhibit 26, the institutes’ research intensity has declined continu-ously between 2003 and 2007, which is a worrying development. Although admittedly a blunt indicator, the institutes’ participation in collaborative R&D projects declined from 526 in 2006 to 455 in 2007; correspondingly, participation in international col-laborative R&D projects declined from 179 to 127. Participation in innovation consor-tia remained unchanged at 3444. Participation in projects with the EU’s framework programmes has varied significantly. In FP5 (1998–2002), the GTS institutes partici-
44 GTS Performanceregnskab 2007.

60 International Comparison of Five Institute Systems
>
A.6. Knowledge dissemination
A.6.1. Dissemination activities to and cooperation with customersDissemination of knowledge and information is an integral part of the services offered by the GTS institutes (see Section 10.5). Apart from these services, the GTS institutes are engaged in several other types of knowledge dissemination activities, including so-called “non-commercial” interaction with its customers. By paying a nominal membership fee, customers may participate in a range of activities, such as branch-specific networks, branch-specific and/or target-oriented newsletters, establishment of branch- and product-specific homepages, non-scientific publications, meetings and “open-house” events, professional and technical committees attached to the institutes, see Table 7.
Table 7 Examples of GTS institutes’ “non-commercial” dissemination activities
Source: Material supplied by the GTS Network, 2008.
A.6.2. University cooperationCooperation between the GTS institutes and Danish universities (as well as government research institutes) is an important part of the GTS System’s assignment, since it is partly their task to constitute a bridge between academia and industry. In 2007, there were 312 informal and 248 formal cooperation activities taking place between GTS institutes and Danish universities.
Activity No. of activities
Networks and professional committees
70 different named initiatives
Newsletters that are technology or target group specific
40 newsletters
Homepages for specific activities or initiatives outside the GTS institutes’ own homepages
Approximately 40
Publications or articles that are of non-scientific character
Approximately 1 000 independent contributions in more than 40 professional journals. Besides, a large number of dictionaries, educational materials etc. are up-dated on a regular basis.
Specific events A large number of events at trade fairs are organised by the institutes or by business associations. In addition, there are thematic days, international meetings and seminars.

61 International Comparison of Five Institute Systems
>
According to the GTS network, the number of cooperation activities should be seen in light of the recent university reform that reduced the number of universities from 12 to 846.
Cooperation through ownershipOne form of cooperation between GTS institutes and universities is co-ownership of the institutes. Thus, the Danish University of Technology (DTU) owns both DFM and Bioneer, whereas the Alexandra Institute is partly owned by Århus University. Another form is where both a GTS institute and a university are co-owners of other organisations. Copenhagen University and DHI are co-owners in Geographic Resource Analysis A/S (GRAS) while FORCE, Risø–DTU and Det Norske Veritas are co-owners in BladeTest Centre A/S47.
Formalised cooperation contractsContracts between GTS institutes and their cooperation partners include both general agreements and single contracts. An example of a general agreement is the one between the GTS network and DTU from 2004. This contract includes exchange of employees and trainees, cooperation in R&D, networks and advisory work in connection with business projects. Most often the contracts involve renting or use of premises and laboratory facilities.
Many cooperation projects are established based on public project funding, e.g. through the Council for Technology and Innovation or the High-Technology Foundation, but there are also examples where the cooperation is based on internal funding.
The GTS institutes are also engaged in cooperation involving education and supervision of students. Starting in 2008 the institutes can participate in education of business PhD students. 48
Innovation networksThrough the Council for Technology and Innovation, the GTS System is engaged in cooperation with the aim of enhancing collaboration with industry, knowledge institutions, universities and colleges. At present, there are 27 such networks and GTS institutes participate in 18. GTS institutes are coordinators in five of these networks49. There are three types of innovation networks:
High-technology networks• Regional technology centres• ICT competence centres•
46 Material supplied by the GTS Network, 2008.
47 Ibid.
48 Ibid.
49 Ibid.

62 International Comparison of Five Institute Systems
>
Innovation consortiaAn innovation consortium is a flexible framework for concrete cooperation projects in which the GTS institutes play the role of knowledge mediators. The aim of the innovation consortia is to strengthen and increase the innovation pace in Danish industry. The GTS institutes have two tasks in the innovation consortia. First, they should contribute to the implementation of basic technology in industry. Second, they should develop and disseminate the knowledge created within the consortia to other Danish enterprises in the form of commercial services.50
A.6.3. PublicationsIn terms of publications, the GTS System produces a modest output considering its R&D turnover, see Exhibit 29; in recent years, production of both scientific and conference papers has decreased, while at the same time the number of theses has increased. The decline in scientific and conference papers should be seen in light of the decrease in R&D funding between 2003 and 2006 (cf. Exhibit 26)51.
Exhibit 29 The GTS institutes’ publications. Source: GTS Performanceregnskab 2007.
A.6.4. Patents and licencesTable 8 indicates that in recent years, the number of patent applications has remained stable between 15 and 20. Meanwhile, the number of licensing agreements increased sharply from 26 to 407 between 2006 and 2007 due to one of the institutes experiencing a major breakthrough with one of their licences.
50 Ibid.
51 GTS Performanceregnskab 2007.
International Comparison of Five Institute Systems 51
creased. The decline in scientific and conference papers should be seen in light of the decrease in R&D funding between 2003 and 2006 (cf. Exhibit 26)52.
Exhibit 29 The GTS institutes’ publications. Source: GTS Performanceregn-skab 2007.
0
50
100
150
200
250
2003 2004 2005 2006 2007
Num
ber of pub
lications
Conference papers Scientific papers Theses
A.6.4. Patents and licences
Table 8 indicates that in recent years, the number of patent applications has remained stable between 15 and 20. Meanwhile, the number of licensing agreements increased sharply from 26 to 407 between 2006 and 2007 due to one of the institutes experienc-ing a major breakthrough with one of their licences.
Table 8 The GTS System’s patent applications, licences and spin-offs. Source: GTS Performanceregnskab 2007.
2003 2004 2005 2006 2007
Patent applications 15 17 15 17 20
Licences 2 5 26 407
Spin-offs established by the GTS institutes themselves 2 1 2 3 3
Spin-offs with start-up help from the GTS institutes 1 0 3 4 4
A.6.5. Spin-offs
In their reports on spin-offs, the GTS institutes make a difference between spin-offs established by the institutes themselves and with the help from the institutes, see Ta-ble 8. The number of spin-offs established by the institutes themselves ranges from 1 to 3 per year, while the number of spin-offs that have received assistance in establish-ing themselves has been between 3 and 4 per year for the last four years.
52 GTS Performanceregnskab 2007.

63 International Comparison of Five Institute Systems
>
Table 8 The GTS System’s patent applications, licences and spin-offs
Source: GTS Performanceregnskab 2007.
A.6.5. Spin-offsIn their reports on spin-offs, the GTS institutes make a difference between spin-offs established by the institutes themselves and with the help from the institutes, see Table 8. The number of spin-offs established by the institutes themselves ranges from 1 to 3 per year, while the number of spin-offs that have received assistance in establishing themselves has been between 3 and 4 per year for the last four years.
A.7. Appendix
A.7.1. Mission, objectives and valuesThe GTS institutes state their mission as follows52:
The mission of the GTS institutes is to convert knowledge to value. We accomplish this by working in the borderland between business, science, education and authorities.
This overall mission is specified further with the following five objectives:“…to be the world’s most efficient network of research and technology -organisations, setting the standard for the technological infrastructure of other regions”“…to position themselves among the international knowledge elite, and -within designated cutting-edge competencies, each GTS institute has to rank among the top three in the world”“…to develop new, innovative products and services, satisfying -the requirements of the business sector and society and to ensure awareness of new strategically important technologies”“…to maintain and develop the role of the GTS institutes, as the core -of the technological infrastructure in Denmark.”
52 www.teknologiportalen.dk.
2003 2004 2005 2006 2007
Patent applications 15 17 15 17 20
Licences 2 5 26 407
Spin-offs established by the GTS institutes themselves 2 1 2 3 3
Spin-offs with start-up help from the GTS institutes 1 0 3 4 4

64 International Comparison of Five Institute Systems
>
The GTS network has developed five core values to guide the daily cooperation with customers and partners53:
Customer-oriented: The GTS institutes are close to the customers and • base the services on their requirement. We combine advanced knowledge with practical experience and speak a language, which the customers understand. We work for public authorities and private businesses of any size.Independent: The GTS institutes are private institutions, independent • of political and financial interest. We use this independency in our co-operation with national and international authorities and other partners to provide efficient services and consultancy to our customers.Future-oriented: Together, the GTS institutes offer a unique technological • broadness which qualifies us to accommodate multi-technological solutions of the future.Research-based: The GTS institutes advise the customers on the basis of • international knowledge and research. We develop and maintain strong innovation environments and capital-intensive facilities to the benefit of our customers. We implement research and development projects – frequently on the basis of international networks, bringing together new partners.Beneficial to society: The GTS institutes are non-profit institutions and • constitute the core of the Danish technological infrastructure. Surplus earnings are invested exclusively in research, development and innovation
A.7.2. Economic, organisational and professional requirementsThe GTS institutes have to comply with the following requirements:
Public utility services: the GTS institutes have to offer services that are to • benefit for industry and society in general. Moreover, these services have to be offer on market-regulated conditions.A satisfactory organisation: the GTS institutes should be organized as • independent organisations, either as self-owned institutes or limited companies. The institutes should be managed by a board that is professionally and economically responsible.A high scientific level and capacity to knowledge dissemination: The • GTS institutes should develop scientific competence that corresponds to an international standard within the institutes’ core areas and create a relevant critical mass within the professional competencies. The GTS institutes should develop relations with universities and RTOs both nationally and internationally so that they are able to offer Danish firms access to the latest knowledge in relevant fields.Documented relevance for industry and society: the creation and • dissemination of knowledge that is of broad interest for industry and society and which can be documented by a broad demand of services offered at market-adjusted prices. Other ways of measuring relevance are firms’ and authorities’ engagement in the institutes’ boards or research project.
53 “From knowledge to value”, www.teknologiportalen.dk.

65 International Comparison of Five Institute Systems
>
An economically satisfactory basis: The GTS institutes should be • economically robust. The GTS institute should develop a good basis for earnings and work with efficiency and productivity.Strategy and goal for the institutes’ development and requirements of • reporting: The GTS institutes should develop clearly defined strategies and goals that assures the institutes’ scientific and economically development. The GTS institutes should be able to report their results according to a number of performance criteria on a yearly basis. Regulations and changes should be approved by the Council for • Technology and Innovation: The regulations of the institutes should assure a supply of technological services that is independent and beneficial for society. They should also assure a consolidation of the institutes and that any surplus earnings are reinvested in the institutes. If an institute is sold or dissolved the regulations should assure that the means are invested in similar organisations/services.

66 International Comparison of Five Institute Systems
>
A.7.3. Overview of technological profiles
Institute Technological Profile
AgroTech Agricultural technology Biomass processing technology for e.g. energy production,
pharmaceuticals Sensor technology Information and communication technology Environmental and energy technology Rural development Horticultural technology Testing and documentation of new technologies
Alexandra Institute Advanced Visualisation & interaction Business understanding Interactive spaces IT security New Ways of Working Pervasive healthcare Pervasive positioning Software infrastructure
Bioneer BiomedicineBiomedical technologyBiotechnology
DBI Fire Safety Engineering
DELTA ElectronicsMicroelectronicsSoftware TechnologyLight OpticsAcousticsVibration and sensor systems
DFM Metrology within:NanometrologyElectricityElectrochemistryAcousticsOptics Mathematical methods
➜€
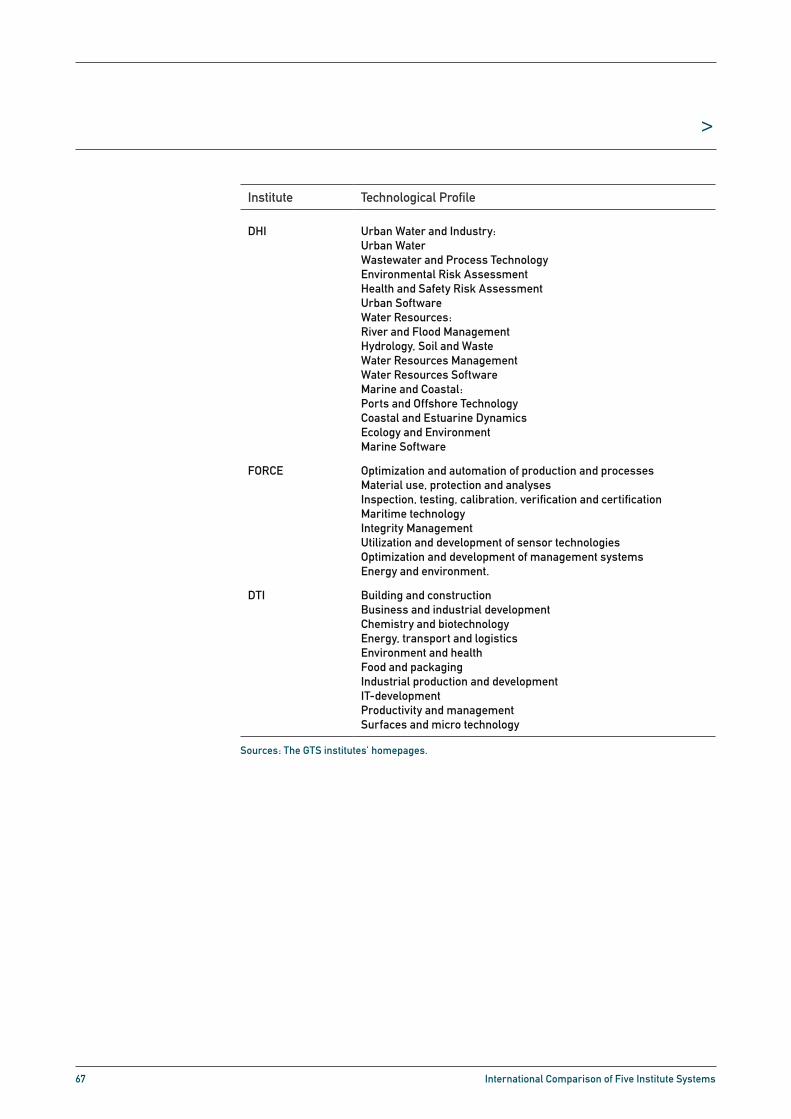
67 International Comparison of Five Institute Systems
>
DHI Urban Water and Industry:Urban Water Wastewater and Process Technology Environmental Risk Assessment Health and Safety Risk Assessment Urban Software Water Resources: River and Flood Management Hydrology, Soil and Waste Water Resources Management Water Resources Software Marine and Coastal: Ports and Offshore Technology Coastal and Estuarine Dynamics Ecology and Environment Marine Software
FORCE Optimization and automation of production and processes Material use, protection and analyses Inspection, testing, calibration, verification and certification Maritime technology Integrity Management Utilization and development of sensor technologies Optimization and development of management systems Energy and environment.
DTI Building and construction Business and industrial development Chemistry and biotechnology Energy, transport and logistics Environment and healthFood and packaging Industrial production and development IT-development Productivity and managementSurfaces and micro technology
Sources: The GTS institutes’ homepages.
Institute Technological Profile

68 International Comparison of Five Institute Systems
>
B.1. National business structureExhibit 30 shows that Sweden’s most important private sectors are financial intermediation, manufacturing, and wholesale and retail trade, while Exhibit 31 illustrates that there is a very large number of small enterprises in the agriculture sector, contrary to what one might expect for an industrialised country. From Exhibit 32 one may deduce that the most important subsector in terms of turnover within the mining, manufacturing and energy sectors is vehicles, i.e. mainly cars, trucks and buses, followed by several sectors of more or less equal importance, which thus constitute a wide industrial base from a sectoral perspective; these subsectors are metals, machinery, electrical equipment, paper and pulp, power generation and chemicals (mainly pharmaceuticals).
Exhibit 30 Share of total value added by sector, 2007.
Source: Eurostat.
This wide industry base and a historically based reliance on a handful of MNCs that dominates industry result in close to 75% of the nation’s total R&D being financed by industry. In fact, 20 firms account for close to 70% of the total business R&D investment, which is primarily concentrated to automotive, telecommunications (ICT) and pharmaceuticals (cf. subsectors previously mentioned).54
54 European Trend Chart on Innovation: Annual Innovation Policy Trends and Appraisal Report Sweden
2006, European Commission, 2006.
Appendix B. The IRECO Group
International Comparison of Five Institute Systems 56
Appendix BThe IRECO Group
B.1. National business structure
Exhibit 30 shows that Sweden’s most important private sectors are financial interme-diation, manufacturing, and wholesale and retail trade, while Exhibit 31 illustrates that there is a very large number of small enterprises in the agriculture sector, contrary to what one might expect for an industrialised country. From Exhibit 32 one may deduce that the most important subsector in terms of turnover within the mining, manufac-turing and energy sectors is vehicles, i.e. mainly cars, trucks and buses, followed by several sectors of more or less equal importance, which thus constitute a wide indus-trial base from a sectoral perspective; these subsectors are metals, machinery, electri-cal equipment, paper and pulp, power generation and chemicals (mainly pharmaceuti-cals).
Exhibit 30 Share of total value added by sector, 2007. Source: Eurostat.
Agriculture, fishing; 2%
Manufacturing24%
Construction5%
Wholesale and retail trade
19%
Financial intermediation
24%
Public administration,
defence26%
This wide industry base and a historically based reliance on a handful of MNCs that dominates industry result in close to 75% of the nation’s total R&D being financed by industry. In fact, 20 firms account for close to 70% of the total business R&D invest-ment, which is primarily concentrated to automotive, telecommunications (ICT) and pharmaceuticals (cf. subsectors previously mentioned).55
55 European Trend Chart on Innovation: Annual Innovation Policy Trends and Appraisal Re-port Sweden 2006, European Commission, 2006.
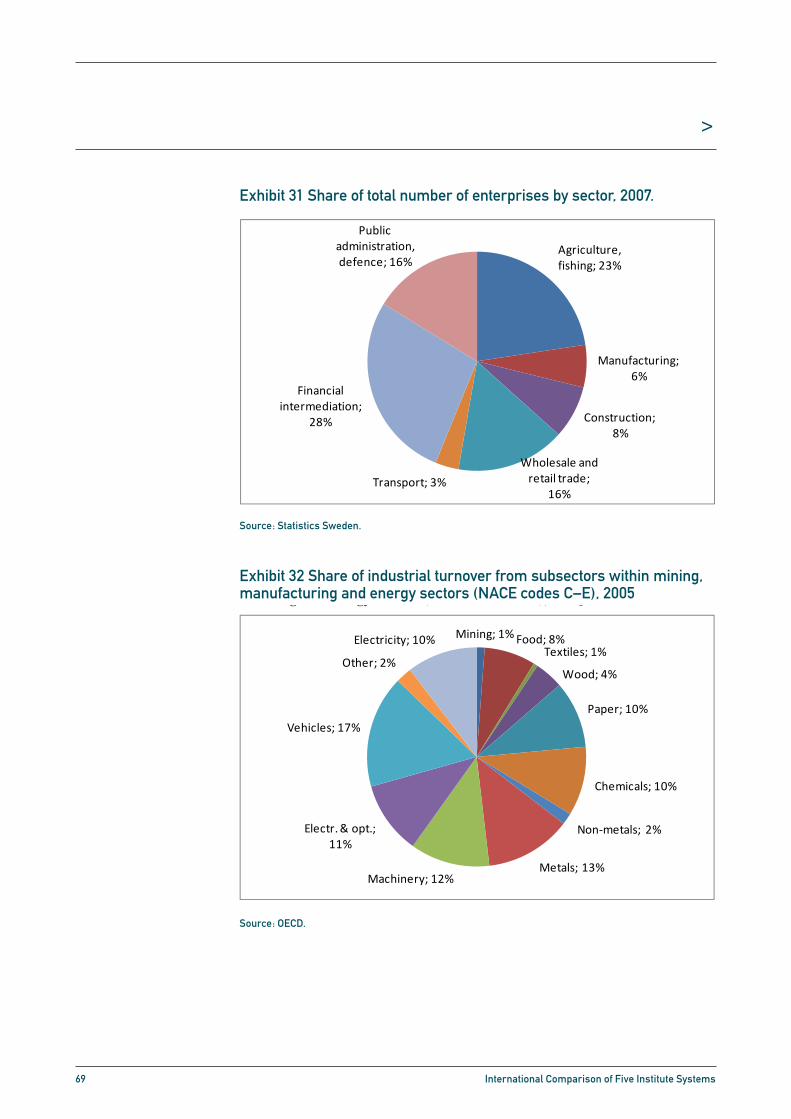
69 International Comparison of Five Institute Systems
>
Exhibit 31 Share of total number of enterprises by sector, 2007.
Source: Statistics Sweden.
Exhibit 32 Share of industrial turnover from subsectors within mining, manufacturing and energy sectors (NACE codes C–E), 2005
Source: OECD.
International Comparison of Five Institute Systems 57
Exhibit 31 Share of total number of enterprises by sector, 2007. Source: Statis-tics Sweden.
Agriculture, fishing; 23%
Manufacturing; 6%
Construction; 8%
Wholesale and retail trade;
16%Transport; 3%
Financial intermediation;
28%
Public administration, defence; 16%
Exhibit 32 Share of industrial turnover from subsectors within mining, manu-facturing and energy sectors (NACE codes C–E), 2005. Source: OECD.
Mining; 1%Food; 8%Textiles; 1%
Wood; 4%
Paper; 10%
Chemicals; 10%
Non‐metals; 2%
Metals; 13%Machinery; 12%
Electr. & opt.; 11%
Vehicles; 17%
Other; 2%
Electricity; 10%
The 2006 Trend Chart Report56 identifies four main challenges for the Swedish inno-vation system:
7. Slow creation of knowledge-intensive jobs
8. Gap between industry and academia
9. Need for international cooperation and competitiveness strategies
10. Lack of systematic policy learning and policy coordination
56 European Trend Chart on Innovation: Annual Innovation Policy Trends and Appraisal Re-port Sweden 2006, European Commission, 2006.

70 International Comparison of Five Institute Systems
>
The 2006 Trend Chart Report55 identifies four main challenges for the Swedish innovation system:
Slow creation of knowledge-intensive jobs7. Gap between industry and academia8. Need for international cooperation and competitiveness strategies9.
Lack of systematic policy learning and policy coordination10.
The first challenge is often referred to as the “Swedish paradox”, i.e. despite high investments in knowledge and R&D, output is weak in terms of an unsatisfactory level of commercialisation of R&D. A recent policy response is the appropriation of SEK200 million to the IRECO institutes. The investment in industrial research institutes is also a policy response to the second challenge as the institutes focusing on applied science are expected to act as a bridge between industry and academia. Policy measures targeting the third challenge are under discussion, but no specific measures have been implemented yet. The last challenge is a result of the dual structure of policy-formulating ministries and independent implementing agencies.
The enterprise size classification employed by Statistics Sweden does not easily lend itself to straightforward calculation of the ratio of SMEs, see Exhibit 33. However, the result of whether the enterprises in the 200–499 category are considered to be SMEs or not is entirely marginal; the proportion of SME thus is in the range 99.8–99.9%.
Exhibit 33 Number of enterprises by number of employees, 2007Source: Statistics Sweden.
55 European Trend Chart on Innovation: Annual Innovation Policy Trends and Appraisal Report Sweden
2006, European Commission, 2006.
International Comparison of Five Institute Systems 58
The first challenge is often referred to as the “Swedish paradox”, i.e. despite high in-vestments in knowledge and R&D, output is weak in terms of an unsatisfactory level of commercialisation of R&D. A recent policy response is the appropriation of SEK200 million to the IRECO institutes. The investment in industrial research institutes is also a policy response to the second challenge as the institutes focusing on applied science are expected to act as a bridge between industry and academia. Policy measures tar-geting the third challenge are under discussion, but no specific measures have been implemented yet. The last challenge is a result of the dual structure of policy-formulating ministries and independent implementing agencies.
The enterprise size classification employed by Statistics Sweden does not easily lend itself to straightforward calculation of the ratio of SMEs, see Exhibit 33. However, the result of whether the enterprises in the 200–499 category are considered to be SMEs or not is entirely marginal; the proportion of SME thus is in the range 99.8–99.9%.
Exhibit 33 Number of enterprises by number of employees, 2007. Source: Sta-tistics Sweden.
699 936
170 665
37 100 19 843 11 445 3 464 1 587 912 8490
100 000
200 000
300 000
400 000
500 000
600 000
700 000
Num
ber of enterprises
Number of employees
B.2. Introduction
The Swedish RTO sector is in the midst of a comprehensive restructuring process, wherein IRECO Holding AB (Institute for Research and Competence Holding) is a key actor that eventually is planned to include the bulk of Sweden’s RTOs. Since January 2007, IRECO is fully owned by the government (Staten). On October 23 2008, the government presented its new Research and Innovation Bill, which included the proposition to strengthen the Swedish RTO sector by restructuring the existing IRECO into a new holding company with a larger budget and a strengthened mandate57. Thus, the government appropriates SEK200 million to the industry research sector. At pre-sent, the Swedish industry research sector is organised into a quartet, a so-called four-leaf clover:
Swerea
Swedish ICT Research (SICT)
STFI-Packforsk
SP Technical Research Institute of Sweden (SP)
57 “Ett lyft för forskning och innovation”, Government Bill 2008/09:50, 2008.

71 International Comparison of Five Institute Systems
>
B.2. IntroductionThe Swedish RTO sector is in the midst of a comprehensive restructuring process, wherein IRECO Holding AB (Institute for Research and Competence Holding) is a key actor that eventually is planned to include the bulk of Sweden’s RTOs. Since January 2007, IRECO is fully owned by the government (Staten). On October 23 2008, the government presented its new Research and Innovation Bill, which included the proposition to strengthen the Swedish RTO sector by restructuring the existing IRECO into a new holding company with a larger budget and a strengthened mandate56. Thus, the government appropriates SEK200 million to the industry research sector. At present, the Swedish industry research sector is organised into a quartet, a so-called four-leaf clover:
Swerea• Swedish ICT Research (SICT)• STFI-Packforsk• SP Technical Research Institute of Sweden (SP)•
Exhibit 34 illustrates that the IRECO Group is majority owner of SICT, and part owner of Swerea and STFI-Packforsk. Mefos is scheduled to become part of the Swerea sub-Group (in fact, it already has been, but was temporarily sold off at end of 2007). IRECO has no ownership in SP, but the RTO restructuring process has long assumed that it eventually would and the Research and Innovation Bill proposes that this assumption now is to be effected; hence, SP is also subject to the government’s new appropriation of SEK200 million.
Exhibit 34 IRECO Holding’s ownership structure in October 2008.
Source: www.ireco.se.
56 “Ett lyft för forskning och innovation”, Government Bill 2008/09:50, 2008.
International Comparison of Five Institute Systems 59
Exhibit 34 illustrates that the IRECO Group is majority owner of SICT, and part owner of Swerea and STFI-Packforsk. Mefos is scheduled to become part of the Swerea sub-Group (in fact, it already has been, but was temporarily sold off at end of 2007). IRECO has no ownership in SP, but the RTO restructuring process has long assumed that it eventually would and the Research and Innovation Bill proposes that this as-sumption now is to be effected; hence, SP is also subject to the government’s new ap-propriation of SEK200 million.
Exhibit 34 IRECO Holding’s ownership structure in October 2008. Source: www.ireco.se.
This case study focuses on the changes that are taking place in the Swedish RTO sector and the new IRECO holding company that is to be established in the beginning of 2009. The design of a new RTO sector has its base in two investigations; a study com-missioned by the government and carried out by the Royal Institute of Technology (KTH)58 and a subsequent inter-departmental action plan59.
B.2.1. Business concept and strategy
This section reports on the vision and goals set in IRECO’s present strategy document. However, a revised strategy, which takes the new commission put forth in the Re-search and Innovation Bill into account, will be developed before the end of 200860.
According to its present strategy, IRECO’s vision and conviction are61:
58 Sverker Sörlin, “En ny institutionssektor – en analys av industriforskningsinstitutens villkor och framtid ur ett närings- och innovationspolitiskt perspektiv”, 2006.
59 “Handlingsplan för en ny institutssektor”, Ds 2007:39, 2007. 60 Interview with Peter Holmstedt, CEO IRECO Holding, 2008-10-17. 61 “Vision, mål och strategier”, adopted by IRECO Holding’s Board on 14 January 2008. Annual report IRECO Holding, 2007.

72 International Comparison of Five Institute Systems
>
This case study focuses on the changes that are taking place in the Swedish RTO sector and the new IRECO holding company that is to be established in the beginning of 2009. The design of a new RTO sector has its base in two investigations; a study commissioned by the government and carried out by the Royal Institute of Technology (KTH)57 and a subsequent inter-departmental action plan58.
B.2.1. Business concept and strategyThis section reports on the vision and goals set in IRECO’s present strategy document. However, a revised strategy, which takes the new commission put forth in the Research and Innovation Bill into account, will be developed before the end of 200859.
According to its present strategy, IRECO’s vision and conviction are60:
Excellent industrial research contributes to Swedish world-class competitiveness.
Strengthened competitiveness for growth in Sweden with a unified national institute sector for industrial research that is an efficient environment for cooperation, research and development environment for industry and universities.
The strategy’s six objectives for 2012 focus on restructuring of the holding company and its subsidiaries. These objectives are in line with the suggestions put forth in the inter-departmental action plan developed in 200861.
The establishment of a new holding company (NHC) with expanded • mandate by 1 July 2008 and a fully developed structure in 2010The NHC will be an explicit national actor developing the institute sector • and be a spokesperson for the institute towards ministries, authorities and in international and EU contextsThe NHC will have ensured industry’s commitment to the development of • the institutes through active participation and development of processes that take industry’s needs into considerationWithin the NHC, the institutes will have developed strategies for large • enterprises and SMEs with focus on development and innovation excellence within industrially relevant fieldsThe NHC will have contributed to efficient and complementary • cooperation with clear roles for institutes, universities and university colleges, in cluster projects and in programmes
57 Sverker Sörlin, “En ny institutionssektor – en analys av industriforskningsinstitutens villkor och
framtid ur ett närings- och innovationspolitiskt perspektiv”, 2006.
58 “Handlingsplan för en ny institutssektor”, Ds 2007:39, 2007.59 Interview with Peter Holmstedt, CEO IRECO Holding, 2008-10-17.
60 “Vision, mål och strategier”, adopted by IRECO Holding’s Board on 14 January 2008. Annual report
IRECO Holding, 2007.
61 “Vision, mål och strategier”, adopted by IRECO Holding’s Board on 14 January 2008.

73 International Comparison of Five Institute Systems
>
The NHC will have contributed to the development of a new funding • model through increased cooperation with industry and partnerships with public funding agencies, such as the Knowledge Foundation and VINNOVA
Four strategy areas are highlighted as important to reach the objectives62:
Cooperation between institutes and industry: 11. The focal point is industrial needs and how these most efficiently are taken into consideration, e.g. the different needs of large enterprises and SMEs, or enterprises in different sectors. All research undertakings initiated by the NHC should be based on industrial needs
Cooperation between institutes and universities:12. The NHC should refine and make the institutes’ role as “commercialisation actors” in the innovation system more clear
Cooperation between institutes, universities and industry:13. The institutes should function as mediators between universities and industry in creation of creative knowledge environments
The institutes in the Swedish innovation system: The NHC should 14. develop and refine the institutes’ role in the innovation system through a prioritisation of the institutes’ activities, increased focus and more strategic cooperation
B.2.2. GovernanceAs previously mentioned, the Swedish RTO sector is in the midst of a comprehensive restructuring process into a four-leaf clover consisting of:
Swerea• Swedish ICT Research (SICT)• STFI-Packforsk• SP Technical Research Institute of Sweden (SP)•
Exhibit 34 illustrates the ownership pattern that will continue to change once the Research and Innovation Bill has been adopted in 2009. Given that the restructuring process for quite some time has assumed that SP eventually would become one of the clover leafs, this study has taken the liberty of assuming that it already is part of the IRECO Group when it comes to the data presented in Sections 10.5–10.5. The clover leafs are in effect sub-Groups, each consisting of several previously independent institutes, as illustrated by Exhibit 34. All institutes are now limited companies, but most were foundations in the past; in most cases, the conversion took place in the late 1990s. The companies’ shareholder agreements state that all profits are to be reinvested in the respective institute.
62 Ibid.

74 International Comparison of Five Institute Systems
>
SwereaThe Swerea Group is active within materials, process, product and production technologies. IRECO owns 49% of the shares in Swerea, while the remainder is owned by some 500 organisations (mainly private enterprises) through membership associations. Swerea in turn fully owns Swerea IVF, Swerea KIMAB, Swerea SICOMP and Swerea SWECAST. In recent years, Swerea IVF has acquired the previously independent institutes Swedish Ceramic Institute (2005) and IFP Research (2008), whereas Swerea KIMAB is the result of the 2004 merger of the Swedish Institute for Metals Research and the Corrosion Institute. Swerea’s headquarters is co-located with Swerea KIMAB in Stockholm on the main campus of KTH, with member institutes located in Mölndal (Göteborg), Jönköping, Piteå, Brest (France) and Kaunas (Lithuania). Until 2007, Swerea also included a minority share in the research institute MEFOS located in Luleå. MEFOS is currently 25% owned by IRECO and 75% by the Mefos Association. The plan is that MEFOS will again become part of Swerea.
Swedish ICT Research (SICT)IRECO owns 60% of the shares in Swedish ICT Research (SICT), while the other 40% are owned by industry through two separate associations in the hardware and software sectors. The SICT Group, which focuses on computer science, micro-electronics and optics, consists of Acreo and the Swedish Institute of Computer Science (SICS). SICS is in turn the parent company of the Interactive Institute, the Viktoria Institute, and the Santa Anna IT Research Institute. SICT’s headquarters is located in Kista (Stockholm) on a satellite campus of KTH, while the institutes are located in Göteborg, Eskilstuna, Linköping, Norrköping and Hudiksvall.
STFI-PackforskSTFI-Packforsk is active in the fields of paper, pulp, packaging, graphic media and logistics. IRECO owns 29% of the shares in STFI-Packforsk and the remainder is owned by associations and individual enterprises63. The institute’s headquarters is located in Stockholm on the main campus of KTH (across the street from Swerea’s headquarters and Swerea KIMAB). In addition, STFI-Packforsk is located in Kista, Örnsköldsvik, and it is represented in Trondheim, Norway, by PFI AS, a research company in which it is majority owner. Since August 2007, STFI-Packforsk is also represented in London through its subsidiary STFI-Packforsk UK Ltd.
SP Technical Research Institute of Sweden (SP)SP Technical Research Institute of Sweden is the largest research institute in Sweden. It offers services and research within the areas of building and construction, electronics and ICT, energy and environment, fire, risk and safety, foods, materials technology and chemistry, measurement technology and calibration, mechanical engineering and automotive industry, wood technology and wood construction. It was created in 1993 when the government converted Statens Provningsanstalt into a limited company.
63 Billerud AB, Korsnäs AB, Holmen AB, M-real Oy, Stora Enso Oy and Södra Cell AB.

75 International Comparison of Five Institute Systems
>
The institute has in recent years acquired a number of previously independent research institutes: Trätek (2003), Swedish Institute for Food and Biotechnology (SIK) (2004), Institute for Surface Chemistry (YKI) (2005), Concrete Institute (CBI) (2008) and Glass Research Institute (Glafo) (2008); the former three were previously owned by IRECO. SP has also acquired Svensk Maskinprovning AB (SMP), Swedish Institute for Technical Approval in Construction (SITAC) in recent years, but they are not quite to be considered as research institutes. SP’s headquarters is located in Borås in south-western Sweden, while the other institutes are located in Göteborg, Stockholm (on KTH’s main campus), Skellefteå, Växjö, Karlskrona, Uppsala, Alnarp and Umeå.
Management of IRECO and its subsidiariesBeing a limited company, it is managed as such. IRECO’s board may have between five and nine members64; at present, there are six members representing public authorities and industry; the chairman is an industry representative. The number of members is decided by the owners, i.e. the government. The nominating process follows the government’s owner policy, which means that it is the responsibility of the division for government-owned companies within the Ministry of Enterprise, Energy and Communications.
Since its creation, IRECO’s main task has been to manage the restructuring process and to interface with the institutes’ private owners, most of which are industry associations. In practice, the clover leaves act completely independently on the market, with no coordination from the IRECO Group management. On the same note, an individual institute has almost complete freedom within its clover leaf as long as it does not make a loss and its customers are content.
With the establishment of the new holding company (NHC) in 2009, Group governance will likely change. A federative structure is to be implemented, which implies that the NHC will take on a more active role as owner compared to IRECO. Although this is a development requested by both industry and institutes, there is of course some concern among the actors involved regarding how operative the NHC will become. The NHC will be responsible for the nomination of members of the institutes’ boards and the ambition is to pursue this work in the same way as in any publicly listed enterprise. An important aspect is that industry is given the possibility to influence developments. In addition, the NHC can elect to be represented on the board of institutes undergoing major restructuring.65
64 IRECO Bolagsstyrningsrapport 2007.
65 Interview with Peter Holmstedt, CEO IRECO Holding, 2008-11-05.
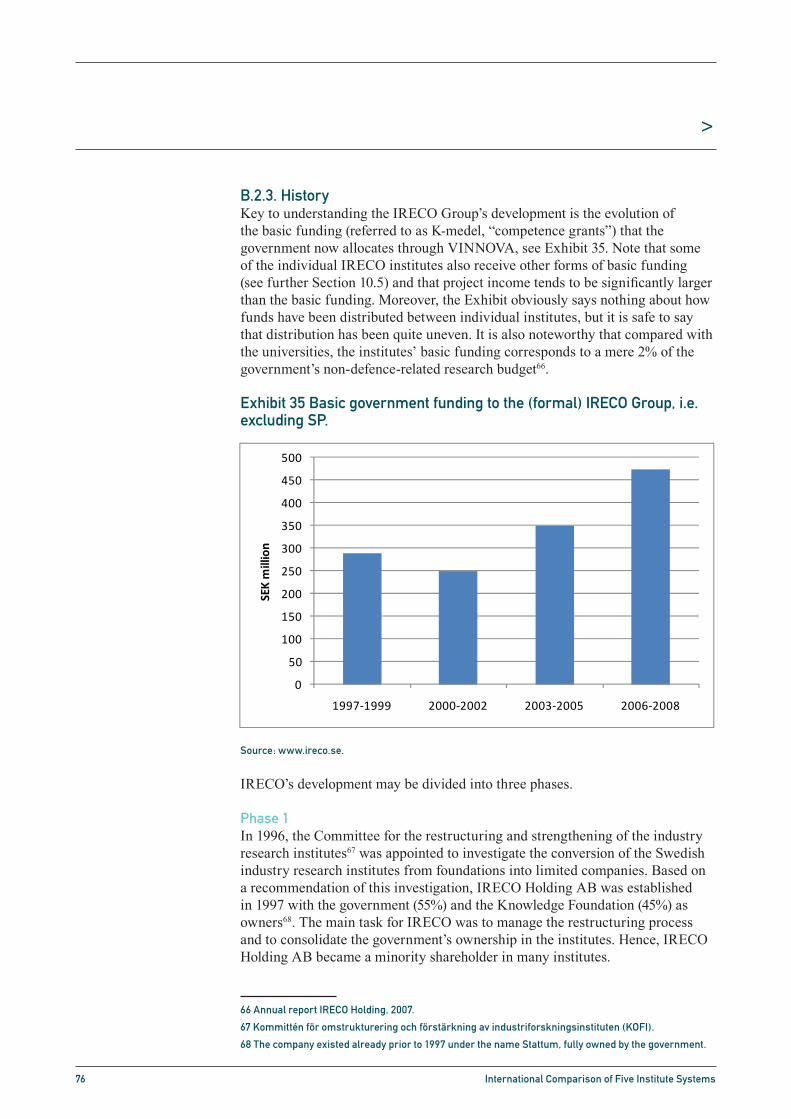
76 International Comparison of Five Institute Systems
>
B.2.3. HistoryKey to understanding the IRECO Group’s development is the evolution of the basic funding (referred to as K-medel, “competence grants”) that the government now allocates through VINNOVA, see Exhibit 35. Note that some of the individual IRECO institutes also receive other forms of basic funding (see further Section 10.5) and that project income tends to be significantly larger than the basic funding. Moreover, the Exhibit obviously says nothing about how funds have been distributed between individual institutes, but it is safe to say that distribution has been quite uneven. It is also noteworthy that compared with the universities, the institutes’ basic funding corresponds to a mere 2% of the government’s non-defence-related research budget66.
Exhibit 35 Basic government funding to the (formal) IRECO Group, i.e. excluding SP.
Source: www.ireco.se.
IRECO’s development may be divided into three phases.
Phase 1In 1996, the Committee for the restructuring and strengthening of the industry research institutes67 was appointed to investigate the conversion of the Swedish industry research institutes from foundations into limited companies. Based on a recommendation of this investigation, IRECO Holding AB was established in 1997 with the government (55%) and the Knowledge Foundation (45%) as owners68. The main task for IRECO was to manage the restructuring process and to consolidate the government’s ownership in the institutes. Hence, IRECO Holding AB became a minority shareholder in many institutes.
66 Annual report IRECO Holding, 2007.
67 Kommittén för omstrukturering och förstärkning av industriforskningsinstituten (KOFI).
68 The company existed already prior to 1997 under the name Stattum, fully owned by the government.
International Comparison of Five Institute Systems 63
noteworthy that compared with the universities, the institutes’ basic funding corre-sponds to a mere 2% of the government’s non-defence-related research budget67.
Exhibit 35 Basic government funding to the (formal) IRECO Group, i.e. ex-cluding SP. Source: www.ireco.se.
0
50
100
150
200
250
300
350
400
450
500
1997‐1999 2000‐2002 2003‐2005 2006‐2008
SEK million
IRECO’s development may be divided into three phases.
Phase 1 In 1996, the Committee for the restructuring and strengthening of the industry re-search institutes68 was appointed to investigate the conversion of the Swedish industry research institutes from foundations into limited companies. Based on a recommenda-tion of this investigation, IRECO Holding AB was established in 1997 with the gov-ernment (55%) and the Knowledge Foundation (45%) as owners69. The main task for IRECO was to manage the restructuring process and to consolidate the government’s ownership in the institutes. Hence, IRECO Holding AB became a minority shareholder in many institutes. IRECO also assisted the institutes in their conversion into limited companies and in adjusting to new requirements, especially in relation to assignment of board members; a significant effort was made to create professional boards70.
Phase 2 In 2002, the restructuring process changed focus slightly to achieve a new and con-solidated institute sector adapted to industry’s needs. Accordingly, IRECO was to bring about increased efficiency in the structure of institutes by supporting fusions and other types of joint actions among the institutes.
About the same time, the Swedish institute sector fell on hard times, partly due to lack of apparent interest and strategy from the government, which resulted in sharply re-duced government funding. This sharp drop in funding, coupled to a recession, led to massive layoffs and some institutes going bankrupt. While this “cleansing bath” in some respects probably was useful in order to focus on core activities and competen-cies, a lot of expertise and dedication was simultaneously lost. The lack of proper stra-
67 Annual report IRECO Holding, 2007. 68 Kommittén för omstrukturering och förstärkning av industriforskningsinstituten (KOFI). 69 The company existed already prior to 1997 under the name Stattum, fully owned by the gov-
ernment. 70 “Historik 1997-2001”, IRECO.

77 International Comparison of Five Institute Systems
>
IRECO also assisted the institutes in their conversion into limited companies and in adjusting to new requirements, especially in relation to assignment of board members; a significant effort was made to create professional boards69.
Phase 2In 2002, the restructuring process changed focus slightly to achieve a new and consolidated institute sector adapted to industry’s needs. Accordingly, IRECO was to bring about increased efficiency in the structure of institutes by supporting fusions and other types of joint actions among the institutes.
About the same time, the Swedish institute sector fell on hard times, partly due to lack of apparent interest and strategy from the government, which resulted in sharply reduced government funding. This sharp drop in funding, coupled to a recession, led to massive layoffs and some institutes going bankrupt. While this “cleansing bath” in some respects probably was useful in order to focus on core activities and competencies, a lot of expertise and dedication was simultaneously lost. The lack of proper strategic direction from the government was devastating. There were pointers to consolidate the sector, but the purpose of consolidation was not well argued and the end result was unclear. In addition, the funds allocated for the process were highly inadequate. It was anticipated that the institutes’ industry owners would act as “real” owners and take the lead, but since industry was represented through a scatter of membership associations, this never happened. Moreover, as minority owner without proper financial means, IRECO was in practice also a weak owner. Nevertheless, the RTOs were gradually but haphazardly reorganised into the four-leaf clover, but the purpose and the strategy remained unclear to many stakeholders.
Phase 3In 2006, an investigation into the industry sector’s future started. Concurrently, IRECO’s board decided to take an active part in the restructuring process proposed by the investigation. Accordingly, a new CEO was appointed with the task to follow the process.70 Since 2007, the government is the sole owner of IRECO.
In addition to restructuring, IRECO’s focus shifted somewhat to also include content. Catchwords in this process are renewal and development, which refers to the ambition to develop a new organisational structure which builds on the existing four-leaf clover structure and at the same time takes the industry’s present and future needs into consideration. Government funding for the institute sector in the form of competence grants increases from 2006 and on (cf. Exhibit 35).
69 “Historik 1997-2001”, IRECO.
70 Interview with Peter Holmstedt, CEO IRECO Holding, 2008-10-17.
78 International Comparison of Five Institute Systems
>
B.3. Role in National Innovation SystemSo far, the institutes have played a fairly weak part in the Swedish innovation system. For the past sixty years, the “Swedish model” of innovation and research funding has focused resources onto the university sector in the belief that the research system should not be fragmented and that universities could perform not only their traditional roles of teaching and research but also function as society’s research institutes71. In addition, the model has been based on “development pairs”, referring to the long-term relationships that existed between private enterprises and a public customer, e.g. LM Ericsson and Televerket within ICT, ASEA and Vattenfall within power generation, and ASEA and SJ within the railway sector.72 These pairs developed close relations to universities and thus the need for an intermediary, such as a research institute, was not strong for the larger enterprises that “built Sweden”. Outside big business, the development of a wide range of research institutes, mainly along branch or sector lines, manifested the need for external providers of R&D for smaller enterprises.
The Swedish institute sector was thus characterised by many small and disparate institutes, which is one reason for the sector still being small in an international comparison73. Rapidly decreasing public funding to the research institutes in the period 1980s to 2005 contributed further to weakening of the sector’s role in the innovation system74. However, a recent study argues that the research institutes have a very important role to fill in the innovation system as a bridge between academia and industry75.
B.3.1. Types of servicesTypical services of the IRECO Group include:
Applied R&D; in some cases also explorative R&D• Investigations and analyses• Modelling, design, simulation and optimisation• Development of products, processes and methods• Development of tools and instruments• Development of prototypes• Measurement and testing• Maintaining equipment and pilot laboratories• Standardisation and certification• Education and counselling• Technology dissemination and mediation of new technology• Initiation of centres of excellence and research cluster•
71 Erik Arnold, Neil Brown, Annelie Eriksson, Tommy Jansson, Alessandro Muscio, Johanna Nählinder
and Rapela Zaman, “The Role of Industrial Research Institutes in the National Innovation System”, VIN-
NOVA, VA 2007:12, 2007.
72 Sverker Sörlin, op. cit.
73 Interview with Peter Holmstedt, CEO IRECO Holding, 2008-10-17.
74 Sverker Sörlin, op. cit.
75 Erik Arnold et al., op. cit.

79 International Comparison of Five Institute Systems
>
B.3.2. Relations to other national R&D suppliersAlthough many institutes are already, or are soon, under the IRECO umbrella, there are still some major institutes outside the Group, including the Swedish Defence Research Agency (FOI) and IVL Swedish Environmental Research Institute. The IRECO institutes cooperate with both of these institutes on a project-by-project basis and they may eventually become part of the Group; IVL is in a preparatory phase and the appropriateness of also incorporating FOI inti the Group is to be investigated. Having said that, the national R&D suppliers that the IRECO institutes mainly interact with are nevertheless universities and private enterprises. The role of the IRECO Group is to focus on development and innovation (whereas the universities focus on research and education) and to be a link between academia and industry, which at least SMEs tend to need to be able to access university knowledge. History has shown that the Swedish model’s assumption that universities could have an institute-like function is naive and that the innovation system needs a vital institute sector. Although some individuals in the university sector may not have accepted this, the institute sector has embraced it since long and has thus built extensive networks and lasting relationships with universities, which in recent years have grown in intensity. However, the traditions of the individual IRECO institutes in this respect vary notably. Up to around 2000, collaboration between the institutes of the Group was sparse, but has since intensified tremendously, which is clearly a healthy development that in many cases is expected by the institutes’ customers, which argue for a “one-stop shop”.
B.3.3. CustomersThe IRECO institutes offer their services to enterprises of all sizes as well as public organisations. Several of the institutes have industry associations as shareholders, wherein enterprises become members when joining the institutes’ membership programmes, usually for R&D or information dissemination. For example, in 2007 the Swerea Group had more than 550 enterprises, both MNCs and SMEs, as members76.
Many of the customers are large enterprises with which some of the institutes have signed long-term agreements. The important role of large enterprises is also reflected in the fact that the central body of IRECO mainly interacts with such enterprises in its dialogue to strategically develop the Group. However, the interaction and long-term agreements with large enterprises provides for cooperation and projects focusing on specific issues which also benefit SMEs. Moreover, if the larger enterprises are satisfied with the services offered, this may be seen as a seal of quality77.
The needs of the SMEs are also met through services specifically targeting SMEs. For example, within the Swerea Group the Produktionslyftet project aims to enhance the production efficiency in enterprises with 50–250 employees.
76 Annual report Swerea Group, 2007.
77 Interview with Peter Holmstedt, CEO IRECO Holding, 2008-10-17.
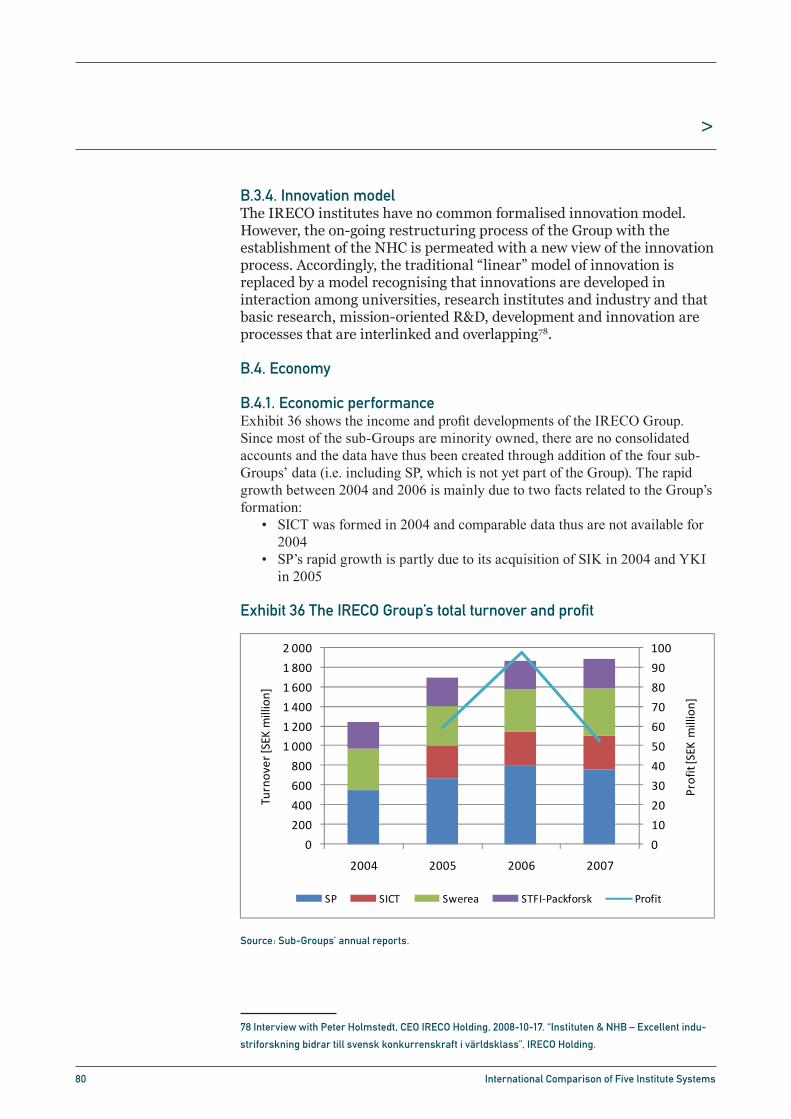
80 International Comparison of Five Institute Systems
>
B.3.4. Innovation modelThe IRECO institutes have no common formalised innovation model. However, the on-going restructuring process of the Group with the establishment of the NHC is permeated with a new view of the innovation process. Accordingly, the traditional “linear” model of innovation is replaced by a model recognising that innovations are developed in interaction among universities, research institutes and industry and that basic research, mission-oriented R&D, development and innovation are processes that are interlinked and overlapping78.
B.4. Economy
B.4.1. Economic performanceExhibit 36 shows the income and profit developments of the IRECO Group. Since most of the sub-Groups are minority owned, there are no consolidated accounts and the data have thus been created through addition of the four sub-Groups’ data (i.e. including SP, which is not yet part of the Group). The rapid growth between 2004 and 2006 is mainly due to two facts related to the Group’s formation:
SICT was formed in 2004 and comparable data thus are not available for • 2004SP’s rapid growth is partly due to its acquisition of SIK in 2004 and YKI • in 2005
Exhibit 36 The IRECO Group’s total turnover and profit
Source: Sub-Groups’ annual reports.
78 Interview with Peter Holmstedt, CEO IRECO Holding, 2008-10-17. “Instituten & NHB – Excellent indu-
striforskning bidrar till svensk konkurrenskraft i världsklass”, IRECO Holding.
International Comparison of Five Institute Systems 66
specific issues which also benefit SMEs. Moreover, if the larger enterprises are satis-fied with the services offered, this may be seen as a seal of quality78.
The needs of the SMEs are also met through services specifically targeting SMEs. For example, within the Swerea Group the Produktionslyftet project aims to enhance the production efficiency in enterprises with 50–250 employees.
B.3.4. Innovation model
The IRECO institutes have no common formalised innovation model. However, the on-going restructuring process of the Group with the establishment of the NHC is permeated with a new view of the innovation process. Accordingly, the traditional “linear” model of innovation is replaced by a model recognising that innovations are developed in interaction among universities, research institutes and industry and that basic research, mission-oriented R&D, development and innovation are processes that are interlinked and overlapping79.
B.4. Economy
B.4.1. Economic performance
Exhibit 36 shows the income and profit developments of the IRECO Group. Since most of the sub-Groups are minority owned, there are no consolidated accounts and the data have thus been created through addition of the four sub-Groups’ data (i.e. including SP, which is not yet part of the Group). The rapid growth between 2004 and 2006 is mainly due to two facts related to the Group’s formation:
SICT was formed in 2004 and comparable data thus are not available for 2004
SP’s rapid growth is partly due to its acquisition of SIK in 2004 and YKI in 2005
Exhibit 36 The IRECO Group’s total turnover and profit. Source: Sub-Groups’ annual reports.
0
10
20
30
40
50
60
70
80
90
100
0
200
400
600
800
1 000
1 200
1 400
1 600
1 800
2 000
2004 2005 2006 2007
Profit [SEK
million]
Turnover [SEK
million]
SP SICT Swerea STFI‐Packforsk Profit
78 Interview with Peter Holmstedt, CEO IRECO Holding, 2008-10-17. 79 Interview with Peter Holmstedt, CEO IRECO Holding, 2008-10-17. “Instituten & NHB – Excellent industriforskning bidrar till svensk konkurrenskraft i
världsklass”, IRECO Holding.

81 International Comparison of Five Institute Systems
>
Taking these factors into account, the turnover for 2006 and 2007 ought to represent a kind of “steady-state” turnover. The profit has been just below 4% of turnover in the period 2005 to 2007; with the exception of a small loss for SICT in 2006, the sub-Groups have all made a profit in the same period. It should be noted that in 2007 SP accounted for 41% of total turnover, SICT 18%, Swerea 25% and STFI-Packforsk 16%.
Exhibit 37 shows the source of the Group’s total turnover, illustrating an increasing share of international commercial sales that coincides with a slight increase in national commercial sales and slight decrease in national public sales.
Exhibit 37 Source of the IRECO Group’s total turnover (first three cate-gories are commercial turnover) and share of international turnover in total turnover.
Source: IRECO secretariat.
International Comparison of Five Institute Systems 67
Taking these factors into account, the turnover for 2006 and 2007 ought to represent a kind of “steady-state” turnover. The profit has been just below 4% of turnover in the period 2005 to 2007; with the exception of a small loss for SICT in 2006, the sub-Groups have all made a profit in the same period. It should be noted that in 2007 SP accounted for 41% of total turnover, SICT 18%, Swerea 25% and STFI-Packforsk 16%.
Exhibit 37 shows the source of the Group’s total turnover, illustrating an increasing share of international commercial sales that coincides with a slight increase in na-tional commercial sales and slight decrease in national public sales.
Exhibit 37 Source of the IRECO Group’s total turnover (first three categories are commercial turnover) and share of international turnover in total turn-over. Source: IRECO secretariat.
12%
13%
14%
15%
16%
17%
18%
19%
20%
0
250
500
750
1 000
1 250
1 500
1 750
2 000
2006 2007Share international
SEK million
National, private National, public International
Other R&D Share international

82 International Comparison of Five Institute Systems
>
Exhibit 38 Source of the IRECO Group’s R&D income and R&D intensity79
Source: IRECO secretariat.
Exhibit 39 The IRECO Group’s competence grants.
Source: VINNOVA annual reports 2005 and 2007.
Exhibit 38 shows that the Group’s basic funding increases notably between 2006 and 2007, while the other sources of R&D income remain stable. VINNOVA’s annual reports provide a longer time series for the competence grants part of basic funding, thus illustrating that this source of funding has increased by as much as 65% between 2003 and 2007, see Exhibit 39.
79 R&D intensity is the share of R&D in total turnover.
International Comparison of Five Institute Systems 68
Exhibit 38 Source of the IRECO Group’s R&D income and R&D intensity80.Source: IRECO secretariat.
30%
31%
32%
33%
34%
35%
36%
37%
0
100
200
300
400
500
600
700
2006 2007
R&D intensity
SEK million
Basic funding National grants
International grants R&D intensity
Exhibit 39 The IRECO Group’s competence grants. Source: VINNOVA annual reports 2005 and 2007.
0
20
40
60
80
100
120
140
160
2003 2004 2005 2006 2007
SEK million
SP SICT Swerea STFI‐Packforsk IRECO Holding
Exhibit 38 shows that the Group’s basic funding increases notably between 2006 and 2007, while the other sources of R&D income remain stable. VINNOVA’s annual re-ports provide a longer time series for the competence grants part of basic funding, thus illustrating that this source of funding has increased by as much as 65% between 2003 and 2007, see Exhibit 39. Comparing the data in Exhibit 38 and Exhibit 39, one finds that the competence grants constituted 55% of total basic funding in 2006 and 70% in 200781.
80 R&D intensity is the share of R&D in total turnover. 81 The bulk of additional basic funding is VINNOVA funding for SP’s standardisation and re-
search in experimental technologies as well as in metrology. Most of the remainder is fund-

83 International Comparison of Five Institute Systems
>
Comparing the data in Exhibit 38 and Exhibit 39, one finds that the competence grants constituted 55% of total basic funding in 2006 and 70% in 200780.
B.4.2. State funding principlesThe Swedish institute sector is in the process of changing its funding system81. In the present system, basic funding is primarily in the form of competence grants now allocated to the institutes through VINNOVA (previously through the Knowledge Foundation). Most of the funds are allocated competitively to the existing IRECO institutes, although a Programme Committee set up in 2003 decided that the basic grant had to be between 4 and 11% of each individual institute’s turnover. In a closed call procedure, the institutes’ applications are scored by independent experts according to a number of criteria: excellent industrially relevant capabilities, cooperation with universities, cooperation with SMEs, commercialisation, international activities and restructuring of the institute sector. Neither of these criteria are requirements for obtaining financing, but they contribute to high scores in the evaluation, which in turn result in higher grants.
Funding has been distributed along the principles of 50% in relation to each institute’s turnover and 50% in relation to fulfilment of the aforementioned criteria. An ex-post assessment of the system showed that in reality the institutes’ turnover largely determines how much money they are granted since institutes with a high turnover also score well in the criteria. In 2007, the institutes used the competence grant as illustrated in Table 9.
Table 9 Use of competence grant
Source: VINNOVA annual report 2007.
With the establishment of the new holding company (NHC), the appropriation to the Group will comprise of four components: basic grant (“strategic competence development funding”), funding for restructuring, funding for NHC operations, and perhaps funding to increase the equity capital of the NHC.82
80 The bulk of additional basic funding is VINNOVA funding for SP’s standardisation and research in
experimental technologies as well as in metrology. Most of the remainder is funding from Swedish
Foundation for Strategic Research (SSF) and the Knowledge foundation to SICT’s Interactive Institute.
Source: IRECO secretariat and VINNOVA annual report 2007.
81 Interview with Peter Holmstedt, CEO IRECO Holding, 2008-10-17.
82 E-mail correspondence with Peter Holmstedt, CEO IRECO Holding, 2008-12-03.
Field of application Share of total
Restructuring of the sector 15%
Participation in international programmes 20%
SME support 13%
University cooperation 21%
Commercialisation of R&D results 31%

84 International Comparison of Five Institute Systems
>
In the new funding scheme, the strategic competence development funding proposed in the recent Research and Innovation Bill will mainly be allocated based on the institutes’ turnover and their ability to fulfil their own objectives. The proposition is that 70–90% of funding will be allocated according to the institutes’ turnover and their ability to fulfil their own objectives. More emphasis will be placed on the institutes’ ability to serve SMEs, since this was put forth as one of the main tasks for the institutes in the Bill. Impact assessments will be conducted each year, with in-depth assessments every 5–6 years. Objectives will differ between the institutes as they are very heterogeneous. In addition, 10–30% of funding will be allocated by the NHC to specifically targeted programmes (the exact percentages have yet to be determined). The NHC will decide which targeted programmes to introduce.83
B.5. Capabilities
B.5.1. PersonnelIn total, the institutes within the four-leaf clover employed 1 758 in 2007. The share of employees with a doctorate or licentiate84 degree was 27%, whereas the share of employees with any other form of technical education amounted to 59%, see Exhibit 40.
Exhibit 40 Educational background of the IRECO Group’s personnel 2007
Source: IRECO secretariat.
83 “Ett lyft för forskning och innovation”, Government Bill 2008/09:50, 2008.
Interview with Peter Holmstedt, CEO IRECO Holding, 2008-10-17
84 A licentiate degree is roughly equivalent to “half a doctorate” (assuming the starting point is a ma-
sters’ degree).
International Comparison of Five Institute Systems 70
specifically targeted programmes (the exact percentages have yet to be determined). The NHC will decide which targeted programmes to introduce.84
B.5. Capabilities
B.5.1. Personnel
In total, the institutes within the four-leaf clover employed 1 758 in 2007. The share of employees with a doctorate or licentiate85 degree was 27%, whereas the share of em-ployees with any other form of technical education amounted to 59%, see Exhibit 40.
Exhibit 40 Educational background of the IRECO Group’s personnel 2007. Source: IRECO secretariat.
Doctors and licentiates; 469;
27%
MSc, engineers, technical; 1039;
59%
Administrative; 250; 14%
B.5.2. R&D effort
An important component in the IRECO institutes’ R&D efforts is their involvement in institute excellence centres. With funding from VINNOVA, the Knowledge Foundation and the Swedish Foundation for Strategic Research (SSF), the aim of these centres is to stimulate cooperation between institutes, universities and industry within areas of relevance for Sweden’s future competitiveness. The following institute excellence cen-tres have obtained such funding:
Casting Innovation Centre (Swerea SWECAST)
Centre for networked system (SICT)
Ecobuild (SP)
Controlled delivery and release (CODIRECT) (YKI (SP))
Fiber Optic Centre (Acreo (SICT))
Centre for Process integration in steelmaking (PRISMA) (MEFOS)
Imaging integrating components (IMAGIC) (Acreo (SICT))
84 “Ett lyft för forskning och innovation”, Government Bill 2008/09:50, 2008. Interview with Peter Holmstedt, CEO IRECO Holding, 2008-10-17 85 A licentiate degree is roughly equivalent to “half a doctorate” (assuming the starting point is
a masters’ degree).
85 International Comparison of Five Institute Systems
>
B.5.2. R&D effortAn important component in the IRECO institutes’ R&D efforts is their involvement in institute excellence centres. With funding from VINNOVA, the Knowledge Foundation and the Swedish Foundation for Strategic Research (SSF), the aim of these centres is to stimulate cooperation between institutes, universities and industry within areas of relevance for Sweden’s future competitiveness. The following institute excellence centres have obtained such funding:
Casting Innovation Centre (Swerea SWECAST)• Centre for networked system (SICT)• Ecobuild (SP)• Controlled delivery and release (CODIRECT) (YKI (SP))• Fiber Optic Centre (Acreo (SICT))• Centre for Process integration in steelmaking (PRISMA) (MEFOS)• Imaging integrating components (IMAGIC) (Acreo (SICT))•
• International cooperation through the EU’s Framework programmes is another important component of the institutes’ R&D efforts. There are no consistent data available for all the IRECO institutes as regards their involvement in EU projects. However, the institutes’ annual reports argue for their importance. Accordingly, the Swerea Group currently participates in more than 50 projects in FP6 and FP7 as well as in the parallel RFCS (Research Fund for Coal and Steel) programme, in total corresponding to a turnover of SEK250 million; so far Swerea participates in more than 10 projects in FP7 and coordinates a few of them85. Likewise, STFI-Packforsk participates in several FP6 and FP7 projects, both as coordinator and as partner86. Within SICT, Acreo and SICS are number two and four among Swedish institutes in terms of funds received in FP6. Acreo also receives funding through EUREKA and EU’s structural funds87. In 2007, the IRECO institutes used 20% of their competence grants for participation in international programmes (cf. Table 9), but even if all of this went to co-funding of international programmes, it would clearly be nowhere near enough to co-fund all the EU projects the Group participates in.
B.5.3. Competence developmentPart of the competence grant is expected to contribute to the competence development of the institutes through the broad activities listed in Table 9. As indicated above, participation in international projects is seen as essential by the institutes themselves, largely since participation contributes new knowledge and networking.
85 Annual report Swerea Group, 2007.
86 Annual report STFI-Packforsk Group, 2007.
87 Annual report Acreo, 2007.

86 International Comparison of Five Institute Systems
>
B.6. Knowledge dissemination
B.6.1. Dissemination activities to and cooperation with customersThere are no central dissemination activities from the IRECO Group. Instead, it is each institute’s responsibility to communicate its services, competencies and results to its customers. Arguably the most important and effective means of dissemination and cooperation activities are the institutes’ membership programmes, wherein collaborative R&D and dissemination activities take place. The institutes also arrange open (and sometimes closed) courses, “open houses”, seminars, conferences and periodically publish newsletters. Some of the institutes also certify or audit their customers’ activities. Scientific papers and conference presentations are two other important instruments for dissemination, as are of course their websites that still are the most active at the individual institute level.
B.6.2. University cooperationCooperation with universities is essential to the institutes and to a lesser extent vice versa. Thus, universities provide the institutes with knowledge both through participating in joint projects and by providing doctoral training. Institutes, on the other hand, are able to provide industry networks and to act as “focusing devices” that communicate areas of industrial problems and interest to universities88. A number of collaborative projects/initiatives have already been mentioned above (e.g. institute excellence centres and EU projects). For institutes that pursue research of a more explorative character (e.g. YKI), the interaction with academia is naturally more important and often leads to shared personnel (cf. SINTEF case study). Furthermore, the institutes that are co-located with universities have generally developed strong ties with universities. For example, the Swerea Group has agreements on common financing and use of equipment with KTH (Swerea KIMAB), School of Engineering at Jönköping University (Swerea SWECAST), the Swedish School of Textiles at University of Borås (Swerea IVF) and Luleå University of Technology (Swerea SICOMP)89. A relatively common form of university cooperation is that institute employees are doctoral students. In 2007, the IRECO institutes used 21% of the competence grant for university collaboration (cf. Table 9).
B.6.3. PublicationsThe publications production of the IRECO Group is summarised in Table 10. The institutes show a fairly steady production of publications during the period.
88 Erik Arnold et al., op. cit.
89 Annual report Swerea Group, 2007.
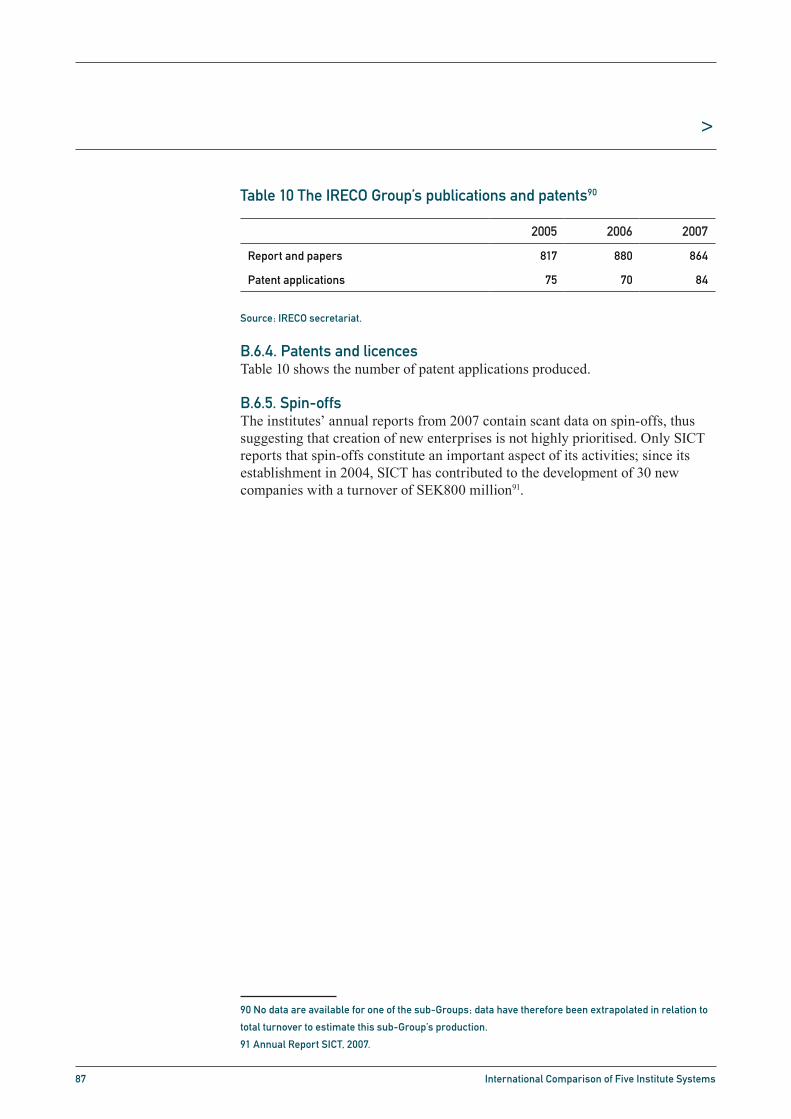
87 International Comparison of Five Institute Systems
>
Table 10 The IRECO Group’s publications and patents90
Source: IRECO secretariat.
B.6.4. Patents and licencesTable 10 shows the number of patent applications produced.
B.6.5. Spin-offsThe institutes’ annual reports from 2007 contain scant data on spin-offs, thus suggesting that creation of new enterprises is not highly prioritised. Only SICT reports that spin-offs constitute an important aspect of its activities; since its establishment in 2004, SICT has contributed to the development of 30 new companies with a turnover of SEK800 million91.
90 No data are available for one of the sub-Groups; data have therefore been extrapolated in relation to
total turnover to estimate this sub-Group’s production.
91 Annual Report SICT, 2007.
2005 2006 2007
Report and papers 817 880 864
Patent applications 75 70 84

88 International Comparison of Five Institute Systems
>
C.1. National business structureExhibit 41 provides an overview of the Norwegian industry structure in terms of value added, thus illustrating the importance of the sectors of manufacturing, financial intermediation and trade in the private sphere, while Exhibit 42 shows that the number of enterprises by sector paints quite a different picture.
Exhibit 41 Share of total value added by sector, 2007
Source: Eurostat.
Exhibit 43 takes a closer look at the for Norway crucial mining, manufacturing and energy sectors. The Exhibit illustrates that the oil and gas extraction sector is of tremendous importance for the country, followed by food (dominated by fish), metals and electricity sectors. The 2006 Trend Chart report for Norway92 finds that “the current macroeconomic performance of Norway is outstanding. The country has one of the world’s highest per capita GDP. The oil and gas sector provides a solid contribution to this macroeconomic success, but also other sectors, such as manufacturing and private and public services perform very well. The overall economic situation was recognised by the international competitiveness rankings: The Global Competitiveness Report for 2005-2006 ranked Norway as the ninth most competitive economy in the world.”
Both the 2006 Trend Chart report and a recent OECD report93 find that while Norway’s economic performance is outstanding, its innovation performance is below par. The OECD report states that a “characteristic of the Norwegian economy is its combination of high productivity and weak innovation activity, often referred to as the “Norwegian puzzle”. The Trend Chart report goes on to argue that the four challenges to the Norwegian innovation system are:
92 European Trend Chart on Innovation: Annual Innovation Policy Trends and Appraisal Report Norway
2006, European Commission, 2006.
93 OECD Reviews of Innovation Policy: Norway, 2008.
Appendix C. The SINTEF Group
International Comparison of Five Institute Systems 73
Appendix CThe SINTEF Group
C.1. National business structure
Exhibit 41 provides an overview of the Norwegian industry structure in terms of value added, thus illustrating the importance of the sectors of manufacturing, financial in-termediation and trade in the private sphere, while Exhibit 42 shows that the number of enterprises by sector paints quite a different picture.
Exhibit 41 Share of total value added by sector, 2007. Source: Eurostat.
Agriculture, fishing; 1%
Manufacturing; 38%
Construction; 5%
Wholesale and retail trade;
17%
Financial intermediation;
18%
Public administration, defence; 21%
Exhibit 43 takes a closer look at the for Norway crucial mining, manufacturing and energy sectors. The Exhibit illustrates that the oil and gas extraction sector is of tre-mendous importance for the country, followed by food (dominated by fish), metals and electricity sectors. The 2006 Trend Chart report for Norway93 finds that “the cur-rent macroeconomic performance of Norway is outstanding. The country has one of the world’s highest per capita GDP. The oil and gas sector provides a solid contribu-tion to this macroeconomic success, but also other sectors, such as manufacturing and private and public services perform very well. The overall economic situation was rec-ognised by the international competitiveness rankings: The Global Competitiveness Report for 2005-2006 ranked Norway as the ninth most competitive economy in the world.”
Both the 2006 Trend Chart report and a recent OECD report94 find that while Nor-way’s economic performance is outstanding, its innovation performance is below par. The OECD report states that a “characteristic of the Norwegian economy is its combi-nation of high productivity and weak innovation activity, often referred to as the
93 European Trend Chart on Innovation: Annual Innovation Policy Trends and Appraisal Re-port Norway 2006, European Commission, 2006.
94 OECD Reviews of Innovation Policy: Norway, 2008.

89 International Comparison of Five Institute Systems
>
Below average business investment in R&D and innovation• Low public R&D funding• Insufficient levels of science and engineering (S&E) graduates• Below average university R&D funded by industry•
Exhibit 42 Share of total number of enterprises by sector 2008
Source: Statistics Norway.
Exhibit 43 Share of industrial turnover from subsectors within mining, manufacturing and energy sectors (NACE codes C–E), 2004
Source: OECD.
International Comparison of Five Institute Systems 74
“Norwegian puzzle”. The Trend Chart report goes on to argue that the four challenges to the Norwegian innovation system are:
Below average business investment in R&D and innovation
Low public R&D funding
Insufficient levels of science and engineering (S&E) graduates
Below average university R&D funded by industry
Exhibit 42 Share of total number of enterprises by sector 2008. Source: Statis-tics Norway.
Agriculture, fishing; 15%
Manufacturing; 5%
Construction; 10%
Wholesale and retail trade;
17%
Financial intermediation;
32%
Public administration;
21%
Exhibit 43 Share of industrial turnover from subsectors within mining, manu-facturing and energy sectors (NACE codes C–E), 2004. Source: OECD.
Oil; 41%
Mining; 1%Food; 13%Textiles; 1%
Wood; 2%Paper; 5%
Chemicals; 6%
Non‐metals; 2%
Metals; 9%
Machinery; 4%
Electr. & opt.; 3%
Vehicles; 6%Other; 2%
Electricity; 7%
The first challenge, with business R&D expenditure at 87% of EU25 average, has been met with the tax incentive Skattefunn, although its impact remains uncertain. Low public R&D funding has been met with additional public funding with the aim of reaching the Lisbon goal of 3% by 2010. The third challenge has been widely debated

90 International Comparison of Five Institute Systems
>
The first challenge, with business R&D expenditure at 87% of EU25 average, has been met with the tax incentive Skattefunn, although its impact remains uncertain. Low public R&D funding has been met with additional public funding with the aim of reaching the Lisbon goal of 3% by 2010. The third challenge has been widely debated and a lot of ideas on how to increase the number of S&E graduates have been discussed, but so far no specific policy measures have been launched. Finally, the below-average business funding of university R&D can probably partly be explained by the industry’s strong traditional ties to the Norwegian industry research institutes, and in particular SINTEF.Exhibit 44 demonstrates that Norway has very few large companies; 99.9% of enterprises are SMEs94.
Exhibit 44 Number of enterprises by number of employees, 2008
Source: Statistics Norway
C.2. IntroductionThe SINTEF95 Group is an independent research organisation that is mainly active in Scandinavia. The organisation has its roots in Trondheim, through its origin in the Norwegian Institute of Technology, which is now part of the Norwegian University of Science and Technology (NTNU). Today, SINTEF is mainly located in Trondheim and Oslo, and has divisions in Stavanger and Bergen. The Group is also established in Houston, Texas (USA), Rio de Janeiro (Brazil), Hirtshals (Denmark), Skopje (Former Yugoslav Republic of Macedonia), Warsaw (Poland) and Belgrade (Serbia).
94 Considering the sole criterion of number of employees, only.
95 SINTEF is originally an acronym for “Stiftelsen for industriell og teknisk forskning ved Norges
tekniske högskole (NTH)” (“The Foundation for industrial and technological research at the Norwegian
University of Technology”). Since 2007, the previous acronym is the complete name.
International Comparison of Five Institute Systems 75
and a lot of ideas on how to increase the number of S&E graduates have been dis-cussed, but so far no specific policy measures have been launched. Finally, the below-average business funding of university R&D can probably partly be explained by the industry’s strong traditional ties to the Norwegian industry research institutes, and in particular SINTEF.
Exhibit 44 demonstrates that Norway has very few large companies; 99.9% of enter-prises are SMEs95.
Exhibit 44 Number of enterprises by number of employees, 2008. Source: Sta-tistics Norway
292 629
100 356
38 70225 777 16 450
4 921 2 318 6660
50 000
100 000
150 000
200 000
250 000
300 000
0 1‐4 5‐9 10‐19 20‐49 50‐99 100‐249 250+
Num
ber of enterprises
Number of employees
C.2. Introduction
The SINTEF96 Group is an independent research organisation that is mainly active in Scandinavia. The organisation has its roots in Trondheim, through its origin in the Norwegian Institute of Technology, which is now part of the Norwegian University of Science and Technology (NTNU). Today, SINTEF is mainly located in Trondheim and Oslo, and has divisions in Stavanger and Bergen. The Group is also established in Houston, Texas (USA), Rio de Janeiro (Brazil), Hirtshals (Denmark), Skopje (Former Yugoslav Republic of Macedonia), Warsaw (Poland) and Belgrade (Serbia).
In line with its vision “Technology for a better society”, the SINTEF Group supplies approximately 2 000 Norwegian and foreign enterprises with research and develop-ment services. The Group describes itself as a “broad-based, multidisciplinary research organisation with global specialist expertise in the fields of technology, the natural sciences, medicine and the social sciences”97.
The Group is structured into the following research areas:
95 Considering the sole criterion of number of employees, only. 96 SINTEF is originally an acronym for “Stiftelsen for industriell og teknisk forskning ved Nor-
ges tekniske högskole (NTH)” (“The Foundation for industrial and technological research at the Norwegian University of Technology”). Since 2007, the previous acronym is the com-plete name.
97 SINTEF Annual Report 2007.

91 International Comparison of Five Institute Systems
>
In line with its vision “Technology for a better society”, the SINTEF Group supplies approximately 2 000 Norwegian and foreign enterprises with research and development services. The Group describes itself as a “broad-based, multidisciplinary research organisation with global specialist expertise in the fields of technology, the natural sciences, medicine and the social sciences”96.The Group is structured into the following research areas:
SINTEF Technology and Society (including SINTEF Health• 97)SINTEF ICT• SINTEF Materials and Chemistry• SINTEF Building and Infrastructure• SINTEF Marine (consists of Marintek and SINTEF Fisheries and • Aquaculture, both limited companies)SINTEF Petroleum and Energy (consists of SINTEF Energy Research and • SINTEF Petroleum Research, both limited companies)
More than 90% of the SINTEF Group’s turnover comes from contract research for industry and the public sector and from grants from the Research Council of Norway (RCN). The grants from RCN constitute 8% of the Group’s total income 98.
C.2.1. Business concept and strategyThe SINTEF Group’s business concept is the following99:
SINTEF’s goal is to contribute to wealth creation and to the sound and sustainable development of society. We generate new knowledge and solutions for our customers, based on research and development in technology, the natural sciences, medicine and the social sciences.
The main objective of the Group is “to be acknowledged as the leading independent contract research organization in Europe” 100.
The SINTEF Group has developed a fairly extensive strategy to guide the organisation in its fulfilment of its goals (see Section 10.5). Three identified focus areas have been provided specific goals:
Customers:• SINTEF is to contribute to knowledge generation, value creation and enhance its customers’ competitivenessScience• : SINTEF is to be known for high-level scientific and professional quality and be an international leader in specific fieldsPeople: SINTEF is to be an attractive place to work offering unique • prospects for those with the ability and drive to develop their potential
96 SINTEF Annual Report 2007.
97 Until 2008-12-31, SINTEF Health was a separate research area.
98 SINTEF Annual Report 2007.
99 www.sintef.no/Home/About-us/.
100 “SINTEF, Main strategy”, www.sintef.no/Home/About-us/Our-Vision-and-Strategy/.

92 International Comparison of Five Institute Systems
>
The strategy emphasises such aspects as:Customers: delivering solutions, creating new business opportunities, • university cooperation, providing top expertise, increase international activities, assist customers with intellectual property rightsScience: developing leading scientific groups, focus on specific • scientific areas with leading expertise, participate in European research programmes and other domestic and international initiatives, developing laboratories, publishing research work, bring breakthroughs in science and technology to the marketPeople: create an attractive workplace with ethical standards, professional • challenges, recruit competent people, encourage team spirit and creativity, develop leadership
In addition, SINTEF has developed an informal strategy for its participation in EU’s Framework Programmes focusing on three aspects101:
SINTEF will focus on its strategic research areas• SINTEF will take responsibility in a project and will take on a leading • role in the consortium or at least be part of the core groupSINTEF will write competitive applications of the best quality. In • order to achieve this, SINTEF uses an internal evaluation process of all applications before they are submitted to the Commission
C.2.2. GovernanceThe SINTEF Group comprises the SINTEF Foundation, four limited companies and SINTEF Holding AS102. The SINTEF Foundation is the parent of the Group103 and the organisational structure was created in 1985104. Other than SINTEF Holding and its subsidiaries, the limited companies in the SINTEF Group are:
MARINTEK• SINTEF Fisheries and Aquaculture• SINTEF Energy Research• SINTEF Petroleum Research•
101 Interview Ernst Kristiansen, VP SINTEF Building and Infrastructure, 2008-10-29.
102 “Facts about SINTEF 2008, This is SINTEF”, www.sintef.no/Home/About-us/.
103 SINTEF, Vedtekter for stiftelsen SINTEF, Vedtatt av SINTEFs Råd 2007-04-18, § 1 Foretaksnavn, op-
prettelse og forretningskommune.
104 In 2007, the Norwegian Building Research Institute (NBI) was merged with the SINTEF Foundation,
SINTEF Annual Report 2007.

93 International Comparison of Five Institute Systems
>
SINTEF Holding, which is a limited and thus tax-paying company, was established with the aim of separating commercial activities from core research activities. Between 1990 and 2006, SINTEF Holding has contributed to the establishment of seven subsidiaries in which SINTEF Holding holds between 50 and 100% of shares (see Section 10.5)105. One of these subsidiaries, Sinvent AS, was established to take care of the Group’s commercial endeavours and its shares in newly established enterprises.
The SINTEF Foundation is governed by a Board, which has overall responsibility for administration and organisation of both the Foundation and the Group, including subsidiaries. The Board has nine members from NTNU, industry and public authorities. The followings rules apply in appointing the Board106:
Two members should have their main employment at NTNU• Four members should come from industry or public sector• Three of the board members should be employed by SINTEF Group• One of the members representing industry or public sector should be • appointed by RNC. The other board members should be appointed by SINTEF’s CouncilThe chairman and deputy chairman of the Board are appointed by the • CouncilPresently, the Board consists of three representatives from industry, one • from public sector, two from NTNU and three from the SINTEF Group107.
According to SINTEF’s statutes, the Council should consist of 28 members, 25 of which should be appointed by NTNU based on suggestions by the following parties108:
11 members (including the Rector) should have their main employment • at NTNU. All faculties at the university that have contractual agreement with SINTEF should be represented on the Council2 members should by appointed based on suggestions by the Faculty of • Mathematics and Science at University of Oslo (UiO)3 members should be appointed based on suggestions from the • Confederation of Norwegian Enterprise2 members should be appointed based on suggestions from the Norwegian • Confederation of Trade Unions2 members should be appointed based on suggestions from the Norwegian • Society of Chartered Technical and Scientific Professionals2 members should be appointed based on suggestions from the RCN• 3 members should be appointed based on suggestions from the SINTEF’s • Board
105 www.sintef.no/Om-oss/SINTEF-Holding.
106 SINTEF, Vedtekter for stiftelsen SINTEF, Vedtatt av SINTEFs Råd 2007-04-18, § 4 Styrets samman-
settning og valg.
107 http://www.sintef.no/Home/About-us/Management/SINTEFs-Board-and-Council/
108 SINTEF, Vedtekter for stiftelsen SINTEF, Vedtatt av SINTEFs Råd 2007-04-18, § 4 Styret: Samman-
settning og valg.

94 International Comparison of Five Institute Systems
>
In addition: 3 members should be appointed by SINTEF’s employees•
The board of NTNU appoints chairman and vice chairman of the Council. The Council is responsible for the Foundation developing in accordance with its directives and the Council’s own decisions. The Council also advises the Board, for example in relation to larger organisational changes and issues concerning the Foundation’s strategies and development plans.109
The day-to-day management of SINTEF is the responsibility of the Group President and Vice-president, together with the Executive Vice Presidents of the research divisions and the Presidents of the subsidiaries.110
C.2.3. History111
SINTEF was established in 1950 by the Norwegian Institute of Technology (NTH) (which is now part of NTNU). The initiative to SINTEF came from the professors at NTH, who wanted to build up an organisation focusing on contract research. The activities were organised in a number of SINTEF divisions managed by the NTH professors.
In the 1970s, SINTEF grew rapidly as a consequence of the growing technology demands of the Norwegian oil industry. Several larger research laboratories were thus established, while others expanded their activities, e.g. the Ocean Basin Laboratory and the Multiphase Flow Laboratory.
In 1980 SINTEF was restructured into a foundation and a professional research institute. This meant the organisational model with university professors leading the research institute was replaced with an organisation based on an organisational model with dedicated management. Nonetheless, the connection with the NTH remained strong, with personnel from SINTEF engaging in the teaching at NTH (and later NTNU) and personnel from the university working on SINTEF projects.
In 1985, the SINTEF Group was created and three institutes were included in the group: MARINTEK, EFI (Elektrisitetsforsyningens Forskningsinstitutt) and IKU (Institutt for kontinentalsokkelundersøkelser).When SINTEF in 1993 took over SI (Sentralinstitutt for industriell forskning), the majority of the Norwegian industrial research institute effort was centralised into a single organisation. This also meant that SINTEF took over SI’s relationship with UiO.112
109 Ibid.
110 www.sintef.no/Home/About-us/Management/.
111 This section is based on information from www.sintef.no/Home/About-us/History/.
112 Erik Arnold, Neil Brown, Annelie Eriksson, Tommy Jansson, Alessandro Muscio, Johanna Nählinder
and Rapela Zaman, “The Role of Industrial Research Institutes in the National Innovation System”, VIN-
NOVA, VA 2007:12, 2007.

95 International Comparison of Five Institute Systems
>
In 1996, the SINTEF Group was reorganised to include 12 institutes with relative autonomy. Each of the institute had their own director and board.In 2004 the organisation was restructured again and from 2007 and onwards the SINTEF Group is organized into the seven research areas as described in the beginning of this Section, largely defined along branches and value chains.
C.3. Role in National Innovation System
C.3.1.Types of servicesThe SINTEF Group’s role is to be an R&D partner to the business and public sectors, and in this role the institute sells research-based knowledge and associated services, with emphasis on the knowledge being applicable113. Specialties include a number of technological fields, including material, chemistry, building and infrastructure, marine, ICT, and energy and petroleum; medical technology and social sciences. Examples of services offered are:
Knowledge and technology development in research projects• Reports on knowledge and technology insights• Testing, measurements, optimisation, modelling• Software products• Solutions for sustainable development•
Apart from doing contract research within its business areas, an important part of the Group’s activities is operation of research laboratories, which include114:
Ocean Basin Laboratory• Hydropower Laboratory• Oil Spill Laboratory• NBL – Norwegian Fire Research Laboratory• Multiphase Flow Laboratory• Electrotechnical Laboratories• MiNaLab –Microsystems and Nanotechnology•
The Group is also engaged in the development of new companies and has established a separate company, Sinvent, responsible for commercialisation of spin-offs from the Group’s research undertakings. Sinvent also manages SINTEF’s portfolio of intellectual property rights.Moreover, SINTEF is tasked with participating in official debate and in policy development115.
SINTEF also partakes in activities specifically targeting SMEs; however, this part of the organisation is limited and involves only 2–3 part-time SINTEF employees. Examples of initiatives are: technology brokerage for SMEs, network development projects and SME-oriented regional development116.
113 “SINTEF, Main strategy”, 2008, www.sintef.no/Home/About-us/Our-Vision-and-Strategy/.
114 www.sintef.no/Home/Research-and-Development/.
115 “SINTEF, Main strategy”, 2008, www.sintef.no/Home/About-us/Our-Vision-and-Strategy/.
116 Håkon Finne and Per Schjølberg-Henriksen, “Creating business opportunities for SMEs”, Presenta-
tion at EARTOs workshop “SME-specific services”, Espoo, Finland, 2008-09-01.
96 International Comparison of Five Institute Systems
>
C.3.2. Relations to other national R&D suppliersNorway has a relatively large institute sector, especially when it comes to technically oriented institutes. About 23% of national R&D takes place in the institute sector, which obtains a large share of its income from the RCN and foreign sources, mainly the EU’s Framework Programmes117. In addition to the SINTEF Group, which is the largest Norwegian institute, the technical research institutes obtaining RCN basic funding are118:
Chr. Michelsen Research A.S (CMR)• Institute of Energy Technology (IFE)• Norwegian Geotechnical Institute (NGI)• NORSAR – forskningsinstitutt for seismologi og anvendt geofysikk• Norwegian Computing Centre (NR)• Northern Research Institute (NORUT)• International Research Institute of Stavanger (IRIS)• Telemark Technological Research and Development Centre (Tel-Tek)•
SINTEF and the other RTOs in Norway have traditionally played an important role in the Norwegian research system in terms of performance of applied research offered to both industry and the public sector119. Traditionally, there has been a division of labour between the technical institutes and the universities, which has implied that the institutes have focused on the development of applied research and the universities on education. However, a change in the university law has made it possible for the universities to found independent companies and thereby engage in commissioned research. As a consequence, this has led to tensions between the university and institute sectors as the competition for additional funding has increased120. Concurrently, there is a long tradition of collaboration between universities and institutes and this is especially true for the SINTEF Group due to its historical origin and subsequent cooperation with NTNU and UiO.
SINTEF cooperates with other research institutes in Norway within its fields of specialty, but there is no cooperation between SINTEF and the National Institute of Technology (TI) as the latter mainly focuses on services targeting SMEs and more mechanical industry than SINTEF does. SINTEF also cooperates with foreign institutes; the institute has signed cooperation agreements with TNO and VTT. Outside Europe, SINTEF has cooperation agreements with AIST in Japan, CSIR in South Africa and KSEF in Korea.121
117 OECD Reviews of Innovation policy: Norway, 2008.
118 www.forskningsradet.no/no/De+tekniskindustrielle+instituttene/1182736860727.
119 ERAWATCH.
OECD Review of Innovation Policy: Norway, 2008.
120 ERAWATCH.
121 Interview Ernst Kristiansen, VP SINTEF Building and Infrastructure, 2008-10-29.

97 International Comparison of Five Institute Systems
>
C.3.3. CustomersThe services offered by SINTEF are directed to all types of customers: large and small enterprises, private and public sector122. In 2007, SINTEF carried out approximately 6 000 projects for some 2 000 clients. The most important customers are large companies, such as Statoil and Hydro, with which SINTEF has longstanding relations. According to a SINTEF estimate, 50–70% of its customers are SMEs123. As an indication, approximately 30% of projects had a turnover of less than NOK50 000 in 2006124. SINTEF has developed specific measures targeting SMEs with little or no experience of participating in R&D projects; these measures have resulted in several hundreds projects.
C.3.4. Innovation modelDeveloping new enterprises is an important role for the SINTEF Group. As part of the Group’s intention to keep the research and commercial activities apart, the Sinvent subsidiary has been established with both the aim of stimulating development of new enterprises and to be responsible for Group IPR management. Sinvent is fully owned by SINTEF Holding. Sinvent has developed SINTEF’s “Innovation Concept”, which includes a structure and guidelines for how the Group will manage the different phases of the innovation process from concept generation, through concept development and eventually to concept commercialisation125:
The concept generation phase involves the Group’s business areas in • interaction with SinventIn the concept development phase, the concept has become a project • proposal, which is evaluated and verified by SINTEF’s Innovation Board and external consultants; a business plan is draftedIn the commercialisation phase: the concept may lead to:•
Establishment of a new R&D field within SINTEF with associated -contract researchLicence agreements resulting in product development, marketing and -salesEstablishment of a new enterprise going through start-up, development -and growth stages before finally being spun out of the SINTEF Group. This stage will involve SINTEF’s Investment Fund as well as external co-investors. As a tool for the process of developing new companies, Sinvent manages SINTEF’s venture capital portfolio
122 www.sintef.no/Om-oss/Sporsmal-og-svar
123 E-mail correspondence, Håkon Finne, Research Manager,
SINTEF Technology and Society, 2008-12-09.
124 Håkon Finne, “Innovasjon i Tröndelag – samhandling, kreativitet og verdiskaping?”,
SINTEF Rapport A4201, 2007.
125 SINTEF Annual Report 2007.

98 International Comparison of Five Institute Systems
>
The model has mainly been developed to manage IPR issues in larger projects126. Any profit gained is shared by the inventors and the research group behind the idea and SINTEF’s Investment Fund. This means that any profit is reinvested in SINTEF in order to develop the organisation and remain competitive. In 2007, the Group invested NOK20 million in its innovation concept and implemented six commercialisations. One of SINTEF’s spin-off companies was in 2007 sold for NOK750 million and at the time, SINTEF owned 6% of this company’ shares.
C.4. Economy
C.4.1. Economic performanceExhibit 45 illustrates that the SINTEF Group has grown at an increasing rate in recent years; from 0% in 2004 to 16% in 2007. After a weak year in 2004, profits have increased rapidly and the profit margin was an impressive 11% in 2007. NOK100 million of the 2007 profit is explained by profits made from the sale of shares in two companies, together with accounting profits related to pensions. It is also noteworthy that all research divisions were profitable in 2007.127
Exhibit 45 The SINTEF Group’s total turnover and profit
Source: SINTEF Annual Report 2007
Exhibit 46 illustrates that the increase in total turnover since 2004 is mainly due to private national sales, which have grown by 16–18% per annum 2005–2007; all other categories have both increased and decreased in the period. The international category includes both grants and commercial sales. Apart from a notable drop in 2006, the share of international turnover in total turnover appears reasonably stable in the vicinity of 14%.
126 E-mail correspondence, Håkon Finne, Research Manager, SINTEF Technology and Society, 2008-12-
02.
127 SINTEF Annual Report 2007.
International Comparison of Five Institute Systems 82
The model has mainly been developed to manage IPR issues in larger projects127. Any profit gained is shared by the inventors and the research group behind the idea and SINTEF’s Investment Fund. This means that any profit is reinvested in SINTEF in or-der to develop the organisation and remain competitive. In 2007, the Group invested NOK20 million in its innovation concept and implemented six commercialisations. One of SINTEF’s spin-off companies was in 2007 sold for NOK750 million and at the time, SINTEF owned 6% of this company’ shares.
C.4. Economy
C.4.1. Economic performance
Exhibit 45 illustrates that the SINTEF Group has grown at an increasing rate in recent years; from 0% in 2004 to 16% in 2007. After a weak year in 2004, profits have in-creased rapidly and the profit margin was an impressive 11% in 2007. NOK100 million of the 2007 profit is explained by profits made from the sale of shares in two compa-nies, together with accounting profits related to pensions. It is also noteworthy that all research divisions were profitable in 2007.128
Exhibit 45 The SINTEF Group’s total turnover and profit. Source: SINTEF Annual Report 2007
‐100
0
100
200
300
400
0
500
1 000
1 500
2 000
2 500
2003 2004 2005 2006 2007
Profit [NOK million]
Turnover [N
OK million]
Turnover Profit
Exhibit 46 illustrates that the increase in total turnover since 2004 is mainly due to private national sales, which have grown by 16–18% per annum 2005–2007; all other categories have both increased and decreased in the period. The international category includes both grants and commercial sales. Apart from a notable drop in 2006, the share of international turnover in total turnover appears reasonably stable in the vicin-ity of 14%.
127 E-mail correspondence, Håkon Finne, Research Manager, SINTEF Technology and Society, 2008-12-02.
128 SINTEF Annual Report 2007.
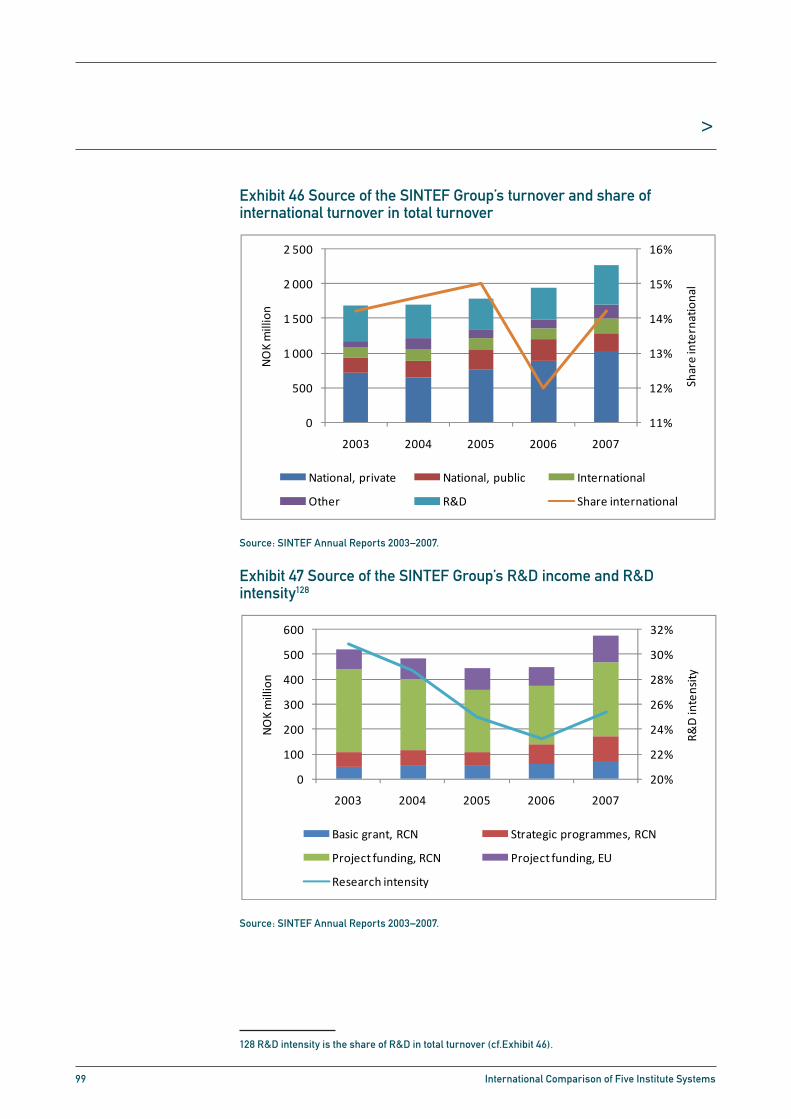
99 International Comparison of Five Institute Systems
>
Exhibit 46 Source of the SINTEF Group’s turnover and share of international turnover in total turnover
Source: SINTEF Annual Reports 2003–2007.
Exhibit 47 Source of the SINTEF Group’s R&D income and R&D intensity128
Source: SINTEF Annual Reports 2003–2007.
128 R&D intensity is the share of R&D in total turnover (cf.Exhibit 46).
International Comparison of Five Institute Systems 83
Exhibit 46 Source of the SINTEF Group’s turnover and share of international turnover in total turnover. Source: SINTEF Annual Reports 2003–2007.
11%
12%
13%
14%
15%
16%
0
500
1 000
1 500
2 000
2 500
2003 2004 2005 2006 2007
Share international
NOK million
National, private National, public International
Other R&D Share international
Exhibit 47 Source of the SINTEF Group’s R&D income and R&D intensity129.Source: SINTEF Annual Reports 2003–2007.
20%
22%
24%
26%
28%
30%
32%
0
100
200
300
400
500
600
2003 2004 2005 2006 2007
R&D intensity
NOK million
Basic grant, RCN Strategic programmes, RCN
Project funding, RCN Project funding, EU
Research intensity
SINTEF’s basic funding from RCN is composed of an unconditional basic grant and strategic programme grants specifically targeting the institute sector (see Section C.4.2). While the basic grant has increased throughout the period, see Exhibit 47, the strategic programme grants decreased in 2005; both grants increased notably in 2006 and 2007, and amounted to 7.6% of total turnover in 2007. Project funding, also origi-nating from RCN, decreased in 2004–2006, but then strongly increased in 2007. SINTEF’s income from EU’s Framework Programmes was around €40 million for FP6 and is so far approximately €23 million in FP7130. SINTEF has an ambition to grow
129 R&D intensity is the share of R&D in total turnover (cf.Exhibit 46). 130 Interview Ernst Kristiansen, VP SINTEF Building and Infrastructure, 2008-10-29.
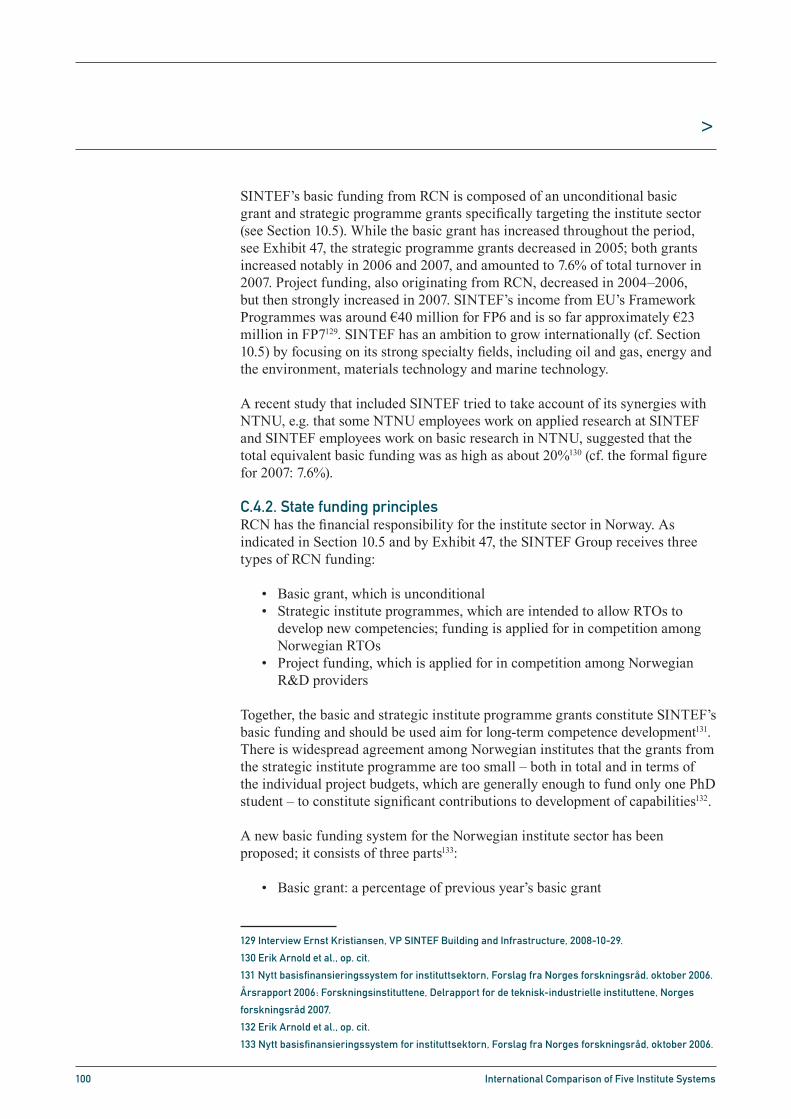
100 International Comparison of Five Institute Systems
>
SINTEF’s basic funding from RCN is composed of an unconditional basic grant and strategic programme grants specifically targeting the institute sector (see Section 10.5). While the basic grant has increased throughout the period, see Exhibit 47, the strategic programme grants decreased in 2005; both grants increased notably in 2006 and 2007, and amounted to 7.6% of total turnover in 2007. Project funding, also originating from RCN, decreased in 2004–2006, but then strongly increased in 2007. SINTEF’s income from EU’s Framework Programmes was around €40 million for FP6 and is so far approximately €23 million in FP7129. SINTEF has an ambition to grow internationally (cf. Section 10.5) by focusing on its strong specialty fields, including oil and gas, energy and the environment, materials technology and marine technology.
A recent study that included SINTEF tried to take account of its synergies with NTNU, e.g. that some NTNU employees work on applied research at SINTEF and SINTEF employees work on basic research in NTNU, suggested that the total equivalent basic funding was as high as about 20%130 (cf. the formal figure for 2007: 7.6%).
C.4.2. State funding principlesRCN has the financial responsibility for the institute sector in Norway. As indicated in Section 10.5 and by Exhibit 47, the SINTEF Group receives three types of RCN funding:
Basic grant, which is unconditional• Strategic institute programmes, which are intended to allow RTOs to • develop new competencies; funding is applied for in competition among Norwegian RTOsProject funding, which is applied for in competition among Norwegian • R&D providers
Together, the basic and strategic institute programme grants constitute SINTEF’s basic funding and should be used aim for long-term competence development131. There is widespread agreement among Norwegian institutes that the grants from the strategic institute programme are too small – both in total and in terms of the individual project budgets, which are generally enough to fund only one PhD student – to constitute significant contributions to development of capabilities132.
A new basic funding system for the Norwegian institute sector has been proposed; it consists of three parts133:
Basic grant: a percentage of previous year’s basic grant•
129 Interview Ernst Kristiansen, VP SINTEF Building and Infrastructure, 2008-10-29.
130 Erik Arnold et al., op. cit.
131 Nytt basisfinansieringssystem for instituttsektorn, Forslag fra Norges forskningsråd, oktober 2006.
Årsrapport 2006: Forskningsinstituttene, Delrapport for de teknisk-industrielle instituttene, Norges
forskningsråd 2007.
132 Erik Arnold et al., op. cit.
133 Nytt basisfinansieringssystem for instituttsektorn, Forslag fra Norges forskningsråd, oktober 2006.

101 International Comparison of Five Institute Systems
>
Indicator-based basic grants (i.e. performance contract): funding based • on indicators of quality and relevance that will constitute incentives for long-term competence development. The institutes themselves decide how funding is allocatedStrategic knowledge and competence projects: funding granted in • competition or in dialogue between institutes, ministries and RCN. This type of funding is to be used in instances when RCN and ministries want to assure the development of competencies within thematic areas not covered by the indicator-based grants. Hence, RCN and ministries see a need of detailed and direct governing of the competence development in the institute in order to create a well-functioning commission market
Publication and citation data is the most used indicator of successful research in the institute sector, as well as in the university sector. For SINTEF focusing on applied research publications of conference papers is valued as equally important134.
C.5.Capabilities
C.5.1. PersonnelIn 2007, SINTEF had 2 040 employees and 1 256 of them were employed by the SINTEF Foundation. The employees are mainly located in Trondheim and Oslo. Exhibit 48 shows the educational background of the personnel in 2007. The figure indicates that SINTEF’ staff is highly qualified, with 28% of employees having a doctorate and 68% having an MSc degree or higher. The fact that SINTEF’s share of employees with doctorates is so high can probably be explained by its close ties to NTNU and UiO (see further Section 10.5).
Exhibit 48 Educational background of SINTEF Group personnel
Source: SINTEF Annual Report 2007.
134 Ibid.
International Comparison of Five Institute Systems 85
C.5. Capabilities
C.5.1. Personnel
In 2007, SINTEF had 2 040 employees and 1 256 of them were employed by the SINTEF Foundation. The employees are mainly located in Trondheim and Oslo. Ex-hibit 48 shows the educational background of the personnel in 2007. The figure indi-cates that SINTEF’ staff is highly qualified, with 28% of employees having a doctorate and 68% having an MSc degree or higher. The fact that SINTEF’s share of employees with doctorates is so high can probably be explained by its close ties to NTNU and UiO (see further Section C.6.2).
Exhibit 48 Educational background of SINTEF Group personnel. Source: SINTEF Annual Report 2007.
Doctorates; 580; 28%
MSc or equivalent; 809;
40%
Other technical; 381; 19%
Administrative; 270; 13%
C.5.2. R&D effort
In 2007, SINTEF worked on approximately 6 000 projects, some of which take place in its long-term and formalised strategic alliances with key customers. For example, SINTEF has nine-year agreements with two oil companies about flow assurance in oil pipelines136.
An important component in SINTEF’s international cooperation is the institute’s par-ticipation in the EU’s Framework Programmes. Taking part in these Programmes within SINTEF’s leading research areas is a significant part of the institute’s globalisa-tion strategy. Accordingly, SINTEF participated in 112 projects in FP6 and is so far engaged in seven projects in FP7.
Another aspect of SINTEF’s internationalisation efforts is the establishment of foreign offices. In order to maintain contacts with major oil and gas companies, SINTEF has opened offices in Houston, Texas (USA), and Rio de Janeiro (Brazil). In addition, SINTEF has a laboratory in Hirtshals (Denmark), an office in Skopje (Former Yugo-slav Republic of Macedonia), and project offices in Warsaw (Poland) and Belgrade (Serbia).
136 OECD Reviews of Innovation policy: Norway, 2008.
102 International Comparison of Five Institute Systems
>
C.5.2 R&D effortIn 2007, SINTEF worked on approximately 6 000 projects, some of which take place in its long-term and formalised strategic alliances with key customers. For example, SINTEF has nine-year agreements with two oil companies about flow assurance in oil pipelines135.
An important component in SINTEF’s international cooperation is the institute’s participation in the EU’s Framework Programmes. Taking part in these Programmes within SINTEF’s leading research areas is a significant part of the institute’s globalisation strategy. Accordingly, SINTEF participated in 112 projects in FP6 and is so far engaged in seven projects in FP7.
Another aspect of SINTEF’s internationalisation efforts is the establishment of foreign offices. In order to maintain contacts with major oil and gas companies, SINTEF has opened offices in Houston, Texas (USA), and Rio de Janeiro (Brazil). In addition, SINTEF has a laboratory in Hirtshals (Denmark), an office in Skopje (Former Yugoslav Republic of Macedonia), and project offices in Warsaw (Poland) and Belgrade (Serbia).
C.5.3. Competence developmentThere is a pilot programme in SINTEF Materials and Chemistry for systematic competence development at different levels, individual, research group, department and institute. This “Competence Strategy” is currently being implemented throughout the institute. The RCN basic grant is used for strategic research, including competence development. There is no other formal competence development scheme at SINTEF, except for a number of introductory courses offered to new employees136. However, participation in individual projects is the main source of competence development.
Participation in the EU’s Framework programmes and the research networks thus create also constitute important sources of competence development. Moreover, as part of its strategy to stay up-to-date and develop internationally competitive research, the institute is engaged in collaboration projects with other European research institutes. For example, in 2007 SINTEF entered a cooperation agreement with VTT in Finland and TNO in the Netherlands (see Section 10.5)137.
135 OECD Reviews of Innovation policy: Norway, 2008.
136 The course package includes an introduction to SINTEF, project management, management, health,
environment and safety, research methodology and research ethics. Source: Interview Ernst Kristian-
sen, VP SINTEF Building and Infrastructure, 2008-10-29.
137 SINTEF Annual Report 2007.

103 International Comparison of Five Institute Systems
>
C.6. Knowledge dissemination
C.6.1. Dissemination activities to and cooperation with customersSINTEF’s main dissemination activities are through project-wise collaboration with its customers and through scientific publications. Other dissemination activities include SINTEF’s webpages and seminars. In addition, there is the popular-scientific Gemini journal, which is published by NTNU in collaboration with SINTEF; there are six issues a year in Norwegian and one per year in English.
C.6.2. University cooperationA distinctive characteristic of SINTEF is its close cooperation with NTNU. As described in Section 10.5, NTNU is represented on SINTEF’s Board and Council and SINTEF has its origins in the university (cf. Section 10.5) and has since continued developing this collaboration. Collaboration mainly takes place through sharing of employees, which means that SINTEF’s employees teach and perform research at NTNU and that NTNU personnel work on SINTEF projects. SINTEF and NTNU also use each other’s laboratories and instruments. In addition, there are regular management meetings and joint monitoring of research focus areas.
At the research group level, collaboration is manifested in Gemini-centres: “a model for strategic cooperation in which scientific groups with parallel interests coordinate their scientific efforts and jointly operate their resources”138. The aim of these centres is to develop large scientific groups of higher quality than either of the partners would manage to build up on their own and to develop internationally competitive research activities. There are 21 such centres, 18 of which have been established together with NTNU, two with the UiO, and one with the St. Olav Hospital in Trondheim139.
C.6.3. PublicationsTable 11 summarises the Group’s publication and knowledge dissemination output. Since reporting categories differ between annual reports, it is quite difficult to draw any overall conclusions. However, 2006 appears as a top year with 3 624 publications in total. This is also the year with most scientific contributions if one counts the first three categories of the Table as one category.
138 www.sintef.no/Home/About-us/The-Gemini-Centres-and-other-arenas-of-cooperation/
139 SINTEF Annual Report 2007.
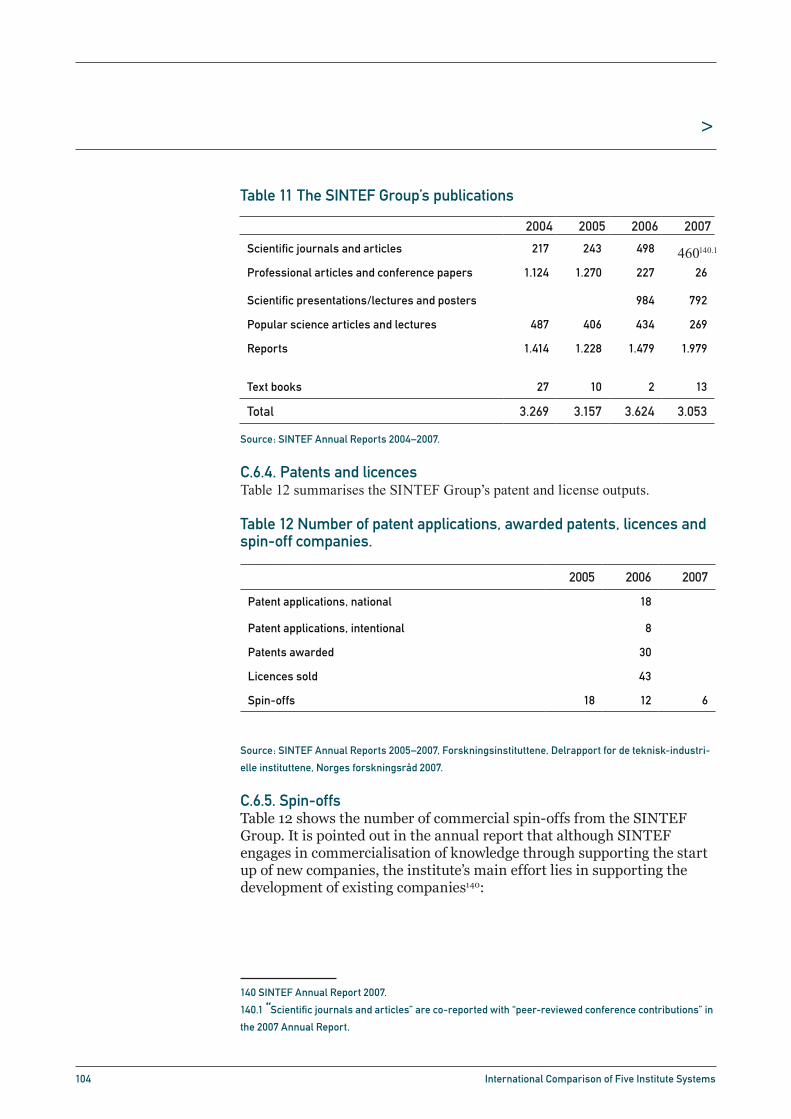
104 International Comparison of Five Institute Systems
>
Table 11 The SINTEF Group’s publications
Source: SINTEF Annual Reports 2004–2007.
C.6.4. Patents and licencesTable 12 summarises the SINTEF Group’s patent and license outputs.
Table 12 Number of patent applications, awarded patents, licences and spin-off companies.
Source: SINTEF Annual Reports 2005–2007, Forskningsinstituttene, Delrapport for de teknisk-industri-
elle instituttene, Norges forskningsråd 2007.
C.6.5. Spin-offsTable 12 shows the number of commercial spin-offs from the SINTEF Group. It is pointed out in the annual report that although SINTEF engages in commercialisation of knowledge through supporting the start up of new companies, the institute’s main effort lies in supporting the development of existing companies140:
140 SINTEF Annual Report 2007.
2004 2005 2006 2007
Scientific journals and articles 217 243 498
Professional articles and conference papers 1.124 1.270 227 26
Scientific presentations/lectures and posters 984 792
Popular science articles and lectures 487 406 434 269
Reports 1.414 1.228 1.479 1.979
Text books 27 10 2 13
Total 3.269 3.157 3.624 3.053
460140.1
140.1 “Scientific journals and articles” are co-reported with “peer-reviewed conference contributions” in
the 2007 Annual Report.
2005 2006 2007
Patent applications, national 18
Patent applications, intentional 8
Patents awarded 30
Licences sold 43
Spin-offs 18 12 6
105 International Comparison of Five Institute Systems
>
We are active stakeholders in our incubator companies and assist them in their ongoing development. The sale of our ownership interests in successful incubator companies releases funds which are invested in new knowledge development. However, the most important part of our work involves the development of the existing commercial sector.
As a non-commercial enterprise, SINTEF invests any profits made from the sale of a company in the institute’s research activities.
C.7. Appendix
C.7.1. The SINTEF Group’s strategy141
Focus area and goal: CustomersSINTEF is to contribute to knowledge generation, value creation and enhance its customers’ competitiveness.
Strategy:SINTEF is to deliver solutions and create new business opportunities for • its customers by using its innovative R&D partnership modelsSINTEF is to work together with NTNU, UiO and its other research • partners around the world to apply technology for a better societySINTEF is to provide top expertise by drawing on the resources from the • whole of the SINTEF GroupSINTEF is to increase international activities through marketing • initiatives and offer customers top level R&D expertise in selected areasSINTEF is to help its customers with regard to intellectual property • rights by establishing companies, and selling or licensing technological innovation
Focus area and goal: ScienceSINTEF is to be known for high-level scientific and professional quality and be an international leader in specific fields.
Strategy:SINTEF is to develop robust, leading international scientific groups • through strategic activities coordinated with NTNU, UiO and its other research partners around the worldSINTEF is to focus its strategic efforts in specific scientific areas where • it has leading expertise, as well as in areas with clear market potential or with attractive benefits for societySINTEF is to make its scientific and professional quality more widely • known by expanding its participation in European research programmes, as well as in domestic and international initiativesSINTEF is to continue to develop its national laboratories and join leading • international laboratory networks
141 www.sintef.no/Home/About-us/Our-Vision-and-Strategy/

106 International Comparison of Five Institute Systems
>
SINTEF is to publish its research work on a comparable level with other • leading international contract research organizationsSINTEF is to bring breakthroughs in science and technology to the • market
Focus area and goal: PeopleSINTEF is to be an attractive place to work offering unique prospects for those with the ability and drive to develop their potential.
Strategy:SINTEF is to ensure that high ethical standards and awareness of Health, • Safety and Environment (HSE) are applied to all of its activitiesSINTEF is to offer a work environment in which its staff are respected • and appreciated, and where they are given the opportunity to develop their abilities in cooperation with their colleaguesSINTEF is to offer professional challenges and tasks that have a high • value for its customers and societySINTEF is to recruit and keep competent people in a global labour market• SINTEF is to encourage team spirit, creativity and initiative in its • scientific groupsSINTEF is to develop leadership that is explicit, inclusive and inspiring•
C.7.2. Subsidiaries of SINTEF Holding AS, 2006142
142 www.sintef.no/Home/About-us/SINTEF-Holding/
Company Year of establishment
Location Owner share
SINTEF NBL AS 2000 Trondheim 100%
Sinvent AS 2004 Trondheim 100%
Sinvent Venture II 2006 Trondheim 100%
SINTEF MRB AS 2004 Ålesund 100%
SINTEF Venture II 2006 Trondheim 64%
SINTEF Venture III 2006 Trondheim 64%
Molab AS 1990 Mo i Rana 60%
Raufoss Technology & Industrial Management AS (RTIM)
2004 Raufoss 50%
SINTEF Nord 2008 Tromsö

107 International Comparison of Five Institute Systems
>
D.1. National business structureExhibit 49 shows that Germany’s most important private sectors are financial intermediation, manufacturing, and wholesale and retail trade. From Exhibit 50 one may deduce that the most important subsectors in terms of turnover within the mining, manufacturing and energy sectors are vehicles, i.e. mainly cars, trucks and buses, and chemicals. These two subsectors are followed by several sectors of more or less equal importance, which thus constitute a wide industrial base from a sectoral perspective; these subsectors are power generation, electrical and optical equipment, machinery, metals and food.
Exhibit 49 Share of value added by sector, 2007.
Source: Eurostat.
Germany is among the top performing EU25 countries with respect to research and innovation. The summary innovation index ranks Germany in fourth position within the EU25, and in 7th place worldwide. Germany shows a medium-high or high performance for twelve indicators in the European Innovation Scoreboard (EIS), while a medium-low performance is reported for two indicators only. At the same time, macroeconomic performance in terms of GDP growth, GDP per capita and employment is lagging behind most other EU countries. From 1994 onwards, real GDP has grown at a slower pace than in both the EU15 and the EU25, the unemployment ratio is among the highest in EU25, and GDP per capita is decreasing in relation to the EU25 average. The weak macroeconomic performance is contrasted by a still increasing strength in foreign trade, resulting in a considerable surplus in the trade balance. This reveals the high level of competitiveness of German industry, which is based on high R&D expenditures, strong innovation orientation and efficient production processes.143
143 European Trend Chart on Innovation: Annual Innovation Policy Trends and Appraisal Report Ger-
many 2006, European Commission, 2006.
Appendix D. The Fraunhofer-Gesellschaft
International Comparison of Five Institute Systems 90
Appendix DThe Fraunhofer-Gesellschaft
D.1. National business structure
Exhibit 49 shows that Germany’s most important private sectors are financial inter-mediation, manufacturing, and wholesale and retail trade. From Exhibit 50 one may deduce that the most important subsectors in terms of turnover within the mining, manufacturing and energy sectors are vehicles, i.e. mainly cars, trucks and buses, and chemicals. These two subsectors are followed by several sectors of more or less equal importance, which thus constitute a wide industrial base from a sectoral perspective; these subsectors are power generation, electrical and optical equipment, machinery, metals and food.
Exhibit 49 Share of value added by sector, 2007. Source: Eurostat.
Agriculture, fishing; 1%
Manufacturing; 26%
Construction; 4%
Wholesale and retail trade;
18%
Financial intermediation;
29%
Public administration, defence; 22%
Germany is among the top performing EU25 countries with respect to research and innovation. The summary innovation index ranks Germany in fourth position within the EU25, and in 7th place worldwide. Germany shows a medium-high or high per-formance for twelve indicators in the European Innovation Scoreboard (EIS), while a medium-low performance is reported for two indicators only. At the same time, mac-roeconomic performance in terms of GDP growth, GDP per capita and employment is lagging behind most other EU countries. From 1994 onwards, real GDP has grown at a slower pace than in both the EU15 and the EU25, the unemployment ratio is among the highest in EU25, and GDP per capita is decreasing in relation to the EU25 average. The weak macroeconomic performance is contrasted by a still increasing strength in foreign trade, resulting in a considerable surplus in the trade balance. This reveals the
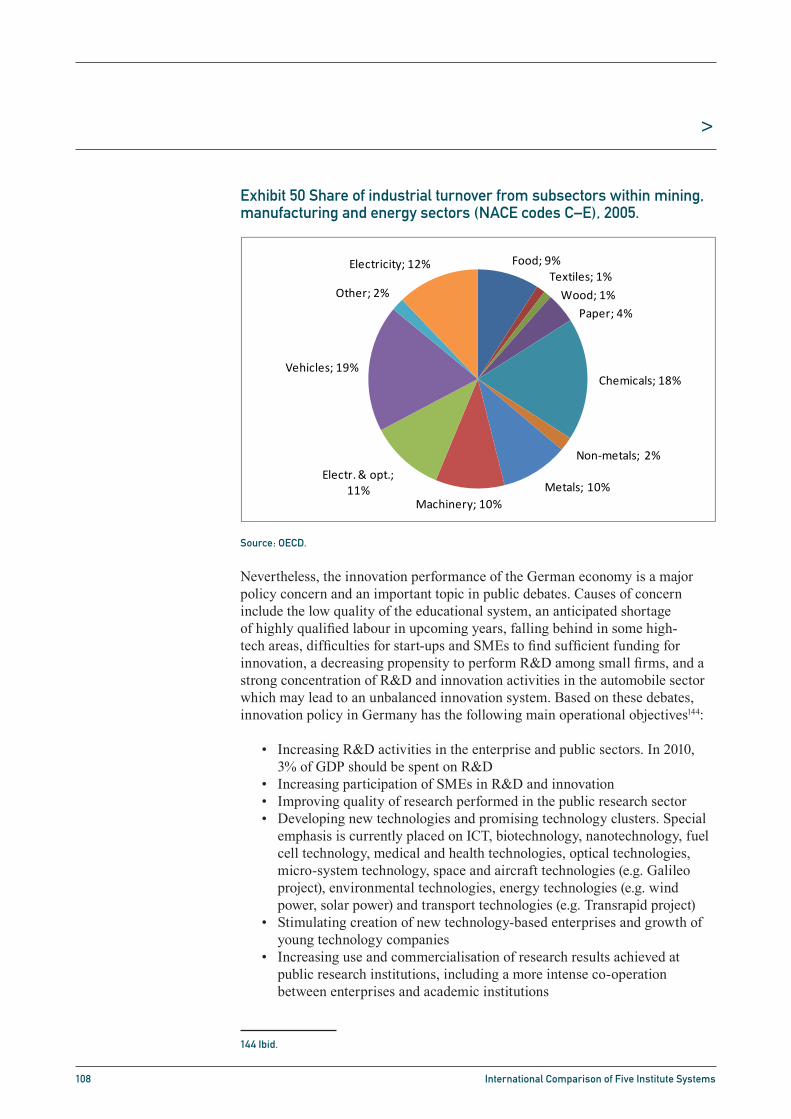
108 International Comparison of Five Institute Systems
>
Exhibit 50 Share of industrial turnover from subsectors within mining, manufacturing and energy sectors (NACE codes C–E), 2005.
Source: OECD.
Nevertheless, the innovation performance of the German economy is a major policy concern and an important topic in public debates. Causes of concern include the low quality of the educational system, an anticipated shortage of highly qualified labour in upcoming years, falling behind in some high-tech areas, difficulties for start-ups and SMEs to find sufficient funding for innovation, a decreasing propensity to perform R&D among small firms, and a strong concentration of R&D and innovation activities in the automobile sector which may lead to an unbalanced innovation system. Based on these debates, innovation policy in Germany has the following main operational objectives144:
Increasing R&D activities in the enterprise and public sectors. In 2010, • 3% of GDP should be spent on R&DIncreasing participation of SMEs in R&D and innovation• Improving quality of research performed in the public research sector• Developing new technologies and promising technology clusters. Special • emphasis is currently placed on ICT, biotechnology, nanotechnology, fuel cell technology, medical and health technologies, optical technologies, micro-system technology, space and aircraft technologies (e.g. Galileo project), environmental technologies, energy technologies (e.g. wind power, solar power) and transport technologies (e.g. Transrapid project)Stimulating creation of new technology-based enterprises and growth of • young technology companiesIncreasing use and commercialisation of research results achieved at • public research institutions, including a more intense co-operation between enterprises and academic institutions
144 Ibid.
International Comparison of Five Institute Systems 91
high level of competitiveness of German industry, which is based on high R&D expen-ditures, strong innovation orientation and efficient production processes.145
Exhibit 50 Share of industrial turnover from subsectors within mining, manu-facturing and energy sectors (NACE codes C–E), 2005. Source: OECD.
Food; 9%Textiles; 1%
Wood; 1%Paper; 4%
Chemicals; 18%
Non‐metals; 2%
Metals; 10%Machinery; 10%
Electr. & opt.; 11%
Vehicles; 19%
Other; 2%
Electricity; 12%
Nevertheless, the innovation performance of the German economy is a major policy concern and an important topic in public debates. Causes of concern include the low quality of the educational system, an anticipated shortage of highly qualified labour in upcoming years, falling behind in some high-tech areas, difficulties for start-ups and SMEs to find sufficient funding for innovation, a decreasing propensity to perform R&D among small firms, and a strong concentration of R&D and innovation activities in the automobile sector which may lead to an unbalanced innovation system. Based on these debates, innovation policy in Germany has the following main operational objectives146:
Increasing R&D activities in the enterprise and public sectors. In 2010, 3% of GDP should be spent on R&D
Increasing participation of SMEs in R&D and innovation
Improving quality of research performed in the public research sector
Developing new technologies and promising technology clusters. Special emphasis is currently placed on ICT, biotechnology, nanotechnology, fuel cell technology, medical and health technologies, optical technologies, micro-system technology, space and aircraft technologies (e.g. Galileo project), environmental technologies, energy technologies (e.g. wind power, solar power) and transport technologies (e.g. Transrapid project)
Stimulating creation of new technology-based enterprises and growth of young technology companies
145 European Trend Chart on Innovation: Annual Innovation Policy Trends and Appraisal Re-port Germany 2006, European Commission, 2006.
146 Ibid.
109 International Comparison of Five Institute Systems
>
Improving education in order to meet changes and increases in the • demand for highly qualified peoplePromoting innovation in the eastern • Länder in order to contribute to the economic restructuring of eastern GermanyFostering development of regional clusters in innovation in order to make • full use of complementary skills and competencies of the various actors in innovation systems
Germany’s three main challenges are145:
Education and supply of highly qualified labour:• Short-term measures include opening the German labour market to foreign experts (a Green Card Programme), whereas long-term measures include structural reforms of the educational system intended to increase both the number of university students in S&E and the number of students successfully finishing their studiesInnovation financing for high-tech start-ups and SMEs:• In response to the strong decrease in private venture capital (VC) investment for early stages, the federal government re-launched its VC programmes and introduced a new public VC fund that addresses this challengeCompetitiveness of the high-tech, especially ICT, sector:• Further areas where German performance is rather low are high-tech exports (low level and stagnating trend), ICT expenditures (average level, but slightly negative trend) and broadband penetration (low level, but positive trend). The federal government has launched a comprehensive IT programme in 2003 which tackles the main issues
D.2. Introduction146
The Fraunhofer-Gesellschaft147 maintains more than 80 research units, including 56 Fraunhofer Institutes in 40 different locations in Germany, see Exhibit 51. It has affiliated research centres and representative offices in Europe, the USA and Asia. It has more than 13 000 employees and an annual turnover of more than €1.3 billion.
Important defining characteristics of Fraunhofer research are:Fraunhofer research activities are application- and results-oriented. The • organisation pursues the implementation of innovative research findings in industrial and social applications. Its work is based on a dynamic balance between applied basic research and innovative development projectsFraunhofer research activities are decentralised. Fraunhofer institutes • use structured processes to identify areas of technology of relevance to industry and the short-term and long-term demands of the contract research market. Their choice of research fields is based on this information. A parallel approach on the part of the various institutes leads to a wide range of creative solutions
145 Ibid.
146 The main source for the text of this Section is the Fraunhofer website (www.fraunhofer.de).
147 The full name is Fraunhofer-Gesellschaft zur Förderung der angewandten Forschung.
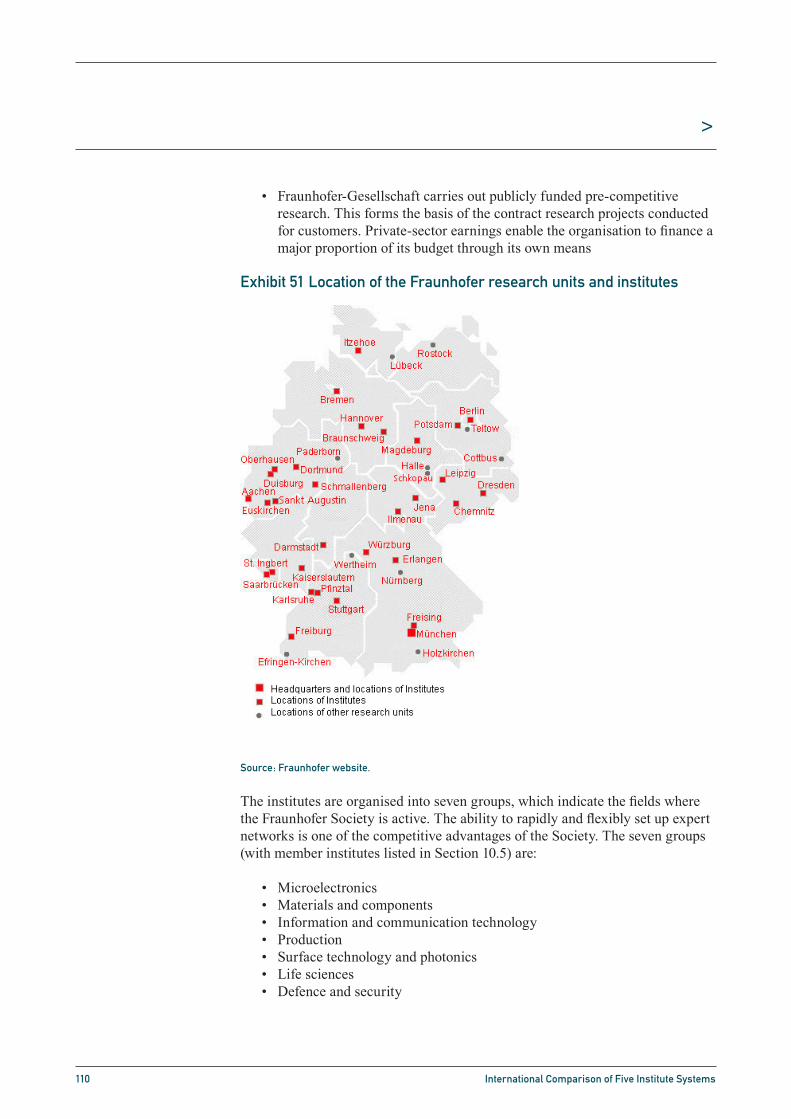
110 International Comparison of Five Institute Systems
>
Fraunhofer-Gesellschaft carries out publicly funded pre-competitive • research. This forms the basis of the contract research projects conducted for customers. Private-sector earnings enable the organisation to finance a major proportion of its budget through its own means
Exhibit 51 Location of the Fraunhofer research units and institutes
Source: Fraunhofer website.
The institutes are organised into seven groups, which indicate the fields where the Fraunhofer Society is active. The ability to rapidly and flexibly set up expert networks is one of the competitive advantages of the Society. The seven groups (with member institutes listed in Section 10.5) are:
Microelectronics• Materials and components• Information and communication technology• Production• Surface technology and photonics• Life sciences• Defence and security•
International Comparison of Five Institute Systems 93
Exhibit 51 Location of the Fraunhofer research units and institutes. Source: Fraunhofer website.
The institutes are organised into seven groups, which indicate the fields where the Fraunhofer Society is active. The ability to rapidly and flexibly set up expert networks is one of the competitive advantages of the Society. The seven groups (with member institutes listed in Section D.7.1) are:
Microelectronics
Materials and components
Information and communication technology
Production
Surface technology and photonics
Life sciences
Defence and security
A large number of employees is involved in cross-institute alliances, which illustrate the effort to network on common themes, across organisational boundaries within the highly decentralised Fraunhofer organisation, see Exhibit 52. (The Defence and Secu-rity Alliance is not included, because its five institutes are also members of other alli-ances.)

111 International Comparison of Five Institute Systems
>
A large number of employees is involved in cross-institute alliances, which illustrate the effort to network on common themes, across organisational boundaries within the highly decentralised Fraunhofer organisation, see Exhibit 52. (The Defence and Security Alliance is not included, because its five institutes are also members of other alliances.)
Exhibit 52 The number of employees involved in cross-institute alliances
Source: Fraunhofer website.
As illustrated by Exhibit 51, the Fraunhofer Society is now located across all of Germany. In addition to its European liaison offices, the Society has six Fraunhofer Centers in the USA and representative offices in Japan, China, Indonesia, Russia, the United Arab Emirates and is planning to open further international offices. The purpose of the international activities is to:
Advance the level of scientific and engineering know-how and exploiting • the innovation potential of competing centres of excellence through local presence and involvementPenetrate new markets for research services and for the technologies • offered by institutes in Germany and their industrial partnersOffer wider opportunities for staff development by adding an international • aspect, both in terms of scientific knowledge and with respect to the encounter with other management styles and business cultures, including foreign-language and social skillsContinue improvement of problem-solving skills through a wider range • of projects often based on other market needs and other customer requirements
International Comparison of Five Institute Systems 94
Exhibit 52 The number of employees involved in cross-institute alliances. Source: Fraunhofer website.
298
568
728
1 110
1 604
1 673
1 846
0 500 1 000 1 500 2 000
Institutes that are not part of any alliance
Life sciences
Surface technology and photonics
Production
Materials and components
Microelectronics
Information and communication technology
As illustrated by Exhibit 51, the Fraunhofer Society is now located across all of Ger-many. In addition to its European liaison offices, the Society has six Fraunhofer Cen-ters in the USA and representative offices in Japan, China, Indonesia, Russia, the United Arab Emirates and is planning to open further international offices. The pur-pose of the international activities is to:
Advance the level of scientific and engineering know-how and exploiting the inno-vation potential of competing centres of excellence through local presence and in-volvement
Penetrate new markets for research services and for the technologies offered by institutes in Germany and their industrial partners
Offer wider opportunities for staff development by adding an international aspect, both in terms of scientific knowledge and with respect to the encounter with other management styles and business cultures, including foreign-language and social skills
Continue improvement of problem-solving skills through a wider range of projects often based on other market needs and other customer requirements
D.2.1. Business concept and strategy
The Society’s mission statement contains two points about the services and one point about the importance of the staff:
The Fraunhofer Society promotes and undertakes applied research in an interna-tional context, of direct utility to private and public enterprise and of wide benefit to society as a whole
By developing technological innovations and novel systems solutions for their cus-tomers, the Fraunhofer institutes help to reinforce the competitive strength of the economy in their region, throughout Germany and in Europe. Their research ac-tivities are aimed at promoting the economic development of industrial society, with particular regard for social welfare and environmental compatibility
As an employer, the Society offers a platform that enables its staff to develop the necessary professional and personal skills that will enable them to assume posi-tions of responsibility within their institute, in industry and in other scientific do-mains

112 International Comparison of Five Institute Systems
>
D.2.1. Business concept and strategyThe Society’s mission statement contains two points about the services and one point about the importance of the staff:
The Fraunhofer Society promotes and undertakes applied research in an • international context, of direct utility to private and public enterprise and of wide benefit to society as a wholeBy developing technological innovations and novel systems solutions for • their customers, the Fraunhofer institutes help to reinforce the competitive strength of the economy in their region, throughout Germany and in Europe. Their research activities are aimed at promoting the economic development of industrial society, with particular regard for social welfare and environmental compatibilityAs an employer, the Society offers a platform that enables its staff to • develop the necessary professional and personal skills that will enable them to assume positions of responsibility within their institute, in industry and in other scientific domains
The mission statement is elaborated into a set of guiding principles, for example that the Society acts autonomously in defining its own strategic orientation, on which it bases its planned research activities. This orientation is, however, closely aligned to the objectives of national and European economic and research policy.
D.2.2. GovernanceThe General Assembly is made up of the members of the Fraunhofer Society. Official membership is open to members of the Senate, the Executive Board, institute directors and senior management and the governing boards. Ordinary membership is open to natural persons and legal entities who wish to support the work of the Society. Honorary members may be elected from among the research staff and patrons of the Society in recognition of outstanding services to the organisation.
The General Assembly meets once a year. It elects the members of the Senate and discharges the Executive Board of its responsibilities. It also formulates decisions concerning amendments to the Statute.
The Senate is made up of eminent figures from the world of science, business, industry, and public life, plus representatives of national and regional government, and members of the Scientific and Technical Council. The Senate has a total membership of approximately 30 persons. It meets twice a year.The Senate is responsible for decisions concerning basic science and research policy. It also formulates decisions concerning the establishment, the incorporation or devolution, the merger and dissolution of research entities belonging to the Society. The Senate is also responsible for appointing members of the Executive Board.
The Scientific and Technical Council is the organisation’s internal advisory body. It consists of the directors and senior management of the institutes and an elected representative of the scientific and technical staff of each institute.
113 International Comparison of Five Institute Systems
>
The Scientific and Technical Council provides advice to the Executive Board and other constituent bodies in matters of fundamental importance. It issues recommendations concerning research and human resources policy. Furthermore, the Scientific and Technical Council issues statements of opinion concerning the creation of new institutes or the closure of existing institutes, and participates in the appointment of the directors of the institutes. The official duties of the Scientific and Technical Council are exercised by a standing committee consisting of nine members.
The Executive Board of the Fraunhofer Society consists of the President and three other full-time members (Senior Vice Presidents). The Executive Board is responsible for managing the business activities of the Society and represents the organisation both internally and externally. It elaborates the basic premises of the organisation’s science and research policy and draws up business-development and financial plans. The Executive Board also negotiates to obtain institutional funding for the Society and defines how it is to be distributed among the institutes. A further duty of the Executive Board is to appoint the directors of the institutes.
The Presidential Council consists of the members of the Executive Board and the chairmen of six of the seven working alliances. It participates in Executive Board decision-making processes and as such is entitled to make proposals and recommendations and has the right to be heard. The Presidential Council meets once a quarter.
The Governing Boards are external advisory bodies attached to the institutes, and consist of representatives of science, industry, business and public life. For each institute, approximately twelve members are appointed to the governing board by the Executive Board with the approval of the director(s) of the institute. Their annual meetings are attended by at least one member of the Executive Board. They act as advisors to the director(s) of the institute and the Executive Board on matters concerning the research orientation and any structural changes to the institute.
D.2.3. HistoryThe Fraunhofer Society was founded in 1949 and is named after Joseph von Fraunhofer (1787–1826), a Munich researcher and entrepreneur (in optics and precision mechanics). The Society was founded as part of a programme to reorganise and expand Germany’s research infrastructure. In its early years, the main function of the Society was predominantly administrative: to raise funds through government bodies, donations and association members for distribution to research projects of relevance to industry. Initial activities primarily focused on industry in Bavaria. This being the early post-war period, there was a particular need for research in the fields of mining, the iron and steel industry and mechanical engineering.
The Society’s first own research institute was founded in 1954. The Fraunhofer funding model came into force in 1971. From then onward, the organisation’s research capacity was continually augmented through the creation of new institutes, the incorporation of other research establishments and the expansion

114 International Comparison of Five Institute Systems
>
of existing institutes. Market forces have occasionally made it necessary to devolve or close down certain research units.
Recent milestones include the takeover in 1991 of numerous research establishments in the former East Germany, and the incorporation of the institutes of the GMD – Forschungszentrum für Informationstechnik GmbH in 2001, see Exhibit 53.
Exhibit 53 Development of the number of Fraunhofer institutes.
Source: Fraunhofer website.
As a response to the globalisation of industry and science, Fraunhofer in 1993 stepped up its international activities. There are now six Fraunhofer centers in the USA.
D.3. Role in National Innovation SystemThe Fraunhofer Society has a very strong role as provider of applied research to German companies, especially SMEs. It operates in a landscape with many other institutes, which are often more geared towards basic research, and where other organisations provide services for SMEs, e.g. the universities and polytechnics (Fachhochschulen).
The purpose of the Fraunhofer institutes is to transform scientific findings into useful innovations. It acts autonomously in defining its own strategic orientation, on which it bases its planned research activities, but this orientation is closely aligned with the objectives of national and European economic and research policy.
The Society is an independent organisation and takes a neutral stance with respect to the demands of individual interest groups in the domains of politics, industry or society. It takes active part in the ongoing dialogue between the scientific community and the general public. It openly participates in the
International Comparison of Five Institute Systems 96
D.2.3. History
The Fraunhofer Society was founded in 1949 and is named after Joseph von Fraun-hofer (1787–1826), a Munich researcher and entrepreneur (in optics and precision mechanics). The Society was founded as part of a programme to reorganise and ex-pand Germany’s research infrastructure. In its early years, the main function of the Society was predominantly administrative: to raise funds through government bodies, donations and association members for distribution to research projects of relevance to industry. Initial activities primarily focused on industry in Bavaria. This being the early post-war period, there was a particular need for research in the fields of mining, the iron and steel industry and mechanical engineering.
The Society’s first own research institute was founded in 1954. The Fraunhofer fund-ing model came into force in 1971. From then onward, the organisation’s research ca-pacity was continually augmented through the creation of new institutes, the incorpo-ration of other research establishments and the expansion of existing institutes. Mar-ket forces have occasionally made it necessary to devolve or close down certain re-search units.
Recent milestones include the takeover in 1991 of numerous research establishments in the former East Germany, and the incorporation of the institutes of the GMD – For-schungszentrum für Informationstechnik GmbH in 2001, see Exhibit 53.
Exhibit 53 Development of the number of Fraunhofer institutes. Source: Fraunhofer website.
As a response to the globalisation of industry and science, Fraunhofer in 1993 stepped up its international activities. There are now six Fraunhofer centers in the USA.
D.3. Role in National Innovation System
The Fraunhofer Society has a very strong role as provider of applied research to Ger-man companies, especially SMEs. It operates in a landscape with many other insti-tutes, which are often more geared towards basic research, and where other organisa-tions provide services for SMEs, e.g. the universities and polytechnics (Fach-hochschulen).
The purpose of the Fraunhofer institutes is to transform scientific findings into useful innovations. It acts autonomously in defining its own strategic orientation, on which it bases its planned research activities, but this orientation is closely aligned with the objectives of national and European economic and research policy.

115 International Comparison of Five Institute Systems
>
political and social debate surrounding areas of research in which it is active or concerning which it is capable of presenting factual information.
D.3.1. Types of servicesThe Society develops products and processes through to technical or commercial maturity. Individual solutions are elaborated in direct contact with the customer. If necessary, several institutes work together to produce more complex system solutions. The following services can be provided:
Product development and optimisation through to prototype • manufacturingDevelopment and optimisation of technologies and production processes• Support with the introduction of new technologies, by:•
Conducting trials in demonstration centres equipped with state-of-the- -art test facilitiesTraining the customer’s staff on site -Providing support services that extend beyond the initial phases of a -new process or product
Technology assessment support, in the form of:• Feasibility studies -Market surveys -Trend analysis reports -Environmental audits -Pre-investment analysis reports -
Supplementary services, e.g.:• Advice on sources of funding, especially for SMEs -Accredited test services, including issue of test certificates -
Training with a practical focus• International patent applications•
Contract research is the most important of all the Society’s activities. These services focus on the needs of industry as well as of government and society. The Society develops solutions of direct practical value to technical and organisational problems and contributes to the wide-scale implementation of new technologies. Companies of all sizes in the manufacturing and service sectors benefit from contract research. The Society represents an important source of innovative know-how for SMEs that do not maintain their own R&D departments.
Research activities undertaken by the Society encompass more than fulfilling contract obligations. Basic and project-related funding by the German federal ministry of education and research enables the Society to conduct non-contract advanced research into technological fields which hold high promise for the future. This paves the way for entry into new markets. Expertise acquired through this research by the institutes is of course made available to industry through collaborative projects.Relations to other national R&D suppliersThe Fraunhofer Society and two other important R&D actors are described in the Exhibit 54, in terms of what they do and how they are funded. Other German institute systems like the Max Planck Society (MPG), the Helmholtz Association (HGF) and the Leibniz Association (WGL) are more involved in basic research,

116 International Comparison of Five Institute Systems
>
where the level of public funding tends be higher. Overall, industry is seldom involved in basic research and funds its R&D through its own funds. Industry also provides funds for the German Federation of Industrial Cooperative Research Associations (AiF/IGF), which is a funding body. Fraunhofer sees itself as operating in-between the two extremes, see Exhibit 54.
Exhibit 54 Schematic of correlation between degree of applicability of research and degree of public funding
Source: Fraunhofer website.
The Society receives funding both from the public sector (approximately 40%) and through contract research earnings (approximately 60%). As a consequence, the Society operates in a dynamic equilibrium between application-oriented fundamental research and innovative development projects.
The Society competes and collaborates with universities and polytechnics. Often institute directors hold chairs at universities and polytechnics and are nominated in consultation with the university. The Society competes with research institutes at the universities (An-Instituten), which do similar things and charge lower fees148.
D.3.3. CustomersThe vast range of services provided means that the Fraunhofer institutes work with a multitude of customers, public and private, as well as national and international. In 2007, industrial turnover from projects was €422 million, of which €94 million was license fees. Turnover from projects for the federal administration and Länder governments was €228 million. Contracts for international customers, including industry, EU funding etc., generated €125 million. Among industrial customers, the Society is known to work in particular with SMEs (which in Germany is defined as companies with less than 500 employees).
148 Rebecca Harding, “Resilience in German Technology Policy: Innovation through Institutional Symbio-
tic Tension”, Industry and Innovation, 7(2):233, 2000.
International Comparison of Five Institute Systems 98
D.3.2. Relations to other national R&D suppliers
The Fraunhofer Society and two other important R&D actors are described in the Ex-hibit 54, in terms of what they do and how they are funded. Other German institute systems like the Max Planck Society (MPG), the Helmholtz Association (HGF) and the Leibniz Association (WGL) are more involved in basic research, where the level of public funding tends be higher. Overall, industry is seldom involved in basic research and funds its R&D through its own funds. Industry also provides funds for the German Federation of Industrial Cooperative Research Associations (AiF/IGF), which is a funding body. Fraunhofer sees itself as operating in-between the two extremes, see Exhibit 54.
Exhibit 54 Schematic of correlation between degree of applicability of research and degree of public funding. Source: Fraunhofer website.
The Society receives funding both from the public sector (approximately 40%) and through contract research earnings (approximately 60%). As a consequence, the Soci-ety operates in a dynamic equilibrium between application-oriented fundamental re-search and innovative development projects.
The Society competes and collaborates with universities and polytechnics. Often insti-tute directors hold chairs at universities and polytechnics and are nominated in con-sultation with the university. The Society competes with research institutes at the uni-versities (An-Instituten), which do similar things and charge lower fees150.
D.3.3. Customers
The vast range of services provided means that the Fraunhofer institutes work with a multitude of customers, public and private, as well as national and international. In 2007, industrial turnover from projects was €422 million, of which €94 million was license fees. Turnover from projects for the federal administration and Länder gov-ernments was €228 million. Contracts for international customers, including industry, EU funding etc., generated €125 million. Among industrial customers, the Society is known to work in particular with SMEs (which in Germany is defined as companies with less than 500 employees). About 40% of contract research for industry is carried
150 Rebecca Harding, “Resilience in German Technology Policy: Innovation through Institu-tional Symbiotic Tension”, Industry and Innovation, 7(2):233, 2000.

117 International Comparison of Five Institute Systems
>
About 40% of contract research for industry is carried out for companies with less than 500 employees, about 25% for companies with 500–10 000 employees and about 35% for companies with more than 10 000 employees.149
In a survey a few years ago it was found that approximately 50% of the industrial turnovers were from SMEs. Since SME projects are usually smaller than those of large companies, this indicates that Fraunhofer has above 50% SME customers. The numbers should still be accurate.150
D.3.4. Innovation modelThe model of innovation of the Fraunhofer Society can be described as a network model, where the Society has a number of links with firms and other organisations in the innovation field, such as universities and polytechnics, even though it is open for collaboration with everyone. The network, together with a strong reputation, makes it fairly easy for small and big firms to establish a contact with the Society.
D.3.5. Trends and drivers for changeThe Fraunhofer model allows the organisation to set up new institutes where it sees a new market demand. A common criticism is that this works well for traditional industry, where Germany is strong. It is more difficult to move into high-tech fields where more basic research is needed and where the demand is lower.151 This situation is worrying in the perspective of Germany’s main challenges (see Section 10.5 above).
D.3.6 Recent and anticipated changesThe Society has analysed current macro trends and identified fields of research that will play a particularly important role in the future in meeting challenges such as climate change, dwindling resources and preventative healthcare. 180 individual topics belonging to 95 thematic areas are being analysed. This led to the designation of twelve Fraunhofer frontline themes in 2008:
Assisted personal health• Bio-functional surfaces• Decentralized integrated water management• Integrated localization technology• Energy self-sufficient sensors and sensor networks• Energy-efficient modernization• Energy storage in power grids• Food chain management• Green powertrain technologies• Hybrid material structures• Solid-state light sources• Visual analytics•
149 Erik Arnold, Neil Brown, Annelie Eriksson, Tommy Jansson, Alessandro Muscio, Johanna Nählinder
and Rapela Zaman, “The Role of Industrial Research Institutes in the National Innovation System”, VIN-
NOVA, VA 2007:12, 2007.
150 E-mail correspondence, Torsten Nyncke, Fraunhofer-Gesellschaft.
151 Rebecca Harding, op. cit.

118 International Comparison of Five Institute Systems
>
Organisational changes include the creation of regional Fraunhofer Innovation Clusters, cooperation with the Max Planck Society by setting up joint project groups and the establishment of the Fraunhofer Technology Academy (see Section 10.5).
In contrast to several other research organisations in Europe, the Fraunhofer Society is not under organisational review. To some extent, this high level of legitimacy can be explained by the funding model, where the Society attracts its own funding, independently of government decisions.
D.4. Economy
D.4.1. Economic performanceExhibit 55 shows a more or less steady increase in turnover and an ongoing diversification of clients; the average growth rate for the period is over 6% per annum. As a non-profit organisation, the Fraunhofer Society cannot make a profit. However, primarily due to license-fee revenues (see further Section 10.5), the Society has been able to set aside substantial amounts to reserves (€105 million, €66 million and €65 million for 2005, 2006 and 2007, respectively), thus providing a measure of the soundness and profitability of the organisation. It is being discussed whether a foundation should be set up as an instrument for further savings and acts as a barrier to financial fluctuations.
Exhibit 55 also shows the composition of turnover. Private and public (including projects for both federal and Länder governments, including defence research) are both commercial activities, whereas R&D comprises basic funding, funding from the EU and other research funding agencies, as well as federal and Länder funding for infrastructure investments. The Exhibit also shows the international share of total turnover (note that the international share is based on combined income from international commercial activities and grants).
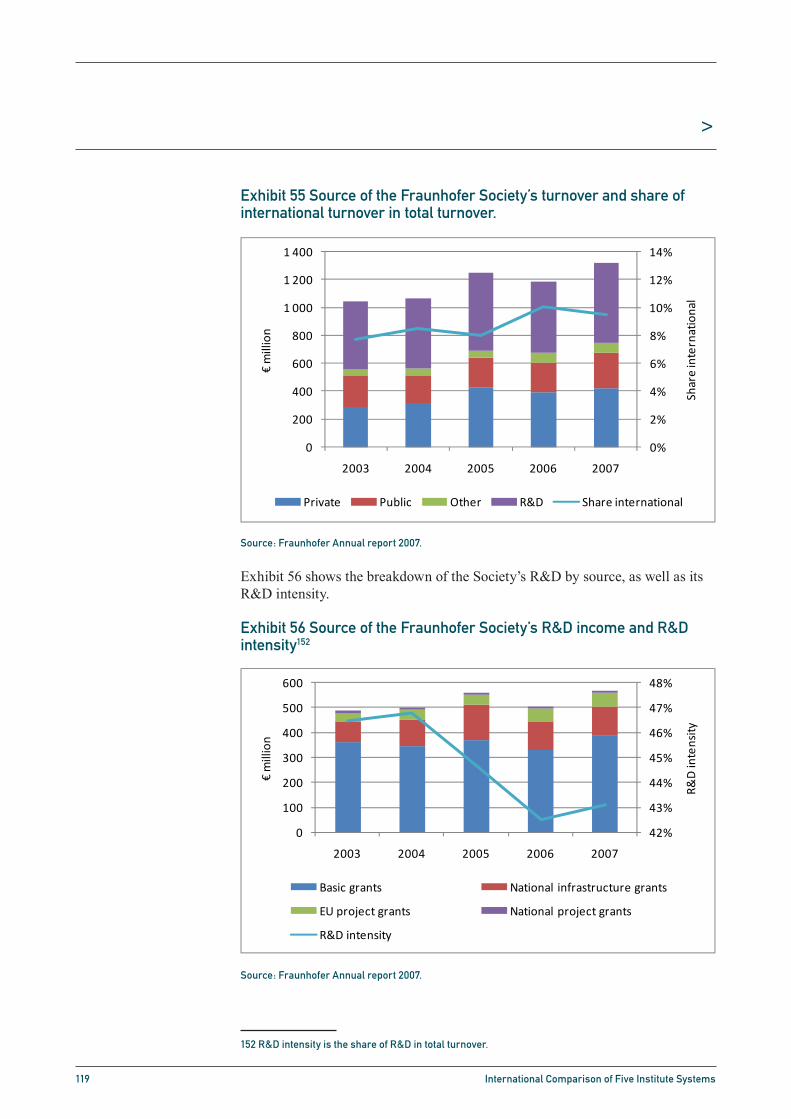
119 International Comparison of Five Institute Systems
>
Exhibit 55 Source of the Fraunhofer Society’s turnover and share of international turnover in total turnover.
Source: Fraunhofer Annual report 2007.
Exhibit 56 shows the breakdown of the Society’s R&D by source, as well as its R&D intensity.
Exhibit 56 Source of the Fraunhofer Society’s R&D income and R&D intensity152
Source: Fraunhofer Annual report 2007.
152 R&D intensity is the share of R&D in total turnover.
International Comparison of Five Institute Systems 100
Organisational changes include the creation of regional Fraunhofer Innovation Clus-ters, cooperation with the Max Planck Society by setting up joint project groups and the establishment of the Fraunhofer Technology Academy (see Section D.6.1).
In contrast to several other research organisations in Europe, the Fraunhofer Society is not under organisational review. To some extent, this high level of legitimacy can be explained by the funding model, where the Society attracts its own funding, independ-ently of government decisions.
D.4. Economy
D.4.1. Economic performance
Exhibit 55 shows a more or less steady increase in turnover and an ongoing diversifi-cation of clients; the average growth rate for the period is over 6% per annum. As a non-profit organisation, the Fraunhofer Society cannot make a profit. However, pri-marily due to license-fee revenues (see further Section D.6.4), the Society has been able to set aside substantial amounts to reserves (€105 million, €66 million and €65 million for 2005, 2006 and 2007, respectively), thus providing a measure of the soundness and profitability of the organisation. It is being discussed whether a foun-dation should be set up as an instrument for further savings and acts as a barrier to financial fluctuations.
Exhibit 55 also shows the composition of turnover. Private and public (including pro-jects for both federal and Länder governments, including defence research) are both commercial activities, whereas R&D comprises basic funding, funding from the EU and other research funding agencies, as well as federal and Länder funding for infra-structure investments. The Exhibit also shows the international share of total turnover (note that the international share is based on combined income from international commercial activities and grants).
Exhibit 55 Source of the Fraunhofer Society’s turnover and share of interna-tional turnover in total turnover. Source: Fraunhofer Annual report 2007.
0%
2%
4%
6%
8%
10%
12%
14%
0
200
400
600
800
1 000
1 200
1 400
2003 2004 2005 2006 2007
Share international
€million
Private Public Other R&D Share international
Exhibit 56 shows the breakdown of the Society’s R&D by source, as well as its R&D intensity.
International Comparison of Five Institute Systems 101
Exhibit 56 Source of the Fraunhofer Society’s R&D income and R&D inten-sity154. Source: Fraunhofer Annual report 2007.
42%
43%
44%
45%
46%
47%
48%
0
100
200
300
400
500
600
2003 2004 2005 2006 2007
R&D intensity
€million
Basic grants National infrastructure grants
EU project grants National project grants
R&D intensity
D.4.2. State funding principles
The research contracts provide most of the funding for the institutes, often 70–80% of the annual budget. The rest is public basic funding, 90% of which is federal and 10% comes from the particular Land (state) in which the institute is located. Since a gen-eral agreement was made by the national and state governments to share the basic funding, it has been relatively easy for the Society to set up new institutes if it sees a demand for contract research in new areas. About one new institute has been set up per year since 1975155 (cf. Exhibit 53).
The funding arrangements are referred to as a Drittellösung, where a third each is provided by basic funding, public contracts and private contracts. The amount of basic funding is related to the amount of contract funding in a “pound for pound” model which rewards entrepreneurial behaviour; the more contracts, the more basic funding. The formula increases the percentage of basic funding with the level of industrial con-tracts, which means that the exact amounts differ among the institutes depending on the level of industrial contracts.156 The model can be described as a very open per-formance contract. It is a funding arrangement which makes the Fraunhofer Society highly dependent on the market, and contributes to its entrepreneurial inclinations.
Recently, a Pact for Research and Innovation was agreed upon by the federal and Landgovernments. It provides a common platform for what is otherwise a very fragmented national system of research and innovation. One of the components is an agreement on an annual increase of 3% in base funding for the Society until 2010. Another com-ponent is an increased emphasis on networking, for example in regional clusters and with the Max Planck Society.
As a non-profit organisation (eingetragener Verein, e.V.), the Fraunhofer Society is not allowed to raise funds on the capital markets or maintain credit facilities with
154 R&D intensity is the share of R&D in total turnover. 155 Frieder Meyer-Krahmer, “The German Innovation System” in Larédo, Philippe & Philippe
Mustar (eds): Research and Innovation Policies in the New Global Economy. An Interna-tional Comparative Analysis, Cheltenham: Edward Elgar, 2001.
156 Rebecca Harding, op. cit.

120 International Comparison of Five Institute Systems
>
D.4.2. State funding principlesThe research contracts provide most of the funding for the institutes, often 70–80% of the annual budget. The rest is public basic funding, 90% of which is federal and 10% comes from the particular Land (state) in which the institute is located. Since a general agreement was made by the national and state governments to share the basic funding, it has been relatively easy for the Society to set up new institutes if it sees a demand for contract research in new areas. About one new institute has been set up per year since 1975153 (cf. Exhibit 53).
The funding arrangements are referred to as a Drittellösung, where a third each is provided by basic funding, public contracts and private contracts. The amount of basic funding is related to the amount of contract funding in a “pound for pound” model which rewards entrepreneurial behaviour; the more contracts, the more basic funding. The formula increases the percentage of basic funding with the level of industrial contracts, which means that the exact amounts differ among the institutes depending on the level of industrial contracts.154 The model can be described as a very open performance contract. It is a funding arrangement which makes the Fraunhofer Society highly dependent on the market, and contributes to its entrepreneurial inclinations.
Recently, a Pact for Research and Innovation was agreed upon by the federal and Land governments. It provides a common platform for what is otherwise a very fragmented national system of research and innovation. One of the components is an agreement on an annual increase of 3% in base funding for the Society until 2010. Another component is an increased emphasis on networking, for example in regional clusters and with the Max Planck Society.
As a non-profit organisation (eingetragener Verein, e.V.), the Fraunhofer Society is not allowed to raise funds on the capital markets or maintain credit facilities with banks. It is dependent on cash assets, which makes it difficult to adapt financial and human resources in the short term to changing economic conditions. Another economic concern is that publicly funded projects are underfinanced, forcing the Society to use its basis funding to cover its costs, limiting its room for autonomous initiatives.
D.5. Capabilities
D.5.1. PersonnelThe majority of the 13 630 staff are qualified scientists and engineers; quantitative date regarding the educational level of the personnel has not been made available. 500 new jobs were created in 2007, and more than 1 000 were scheduled to be created in 2008. €100 million are set aside for a programme to attract top-class scientists.
153 Frieder Meyer-Krahmer, “The German Innovation System” in Larédo, Philippe & Philippe Mustar
(eds): Research and Innovation Policies in the New Global Economy. An International Comparative Ana-
lysis, Cheltenham: Edward Elgar, 2001.
154 Rebecca Harding, op. cit.

121 International Comparison of Five Institute Systems
>
The salary structure is determined through collective bargaining, wherein the Society allows some room for variable payments (bonuses).
D.5.2. Competence developmentThe Society has a policy of systematically furthering the skills and qualifications of its employees, who in turn apply their acquired expertise in the results-oriented furtherance of the organisation’s interests. Participation in individual projects and in particular FP projects is another important source of competence development. The knowledge and skills acquired by members of staff also enable them to later take up positions of responsibility outside the Society. This “brain transfer” – the dissemination of technological know-how through individual persons – is one of the major functions of the Society.
D.6. Knowledge dissemination
D.6.1. Dissemination activities to and cooperation with customersContract research for industry is a central activity of the Fraunhofer Society and is its main dissemination activity. To introduce new firms to such cooperation, the institutes arrange Technology Days tailored to each company:
In a first conversation, the company defines its objectives and • technological focusThe Society identifies the right experts from the various institutes for the • company to assess and prioritise, whereupon it arranges a programme customised for the companyDuring the Technology Day itself, the institute experts give a lecture • oriented towards the company’s demand, discuss its interests and get to know the experts of the company. If necessary, non-disclosure agreements are signed before the event
In the Pact for Research and Innovation, the Society has assumed the task of conceiving and implementing innovation clusters. Such collaborative ventures set themselves clear goals and define milestones for their development. The purpose of innovation clusters is to pool the strengths of a region and activate them to solve demanding tasks. In addition to industry and universities, the networks include local non-university research institutes that can make important contributions in relevant thematic areas.
Through this initiative, the Society provides impetus for further development of regional centres of excellence, and supports the regions’ skills and expertise. Innovation clusters primarily serve as instruments to help develop existing strengths. Collaboration is generally restricted to one federal state. Another important factor is how much money the industrial partners and the state are willing to invest in new projects within a region in addition to current expenditure.

122 International Comparison of Five Institute Systems
>
The Society is setting up the Fraunhofer Technology Academy as an umbrella for its educational offerings. It includes seminars and certain programmes in collaboration with specific universities: Executive MBA für Technologiemanager, Master of Environmental Sciences, Master Online Bauphysik and Online Postgraduate Course Software for Embedded Systems).Moreover, the Society frequently participates in industry fairs.
D.6.2. University cooperationThe Society is an important intermediary between universities and SMEs, where basic research is applied in projects for particular needs. Institute directors often have chairs at universities, which leads to a flow of research findings and people from the universities to the Society. Of particular importance are the intimate ties with selected universities, which represent a key element in the integration of the Society in the scientific community as a whole. Needless to say, the specific patterns are unique for each of the 56 institutes.
D.6.3. PublicationsScientific publications are few, since it is not the main focus of applied research. Quantitative date regarding publications has not been made available.
D.6.4. Patents and licencesThe Society is one of the main patent applicants in Germany with patent applications relating to 650 inventions in 2007. It has more than 2 500 active granted patents. License-fee revenues were €94 million in 2007, much of which relates to the technologies for the audio format MP3, which is an innovation owned by the Society. Quantitative date regarding annual production of patents and licences has not been made available.
A new patent strategy aims to build and exploit a market-oriented patent portfolio. However, a patent office for self-employed innovators was closed in 2007 due to a ruling by the Bavarian finance ministry that such consulting services were not in accord with the Society’s non-profit status.
D.6.5. Spin-offsThe Society supports spin-offs by actively encouraging the formation of start-up companies as spin-offs from the institutes and by supporting cooperative ventures between spin-off companies and the institutes by a variety of means.The Fraunhofer Venture Group maintains a network of contacts to business consultants, certified public accountants and public and private venture capital firms, who are in a position to offer new companies targeted support during the early investment phase. Emphasis is placed on reviewing and optimising business plans, obtaining access to equity and venture capital, providing assistance with the drawing-up of partnership agreements between the new companies and associated institutes, and direct support by the Society to facilitate a smooth launch of business activities.
The Fraunhofer Venture Group supported 34 new spin-off projects in 2007. A total of eight companies have been created with the assistance of the Group. Fraunhofer holds equity investments in 65 companies. In 2007, assets worth €6 million were sold.

123 International Comparison of Five Institute Systems
>
The Society is in the process of setting up a private investment fund that will be able to offer professional investment management of venture capital for the launch and initial growth phases of start-up companies.
D.7. Appendix
D.7.1. The groups and their member institutes (“Fraunhofer Institute for...”)Microelectronics
Applied Solid State Physics IAF• Communication Systems ESK• Digital Media Technology IDMT (guest)• Integrated Circuits IIS• Integrated Systems and Device Technology IISB• Microelectronic Circuits and Systems IMS• Nanoelectronic Technologies CNT• Open Communication Systems FOKUS (guest)• Photonic Microsystems IPMS• Reliability and Microintegration IZM• Silicon Technology ISIT• Telecommunications, Heinrich-Hertz-Institut HHI•
Materials and componentsApplied Polymer Research IAP• Building Physics IBP• Ceramic Technologies and Systems IKTS• Chemical Technology ICT• High-Speed Dynamics, Ernst-Mach-Institut EMI• Industrial Mathematics ITWM (guest)• Manufacturing Engineering and Applied Materials Research IFAM• Mechanics of Materials IWM• Non-Destructive Testing IZFP• Silicate Research ISC• Solar Energy Systems ISE• Structural Durability and System Reliability LBF• Systems and Innovations Research ISI• Wood Research, Wilhelm-Klauditz-Institut WKI•
Information and communication technologyAlgorithms and Scientific Computing SCAI• Applied Information Technology FIT• Communication Systems ESK (guest)• Computer Architecture and Software Technology FIRST• Computer Graphics Research IGD• Digital Media Technology IDMT• Experimental Software Engineering IESE• Industrial Engineering IAO• Industrial Mathematics ITWM• Information and Data Processing IITB• Integrated Circuits IIS (guest)•

124 International Comparison of Five Institute Systems
>
Intelligent Analysis and Information Systems IAIS• Open Communication Systems FOKUS• Secure Information Technology SIT• Software and Systems Engineering ISST• Telecommunications, Heinrich-Hertz-Institut HHI (guest)•
ProductionEnvironmental, Safety and Energy Technology UMSICHT• Factory Operation and Automation IFF• Machine Tools and Forming Technology IWU• Manufacturing Engineering and Automation IPA• Material Flow and Logistics IML• Production Systems and Design Techology IPK• Production Technology IPT• Technology Development Group TEG•
Surface technology and photonicsApplied Optics and Precision Engineering IOF• Electron and Plasma Technology FEP• Laser Technology ILT• Material and Beam Technology IWS• Physical Measurement Techniques IPM• Surface Engineering and Thin Films IST•
Life sciencesBiomedical Engineering IBMT• Cell Therapy and Immunology IZI• Interfacial Engineering and Biotechnology IGB• Molecular Biology and Applied Ecology IME• Process Engineering and Packaging IVV• Toxicology and Experimental Medicine ITEM• Marine Biotechnology EMB•
Defence and securityApplied Solid State Physics IAF• Chemical Technology ICT• High-Speed Dynamics, Ernst-Mach-Institut EMI• Information and Data Processing IITB• Integrated Circuits IIS (guest)•

125 International Comparison of Five Institute Systems
>
E.1. National business structureExhibit 57 shows that the Netherlands’ most important private sectors are financial intermediation, wholesale and retail trade, and manufacturing. From Exhibit 58 one may conclude that the by far most important subsector in terms of turnover within the mining, manufacturing and energy sectors is chemicals, followed by food. These two subsectors are then followed by several sectors of lesser weight, including power generation, oil extraction and metals, which thus constitute a wide industrial base from a sectoral perspective.
Exhibit 57 Share of value added by sector, 2007
Source: Eurostat.
The relatively small economy of the Netherlands shows its strength on indicators such as GDP per capita, which has for quite some years been among the highest in the EU. For most of the period from the end of the 1980s until the end of the 1990s, GDP growth has outpaced the EU and OECD averages. There are, however, structural problems and developments that threaten the strong position of the Netherlands. If we consider for example the competitiveness of the Netherlands based on international rankings such as the one of the Institute for Management Development, World Economic Forum or the Economist Intelligence Unit, the position of the Netherlands indicates an average performance compared to its competitors, with a declining position in recent years.155
155 European Trend Chart on Innovation: Annual Innovation Policy Trends and Apprai-
sal Report Netherlands 2006, European Commission, 2006.
Appendix E. TNO
International Comparison of Five Institute Systems 106
Appendix ETNO
E.1. National business structure
Exhibit 57 shows that the Netherlands’ most important private sectors are financial intermediation, wholesale and retail trade, and manufacturing. From Exhibit 58 one may conclude that the by far most important subsector in terms of turnover within the mining, manufacturing and energy sectors is chemicals, followed by food. These two subsectors are then followed by several sectors of lesser weight, including power gen-eration, oil extraction and metals, which thus constitute a wide industrial base from a sectoral perspective.
Exhibit 57 Share of value added by sector, 2007. Source: Eurostat.
Agriculture, fishing; 2% Manufacturing;
19%
Construction; 6%
Wholesale and retail trade;
22%
Financial intermediation;
28%
Public administration, defence; 23%
The relatively small economy of the Netherlands shows its strength on indicators such as GDP per capita, which has for quite some years been among the highest in the EU. For most of the period from the end of the 1980s until the end of the 1990s, GDP growth has outpaced the EU and OECD averages. There are, however, structural prob-lems and developments that threaten the strong position of the Netherlands. If we consider for example the competitiveness of the Netherlands based on international rankings such as the one of the Institute for Management Development, World Eco-nomic Forum or the Economist Intelligence Unit, the position of the Netherlands indi-cates an average performance compared to its competitors, with a declining position in recent years.157
157 European Trend Chart on Innovation: Annual Innovation Policy Trends and Appraisal Re-port Netherlands 2006, European Commission, 2006.

126 International Comparison of Five Institute Systems
>
Exhibit 58 Share of industrial turnover from subsectors within mining, manufacturing and energy sectors (NACE codes C–E), 2005
Source: OECD.
The main driver for economic growth in the Netherlands has in the past decade been the growth of employment (deployment of labour) resulting from the so-called “Dutch model” characterised by low costs and wage restraint. The limits of this factor-driven economic growth, however, will be reached in the near future, partly because of the ageing population in the Netherlands. The government has realised that future GDP growth will increasingly have to be based on increasing labour productivity. The absolute level of labour productivity in the Netherlands (in GDP per hour worked) is among the highest in Europe. However, the structural problems of the Dutch economy are reflected in the low level of labour productivity growth. The Dutch score for this indicator is worse than those of all its competitors. In order to create innovation-driven economic growth, the Dutch government has to strengthen its national innovation system (NIS). The innovative performance of the Netherlands can be regarded as good based on different indicators: high quality of output of scientific research, high level of patenting, high share of financing of public research by industry and high use of ICT and access to its applications. The NIS, however, is also characterised by specific features and (structural) problems that weaken the innovative performance of the Netherlands156:
The total financial efforts in R&D expenditure are stagnating; business • expenditure on R&D lags behind compared to main competitorsThere is an increasing shortage of highly educated people, especially in • science and technology, and an imbalance between educational system output and industrial demandThe interaction between the actors of the NIS is limited, resulting in an • inadequate exploitation of research results
156 Ibid.
International Comparison of Five Institute Systems 107
Exhibit 58 Share of industrial turnover from subsectors within mining, manu-facturing and energy sectors (NACE codes C–E), 2005. Source: OECD.
Oil; 8%
Food; 17%
Textiles; 1%Wood; 1%
Paper; 6%
Chemicals; 28%
Non‐metals; 2%
Metals; 8%
Machinery; 6%
Electr. & opt.; 7%
Vehicles; 5%Other; 2%
Electricity; 9%
The main driver for economic growth in the Netherlands has in the past decade been the growth of employment (deployment of labour) resulting from the so-called “Dutch model” characterised by low costs and wage restraint. The limits of this factor-driven economic growth, however, will be reached in the near future, partly because of the ageing population in the Netherlands. The government has realised that future GDP growth will increasingly have to be based on increasing labour productivity. The abso-lute level of labour productivity in the Netherlands (in GDP per hour worked) is among the highest in Europe. However, the structural problems of the Dutch economy are reflected in the low level of labour productivity growth. The Dutch score for this indicator is worse than those of all its competitors. In order to create innovation-driven economic growth, the Dutch government has to strengthen its national innova-tion system (NIS). The innovative performance of the Netherlands can be regarded as good based on different indicators: high quality of output of scientific research, high level of patenting, high share of financing of public research by industry and high use of ICT and access to its applications. The NIS, however, is also characterised by spe-cific features and (structural) problems that weaken the innovative performance of the Netherlands158:
The total financial efforts in R&D expenditure are stagnating; business expendi-ture on R&D lags behind compared to main competitors
There is an increasing shortage of highly educated people, especially in science and technology, and an imbalance between educational system output and indus-trial demand
The interaction between the actors of the NIS is limited, resulting in an inadequate exploitation of research results
Innovative entrepreneurial activity is limited
There are problems concerning the financing of (early stages of) innovation
158 Ibid.
127 International Comparison of Five Institute Systems
>
Innovative entrepreneurial activity is limited• There are problems concerning the financing of (early stages of) • innovation
The Netherlands’ three main challenges are157:
Raising investments in R&D and innovation:• The Dutch government has implemented a wide range of different instruments addressing the investment levels on R&D and innovation, ranging from a large generic fiscal scheme and various instruments supporting research cooperation between different actors of the innovation system to financial support to high-tech start-ups and promising technology fieldsImproving availability and quality of knowledge workers, particularly • scientists, technologists and R&D personnel: Different measures have been implemented such as a programme aimed at improving mobility of researchers between the actors of the innovation system and procedures regulating access to the Dutch labour market have been simplified for talented and highly qualified foreign knowledge immigrantsIncreasing interaction between the actors of the innovation system:• The government has implemented a wide range of instruments aimed at improving collaboration between industry and the public research infrastructure
E.2. Introduction158
Nederlandse Organisatie voor Toegepast Natuurwetenschappelijk Onderzoek or TNO (Netherlands Organisation for Applied Scientific Research) is a not-for-profit organisation in the Netherlands that focuses on applied science. The main TNO office is located in Delft.
TNO is a knowledge organisation developing and applying knowledge for companies, government bodies and public organisations. It also carries out contract research and specialist consultancy as well as grants licences for patents and specialist software. TNO tests and certifies products and services, and issues an independent evaluation of quality. Moreover, TNO sets up new companies to market innovations.
In 2007, TNO had a turnover of €579 million and 4 634 employees. TNO’s activities – some 75% of which is research – take place within five core areas (see further Section 10.5):
Quality of Life• Defence, Security and Safety• Science and Industry• Built Environment and Geosciences• Information and Communication Technology (ICT)•
157 Ibid.
158 Main sources for this text are Wikipedia, the TNO website (www.tno.nl) and Gerard van de Schoot-
brugge, TNO’s Strategy, Role and Position, Powerpoint presentation at EARTO, June 20, 2006.

128 International Comparison of Five Institute Systems
>
Table 13 summarises size and location of these areas; “TNO Companies” is a holding company for spin-off companies owned by TNO. Within the five core areas, there are a number of business units. TNO also collaborates with universities (and companies) at some 30 knowledge centres – centres of innovation – in order to generate knowledge in carefully selected fields.
Table 13 Size and location of the core areas, 2005
Source: TNO website.
TNO operates in a number of markets:Automotive• Aviation• Building and construction• Chemistry• Defence• Defence industry• Environment, health and safety• Food and nutrition• Greenhouse horticulture• High-end equipment• ICT• Maritime• Medical• Mobility • Oil and gas• Pharma• Prevention and care• Process industry• Security and safety• Space• Sports• Strategy and policy• Subsurface and water• Telecom• Work and employment•
Core area Employees Turnover (€ million)
Locations
Quality of life 1 050 118 Hoofddorp, Zeist, Leiden, Delft, Groningen, Apeldoorn
Defence, security and safety
1 060 133 The Hague, Rijswijk, Soesterberg
Science and industry
990 129 Delft, Eindhoven, Helmond, Den Helder, Apeldoorn, Enschede
Built environment and geosciences
750 91 Delft, Utrecht, Apeldoorn, Den Helder
ICT 370 41 Delft, Groningen, Enschede
TNO Companies 590 65 Eleven countries

129 International Comparison of Five Institute Systems
>
E.2.1. Business concept and strategyTNO’s mission is:
To apply scientific knowledge with the aim of strengthening the innovative power of industry and government.
TNO strives to develop, integrate and apply knowledge: it’s the combination that differentiates TNO from other knowledge institutions. By encouraging the effective interplay of knowledge areas, TNO generates creative and practicable innovations: new products, services and processes, fully customised for business and government.
In the strategic plan for 2007–2010, TNO emphasises its networking role, collaborating with universities, firms and the government, in the Netherlands and increasingly in other countries as well. An essential part of this is ensuring that its knowledge is in keeping with the Dutch government’s strategic policy through the implementation of demand-driven programmes addressing the themes outlined by the Dutch Cabinet in 2006 (see Section E.4.2).
TNO considers itself a major player in a growing international network comprised of leading scientific institutes, companies with ambitious development profiles, universities and other partners in knowledge. TNO is also increasingly asked to assume some of the risk of such research endeavours.The knowledge base is distinctive within the Netherlands and, to a significant degree, also beyond it. This is essential for the ability to serve Dutch companies that operate internationally and to attract top professionals. With approximately €100 million in international turnover, TNO has already become the most international European RTO and strives to increase this by another 30%.
TNO has chosen to adopt an open-innovation159 approach in partnership with other knowledge institutions, as well as with both large enterprises and SMEs. This is a way to deal with the greater demands being placed on centres of excellence with the rise of new economic powers and the dynamics of the market. Organisations like TNO must possess in-depth knowledge, be able to integrate it usefully, remain flexible and dare to assume novel positions, according to TNO.
159 Henry W. Chesbrough, Open Innovation, Harvard Business School Press, Boston, MA, 2003.

130 International Comparison of Five Institute Systems
>
E.2.2. GovernanceThe TNO Board of Management is charged with managing the organisation and has full authorisation to do so insofar as this is not ascribed to other bodies according to the TNO Act. The Management Board consists of three members appointed by royal decree: the chairman and one member on the recommendation of the Minister of Education, Culture and Science and one member on the recommendation of the Minister of Defence.
The TNO Supervisory Board is responsible for supervising the policy of and advising the Management Board. The Supervisory Board comprises seven members appointed by royal decree. The chairman and three of the members are appointed on the recommendation of the Minister of Education, Culture and Science (one of whom is recommended by the Central Works Council). Three members are appointed on the recommendation of the Minister of Economic Affairs.
A number of institutes and components of TNO together make up the main Defence Research group. The TNO Council for Defence Research determines the policy regarding defence research with due regard to the responsibilities of the Management Board. This Council is also appointed by royal decree.Planning and control within the TNO is organised around a four-year strategy plan with annual operational plans. There are also four types of audits to establish the position of the TNO:
Technology Position Audit (every 4 years)• Client Satisfaction Audit (every 3 years)• Employee Satisfaction Audit (every 3 years)• Future Impact Audit•
E.2.3. HistoryTNO was founded through an act of parliament in 1932. It was based on a justification in terms of market imperfections and a need for national competence building. The organisation was given a large amount of independence and its financing was a hybrid of public and private. Government funding dominated in the early years and TNO had a strong relation with SMEs.From around 1950 the organisation can be considered mature, with a broad technology base and a tendency towards “big technology”. It was academic, explorative and precompetitive with dominant government funding and a national focus.
After 1975, TNO was more market-driven and short-term, with a broad technology base and more of contract research, as well as cooperation with universities. Market turnover dominated and internationalisation grew. Knowledge exploitation was a new instrument.
In the past decade, TNO considers itself more demand-driven and organised in line with open innovation. Commercial turnover dominates and SMEs are important, as well as public-private partnerships. TNO sees itself as a networked organisation with an international focus and cooperates with foreign partners.

131 International Comparison of Five Institute Systems
>
E.3. Role in National Innovation System
E.3.1. Types of servicesActivities within the five core areas are described in Section 10.5. TNO plays a role in the national innovation system (NIS) by:
Bridging different technology fields• Combining different technology fields• Bridging different business worlds• Bridging the world of big and small companies• Offering continuity in partnerships•
Increasingly, TNO is moving towards a model of open innovation, where it collaborates with major companies like Shell and Philips. TNO can encourage partnerships to happen, make it easier to identify sources and requirements and establish procedures that make partnerships easy to operate.
As a consequence of open innovation, the whole innovation business becomes more entangled when the border between public and private becomes more diffuse. Part of the innovation risk is transferred into the public domain, meaning that regulation and institutions have to be adapted, e.g. in terms of IPR legislation, venture capital, state aid rules for R&D).
Through the holding company TNO Companies, TNO has ownership interests in about ninety companies. Their main task is to commercialise and exploit knowledge resources, most of which were developed by TNO, by:
Launching start-up companies (mostly technological) which translate • TNO knowledge into products and services on their own and introduce these onto the market. This entails:
Scouting and screening potential start-ups; -Incubating them until the incorporated company is formed and -Coaching them through their initial steps along the commercial path -Throughout, TNO Companies is responsible for actively seeking -outside financing. The ultimate goal is to eventually sell the start-ups when the time is right
Setting up and facilitating joint ventures with strategic partners in the • Netherlands and abroad, as commissioned by the TNO core area. These are to be aimed primarily at applied research and product developmentCommercialising companies selling TNO services that would benefit • from being offered under the auspices of a private company, such as the many measuring, testing, inspection and certification services the institute provides. The point of this is to establish a strong, commercially viable group, TNO Quality, branded for the high-end of the market, that assures quality, multidisciplinary expertise and an abundance of added valueTaking over companies or selling divisions and activities that no longer fit • in the TNO portfolio
132 International Comparison of Five Institute Systems
>
E.3.2. Relations to other national R&D suppliersIn 2004, a total of seven large firms carried out approximately 50% of the total business R&D in the Netherlands. Philips is the largest R&D spender in the Dutch business sector with more than a 20% share in total business R&D expenditure. The public science and research community in the Netherlands encompasses 14 universities, the Royal Netherlands Academy of Arts and Sciences (KNAW) with 18 institutes, the Netherlands Organisation for Scientific Research (NWO) with nine institutes, five Large Technological Institutes, six Leading Technological Institutes, the Netherlands Organisation for Applied Research (TNO) and its institutes, the agricultural research institutes of the DLO Foundation, a number of state-owned research and advisory centres and several other institutes in the fields of health and the social sciences. Collaboration is multifaceted and can be exemplified with the new partnerships in 2007. One example is the collaboration with three universities to form a Climate Centre. Other examples are the Utrecht Centre for Geosciences and the Integrated Basin Tectonics Knowledge Centre (Amsterdam), where TNO collaborates with universities. TNO is also a partner in the Deltares Knowledge Institute160, which was established in 2007 based on recommendations in an evaluation of the Large Technological Institutes and TNO in 2004. Deltares is the result of a merger of two Large Technological Institutes, two former government research institutes and a TNO business unit. TNO collaborates with Deltares particularly around the geological and geotechnical matters where their knowledge bases are complementary, and both have embraced the open innovation philosophy. There are also examples of TNO collaborating with Belgian and German institutes.
E.3.3. CustomersThe Dutch government is TNO’s largest customer, though it acts through twelve programmes where different ministries play the role of customer interpreting societal needs (see Section 10.5), making the government sector a rather diversified set of customers. Dutch industry is almost as big in terms of revenue, covering a number of partners from SMEs to open innovation, which is in essence outsourced innovation activity for multinational companies. Finally, international customers made up more than a fifth of the customer base in 2007, ranging from public funding agencies such as the EU to international companies, collaborating with the vast international part of TNO. Quantitative date on customer base, including share of SMEs, has not been made available.
E.3.4. Innovation modelThe innovation model is a mix of government push and market pull. Government funding is provided under a rather elaborated planning framework of twelve programmes. These are intended to make TNO demand-driven, but it is the government which defines the demand. Funding is strategic, i.e. for targeted purposes, but with a long-tem view. On the other hand, private and international contracts give TNO plenty of room to exploit market niches. This funding is the opposite of the above, i.e. short-term but without earmarking. Together, the funding arrangements give TNO some room to balance and combine resources to do work with both short- and long-term perspectives.
160 http://www.deltares.nl/xmlpages/page/deltares_en.

133 International Comparison of Five Institute Systems
>
E.3.5. Trends and drivers for changeTNO faces a number of challenges in the strategy period, 2007–2010, such as the globalisation of knowledge development, the growing dynamics of a very demanding marketplace and the broad spectrum of social developments taking place in the Netherlands and elsewhere in Europe. TNO wants to maintain and reinforce its position as a leading knowledge company in this world.
With science and technology developments rapid and wide-ranging and every conceivable sort of knowledge and product flow taking on a global significance, TNO plans to focus on fewer core areas in upcoming years, working more closely with others and disposing of some activities or incorporating them elsewhere.
According to itself, the TNO of 2010 will be an excellent, professional and independent partner in knowledge for government and business, operating in the Netherlands and the rest of Europe, North America, Russia and East Asia. With its international orientation and considerable contribution to pertinent social debate, TNO supports domestic and other European governmental agencies as a reliable expert and partner in knowledge. TNO enhances the international competitiveness of Dutch businesses through entering into long-term programmes with business partners and establishing independent companies.
TNO’s licence to operate is the social and economic impact of its efforts, whereby there must naturally be a balance between those efforts and the end results. TNO aims to become even more effective by making its internal processes and operations extremely efficient. This is all part of TNO’s goal to improve profitability, increase turnover per employee and boost its liquidity. TNO’s knowledge base stands or falls with the quality of its people and their multi-faceted talents and TNO preserves that status by providing appealing working conditions and ample education opportunities.
Goals for TNO within four years time are to be:
The top European RTO in a number of selected technologies• Seen as an effective knowledge provider for the benefit of the (European) • societyAn effective innovation enabler• Truly market-driven, customer-oriented, knowledge-based• Continuously renewing its technology base at a rate that enables fast • market penetration in newly emerging sectors
E.3.6. Recent and anticipated changesIn 2007, a new funding model was introduced, where almost all public basic funding is provided through demand-driven programmes. Several TNO entities were privatised in 2007.

134 International Comparison of Five Institute Systems
>
The new Minister for education, culture and science has indicated that TNO will be under pressure to reform. The Minister stated that he “will investigate in consultation with TNO whether the quality of applied research at TNO is satisfactory and whether further steps are necessary in order to achieve excellence”161.
E.4. Economy
E.4.1. Economic performanceExhibit 59 illustrates that TNO’s turnover has increased ever so slightly in the period 2004–2007, whereas the modest profit shows a more pronounced increasing trend following the 2003 loss caused by an exceptional pension payment.
Exhibit 59 Total turnover and profit of TNO.
Source: TNO Annual reports 2004–2007162.
Exhibit 60 shows that the turnover’s main components, R&D and market, have largely remained unchanged over the years. For 2006 and 2007, the market turnover is subdivided into three components which change very little between years; the increase in international sales is marginal. Note that also the market categories include some R&D grants.
161 Strategic agenda for higher education, research and science policy, November, 2007 (www.minocw.
nl/documenten/81346_38024_Strategic.pdf)
162 Data for 2003 from Erik Arnold, Neil Brown, Annelie Eriksson, Tommy Jansson, Alessandro Muscio,
Johanna Nählinder and Rapela Zaman, “The Role of Industrial Research Institutes in the National In-
novation System”, VINNOVA, VA 2007:12, 2007.
International Comparison of Five Institute Systems 114
E.3.6. Recent and anticipated changes
In 2007, a new funding model was introduced, where almost all public basic funding is provided through demand-driven programmes. Several TNO entities were privatised in 2007.
The new Minister for education, culture and science has indicated that TNO will be under pressure to reform. The Minister stated that he “will investigate in consultation with TNO whether the quality of applied research at TNO is satisfactory and whether further steps are necessary in order to achieve excellence”163.
E.4. Economy
E.4.1. Economic performance
Exhibit 59 illustrates that TNO’s turnover has increased ever so slightly in the period 2004–2007, whereas the modest profit shows a more pronounced increasing trend following the 2003 loss caused by an exceptional pension payment.
Exhibit 59 Total turnover and profit of TNO. Source: TNO Annual reports 2004–2007164.
‐60
‐40
‐20
0
20
40
60
0
100
200
300
400
500
600
2003 2004 2005 2006 2007Profit [€
million]
Turnover [€
million]
Turnover Profit
Exhibit 60 shows that the turnover’s main components, R&D and market, have largely remained unchanged over the years. For 2006 and 2007, the market turnover is sub-divided into three components which change very little between years; the increase in international sales is marginal. Note that also the market categories include some R&D grants.
163 Strategic agenda for higher education, research and science policy, November, 2007 (www.minocw.nl/documenten/81346_38024_Strategic.pdf)
164 Data for 2003 from Erik Arnold, Neil Brown, Annelie Eriksson, Tommy Jansson, Alessandro Muscio, Johanna Nählinder and Rapela Zaman, “The Role of Industrial Research Institutes in the National Innovation System”, VINNOVA, VA 2007:12, 2007.

135 International Comparison of Five Institute Systems
>
Exhibit 60 Source of the TNO’s turnover163
Source: TNO Annual reports 2006–2007164.
Exhibit 61 takes a closer look at TNO’s R&D income, which is dominated by the basic government grant. While the basic grant remains constant between 2006 and 2007, both national and international (three quarters of which comes from the EU’s framework programmes) grants increase.
Exhibit 61 Source of TNO’s R&D income and R&D intensity.165
Source: TNO Annual report 2007.
163 Only the 2007 annual report (which provides data for 2006 and 2007) splits commercial turnover into
the three categories shown for these years.
164 Data for 2003 from Erik Arnold et al., op. cit.
165 The amounts of national and international grants are interpretations based on the 2007 Annual
report.
International Comparison of Five Institute Systems 115
Exhibit 60 Source of the TNO’s turnover165. Source: TNO Annual reports 2006–2007166.
18%
19%
20%
21%
22%
23%
24%
0
100
200
300
400
500
600
2003 2004 2005 2006 2007
Share international
€million
Market Market, public
Market, private Market, international
Basic grant Share international
Exhibit 61 takes a closer look at TNO’s R&D income, which is dominated by the basic government grant. While the basic grant remains constant between 2006 and 2007, both national and international (three quarters of which comes from the EU’s frame-work programmes) grants increase.
Exhibit 61 Source of TNO’s R&D income and R&D intensity.167 Source: TNO Annual report 2007.
36%
37%
38%
39%
40%
41%
0
50
100
150
200
250
2006 2007
R&D intensity
€million
Basic grant National grants
International grants R&D intensity
165 Only the 2007 annual report (which provides data for 2006 and 2007) splits commercial turnover into the three categories shown for these years.
166 Data for 2003 from Erik Arnold et al., op. cit. 167 The amounts of national and international grants are interpretations based on the 2007 An-
nual report.

136 International Comparison of Five Institute Systems
>
E.4.2. State funding principlesThe relationship between TNO and the Dutch government is much of a planning arrangement. According to the Dutch government, programming of demand means that, following consultations with several stakeholders, an inventory is made of the needs of all parties involved in TNO, which are ministries, enterprises but also societal organisations. As a result, long-term research programmes are introduced, with a duration ranging from four to ten years. Within these long-term programmes, procedures for interim evaluations and adjustments are included. In this way, it is possible to intervene and adjust programmes whenever necessary. Programming of demand also results in strategic planning for TNO for a period of four years.166
The funding for TNO is based on twelve themes, each of which is related to economic and social knowledge issues faced by its stakeholders. The themes are also related to the Dutch government’s strategic policy and Europe’s scientific and technological policies. Each theme has an active network of organisations and companies operating, with one ministry directing operations, see Table 14.
Table 14 TNO’s twelve themes
Source: “United in Innovation”, TNO strategy 2007–2010.
166 Ministry of Economic Affairs: Science, Technology and Innovation in the Netherlands. Policies, facts
and figures 2006, 2006; www.minocw.nl/documenten/ Science-Technology-Innovation-brochure-2006.pdf
Theme Coordinating ministry
Public safety1. Ministry of Interior and Kingdom Relations
Defence 2. Ministry of Defence
Healthy living3. Ministry of Health, Welfare and Sport
Food4. Ministry of Agriculture, Nature and Food Quality
Dealing with a changing 5. society
Ministry of Justice
Work participation and 6. ageing
Ministry of Social Affairs and Employment
Attainability7. Ministry of Transport, Public Works and Water Management
Construction and spatial 8. development
Ministry of Housing, Spatial Planning and Environment
Living with water9. Ministry of Transport, Public Works and Water Management
Energy (management)10. Ministry of Economic Affairs
Natural and built 11. environment
Ministry of Housing, Spatial Planning and Environment
High-tech systems, 12. processes and materials
Ministry of Economic Affairs

137 International Comparison of Five Institute Systems
>
After input from TNO, the Dutch government defines themes for the organisation. A theme consists of one or more programme(s), where each programme is the unit of financing and that has a programme agreement. In addition, there is a knowledge development programme crossing the theme boundaries.
Within TNO, one department is in control of a theme and various funding sources per theme are possible. The controlling ministry organises knowledge arenas together with interested third parties for a theme or sub-theme. It…
Elucidates knowledge needs (knowledge providers act as advisors)• Elucidates financial framework and limitations• Stimulates the realisation of a set of R&D programmes• Defines the needs of big R&D facilities•
In 2007, almost all funding by the Dutch ministries was tied to the specific themes. Only 26 out of €196.4 million (13%) in public funding were for knowledge development crossing theme boundaries.Another part of the planning framework is regular audits. In 2007, four business units within two core areas were audited, as well as the technology position of another core area. In general, the audits resulted in “good” to “very good” scores. The general recommendation of the audits was that TNO should benchmark itself more internationally against comparable institutes.
A much more market-like mechanism is the R&D funding for SMEs through innovation vouchers, where public funding distributed to the SMEs. TNO receives a lot of these vouchers. An innovation voucher is a credit note from the Ministry of Economic Affairs with a certain value which an SME entrepreneur can use to carry out a small research project with a (private or public) knowledge institute. The voucher system has low administration costs for SMEs and is demand-driven. An entrepreneur with a voucher can decide for himself what kind of research he wants to do and with which institute.167
E.5. Capabilities
E.5.1. PersonnelTNO employed 4 634 persons at the end of 2007, compared to 4 600 in 2006 and 4 746 in 2005. Quantitative data regarding the educational level of the personnel has not been made available.
TNO wants to continue to be an attractive employer for creative, enterprising employees. The aim is to fill 80% of key positions internally and 20% externally to get some “fresh blood”.
The remuneration levels are in line with market standards and TNO also invests significantly in staff development. For a number of years now, TNO has acknowledged excellence in its employees through the award of Senior Research Fellow.
167 Ministry of Economic Affairs, op. cit.

138 International Comparison of Five Institute Systems
>
E.5.2. R&D effortThe 12 themes described above (section 4.2) define the areas in which TNO conducts R&D.
For national projects, the website of the Royal Netherlands Academy of Arts and Sciences (KNAW) lists TNO participation in 21 research programmes and 31 research projects.168 In the EU’s FP6, TNO was involved in 215 projects and coordinated 33 of them.
E.5.3. Competence developmentParticipation in individual projects and in particular FP projects is a major source of competence development. Moreover, TNO invests 5% of the total personnel costs in training and talent development.
E.6. Knowledge dissemination
E.6.1. Dissemination activities to and cooperation with customersThe most important form of dissemination takes place in collaborative projects. Many large companies are TNO partners and through the open-innovation concept, TNO tries to have an even more strategic role.
For SMEs, the Dutch system of innovation vouchers provide them with funding to buy services from for example TNO. A small business research program is set up to develop product concepts into commercial products. In 2007, 28 such product concepts were put on offer to SMEs.
Eight people from TNO are lecturers in the vocational school system, which provides professional education and supports innovation in SMEs. 58 employees held professorships.
Quantitative data regarding publications, presentations, conferences etc. has not been made available.
E.6.2. University cooperationTogether with universities, TNO has established some 30 knowledge centres to develop knowledge in selected fields. These knowledge centres function as innovation centres, where companies also participate. One example is the collaboration established in 2007 with three universities to form a Climate Centre (Vrije University, Amsterdam, Wageningen University and Research Centre as well as the meteorological institute KNMI and University of Utrecht). Other examples are the Utrecht Centre for Geosciences and the Integrated Basin Tectonics Knowledge Centre (Amsterdam), where TNO collaborates with universities (see section 3.2)
E.6.3. PatentsTNO applied for 86, 90, 97 and 158 patents in the years 2004, 2005, 2006 and 2007.
168 http://www.onderzoekinformatie.nl/en/oi/nod/organisatie/ORG1236243/

139 International Comparison of Five Institute Systems
>
E.6.4. Spin-offsTNO Companies have ownership interests in a number of TNO spin-off companies; a majority share in about 50 companies and a minority share in 36 companies.
Six new companies emerged in 2007, while the goal is to establish ten new start-ups per year. Initiatives are made to grow by 30% in activities on behalf of SMEs.
E.7. Appendix
E.7.1. TNO’s core areasTNO’s expertise is grouped into five cohesive core areas, each of which is associated with certain major issues facing Dutch society. The core areas are:
Quality of lifeQuality of life devises innovative products and services aimed at improving people’s health and their ability to function. In the near future, we will be focusing primarily on:
Safe, healthy food and innovative food products• Safety and effectiveness of medicines• Safety of chemical substances• Healthy lifestyles with sufficient physical exercise and prevention of • excess weightEffective prevention and treatment of disease, targeting youngsters and • the elderlyInnovations in healthcare• Safe and healthy working environments that contribute to greater • productivity and make the option of working later in life more appealing
We possess an internationally competitive knowledge base in life sciences and social sciences that helps us meet our goals. And we are continually investing in revitalising that knowledge base. Our customers come from the pharmaceutical, chemical and food industries all around the world. In the fields of labour and healthcare we work for the Dutch government, labour organisations and healthcare institutes. We have also developed special programmes for SMEs. And we commercialise our knowledge through patents and licences and by establishing new companies.
Defence, security and safetyDefence, security and safety is the strategic partner of the Dutch Ministry of Defence. We translate innovation into tangible military applications. We also come up with innovative solutions to secure the overall safety of society, supporting efforts in police services, detection, anti-terrorism, crisis management and disaster relief. Beyond that, we work with businesses. Our target markets are defence, the defence industry, security and safety, aeronautics and maritime.

140 International Comparison of Five Institute Systems
>
Our mission for the 2007–2010 strategy period is to increase our added value to the customer. One way of doing this is to guide our research efforts according to the proven method of demand-driven programmes. We will also be ramping up our international collaborations and assume a greater role as a knowledge broker in terms of developing and applying knowledge. Partnership, domain knowledge and the integration of technologies – those are the key concepts we plan to use to devise total solutions that truly support our customers’ business processes. Finally, we plan to increase our public visibility by assuming a prominent presence in the public discourse surrounding safety issues.
Science and industryScience and industry serves as a partner to its customers, contributing significantly to their technological innovations. By taking a multidisciplinary approach and availing ourselves of our reservoir of acquired knowledge, we have a way of combining the unfamiliar to arrive at surprising solutions. We work on systems to be applied in industry, the transport sector, the processing industry and space, but also ones that serve the needs of people themselves, their health and their interactions with others. We make smaller, smarter systems and contribute to the ongoing integration of systems and components.
We plan to increase turnover by 10% a year by earning greater loyalty among major customers, including innovative SMEs.
We can also seek those customers abroad. We will further be limiting our scope of activities to fifteen dominant technological fields, all of which share a logical coherence and possess sufficient mass to be of interest, working with a minimum of 50 FTEs. We will also naturally make every effort to conclude strategic partnerships with complementary knowledge institutes.
Built environment and geosciencesBuilt environment and geosciences works with government agencies and business sectors on innovations directly related to the built environment, infrastructure and the subsurface, innovations that will foster sustainable and efficient design, use and manage ment profiles. This kind of work is performed for international organisations; government agencies (including those at the regional and municipal level); water boards; road, rail and port managers; mobility, logistics and infrastructure companies; building engineering companies; the supply industry; the oil and gas sector and the maritime sector.
We aim to earn top-of-mind awareness for issues involving: use of the subsurface, production of mineral resources, mobility, management and maintenance of infrastructure and buildings, renovation and consolidation of the built environment and environmental impact. We also plan to enter into a close partnership with the Delta institute.

141 International Comparison of Five Institute Systems
>
Information and communication technology“Innovation through ICT” is the motto of TNO Information and communication technology. Our distinctive position in the market is based on our independence, specialities, multidisciplinary approach (technology, market and user) and hands-on experience. We have a two-pronged focus: innovation in the telecommunications sector and the application of ICT in public and economic sectors.
As an independent player, we strive to be our customer’s conscience and guide, their proverbial anchor. We help our customers make sensible choices that will not come back to haunt them in the future. This is essential in an ever more competitive marketplace, with shrinking times-to-market and windows of opportunity and accelerated technological developments. We also generate intellectual property that we place at the disposal of the market through licensing, sales and spin-offs.
In the 2007–2010 strategy period we want to solidify our position in the telecom market and greatly expand our position in the ICT market. We view government as a strategic sector in these efforts. We also plan to actively pursue the establishment of partnerships with international peer organisations.
142 International Comparison of Five Institute Systems
>
2009
Evalueringer og effektmålinger1. Effektmåling af innovationsmiljøernes støtte til
danske iværksættere
• Innovation: Analyse og evaluering 01/2009
2. Rammer for innovativ IKT-anvendelse – erfaringer
fra Den Regionale IKT-satsning
• Innovation: Analyse og evaluering 02/2009
3. Måling af additionalitet af deltagelse i
innovationskonsortier
• Innovation: Analyse og evaluering 03/2009
4. International Evaluation of the Danish GTS-system
• Innovation: Analyse og evaluering 04/2009
5. Proof of concept-finansiering til offentlige
forskningsinstitutioner - Midtvejsevaluering
• Innovation: Analyse og evaluering 05/2009
Analyser6. Mapping of the Danish knowledge system with focus
on the role and function of the GTS net
• Innovation: Analyse og evaluering 06/2009
7. International Comparison of Five Institute Systems
• Innovation: Analyse og evaluering 07/2009
8. Desk Study on Science and Technology Foresights
Aiming at Technological Service in Denmark
• Innovation: Analyse og evaluering 08/2009
9. Små og mellemstore virksomheders deltagelse i
internationale FoU-samarbejder
• Innovation: Analyse og evaluering 09/2009
10. Små og mellemstore virksomheders anvendelse af
ikt til innovation
• Innovation: Analyse og evaluering 10/2009
11. Virksomhedernes alternative strategier til fremme af
privat forskning, udvikling og innovation
• Innovation: Analyse og evaluering 11/2009
12. Redegørelse for metrologiindsatsen 2007 - 2009
• Innovation: Analyse og evaluering 12/ 2009
Publikationer udgivet i 2008 og 2009 af Forsknings- og Innovationsstyrelsen
i serien Innovation: Analyse og evaluering

143 International Comparison of Five Institute Systems
>
2008
Performanceregnskaber1. Performanceregnskab for Videnskabsministeriets
GTS-net
• Innovation: Analyse og evaluering 01/2008
2. Kommercialiseringsstatistik
• Innovation: Analyse og evaluering 02/2008
3. Performanceregnskab for Videnskabsministeriets
Innova-tionsnetværk
• Innovation: Analyse og evaluering 03/2008
4. Performanceregnskab for Videnskabsministeriets
Innovationsmiljøer
• Innovation: Analyse og evaluering 04/2008
Evalueringer og effektmålinger5. Evaluering af IDEA
• Innovation: Analyse og evaluering 05/2008
6. Effektmåling af forsknings- og
innovationssamarbejder
• Innovation: Analyse og evaluering 06/2008
7. Open innovation and globalisation: Theory,
evidence and implications, VISION era-net project
• Innovation: Analyse og evaluering 07/2008
8. Brugeranalyse af GTS-nettet
• Innovation: Analyse og evaluering 08/2008
9. Evaluation of Danish Industrial Activities ind the
European Space Agency (ESA)
• Innovation: Analyse og evaluering 09/2008
10. Evaluation of the Danish Contributions to Space
Research
• Innovation: Analyse og evaluering 10/2008
11. Evaluering af public service for opfindere
(Opfinderrådgivningen)
• Innovation: Analyse og evaluering 11/2008
Analyser12. Den danske erhvervsstruktur –
udviklingstendenser og dynamikker
• Innovation: Analyse og evaluering 12/2008
13. Innovation og innovationsbehov i servicesektoren
• Innovation: Analyse og evaluering 13/2008
14. Kortlægning af iværksætter- og
entrepreneurshipkurser ved de 8 danske
universiteter
• Innovation: Analyse og evaluering 14/2008
15. Kortlægning af indsatsen for fremme af innovation
og entreprenørskab i de danske uddannelser –
2008
• Innovation: Analyse og evaluering 15/2008
16. Matchmaking mellem virksomheder og
videninstitutioner
• Innovation: Analyse og evaluering 16/2008
17. Innovation i IKT – indsatser og effekter
• Innovation: Analyse og evaluering 17/2008
18. Major challenges in national research and
innovation policy governance: Comparison and
assessment of the approaches in the VISION era-
net partner countries
• Innovation: Analyse og evaluering 18/2008
19. Inside Service Innovation – Challenging Policy
• Innovation: Analyse og evaluering 19/2008
20. Håndbog om Innovationsnetværk
• Innovation: Analyse og evaluering 20/2008
21. Videnpiloter – eksempler på vækst og innovation i
små og mellemstore virksomheder
• Innovation: Analyse og evaluering 21/2008
22. Fra inspiration til innovation – casesamling fra
offentlige og private organisationer
• Innovation: Analyse og evaluering 22/2008
23. Barriereanalyse for ErhvervsPhD-programmet
• Innovation: Analyse og evaluering 23/2008
