internal quality control: what and how to change -...
TRANSCRIPT
Internal quality control: what and how to change
Ferruccio Ceriotti
Servizio di Medicina di Laboratorio, Ospedale San Raffaele, Milano

The work presented derives mainly from the activity of the Working Group on Analytical Quality of SIBioC and I have to thank in particular:
– Duilio Brugnoni (current Chair of the WG)
– Sonia Mattioli– Pasquale Iandolo
– Federica Braga
Ceriotti F. Milano, 18-11-2016 2

ISO 15189:2012• 5.6 Ensuring quality of the examination results• 5.6.2 Quality Control• 5.6.2.1 General
– The laboratory shall design quality control procedures that verify the attainment of the intended quality of results
• 5.6.2.2 Quality control materials– Quality control materials shall be periodically examined
with a frequency that is based on the stability of the procedure and the risk of harm to the patient from an erroneous result
Note 2. Use of independent third party control materials should be considered, either instead of, or in addition to, any control materials supplied by the …. manufacturer.
Ceriotti F. Milano, 18-11-2016 3
ISO 15189:2012• 5.6.2.3 Quality control data
– The laboratory shall have a procedure to prevent the release of patient results in the event of quality control failure.
– When the quality control rules are violated and indicated that the examination results are likely to contain clinically significant errors, the results shall be rejected ……
– Quality control results shall be reviewed at regular intervals to detect trends ….
Ceriotti F. Milano, 18-11-2016 4

Braga F, Panteghini M. Clin Chim Acta 432 (2014) 55–61
Ceriotti F. Milano, 18-11-2016 5

Steps for IQC implementation according CLSI C24-A4
1. Define the quality requirements2. Select control materials3. Determine target values and standard deviations
for quality control materials that represent stable analytical performance
4. Set goals for quality control performance5. Select a quality control strategy based on
performance goals6. Design a quality control strategy for multiple
instruments
Ceriotti F. Milano, 18-11-2016 6

Ceriotti F. Milano, 18-11-2016 7

Implementing a Six Sigma quality system
Ceriotti F. Milano, 18-11-2016 8

Implementing a Six Sigma quality system
• “Method validation and acceptable method performance are prerequisite to the design and implementation of SQC procedures. If performance is NOT acceptable under stable operating conditions, no amount of QC can change or improve that performance. QC can only monitor performance, and when properly designed, alert analysts to the presence of additional errors that occur because of unstable performance.”
Westard JO, Westgard S. Ann Clin Biochem 2016;53:35-50
Ceriotti F. Milano, 18-11-2016 9
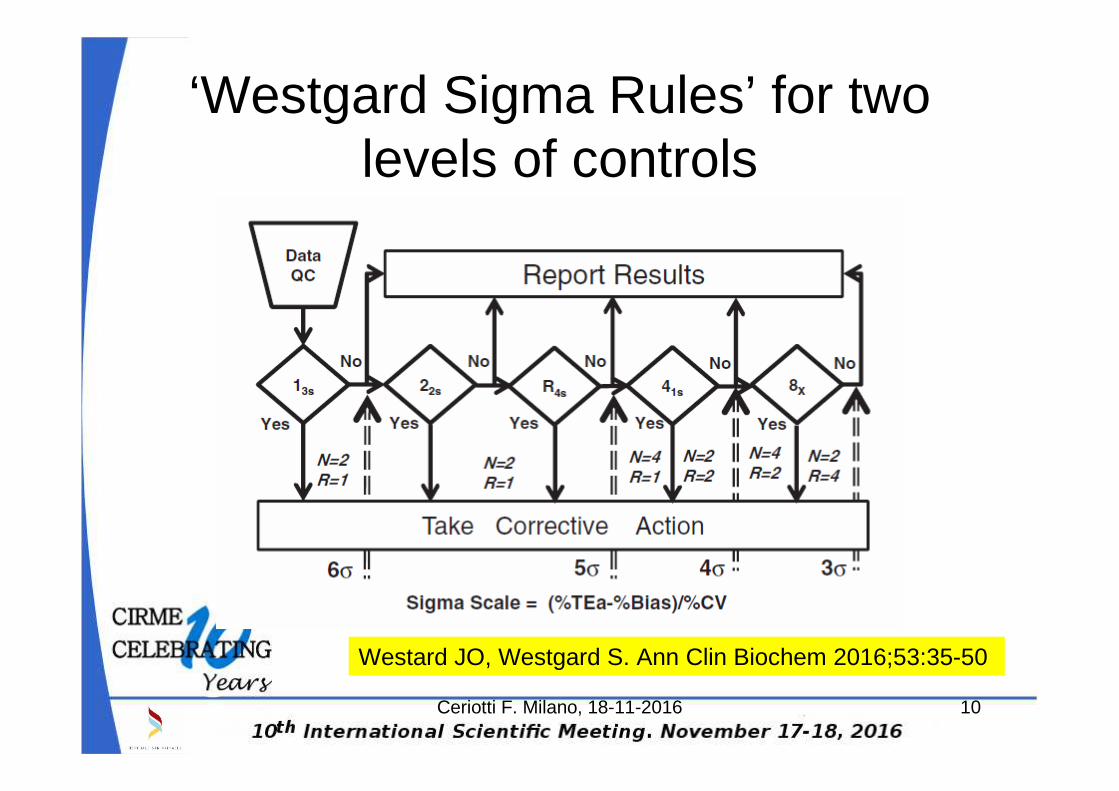
‘Westgard Sigma Rules’ for two levels of controls
Westard JO, Westgard S. Ann Clin Biochem 2016;53:35-50
Ceriotti F. Milano, 18-11-2016 10

Conclusions: Our data from IQC do not consistently demonstrate that the results from clinical laboratories meet evidence-based quality specifications. Therefore, we propose that a graded scale of quality specifications may be needed at this stage.
Ceriotti F. Milano, 18-11-2016 11

• “There are two possible reasons for the lack of agreement between the proposed limits and the routinely achieved analytical variation by laboratories. First, currently used technology is inherently insufficiently robust to allow the achievement of a narrow analytical variation regardless of the effort to control the analytical process (i.e., creatinine Jaffe method). Second, there is sub -optimal control over the IQC process and a lack of defined limits.”
Jassam et al. CCLM 2013;51:1579-84
Ceriotti F. Milano, 18-11-2016 12

Problems of the ICQ process
• Need to balance the metrological complication and the practical simplicity needed for adoption by medical laboratories
• Need to establish a direct link between the performance characteristics of the method and the QC rules
• Improve control on the bias component• Need to demonstrate the “fitness for purpose”
Ceriotti F. Milano, 18-11-2016 13

Two components IQC
• Two independent components: one devoted mainly to checking the alignment of the analytical system and verification of the consistency of declared traceability during routine operations performed in accordance with the manufacturer’s instructions (IQC component I ) and the other structured particularly for estimating the measurement uncertainty due to random effects (IQC component II ).
Panteghini M. Clin Chem Lab Med 2010;48(1):7–10
Ceriotti F. Milano, 18-11-2016 15

Internal QC, component I
• Aim : testing system alignment• Materials : control materials supplied by
the system’s manufacturer with system specific assigned values
• Use: acceptance/rejection of the analytical run
• Rules : results within a stated acceptability range, uncertainty based rules.
Ceriotti F. Milano, 18-11-2016 16

Internal QC, component II
• Aims : checking system stability (lot to lot variations, possible drifts); providing data for measurement uncertainty calculation
• Materials : third party control materials, commutable, concentrations at clinical decision limits
• Use: support the acceptance / rejection, provide data for retrospective evaluation
• Rules : Westgard rules, uncertainty based rules
Ceriotti F. Milano, 18-11-2016 17

Apply the uncertainty theory to IQC
• Estimated measurement uncertainty shall be taken into account to prove the conformity or nonconformity with the given specification.
• The complete measurement result, y’, is represented by the measurement result ±measurement uncertainty (U).
• Conformity with a specification is proved when the complete measurement result, y’, falls within the zone defined by a Lower Specification Limit (LSL) and an Upper Specification Limit (USL) (maximum permissible error).
LSL ≤ y - U and y + U ≤ USL
Ceriotti F. Milano, 18-11-2016 18

The same conformity can be proved similarly when the measurementresult, y, falls within the zone of maximum permissible error reduced on either side by the expanded measurement uncertainty.
LSL + U ≤ y ≤ USL - U
yy’
U U
LSL USL
Ceriotti F. Milano, 18-11-2016 19

Quality control chart based with guard bands based on measurement uncertainty
Ceriotti F. Milano, 18-11-2016 20

How to implement uncertainty based IQC
• Define the acceptability range: • Manufacturer• Maximum acceptable TE based on biological variation• Minimal performance specifications based on outcome
data or proposed by scientific societies
• Calculate the expanded uncertainty of your procedure
• For this particular application only the random component of uncertainty is relevant, so two times the CV
Ceriotti F. Milano, 18-11-2016 21
How to implement uncertainty based IQC
• Prepare the control chart reducing the acceptability range on either side by expanded measurement uncertainty
• Immediate understanding of the “process capability”: in a “2 sigma” situation (acceptable range ±6%, CV=3%) the guard bands will cover all the chart indicating that the performance of your method is insufficient and there is no way to guarantee the control of that level of quality (change method or accept a lower quality specification)
Ceriotti F. Milano, 18-11-2016 22
Problems with the presented approach
• The Westgard’s criticisms is that “more [than with the uncertainty based approach] specific guidance on the selection of control rules and the number of control measurements is provided using the Sigma-related SQC planning tools”.[1]
• The simulations Brugnoni et al.[2] indicate an elevate number of “false alarms” in situation of low sigma (around 3)
but:
Ceriotti F. Milano, 18-11-2016 23
[1] Ann Clin Biochem 2016 ;53:35-50[2] Biochim Clin 2016;40SS:S83
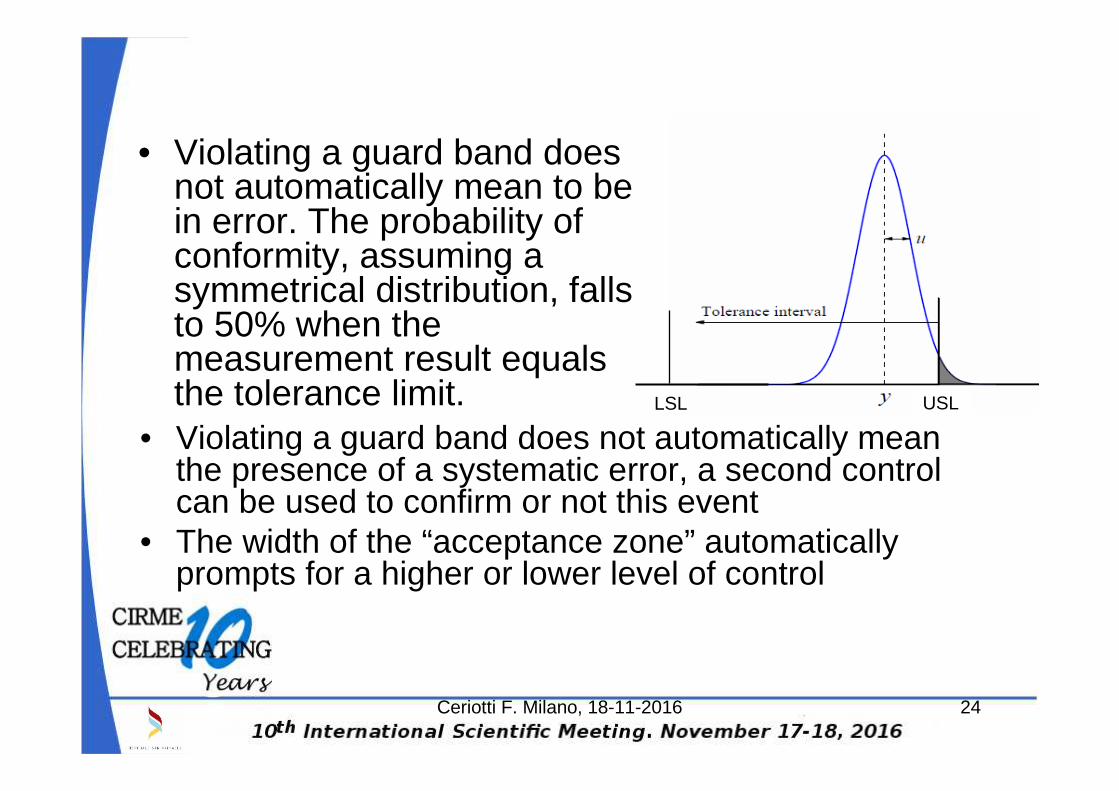
• Violating a guard band does not automatically mean to be in error. The probability of conformity, assuming a symmetrical distribution, falls to 50% when the measurement result equals the tolerance limit.
• Violating a guard band does not automatically mean the presence of a systematic error, a second control can be used to confirm or not this event
• The width of the “acceptance zone” automatically prompts for a higher or lower level of control
Ceriotti F. Milano, 18-11-2016 24
LSL USL

Ceriotti F. Milano, 18-11-2016 25
Monte Carlo simulation
Comparison with the Westgard’s strategy
• IQC results obtained during a 12 months period for glucose, creatinine and total cholesterol were collected from 4 clinical laboratories using 8 analyzers (4 Siemens Dimension Vista 1500, 2 Ortho Vitros 5600, 1 Siemens Advia 2400, 1 Beckman Coulter AU5800). For each measurand biological variation derived TEa were used; Westgard rules were selected according to the σ-metric calculated from a 6 months planning period and U was calculated from the imprecision of the IQC results during the same period. Based on these settings, the number of “out of control”alarms occurred in the following 6 months with the implemented Westgard’s rules were compared with the number of QC results falling within the “alarm zones”.
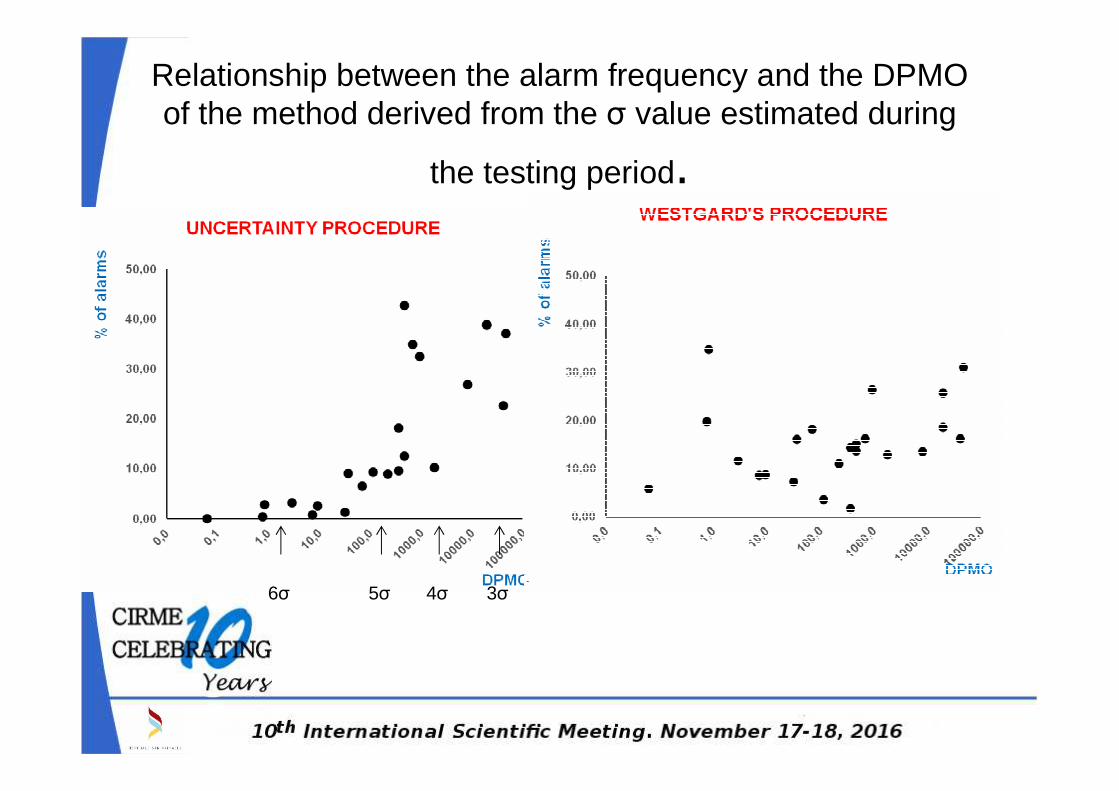
Relationship between the alarm frequency and the DPMO of the method derived from the σ value estimated during
the testing period.
6σ 5σ 4σ 3σ

Conclusions• IQC plays a key role in the organization of a
clinical laboratory that wants to guarantee the necessary analytical quality minimizing the risk of delivering erroneous results
• To implement it correctly and effectively is not easy, especially when thousands of results have to be released every hour for dozens of different tests like in a typical “core laboratory”
• The proposed approach simplifies the IQC implementation without loosing any of the relevant features that can be obtained with a correct implementation of the classical approach
Ceriotti F. Milano, 18-11-2016 28

Ceriotti F. Milano, 18-11-2016 29