internal corrosion monitoring in nspl - oilweb · pdf fileinternal corrosion monitoring in...
TRANSCRIPT

Internal corrosion monitoring in NSPL
M. C. Nihalani, Head-R&D Projects S. Purohit , Dy. Suptg. Research Scientist
14TH OCTOBER 2014 PHQ, GUWAHATI

R&D Department
Presentation Outline
Brief about Multi-Product Pipeline
NSPL Schematic Layout
Monitoring Results
Sludge Analysis
Monitoring through Corrosion Coupons
Conclusions & Recommendations
Discussion on Test Protocols for Crude Trunk line
R&D Department
NSPL – Brief
Oil India Limited owns and operates a cross country multi-product pipeline from Numaligarh Refinery in Assam to Rangapani (Siliguri) in West Bengal, India.
The Pipeline transports different products of Numaligarh Refinery namely Motor Spirit, High Speed Diesel and Superior Kerosene Oil.
Pipeline design throughput is 1.721 MMTPA.
It is a 16” pipeline, 653.4 km in length and was commissioned in June 2009.

R&D Department
NSPL – Design Details
The design throughput for MS is 0.135 MMTPA, for SKO is 0.219 MMTPA and for HSD is 1.367 MMTPA. The other design parameters are:
Operating Hours : 8000 Hrs/ Annum Pipeline operating life : 35 Years Design pressure : 84.5 kg/cm2
Max. Operating Pressure : 76 kg/cm2
Hydro Testing Pressure : 106 Kg/cm2(min.) Design Consideration : ASME B31.4, OISD 141 Pipe MoC : Carbon Steel
Converted & existing (259 Km): API5LX46/X52 - Pipe thickness 7.9/11.9 mm
New (394Km): API5LX60/X46 - Pipe thickness 6.4/8.7/11.9 mm
Pipeline corrosion allowance: 0.5 mm

R&D Department
NSPL – Schematic Representation
Bangladesh
Meghalaya West Bengal
Manipur
Nagaland
Myanmar
Bhutan
Sikkim
Arunachal Pradesh
Bihar
Assam
NDT SV1 IPS1
SV2 SV3
IPS2
SV4 SV5
IPS3
SV6 SV7
IPS4 RT
SV8 SV9
Numaligarh Dispatch Terminal
Intermediate Pigging Station with provision for corrosion coupons
Sectioning Valve
Receiving Terminal

R&D Department
R&D Department’s association with NSPL corrosion monitoring
R&D Department was approached in July 2011 for providing assistance in measurement of corrosion rates based on weight loss coupons. Coupons that were installed during commissioning
stage in 2009 were retrieved in July 2011 by a joint team of R&D and PLM Section.
The corrosion rates observed was 0.6 mpy considering
exposure for 2 years.
R&D Department adopted the testing procedure, analysis and interpretation of weight loss coupons based on industry best practices and available standards.

R&D Department
Monitoring through Corrosion Coupons
This presentation is based on experiences of internal corrosion monitoring using flush disc weight loss coupons and the results thereof. Adopted standard : NACE RP0775-2005 Preparation,
Installation, Analysis, and Interpretation of Corrosion Coupons in Oilfield Operations.
Provisions for internal corrosion monitoring using corrosion
coupons at the six locations at 12 ‘0 clock position were incorporated during the commissioning of the pipeline.
From July 2011, the coupons are exposed for a period of approximate 1 year, and then retrieved and replaced with fresh set of coupons.

R&D Department
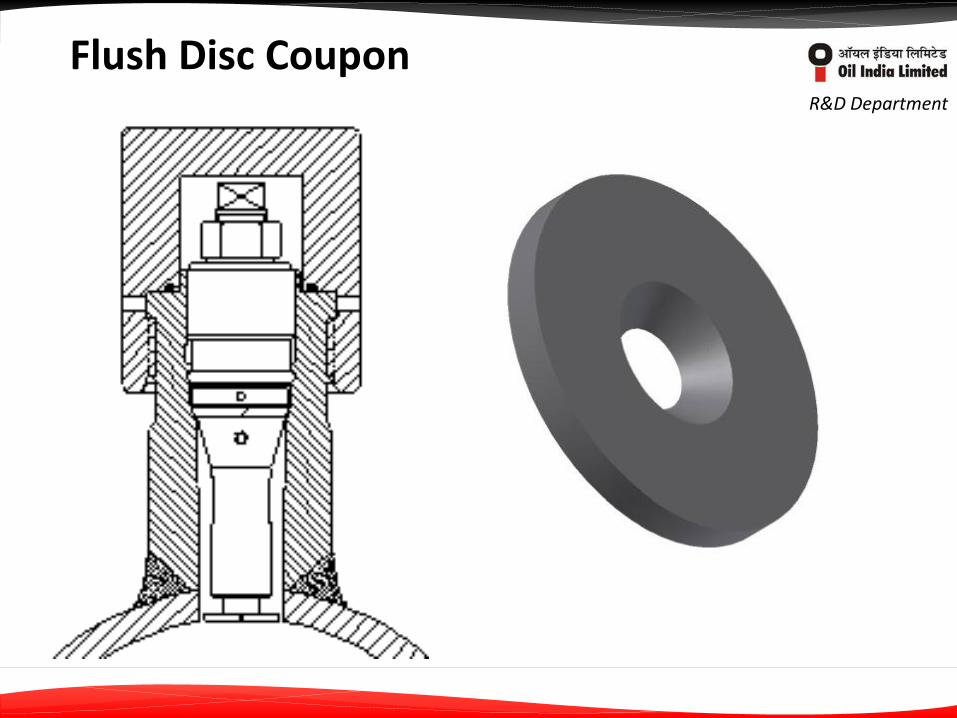
Flush Disc Coupons
Generally used in applications where the coupon cannot extend into the pipe to interfere with the flow or pigging operations.
Disc coupons are usually mounted flush with the wall of the pipe (or vessel) so that conditions are as close as possible to those at the process/containment interface.
NSPL uses a circular coupon with a diameter of 1.25”, a thickness of 0.125” and a mounting hole ID 0.312” .
The hole is countersunk , and uses a flathead, stainless steel screw , insulating washer and insulating disc for mounting.
The exposed area is 2.5 sq. in. (16 sq. cm).
R&D Department
Flush Disc Coupon
R&D Department
NACE RP 0775-2005
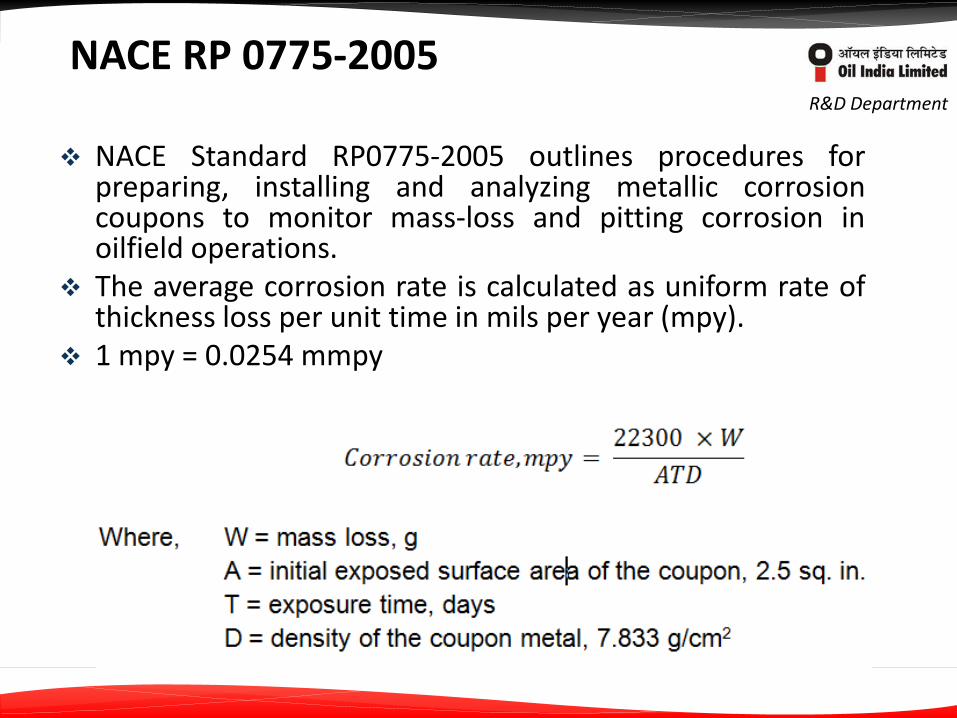
NACE Standard RP0775-2005 outlines procedures for preparing, installing and analyzing metallic corrosion coupons to monitor mass-loss and pitting corrosion in oilfield operations.
The average corrosion rate is calculated as uniform rate of thickness loss per unit time in mils per year (mpy).
1 mpy = 0.0254 mmpy

R&D Department
NACE RP 0775-2005
The Max. Pitting rate is calculated using the depth of deepest pit and dividing it by the exposure time.
The depth of the deepest pit is measured using stereo microscope calibrated for depth measurement.
R&D Department
NACE RP 0775-2005
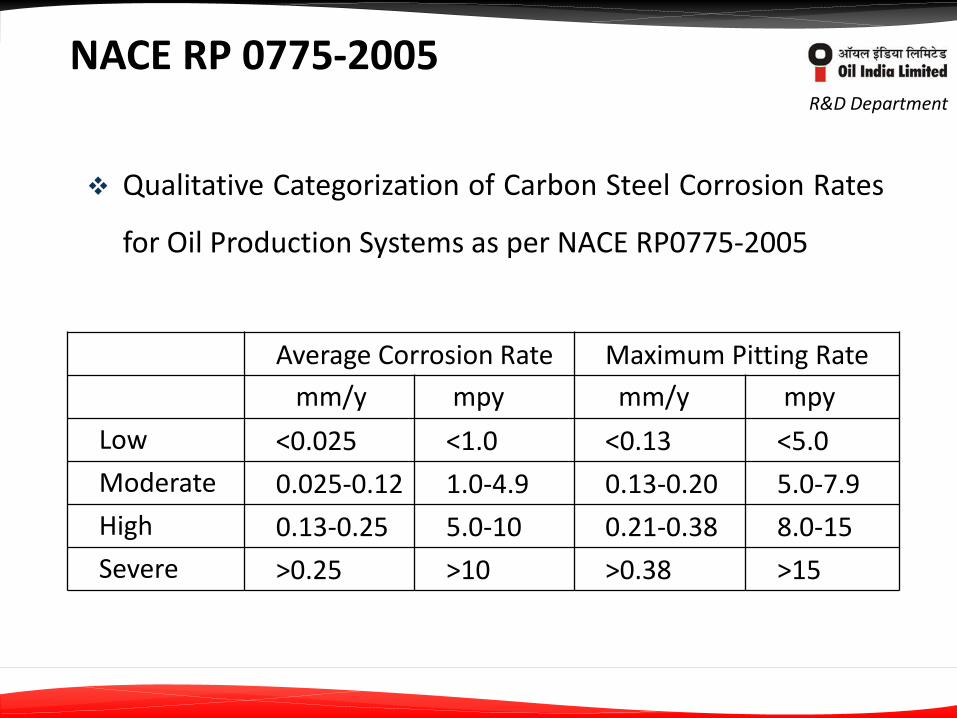
Average Corrosion Rate Maximum Pitting Rate
mm/y mpy mm/y mpy
Low <0.025 <1.0 <0.13 <5.0
Moderate 0.025-0.12 1.0-4.9 0.13-0.20 5.0-7.9
High 0.13-0.25 5.0-10 0.21-0.38 8.0-15
Severe >0.25 >10 >0.38 >15
Qualitative Categorization of Carbon Steel Corrosion Rates
for Oil Production Systems as per NACE RP0775-2005
R&D Department
Results
R&D Department
Results
NDT RT
mp
y
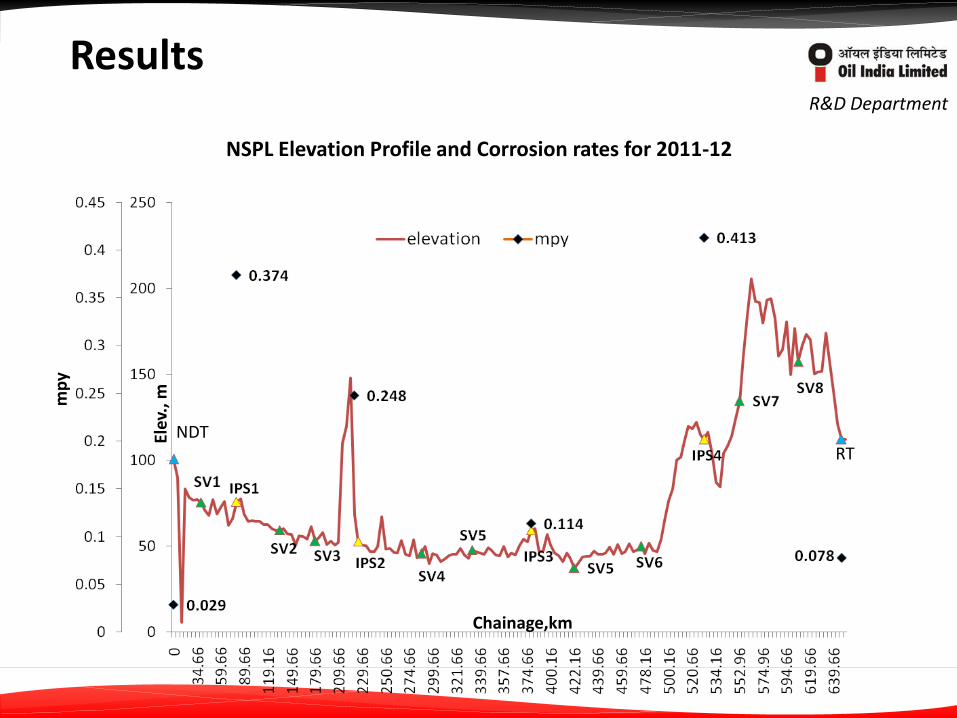
NSPL Elevation Profile and Corrosion rates for 2011-12 El
ev.,
m
Chainage,km
R&D Department
Results
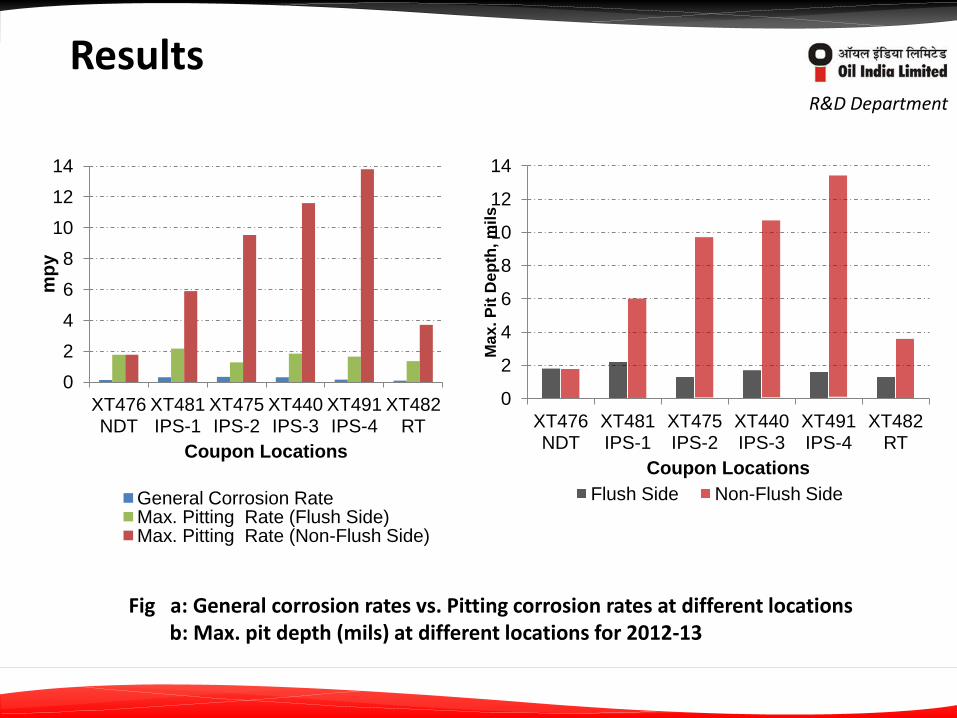
Fig a: General corrosion rates vs. Pitting corrosion rates at different locations b: Max. pit depth (mils) at different locations for 2012-13
0
2
4
6
8
10
12
14
XT476 NDT
XT481 IPS-1
XT475 IPS-2
XT440 IPS-3
XT491 IPS-4
XT482 RT
mp
y
Coupon Locations
General Corrosion Rate Max. Pitting Rate (Flush Side) Max. Pitting Rate (Non-Flush Side)
0
2
4
6
8
10
12
14
XT476 NDT
XT481 IPS-1
XT475 IPS-2
XT440 IPS-3
XT491 IPS-4
XT482 RT
Ma
x. P
it D
ep
th, m
ils
Coupon Locations
Flush Side Non-Flush Side
R&D Department
Results
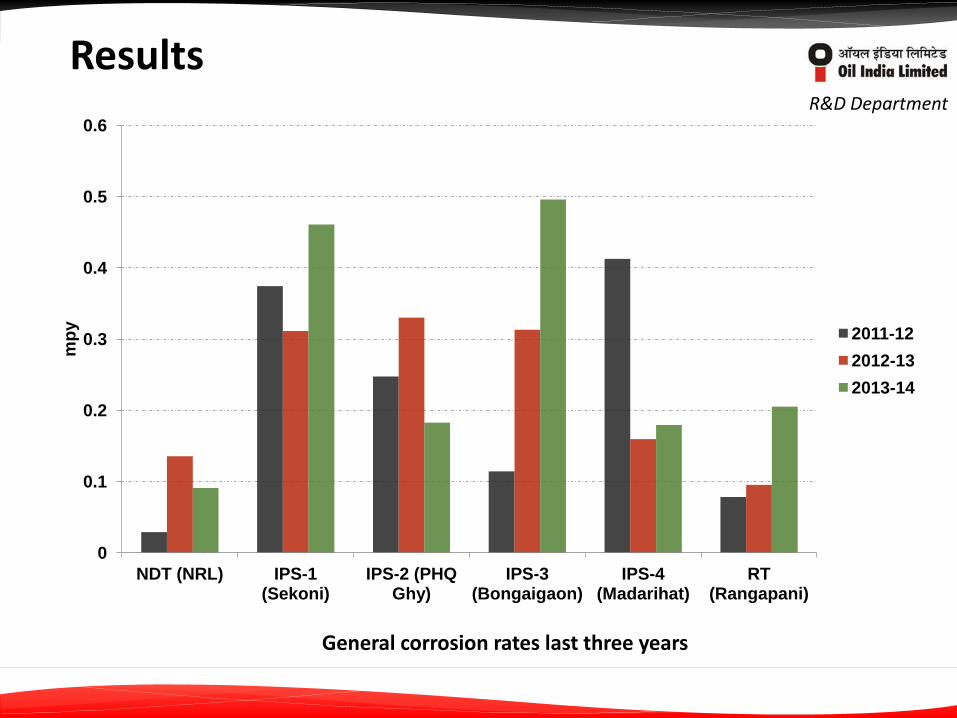
General corrosion rates last three years
0
0.1
0.2
0.3
0.4
0.5
0.6
NDT (NRL) IPS-1 (Sekoni)
IPS-2 (PHQ Ghy)
IPS-3 (Bongaigaon)
IPS-4 (Madarihat)
RT (Rangapani)
mp
y
2011-12
2012-13
2013-14
R&D Department
Results
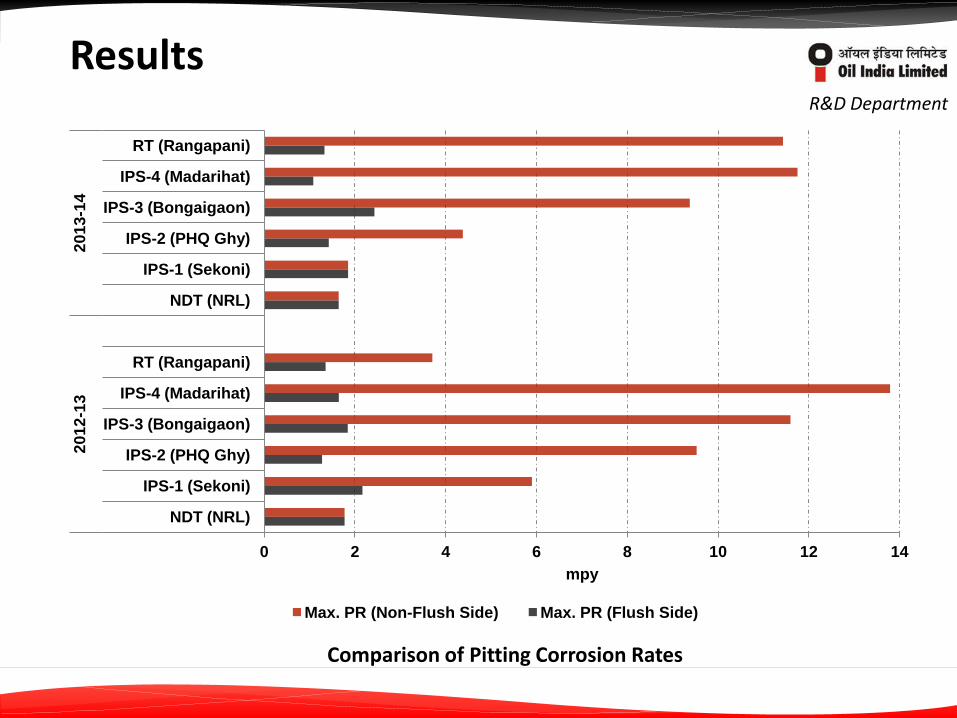
Comparison of Pitting Corrosion Rates
0 2 4 6 8 10 12 14
NDT (NRL)
IPS-1 (Sekoni)
IPS-2 (PHQ Ghy)
IPS-3 (Bongaigaon)
IPS-4 (Madarihat)
RT (Rangapani)
NDT (NRL)
IPS-1 (Sekoni)
IPS-2 (PHQ Ghy)
IPS-3 (Bongaigaon)
IPS-4 (Madarihat)
RT (Rangapani)
20
12
-13
2
01
3-1
4
mpy
Max. PR (Non-Flush Side) Max. PR (Flush Side)
R&D Department
Results
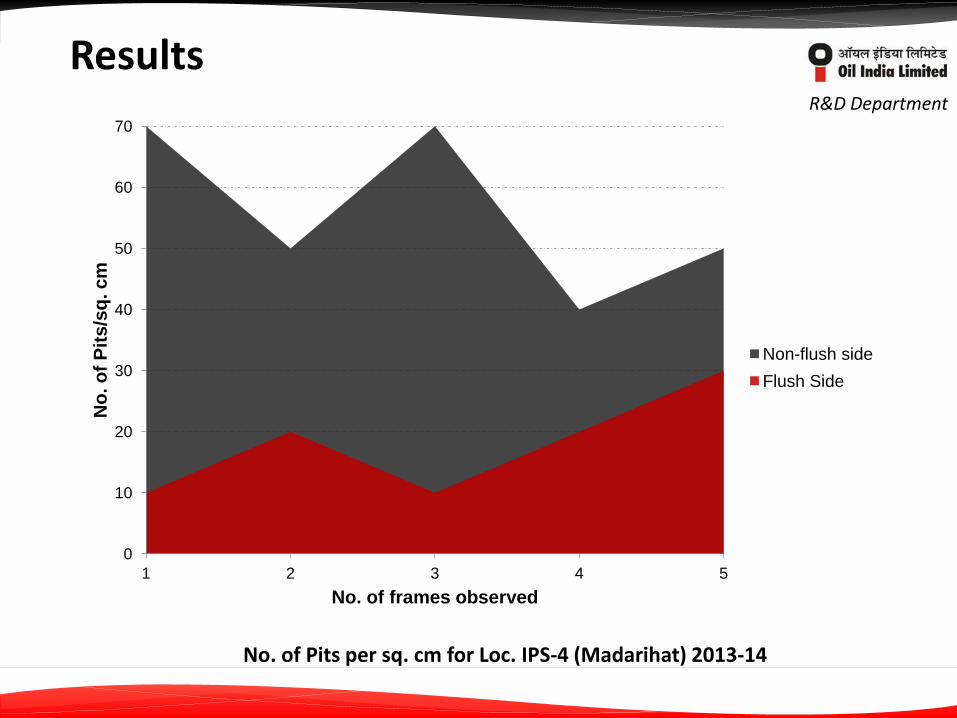
No. of Pits per sq. cm for Loc. IPS-4 (Madarihat) 2013-14
0
10
20
30
40
50
60
70
1 2 3 4 5
No
. o
f P
its
/sq
. c
m
No. of frames observed
Non-flush side
Flush Side

R&D Department
Results

R&D Department
Results

R&D Department
Results

R&D Department
Results
R&D Department
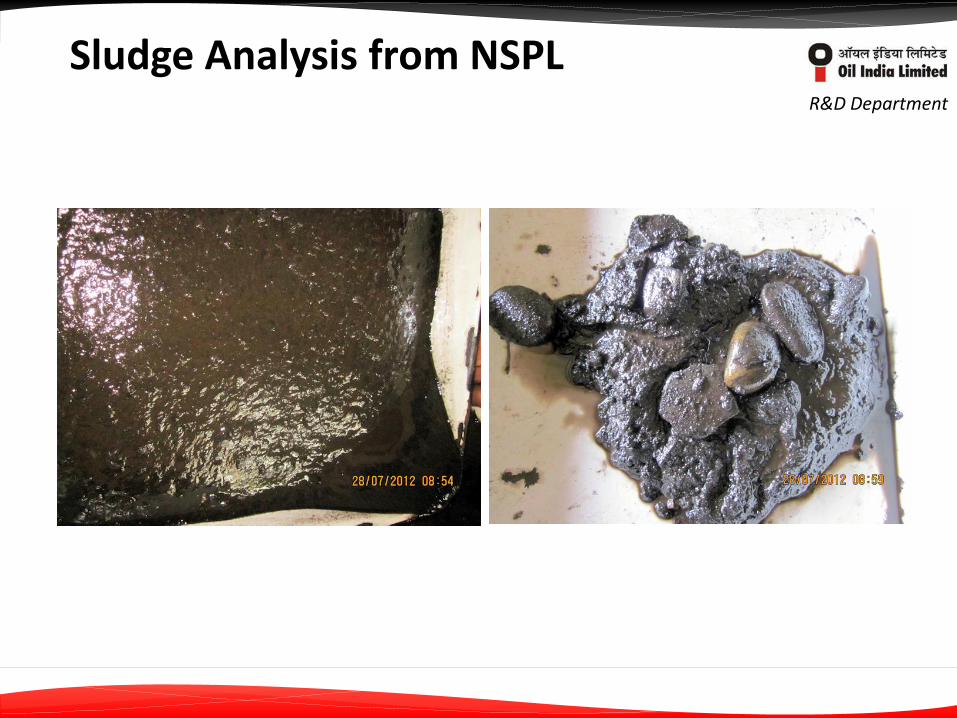
Sludge Analysis from NSPL

R&D Department
Sludge Analysis
In the absence of any standard test method for analysis of pipeline sludge sample, an in-house test protocol was developed and adopted based on literature survey for carrying out analysis of the received samples in order to establish presence of corroded products.
The samples received were a mixture of oily sludge associated
with water and free oil. Free oil was separated and the samples were air dried to maintain consistency.
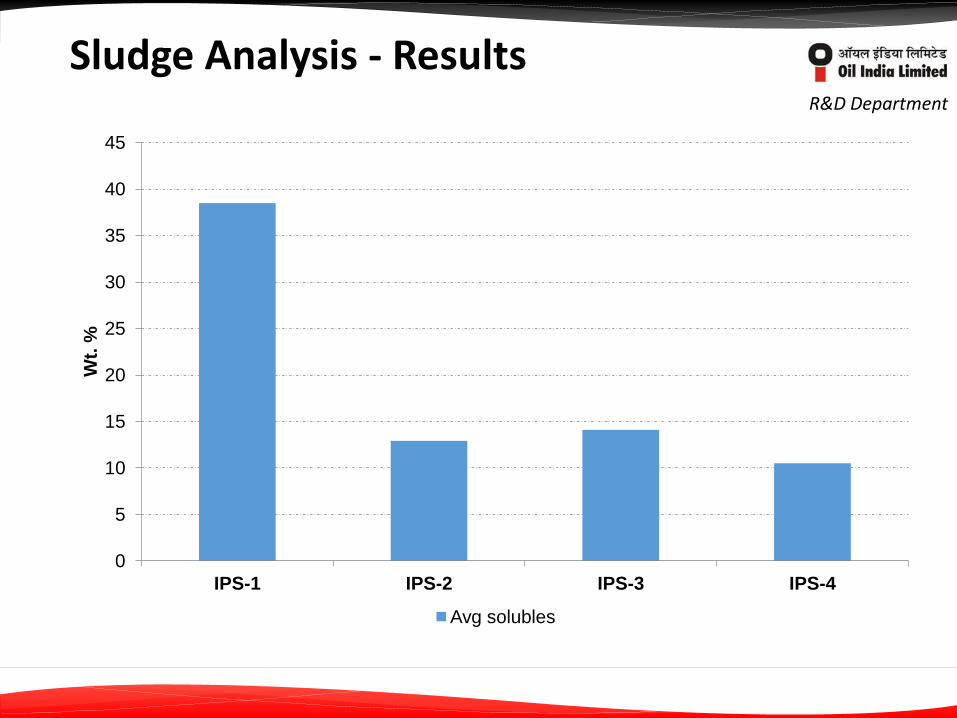
A portion of the air dried sample was soxhlet extracted using dichloromethane to remove organics. The left over insoluble sample was analysed under X-ray powder diffraction instrument to identify presence of corrosion products.
Remaining portion of the air dried sludge sample was ashed in a muffle furnace at 700 °C to quantify ratio of organics/inorganics.

R&D Department
Sludge Analysis
R&D Department
Sludge Analysis - Results
0
5
10
15
20
25
30
35
40
45
IPS-1 IPS-2 IPS-3 IPS-4
Wt.
%
Avg solubles
R&D Department
Sludge Analysis – Powder XRD

R&D Department
Sludge Analysis – Powder XRD

R&D Department
Sludge Analysis – XRD Results
The diffraction data of all these samples show the presence of several iron corrosion products with varying oxidation states, including magnetite, goethite and iron sulphide along with silica and quartz.
The presence of magnetite was significant as it is a common corrosion deposit.
Other detected minor elements included silicon and sulphur.
Presence of silicon suggests some siliceous material such as sand, silt or clay minerals.

R&D Department
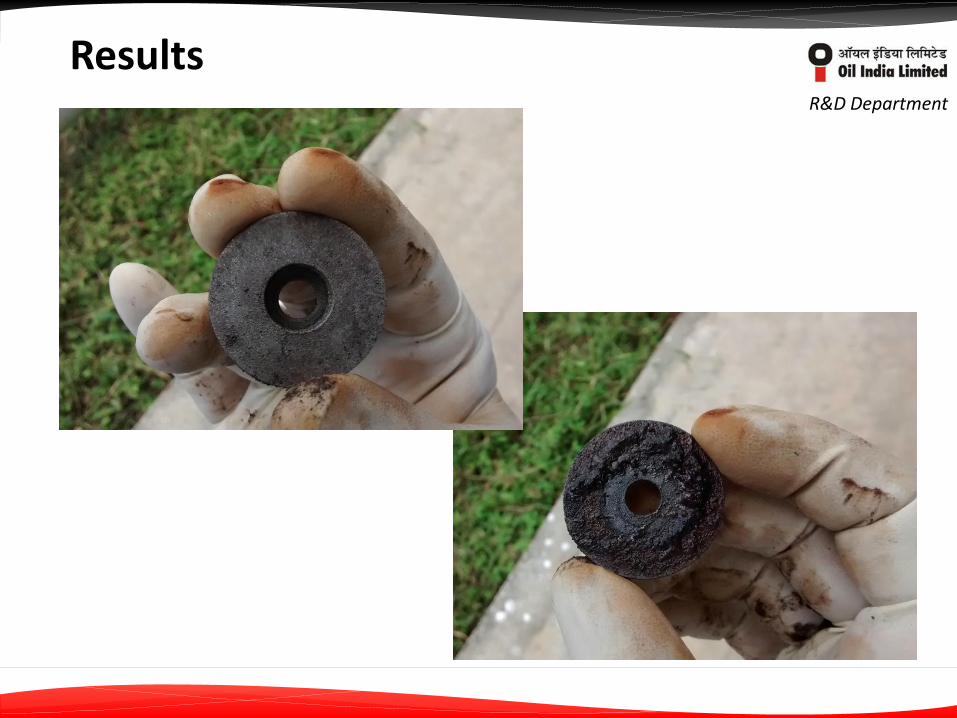
Scraper Barrel Corrosion

R&D Department
MIC Tests
Samples from IPS-3 (Bongaigoan)

R&D Department
MIC Tests
R&D Department
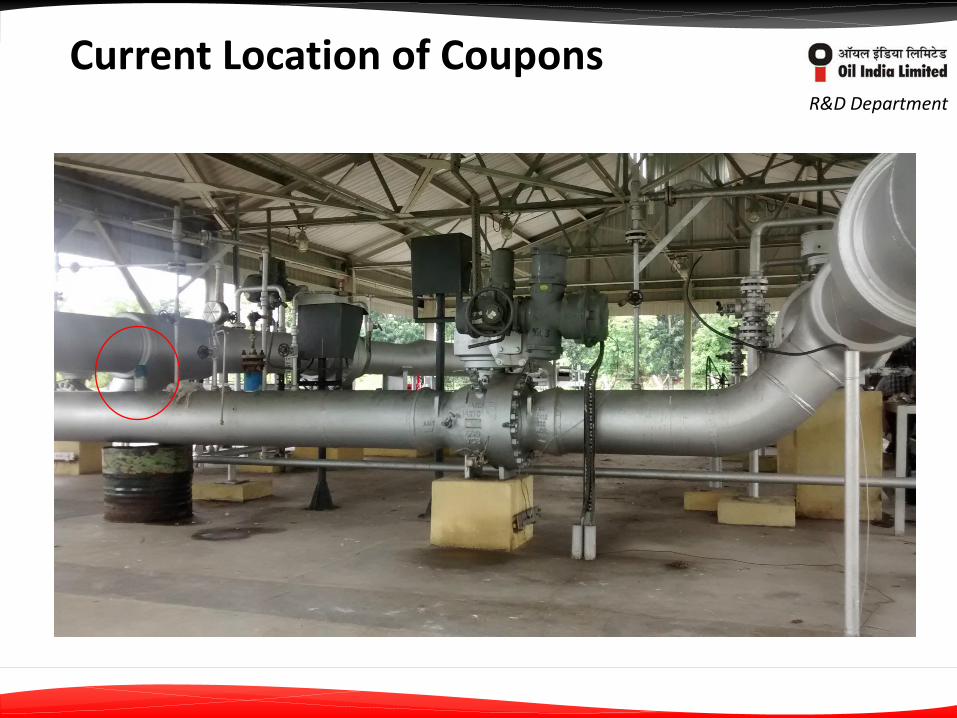
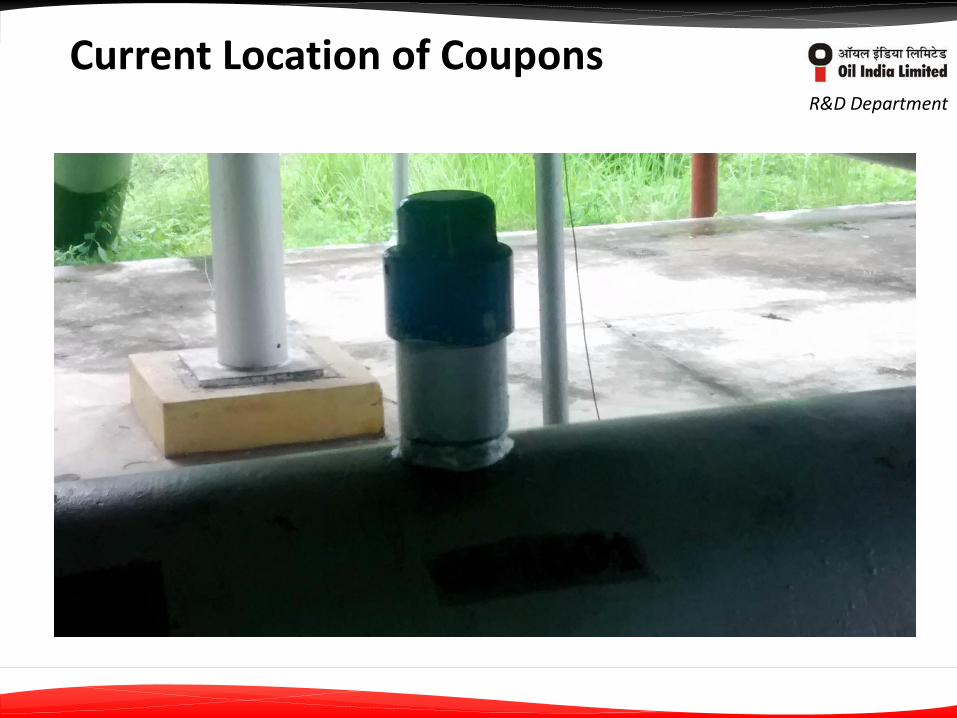
Current Location of Coupons
R&D Department
Current Location of Coupons

R&D Department Summary
The general corrosion rates for all the six coupons from
the six different locations can be categorized as low. Pitting corrosion has been observed in all the six
coupons on both flush and non-flush sides. Pitting corrosion on the non-flush sides of the coupons,
indicates scaling and under deposit corrosion on the non-flush sides. The Pit density per unit area ranges from 20 – 90 pits.

R&D Department Summary
While the maximum pitting rates on the flush sides of
all the coupons is low; the same is found to be on the higher side on the non-flush sides of coupons ranging from 9 – 14 mpy at three locations IPS-2, IPS-3 and IPS-4. From the elevation profile, it may be inferred that
corrosion rates are likely to be more in uphill/downhill segments such as between the region IPS-4 and SV7/SV8. Sludge analysis shows presence of corrosion products.
R&D Department Conclusions
The important conclusions of internal corrosion
monitoring experience using flush disc coupons in the multi-product pipeline carrying refined products are: Weight loss monitoring technique has limitations in
many respects;
Nevertheless, continuous monitoring and a history of accumulated coupon test results does offer an excellent inexpensive source of information.
The weight loss data can easily be integrated in a
corrosion appraisal to aid a robust pipeline integrity program.
R&D Department Recommendations/Suggestions
Locations that have highest susceptibility to accumulation of corrosion causing substance such as water or solids have highest likelihood of experiencing internal corrosion.
Those locations where probability of water and / or solid accumulation is more are to be identified or flagged for selecting these sites for installation of coupons at 6’o clock position.
The uninterrupted dosing of CI should be ensured to mitigate internal corrosion. The CI dosing vessels may also be cleaned periodically.
Provision of CI dosing may also be incorporated at Madarihat IPS-3 as this would provide internal protection further downstream till the Receipt Terminal in Siliguri.

R&D Department Recommendations/Suggestions
Microbiologically influenced corrosion is also another
important mechanism that is widely active in oil transmission pipelines. It is advisable to carry out proper sampling in sterile
sampling pots during next field visits to monitor biological activities. The scraper barrels should be periodically cleaned to
ensure that no water is accumulated inside the barrels. Accumulation of water leads to corrosion and biofouling.

R&D Department Recommendations/Suggestions
It is advisable to carry out random sampling of products from 6’o clock position to determine the water percentage.
Rectification of ER Probes and online corrosion monitoring, as stipulated in statutory guidelines.
ILI and or Corrosion audit of NSPL may be carried out in detail through domain experts to develop a robust long term corrosion management plan or pipeline integrity program.
Thank You !