internal audit report head contractor maintenance...
TRANSCRIPT
Internal audit report Head Contractor
Maintenance Model
Department of Housing
March 2012

© 2012 KPMG, an Australian partnership and a member firm of the KPMG network of independent member firms affiliated with KPMG International Cooperative (“KPMG International”), a Swiss entity. All rights reserved. Printed in Australia The KPMG name, logo and "cutting through complexity" are registered trademarks or trademarks of KPMG International. Liability limited by a scheme approved under Professional Standards Legislation.
2
Inherent Limitations
This report has been prepared as outlined in the Scope Section. The services provided in connection with this engagement comprise an advisory engagement, which is not subject to assurance or other standards issued by the Australian Auditing and Assurance Standards Board and, consequently no opinions or conclusions intended to convey assurance have been expressed.
No warranty of completeness, accuracy or reliability is given in relation to the statements and representations made by, and the information and documentation provided by the Department’s management, personnel and stakeholders consulted as part of the process.
Due to the inherent limitations of any internal control structure, it is possible that fraud, error or non-compliance with laws and regulations may occur and not be detected. Further, the internal control structure, within which the control procedures that are to be subject to the procedures we perform operate, will not be reviewed in its entirety and, therefore, no opinion or view is to be expressed as to its effectiveness of the greater internal control structure. The procedures to be performed are not designed to detect all weaknesses in control procedures as they are not performed continuously throughout the period and the tests performed on the control procedures are on a sample basis. Any projection of the evaluation of control procedures to future periods is subject to the risk that the procedures may become inadequate because of changes in conditions, or that the degree of compliance with them may deteriorate.
KPMG have indicated within this report the sources of the information provided. We have not sought to independently verify those sources unless otherwise noted within the report. KPMG is under no obligation in any circumstance to update this report, in either oral or written form, for events occurring after the report has been issued in final form.
The findings in this report have been formed on the above basis.
Third Party Reliance
This report is solely for the purpose set out in the Scope Section and for the Department of Housing’s information, and is not to be used for any other purpose or distributed to any other party without KPMG’s prior written consent.
This internal audit report is to be prepared at the request of the Department of Housing Audit Committee or its delegate in connection with our engagement to perform internal audit services as detailed in our proposal, dated 23 May 2007, your subsequent letter dated 11 July 2007 and your letter dated 6 March 2009 advising of the Department of Housing and Works (DHW) split and subsequent joint administration of our internal audit contract by DH and BMW. Other than our responsibility to the Board and Management of Department of Housing, neither KPMG nor any member or employee of KPMG undertakes responsibility arising in any way from reliance placed by a third party. Any reliance placed is that party's sole responsibility. This report may be provided to the Office of the Auditor General (OAG), the external auditor of the Department, for its own use. If the OAG intends to rely on internal audit work it can only do so in the context of the professional requirement placed on it by the provisions of the Australian Auditing Standard ASA 610 (Considering the Work of Internal Audit].
© 2012 KPMG, an Australian partnership and a member firm of the KPMG network of independent member firms affiliated with KPMG International Cooperative (“KPMG International”), a Swiss entity. All rights reserved. Printed in Australia The KPMG name, logo and "cutting through complexity" are registered trademarks or trademarks of KPMG International. Liability limited by a scheme approved under Professional Standards Legislation.
3
1.0 Executive summary 5
2.0 Background to the internal audit 14
3.0 Internal audit findings 17
Appendix 1 - Objective, scope and approach 51
Appendix 2 – Classification of findings 54
Appendix 3 – Supporting details of cost comparison calculations 56
Distribution
Name Title
Department of Housing Audit Committee
Grahame Searle Director General
Steve Parry General Manager, Service Delivery
Gary Bromley Audit Manager, Management Review and Audit
Contents
© 2012 KPMG, an Australian partnership and a member firm of the KPMG network of independent member firms affiliated with KPMG International Cooperative (“KPMG International”), a Swiss entity. All rights reserved. Printed in Australia The KPMG name, logo and "cutting through complexity" are registered trademarks or trademarks of KPMG International. Liability limited by a scheme approved under Professional Standards Legislation.
4
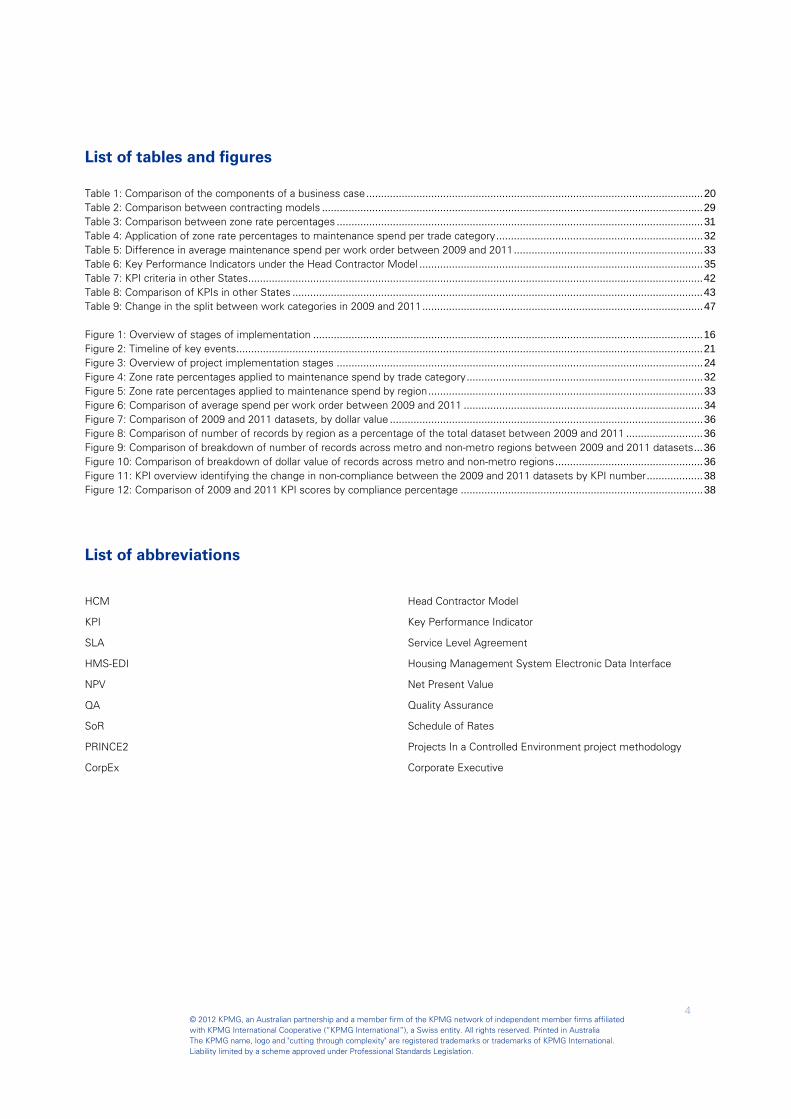
List of tables and figures Table 1: Comparison of the components of a business case .................................................................................................................. 20 Table 2: Comparison between contracting models ................................................................................................................................. 29 Table 3: Comparison between zone rate percentages ............................................................................................................................ 31 Table 4: Application of zone rate percentages to maintenance spend per trade category ...................................................................... 32 Table 5: Difference in average maintenance spend per work order between 2009 and 2011 ................................................................ 33 Table 6: Key Performance Indicators under the Head Contractor Model ................................................................................................ 35 Table 7: KPI criteria in other States.......................................................................................................................................................... 42 Table 8: Comparison of KPIs in other States ........................................................................................................................................... 43 Table 9: Change in the split between work categories in 2009 and 2011 ............................................................................................... 47 Figure 1: Overview of stages of implementation .................................................................................................................................... 16 Figure 2: Timeline of key events.............................................................................................................................................................. 21 Figure 3: Overview of project implementation stages ............................................................................................................................ 24 Figure 4: Zone rate percentages applied to maintenance spend by trade category ................................................................................ 32 Figure 5: Zone rate percentages applied to maintenance spend by region ............................................................................................. 33 Figure 6: Comparison of average spend per work order between 2009 and 2011 ................................................................................. 34 Figure 7: Comparison of 2009 and 2011 datasets, by dollar value .......................................................................................................... 36 Figure 8: Comparison of number of records by region as a percentage of the total dataset between 2009 and 2011 .......................... 36 Figure 9: Comparison of breakdown of number of records across metro and non-metro regions between 2009 and 2011 datasets ... 36 Figure 10: Comparison of breakdown of dollar value of records across metro and non-metro regions .................................................. 36 Figure 11: KPI overview identifying the change in non-compliance between the 2009 and 2011 datasets by KPI number ................... 38 Figure 12: Comparison of 2009 and 2011 KPI scores by compliance percentage .................................................................................. 38
List of abbreviations
HCM Head Contractor Model
KPI Key Performance Indicator
SLA Service Level Agreement
HMS-EDI Housing Management System Electronic Data Interface
NPV Net Present Value
QA Quality Assurance
SoR Schedule of Rates
PRINCE2 Projects In a Controlled Environment project methodology
CorpEx Corporate Executive

© 2012 KPMG, an Australian partnership and a member firm of the KPMG network of independent member firms affiliated with KPMG International Cooperative (“KPMG International”), a Swiss entity. All rights reserved. Printed in Australia The KPMG name, logo and "cutting through complexity" are registered trademarks or trademarks of KPMG International. Liability limited by a scheme approved under Professional Standards Legislation.
5
1.1 Objective1
In accordance with the 2011/12 Internal Audit Plan, an internal audit of the Department’s Head Contractor Maintenance Model was performed.
The key objective of the internal audit of the introduction and implementation of the Head Contractor Maintenance model was to provide information for management to answer the following high level questions:
• Was there an appropriate business case for the decision to adopt the new Head Contractor model?
• Is the Head Contractor Maintenance model an improvement on the previous maintenance arrangements with regard to cost and efficiency?
• Does the Head Contractor Maintenance model provide the Department with the means of measuring and driving improved maintenance outcomes?
• Are the existing contracts and service level agreements providing adequate controls and performance monitoring?
• Have appropriate performance measurement metrics and reporting mechanisms been put in place?
The specific objectives, scope and approach of the internal audit, as detailed in Appendix 1 to this report, were agreed with Management. Reference should be made to Appendix 1 in considering the scope, approach and findings of this internal audit.
1.2 Scope and approach
In the context of the above objectives, the internal audit involved consideration of the following broad issues:
• The adequacy and robustness of the Department’s decision making process that led to the introduction of the Head Contractor Maintenance Model;
• The actions taken by the Department to implement the new arrangements prior to and following 1 July 2010;
• Head contractor performance in the period 1 July 2010 to 30 June 2011 (the engagement considered performance results and information captured by the Department and excluded consultation with the individual Head Contractors);
• The adequacy of the existing contracts and associated service level agreements between the Department and the Head Contractors, with regards to controls and performance monitoring; and
• Implementation of appropriate performance measurement metrics and reporting mechanisms.
1 The scope and objective for this engagement are outlined in the Terms of Reference for the Head Contractor Maintenance Model Review, received from the Office of the Minister for Housing.
1.0 Executive summary
© 2012 KPMG, an Australian partnership and a member firm of the KPMG network of independent member firms affiliated with KPMG International Cooperative (“KPMG International”), a Swiss entity. All rights reserved. Printed in Australia The KPMG name, logo and "cutting through complexity" are registered trademarks or trademarks of KPMG International. Liability limited by a scheme approved under Professional Standards Legislation.
6
Our approach included six stages and is set out in detail in Appendix 1 and in relevant sections of the report. It broadly included:
• Targeted consultation within the Department;
• Information gathering;
• Reconstruction of a timeline of key events;
• Review of supporting documentation;
• Analysis, on a sample basis, of key performance data; and
• Consultation and confirmation of findings.
1.3 Report overview
The report addresses the objective and scope of the engagement in three primary sections:
Section A: Implementation of the Head Contractor Model
This section is largely retrospective and focuses on the decision making processes and project management of the implementation of the Head Contractor Model.
Section B: Performance comparison
This section provides an overview of the comparison between the previous contracting model and the current Head Contractor Model, in terms of the performance management system, as well as performance data.
Section C: Performance and contract management
This section is forward-looking and focuses on the aspects of current performance management and contract management processes associated with the Head Contractor Model.
These sections are prefaced by a background section and followed by Appendices outlining internal audit objective, scope, approach and classification details.
1.4 Presentation of findings
Findings from the internal audit, based on our objective, scope and approach, are reported in three categories.
The first is lessons learnt from the implementation of the Head Contractor Model, which management can adopt for future strategic projects.
The second is an overview of the results of the comparison of contracting models.
The third is specific findings on current performance activities and includes recommendations to be actioned.
A summary of findings in each category is provided overleaf.

© 2012 KPMG, an Australian partnership and a member firm of the KPMG network of independent member firms affiliated with KPMG International Cooperative (“KPMG International”), a Swiss entity. All rights reserved. Printed in Australia The KPMG name, logo and "cutting through complexity" are registered trademarks or trademarks of KPMG International. Liability limited by a scheme approved under Professional Standards Legislation.
7
1.5 Summary of lessons learnt
As the observations from Section A: Implementation of the Head Contractor Model largely relate to actions or activities that have occurred in the past, the findings from Section A are presented as “Lessons Learnt” which management can adopt for future strategic projects within the Department.
The following table includes a summary of the lessons learnt. Further details, including reference to progress the Department has made in incorporating these lessons into standard practice, are contained in the body of the report.
Ref # Lesson learnt
Existence and adequacy of a business case
1.1. A formal business case should be developed and approved for all strategic projects, to support Project Board members and the Corporate Executive in effective decision-making around the viability and validity of the project.
2.1.
The rationale for undertaking the project should be documented in the business case. These reasons should be linked to the organisational strategy and objectives to assist with goal congruence, and to ensure that only projects that assist the Department in achieving its goals are approved and resourced.
2.2. The business case should clearly outline or describe the different business options. At a minimum, this should include the options of “do nothing, do something, and do something more”.
2.3.
The business case should clearly analyse the expected benefits and dis-benefits of each option. These benefits should be relevant and project specific, and should allow for comparison between options where possible.
2.4.
The business case should include a detailed cost analysis of the preferred option. This analysis should include quantifiable costs and expected savings in order to calculate a Net Present Value (NPV). The assumptions used in the calculations should be clearly articulated and based on a reasonable projection of costs and savings.
Transparency of decision-making and recordkeeping
3.1.
The Corporate Executive and/or Project Board meetings should accurately capture the details of relevant decisions relating to key strategic projects. Such details may include noting the key discussion points, the full decision, and the key rationale/factors taken into account.
4.1.
All key project documents should be stored electronically with hardcopy documents filed and stored with Information Services and Records Management.

© 2012 KPMG, an Australian partnership and a member firm of the KPMG network of independent member firms affiliated with KPMG International Cooperative (“KPMG International”), a Swiss entity. All rights reserved. Printed in Australia The KPMG name, logo and "cutting through complexity" are registered trademarks or trademarks of KPMG International. Liability limited by a scheme approved under Professional Standards Legislation.
8
Ref # Lesson learnt
Implementation and transition planning
5.1.
The Corporate Executive should critically consider whether a significant change to existing business process be handled as a project. If it is run as a project, the Corporate Executive or Project Board should ensure a standard project methodology is adopted which requires the necessary project planning documentation.
6.1.
Impact assessments should be performed as part of the project planning process. This would include determining the likely impact that business change would have on processes and systems.
Further, an impact assessment could assist with identifying relevant stakeholders impacted by the project, and developing strategies to adequately engage them in the change process.
7.1. The Corporate Executive or Project Board should ensure adequate representation of operational staff on project teams, to facilitate buy-in to project deliverables and outcomes.
7.2. A formal handover should occur at each change in key project roles, such as the project sponsor or project manager. In addition, there should be adequate handovers between the project teams and the operational staff.
Risk management
8.1.
Each project should follow an overarching risk management approach which should outline:
• The risk methodology adopted (e.g. risk classification and ratings);
• When and how the risk assessment will take place;
• The documenting of risks within the risk register and how the risk register will be continuously updated and monitored;
• How mitigation strategies will be monitored for implementation;
• The assignment of risk owners and overall responsibility for risk management in the project; and
• The reporting of risks in project progress reports.
The project risk management strategy should ideally be aligned to the Department’s risk management strategy to ensure risk classification is consistent across projects.

© 2012 KPMG, an Australian partnership and a member firm of the KPMG network of independent member firms affiliated with KPMG International Cooperative (“KPMG International”), a Swiss entity. All rights reserved. Printed in Australia The KPMG name, logo and "cutting through complexity" are registered trademarks or trademarks of KPMG International. Liability limited by a scheme approved under Professional Standards Legislation.
9
1.6 Overview of results of the comparison between contracting models
The scope for Section B: Comparison between contracting models, including the following:
1. Considering the framework used by the Department to record, manage and monitor data on contractor performance prior to, and after implementation of the Head Contractor Model; and
2. On a sample basis, comparing the contractor performance results to identify possible improvements with regards to key performance measures of cost, timeliness and quality.
1 Comparison between the performance management frameworks
Table 2 on page 29 summarises the performance management framework used by the Department for both the previous and the current Head Contractor Model.
Internal Audit identified the following key differences with regards to performance management:
• The Department is no longer responsible for updating the Caretaker system with completed job orders. This process is completed by the Head Contractor through the HMS-EDI system interface. Refer to page 45 for more details.
• KPI data and reports are being produced on a periodic basis to enable standardised measurement of Head Contractor performance as well as trend analysis of Head Contractor performance over time and between regions.
• Under the Head Contractor Model, performance targets are formally set out within the SLAs and the Department can apply penalties and incentives based on the contractors’ performance.
2 Comparison between contractor performance results
It is difficult to perform a direct comparison between the old and new maintenance models from a cost and efficiency perspective for a number of reasons, as outlined on page 30. These reasons include:
• The cost basis is driven by a number of factors, including number of work orders issued;
• The models use the same Schedules of Rates, but different mark-up percentages are applied (referred to as “zone rate percentages”);
• Irregular once off occurrences may skew the results of any comparison; and
• There are a number of factors which are not measured at present, which may impact the cost comparison in the long term, such as the cost of contract administration. Refer to paragraph 8 on page 37.
Notwithstanding the limitations described on page 30, Internal Audit performed a comparison of the contractor performance results of the previous and current models relating to the three key performance areas of cost, timeliness and quality.
There are a number of considerations which should be taken into account when interpreting the data. These are listed in paragraph 8 on page 37.

© 2012 KPMG, an Australian partnership and a member firm of the KPMG network of independent member firms affiliated with KPMG International Cooperative (“KPMG International”), a Swiss entity. All rights reserved. Printed in Australia The KPMG name, logo and "cutting through complexity" are registered trademarks or trademarks of KPMG International. Liability limited by a scheme approved under Professional Standards Legislation.
10
Summary of Section B: Comparison between contracting models
When comparing the two models based on the critical success factors of cost, timeliness and quality, our analysis above can be summarised as follows (noting the restrictions and limitations set out in paragraph 2 on page 30 and paragraph 8 on page 37):
• From a cost perspective, the comparisons performed by Internal Audit (refer Table 4 and on page 32) indicates that the costs (applying consistent base) are broadly comparable between the models at a total spend level. However, there are indications that savings can be achieved (with appropriate management discipline applied), based on the decrease in the average cost per work order (refer to Table 5 on page 33).
However, it is important to note the items discussed under “Comparison between previous and current contracting models”, paragraph 2 on page 30.
• From a timeliness perspective, the KPI data comparison performed by Internal Audit (refer Figure 11 and Figure 12 on page 38) indicates a lower percentage of compliance to the timeliness KPIs under the new Head Contractor Model.
However, it is important to note the items discussed under “Interpretation of data”, paragraph 8 on page 37.
• From a quality perspective, the current Head Contractor Model contract KPIs do not allow for measurement of the quality of the work performed by the contractors, as discussed further on page 41. This means that at present, the models cannot be directly compared on a quality basis.
Providing the means to measure and drive improved maintenance outcomes
One of the key benefits identified by the Department of implementing the Head Contractor Model was the ability of the Head Contractor Model to provide the Department with the means to measure and drive improved maintenance outcomes.
The definition of “improved maintenance outcomes” would include a range of aspects, such as reduced cost; improved quality; improved timeliness; improved ability to resolve disputes; improved contractor accountability and reduced administration processes. We note that at present the Department has not made an evaluation of these aspects in order to measure the overall success of the Head Contractor Model (refer page 49 for further details).
The comparison and analysis performed by Internal Audit in Sections B and C indicated the following regarding the Model’s ability to drive improved maintenance outcomes:
• Due to the issues experienced during implementation, it is likely that the Head Contractor Model has not reached its full potential and full benefits may only be realised in the longer term.
• There are indications in the cost structure that savings can be achieved, with appropriate management discipline applied, based on the items discussed in the summary above, and the analysis performed on page 31 onwards.
• There are differences in the performance management framework between the Models (refer page 29), with key improvements relating to the introduction of formal performance targets; a penalty and incentive scheme; and improved performance reporting and trend analysis.
• There are opportunities to improve the adequacy and appropriateness of the key performance indicators (KPIs), particularly introducing a measure of quality of work; and reviewing the KPI targets (refer page 41).
Further, there are opportunities to improve the performance management processes, such as introducing stricter controls over the recording of performance data (refer page 45); and improved clarity in the application of maintenance work categories (refer page 47).
By addressing these issues, the Department will improve the Model’s ability to measure and drive improved maintenance outcomes.
© 2012 KPMG, an Australian partnership and a member firm of the KPMG network of independent member firms affiliated with KPMG International Cooperative (“KPMG International”), a Swiss entity. All rights reserved. Printed in Australia The KPMG name, logo and "cutting through complexity" are registered trademarks or trademarks of KPMG International. Liability limited by a scheme approved under Professional Standards Legislation.
11
1.7 Summary of internal audit findings for specific action with regards to maintenance activities
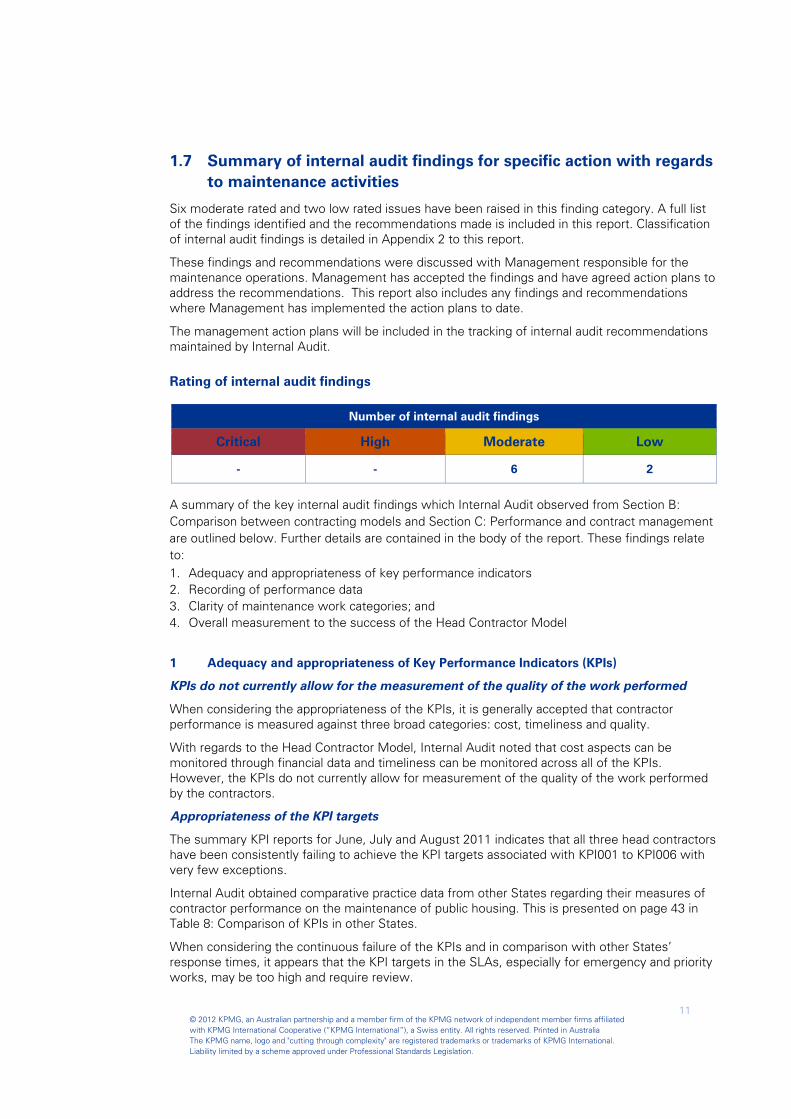
Six moderate rated and two low rated issues have been raised in this finding category. A full list of the findings identified and the recommendations made is included in this report. Classification of internal audit findings is detailed in Appendix 2 to this report.
These findings and recommendations were discussed with Management responsible for the maintenance operations. Management has accepted the findings and have agreed action plans to address the recommendations. This report also includes any findings and recommendations where Management has implemented the action plans to date.
The management action plans will be included in the tracking of internal audit recommendations maintained by Internal Audit.
Rating of internal audit findings
A summary of the key internal audit findings which Internal Audit observed from Section B: Comparison between contracting models and Section C: Performance and contract management are outlined below. Further details are contained in the body of the report. These findings relate to: 1. Adequacy and appropriateness of key performance indicators 2. Recording of performance data 3. Clarity of maintenance work categories; and 4. Overall measurement to the success of the Head Contractor Model
1 Adequacy and appropriateness of Key Performance Indicators (KPIs)
KPIs do not currently allow for the measurement of the quality of the work performed
When considering the appropriateness of the KPIs, it is generally accepted that contractor performance is measured against three broad categories: cost, timeliness and quality.
With regards to the Head Contractor Model, Internal Audit noted that cost aspects can be monitored through financial data and timeliness can be monitored across all of the KPIs. However, the KPIs do not currently allow for measurement of the quality of the work performed by the contractors.
Appropriateness of the KPI targets
The summary KPI reports for June, July and August 2011 indicates that all three head contractors have been consistently failing to achieve the KPI targets associated with KPI001 to KPI006 with very few exceptions.
Internal Audit obtained comparative practice data from other States regarding their measures of contractor performance on the maintenance of public housing. This is presented on page 43 in Table 8: Comparison of KPIs in other States.
When considering the continuous failure of the KPIs and in comparison with other States’ response times, it appears that the KPI targets in the SLAs, especially for emergency and priority works, may be too high and require review.
Number of internal audit findings
Critical High Moderate Low
- - 6 2
© 2012 KPMG, an Australian partnership and a member firm of the KPMG network of independent member firms affiliated with KPMG International Cooperative (“KPMG International”), a Swiss entity. All rights reserved. Printed in Australia The KPMG name, logo and "cutting through complexity" are registered trademarks or trademarks of KPMG International. Liability limited by a scheme approved under Professional Standards Legislation.
12
2 Recording of performance data
Internal Audit noted control weaknesses in the process to record the job order completion time by the head contractor.
The time at which a job order is returned in the system forms the basis of many of the KPI measures regarding timeliness. The time at which the job order is returned is manually entered by the head contractor when processing the completed job order. This manually entered data is not currently verified by the Department.
Further, there are limited system controls in Caretaker to prevent an incorrect entry. During our data analysis (refer page 38), Internal Audit encountered over 100 instances where the date of completion was prior to the data of issue. These are indications of manual entry errors resulting from limited system controls.
These errors reduce the accuracy of the performance measurement process, as there is limited assurance that the time completed is fair and accurate. There is also a risk that the head contractors could be entering incorrect completion times in order to meet their KPI targets.
We note that since the head contractors are consistently failing to achieve the KPI targets, it is unlikely that incorrect data is being entered; however the risk of human error and fraud still exists.
3 Clarity of maintenance work categories
The classification of a maintenance job order as emergency, priority or routine has significant consequences for the performance measurement process, as different KPI targets exist for the different work categories (as indicated in Table 6 on page 35) and has an effect on the application of incentives and penalties.
Internal Audit noted that neither the contracts nor the Service Level Agreements (SLAs) clearly document the type of maintenance activity that would be categorised under each work category – that is, whether a maintenance task is an emergency, priority or routine.
Data analysis performed by Internal Audit indicates that the percentage of emergency job orders to total job orders issued has increased by 110% in the metro areas, and 197% in the non-metro areas compared to the previous maintenance model, as indicated in Table 9 on page 47.
Although the Department would wish to retain the right to classify the job order, irrespective of the formal definition, in order to maintain the criticality of an emergency/priority job order, it should be used sparingly and appropriately (for example, it should not be used to prompt a quick response if there is a backlog).
4 Overall measurement of the success of the Head Contractor Model
Internal Audit noted that there is currently no formal process by which the Department can measure the overall benefits realised from the implementation of the Head Contractor Model.
The only measure by which the Department can compare the models, is on maintenance expenditure. However, there are many external factors which may affect maintenance expenditure (such as fewer job orders issued; natural disasters; etc.) and a direct comparison may not reveal actual savings or overspend.
This is also complicated by the lack of a formal business case (refer to “Lessons Learnt 1.1” on page 23). The business case would have listed the critical success factors and expected benefits, which could have been used post-implementation to measure the success of the model.
© 2012 KPMG, an Australian partnership and a member firm of the KPMG network of independent member firms affiliated with KPMG International Cooperative (“KPMG International”), a Swiss entity. All rights reserved. Printed in Australia The KPMG name, logo and "cutting through complexity" are registered trademarks or trademarks of KPMG International. Liability limited by a scheme approved under Professional Standards Legislation.
13
1.8 Overall management comment
The introduction and implementation of the Head Contractor Model was an unprecedented change in the administration of maintenance by the Department of Housing.
Aware of the need for close oversight, the findings of this report identify elements of risk, particularly to measure and drive improved maintenance outcomes in terms of cost, timeliness and quality to meet our current and future organisational needs.
The implementation of the agreed actions, in addition to the corporate governance measures the organisation has already put into practice, add positive value and provide the Department the opportunity to improve and streamline contractor management.
The Department accepts the overall assessment of this report and will proactively address the issues of concern that have been agreed upon.
Steve Parry
General Manager Service Delivery

© 2012 KPMG, an Australian partnership and a member firm of the KPMG network of independent member firms affiliated with KPMG International Cooperative (“KPMG International”), a Swiss entity. All rights reserved. Printed in Australia The KPMG name, logo and "cutting through complexity" are registered trademarks or trademarks of KPMG International. Liability limited by a scheme approved under Professional Standards Legislation.
14
Department of Housing
The Department of Housing (“the Department”) is responsible for facilitating the provision of housing and accommodation to Western Australians experiencing housing need. The Department offers various housing services, such as the provision of affordable land and housing; assisting with housing finance through Keystart; providing rental housing; and supplying housing to government employees in regional areas.
The Department’s statutory authority is the Housing Authority which is accountable to Parliament through the Minister for Housing.
The Department is structured into a number of functional areas including Strategy and Policy; Commercial and Business Operations; Service Delivery, and Organisational Transformation. These business areas work together and with related providers, to supply the state with key services including Public Housing, Community Housing, Aboriginal Housing, and Land and Housing Development.
In its Strategic Plan, the Department lists the “delivery of an improvement in the management of public housing” as a key objective for the Department by 2013. The introduction of the Head Contractor Model can be seen as an action to achieve this objective.
Maintenance on public housing
The Service Delivery business unit is responsible for the management of the delivery of key services to public housing tenants. This includes maintenance on public housing and the management of the regional network of branches.
The Department is one of the largest landlords in Western Australia and owns more than 40,000 properties across the State. The Department carries out regular maintenance on these dwellings including public housing and Government Regional Officer Housing.
During 2010/2011, a total of $101.79 million was spent on routine maintenance; vacated maintenance; refurbishments and improvements; planned and cyclical maintenance, estates maintenance and insurance work.
Head Contractor Model for maintenance
The Department previously undertook maintenance services by various trades through a direct contracting model. This model was based on the regional branches issuing job orders directly to local contractors in their regions.
In 2007/2008, the Department undertook a review of its maintenance operations which resulted in a series of key recommendations relating to contracts, procurement and quality assurance activities. At this time, the Department had 81 zones and approximately 700 separate maintenance contracts or agreements across the State.
Following this review, a new contract model was nominated to be implemented (effective 1st July 2010), whereby Head Contracts be awarded in 10 regions across the State. This new model aimed to reduce the number of contracts and contractors and also improve the efficiency and effectiveness of maintenance operations.
As a result all existing Maintenance Contracts expired on the 30th June 2010 and all new maintenance requests (since 1st July 2010) are being processed under the new Head Contractor Model.
2.0 Background to the internal audit
© 2012 KPMG, an Australian partnership and a member firm of the KPMG network of independent member firms affiliated with KPMG International Cooperative (“KPMG International”), a Swiss entity. All rights reserved. Printed in Australia The KPMG name, logo and "cutting through complexity" are registered trademarks or trademarks of KPMG International. Liability limited by a scheme approved under Professional Standards Legislation.
15
The Head Contractor Model is now based on three head contractors who manage the maintenance services for each the Department’s 10 regions. The head contractors subsequently manage the workload and appoint sub-contractors to undertake the work.
The model is used to provide maintenance services for emergency, priority, routine, planned and vacant properties with an option to include lump sum major works as required.
The three Contractors operating across the 10 regions are:
• Transfield Services Australia – Metro South, Metro Southeast , Metro North, Midwest, Pilbara and Great Southern regions;
• Lake Maintenance Services – Kimberley, Wheatbelt and Goldfields regions; and
• Programmed Facility Management – Southwest region.
The Department reported in its 2010/2011 Annual Report that it had experienced difficulties following the introduction of the new model. These difficulties were ascribed to process and systems issues impacting on service performance. The Department also noted that a level of stakeholder resistance was experienced. A re-implementation project, commencing approximately August 2010, was established to address these difficulties.
Re-implementation activities included stabilisation of the IT platform, resolution of process issues and new business practices to better support the new model.
High-level overview of the implementation
Figure 1 overleaf provides a high-level overview of the stages of implementation of the Head Contractor Model. Further detailed timelines and discussion is provided in the body of the report.

© 2012 KPMG, an Australian partnership and a member firm of the KPMG network of independent member firms affiliated with KPMG International Cooperative (“KPMG International”), a Swiss entity. All rights reserved. Printed in Australia The KPMG name, logo and "cutting through complexity" are registered trademarks or trademarks of KPMG International. Liability limited by a scheme approved under Professional Standards Legislation.
16
Pro
cure
men
t Pla
n
app
rove
d by
Dir
ecto
r G
ener
al a
nd
Co
rpor
ate
Exe
cutiv
e10
Feb
201
0
Ten
der
s ad
verti
sed
10 M
ar 2
010
Eva
luat
ion
and
aw
ard
of
con
trac
tsA
pr t
o M
ay 2
010
Hea
d C
on
trac
tors
si
gn
con
tract
s17
Ju
n 2
010
Su
b P
roje
ct 3
Co
mm
erc
ial
Op
era
tion
s
Su
b P
roje
ct 2
Dat
a an
d R
ep
ort
ing
Cri
sis
Ma
na
ge
me
nt
an
d
Sta
bil
isa
tio
n
Pro
jec
t C
los
e O
ut
Sta
ge 1
Sta
ge 2
Sta
ge 3
SL
A &
KP
IE
nfo
rce
me
nt
an
d B
AU
Ha
nd
ov
er
Obj
ectiv
e 3
Bud
get
Rep
orti
ng a
nd
Mon
itorin
g
Obj
ectiv
e 1
Hea
d C
on
trac
tor‘s
Co
mpl
ianc
e w
ith
KP
I’san
d S
LA’s
Obj
ectiv
e 4
Mea
sure
& re
duc
e o
verd
ue jo
bs
Obj
ectiv
e 2
Red
uce
vaca
nt p
rope
rtie
s by
50%
Tw
o p
erso
nnel
ap
poin
ted
to m
anag
e th
e m
ain
ten
ance
co
ntra
ct
issu
es.
11 A
ug
201
0N
egat
ive
med
ia c
ove
rage
ar
oun
d T
rans
field
’sus
e o
f lo
cal c
ontr
acto
rs2
Au
g 2
010
Sta
tus
rep
ort
for
Co
rpor
ate
Exe
cutiv
es
stat
ing
that
sta
ge 2
is
und
erw
ay15
Dec
201
0
Sta
tus
rep
ort
for
Co
rpor
ate
Exe
cutiv
es
stat
ing
that
sta
ge 2
is
Co
mp
lete
an
d st
age
3 is
un
der
way
10 M
ar 2
011
Pro
ject
clo
se re
por
t ap
pro
ved
and
dis
trib
uted
17 M
ay 2
011
Au
g 2
010
Sep
201
0M
ar 2
011
Su
b P
roje
ct 1
Issu
es
and
Re
po
rtin
g
Re-
Imp
lem
enta
tio
nIm
ple
men
tati
on
Init
iati
on
Hea
d C
on
trac
tors
co
mm
ence
ope
ratio
ns in
th
e n
ew m
od
el1
July
201
0
Figure 1: Overview of stages of implementation
© 2012 KPMG, an Australian partnership and a member firm of the KPMG network of independent member firms affiliated with KPMG International Cooperative (“KPMG International”), a Swiss entity. All rights reserved. Printed in Australia The KPMG name, logo and "cutting through complexity" are registered trademarks or trademarks of KPMG International. Liability limited by a scheme approved under Professional Standards Legislation.
17
The internal audit findings are presented in three sections:
Section A: Implementation of the Head Contractor Model
This section is retrospective and focuses on the decision making processes and project management of the implementation of the Head Contractor Model.
As the observations largely relate to actions that have occurred in the past, the findings from Section A are presented as “Lessons Learnt” which management can adopt for future strategic projects within the Department and/or future maintenance model reviews.
Section B: Comparison between contracting models
This section provides an overview of the comparison between the previous contracting model and the current Head Contractor Model, in terms of the performance management system, as well as performance data.
Section C: Performance and contract management
This section is forward-looking and focuses on the current performance management and contract management processes of the Head Contractor Model.
Section C includes recommendations for improvement of the performance and contract management framework.
3.0 Internal audit findings
© 2012 KPMG, an Australian partnership and a member firm of the KPMG network of independent member firms affiliated with KPMG International Cooperative (“KPMG International”), a Swiss entity. All rights reserved. Printed in Australia The KPMG name, logo and "cutting through complexity" are registered trademarks or trademarks of KPMG International. Liability limited by a scheme approved under Professional Standards Legislation.
18
Section A: Implementation of the Head Contractor Model
3.1 Decision making processes and business case
Objective
To consider the adequacy and robustness of the decision making process that led to the introduction of the Head Contractor Maintenance Model.
Approach
1. Consider how the business need for the Head Contractor Model was identified and developed into a business case.
2. Confirm the existence and adequacy of the business case for the Head Contractor Model, including the level of detail of the business case (e.g. analysis of options) and existence of robust project evaluation procedures.
3. Reconstruct, at a high-level, a timeline of events leading up to the approval of the Head Contractor Model to identify key actions and approvals in the decision-making process.
4. Inspect relevant documentation, including Executive Meeting minutes, to understand the adequacy and transparency of the decision-making process and final approval. In particular, consider the level of rigour of the constructive debate amongst Management and Executive regarding the final approval.
Observations
1. Identifying the business need
The concept of a head contractor model for maintenance contracts has been raised periodically across the Department for several years. This has been primarily due to:
• The inherent limitations and issues regarding the previous maintenance model, which was a direct contracting model. Aspects of the previous model were deemed to be inefficient, mainly due to the administrative and management effort required to effectively manage over 700 contracts across Western Australia. In addition, from a legal and compliance perspective, there were concerns regarding the agreements with certain contractors, many of which were not formalised (i.e. gentleman’s agreements).
• A number of senior personnel from the Department attended the National Housing Conference as well as other key public housing forums. The general message taken by these personnel from these forums was that a head contractor model was the preferred method of procurement for many of the States, and that a head contractor model provided tangible benefits.
In response, in 2007 and 2008, the Department undertook a number of reviews of its maintenance operations resulting in key recommendations relating to contract management, procurement and quality assurance. In 2007, a combined review was performed with Curtin University and in 2008 a subsequent review was performed internally.
The recommendations from these reports clearly articulated the business need for an improved maintenance model, and recommended that a head contractor model be adopted.
In early 2009, the Maintenance Manager was tasked with implementing the recommendations from the two reports, including initiating the process to move towards a head contractor model. The output from this resulted in a “Procurement plan: Provision of Maintenance Services for Various Trades”, which detailed how the proposed head contractor model would implement the recommendations from the maintenance reviews, and ultimately lead to an improved maintenance model for the Department.

© 2012 KPMG, an Australian partnership and a member firm of the KPMG network of independent member firms affiliated with KPMG International Cooperative (“KPMG International”), a Swiss entity. All rights reserved. Printed in Australia The KPMG name, logo and "cutting through complexity" are registered trademarks or trademarks of KPMG International. Liability limited by a scheme approved under Professional Standards Legislation.
19
2. Existence and adequacy of a business case
The “Procurement plan: Provision of Maintenance Services for Various Trades” (“the Procurement Plan”) was the primary document used to facilitate discussion around the implementation of the proposed head contractor model. That is, there was no formal business case prepared to support the decision to implement the Head Contractor Model. Refer to “Lessons Learnt 1.1”.
The Procurement Plan and several other documents combined to form elements of a business case; however not all the components expected from a business case were developed. The table below presents the elements generally found in a business case, against the documents and plan prepared by the Department, highlighting any gaps.
Elements of a standard business case Components developed for the Head Contractor Model
Reasons:
Identifying the business need
Link to organisational strategy and objectives
The Procurement Plan identifies the business need and reasons for implementing the Head Contractor Model:
- enable efficiencies in contract management;
- improved value for money from the maintenance; and
- drive efficiencies and continuous performance from the contractors.
These objectives were not clearly linked to the Department’s overall strategy or objectives within the Procurement Plan. Refer to “Lessons Learnt 2.1”.
Business options:
Do nothing, do something or no something more
Analysis of each option
Internal Audit were unable to identify evidence to confirm that different options associated with the implementation had been considered; and that an analysis of each business option had been performed. Refer to “Lessons Learnt 2.2”
Expected benefits and dis-benefits
Advantages and disadvantages of the recommended option
The expected benefits of the Head Contractor Model were listed as the objectives within the Procurement Plan (refer to “Reasons” section above).
Subsequent to a National Housing Conference, a presentation was made to Corporate Executive which discussed the high-level advantages and disadvantages of a head contractor model.
In addition, when the Procurement Plan was presented to Corporate Executive, the presentation included a discussion of the key advantages and disadvantages of implementing a Head Contractor Model.
However, all of the above documentation refers to high-level discussions of theoretical benefits and dis-benefits, and do not specifically refer to the Department’s Head Contractor Model, relevant in a Western Australian business context.
Further, Internal Audit were unable to identify evidence to support that the expected benefits and dis-benefits were analysed and quantified (where possible) to allow an implementation decision to be made. Refer to “Lessons Learnt 2.3”.
© 2012 KPMG, an Australian partnership and a member firm of the KPMG network of independent member firms affiliated with KPMG International Cooperative (“KPMG International”), a Swiss entity. All rights reserved. Printed in Australia The KPMG name, logo and "cutting through complexity" are registered trademarks or trademarks of KPMG International. Liability limited by a scheme approved under Professional Standards Legislation.
20
Elements of a standard business case Components developed for the Head Contractor Model
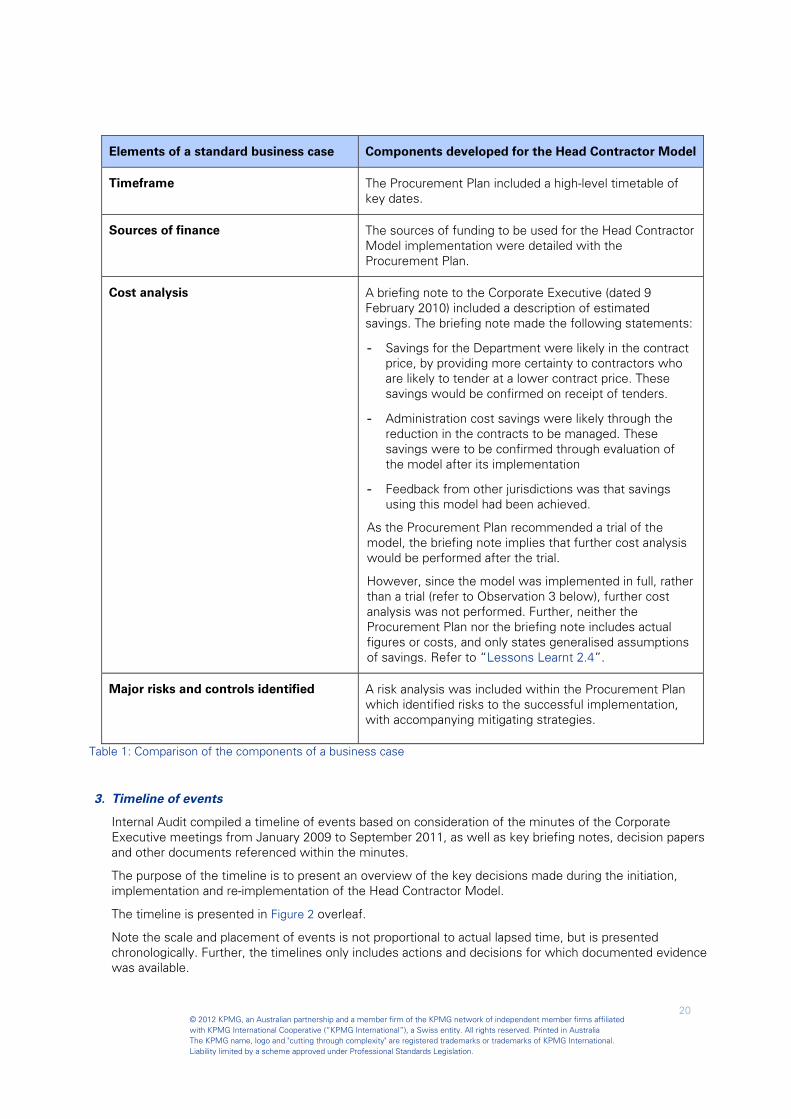
Timeframe The Procurement Plan included a high-level timetable of key dates.
Sources of finance The sources of funding to be used for the Head Contractor Model implementation were detailed with the Procurement Plan.
Cost analysis A briefing note to the Corporate Executive (dated 9 February 2010) included a description of estimated savings. The briefing note made the following statements:
- Savings for the Department were likely in the contract price, by providing more certainty to contractors who are likely to tender at a lower contract price. These savings would be confirmed on receipt of tenders.
- Administration cost savings were likely through the reduction in the contracts to be managed. These savings were to be confirmed through evaluation of the model after its implementation
- Feedback from other jurisdictions was that savings using this model had been achieved.
As the Procurement Plan recommended a trial of the model, the briefing note implies that further cost analysis would be performed after the trial.
However, since the model was implemented in full, rather than a trial (refer to Observation 3 below), further cost analysis was not performed. Further, neither the Procurement Plan nor the briefing note includes actual figures or costs, and only states generalised assumptions of savings. Refer to “Lessons Learnt 2.4”.
Major risks and controls identified A risk analysis was included within the Procurement Plan which identified risks to the successful implementation, with accompanying mitigating strategies.
Table 1: Comparison of the components of a business case
3. Timeline of events
Internal Audit compiled a timeline of events based on consideration of the minutes of the Corporate Executive meetings from January 2009 to September 2011, as well as key briefing notes, decision papers and other documents referenced within the minutes.
The purpose of the timeline is to present an overview of the key decisions made during the initiation, implementation and re-implementation of the Head Contractor Model.
The timeline is presented in Figure 2 overleaf.
Note the scale and placement of events is not proportional to actual lapsed time, but is presented chronologically. Further, the timelines only includes actions and decisions for which documented evidence was available.

© 2012 KPMG, an Australian partnership and a member firm of the KPMG network of independent member firms affiliated with KPMG International Cooperative (“KPMG International”), a Swiss entity. All rights reserved. Printed in Australia The KPMG name, logo and "cutting through complexity" are registered trademarks or trademarks of KPMG International. Liability limited by a scheme approved under Professional Standards Legislation.
21
Figure 2: Timeline of key events
Pre
sen
tatio
n to
the
Dep
artm
ent o
n M
ain
ten
ance
Mo
dels
fo
llow
ing
Nat
iona
l Ho
usin
g C
on
fere
nce
26 M
ar 2
009
“Pro
visi
on o
f Mai
nte
nanc
e S
ervi
ces
for V
ario
us
Tra
des
Pre
sent
atio
n”
Cor
pEx
min
utes
29 J
an 2
010
“Mai
nte
nan
ce P
rocu
rem
ent
Mo
del
en
dors
ed b
y C
orp
Ex”
C
orpE
xm
inut
es25
Feb
201
0
“Hea
d C
on
tract
or
Pro
ject
Dis
cuss
ions
” C
orpE
xm
inut
es9
Mar
201
0
Ten
der
s cl
osed
8
Ap
r 201
0
“Ten
der
Rev
iew
C
om
mitt
ee
esta
blis
hed
and
dra
ft T
erm
s o
f Ref
eren
ce
dev
elo
ped”
Cor
pEx
min
utes
7 M
ay 2
010
“Ten
der
Rev
iew
P
roce
ss s
igne
d o
ff fo
r n
ew c
on
tract
mo
del”
Eva
luat
ion
Rep
ort
Cor
pEx
min
utes
20 M
ay 2
010
“Up
dat
e o
n th
e st
atus
o
f th
e H
ead
Co
ntra
ctor
M
od
el” C
orpE
xm
inut
es3
Jun
201
0
“Hea
d C
on
tract
ors
sig
n c
ontra
cts
“ C
orpE
xm
inut
es17
Ju
n 2
010
“Co
ntr
act e
xecu
tion
for
Hea
d C
on
trac
tors
. Ho
usin
g m
ain
ten
ance
sys
tem
goe
s liv
e” C
orpE
xm
inut
es1
Jul 2
010
“HC
M P
roje
ct te
ams
achi
evin
g p
rogr
ess
with
impl
emen
tatio
n. A
im
to d
evel
op
aud
it/co
mpl
ianc
e m
odel
fo
r HC
M” C
orpE
xm
inut
es6
Oct
201
0
“Im
pro
ving
pos
itive
p
rogr
ess
repo
rtin
g fo
r H
CM
” Cor
pEx
min
utes
21 O
ct 2
010
“Up
dat
e o
n S
tag
e 1
and
2 o
f th
e H
CM
p
roje
cts.
Co
rpE
xap
prov
ed th
e bu
dget
an
d fo
reca
st e
xpen
ditu
re fo
r th
e Zo
ne
Mai
nte
nan
ce R
eim
plem
enta
tion
Pro
ject
. Ch
ange
man
agem
ent a
nd
go
vern
ance
dis
cuss
ed” C
orpE
xm
inut
es15
Dec
201
0
“Ser
vice
Lev
el A
gre
emen
ts fo
r HC
M
con
trac
ts in
the
met
ro a
rea
cam
e in
to
effe
ct o
n 1
Feb
ruar
y 20
11. F
inal
isat
ion
of
Hea
d C
on
trac
tor R
eim
plem
enta
tion
Pro
ject
” Cor
pExm
inut
es10
Feb
201
1“Deb
rief
on
Hea
d
Co
ntr
acto
r Mo
del b
y N
eil
Bat
chel
or.
Co
rpor
ate
Exe
cutiv
es a
gre
ed o
n ac
tion
s to
be
take
n”
Cor
pEx
min
utes
24 F
eb 2
011
“Org
anis
atio
nal
Tra
nsf
orm
atio
n E
xecu
tive
Rep
ort
PR
INC
E2
Ro
llout
” C
orpE
xm
inut
es15
Ap
r 201
0
Ph
ase
2 o
f Hea
d
con
trac
tor
reim
ple
men
tatio
n p
roje
ct c
ompl
eted
, P
has
e 3
com
men
ced.
10 M
ar 2
011
“Pro
ject
is in
itiat
ed
to c
lean
se a
nd
reco
nci
le jo
b o
rder
d
ata”
Cor
pEx
min
utes
24 M
ar 2
011
“Up
dat
e p
rovi
ded
on
the
KP
I pro
ject
” C
orpE
xm
inut
es7
Ap
r 201
0
“Hea
d C
on
tract
or
Mai
nte
nan
ce P
roje
ct S
tag
e 3
Pro
ject
Man
agem
ent P
lan
tabl
ed” C
orpE
xm
inut
es .
Th
e d
ecis
ion
pap
er w
as
acce
pte
d b
y C
orp
Ex.
21 A
pr 2
011
HC
M P
roje
ct
Clo
sure
Rep
ort
app
rove
d an
d d
istr
ibut
ed17
May
201
0
“Co
rpE
xag
reed
to ro
ll o
ut tr
ial o
f Hea
d
Co
ntr
acto
r mo
del w
ith s
elec
ted
reg
ions
an
d to
te
nd
er o
ut e
ach
regi
on fo
r th
e H
ead
Con
trac
t M
od
el o
n a
3+2+
2 P
lan
” Cor
pEx
min
utes
10 F
eb 2
010
“Co
rpE
xen
dors
ed th
e re
com
men
datio
n th
at a
re
view
will
be
con
duct
ed
on
KP
Is” C
orpE
xm
inut
es9
Sep
201
0
Re-
Imp
lem
enta
tio
nIm
ple
men
tati
on
Init
iati
on
Ten
der
s ad
verti
sed
10 M
ar 2
010
Pro
cure
men
t Pla
n
sig
ned
by
the
Dire
ctor
G
ener
al19
Feb
201
0
Dec
isio
n P
aper
sub
mitt
ed to
C
orp
Ex
to a
ddr
ess
conc
erns
ra
ised
on
29 J
an 2
010
9F
eb 2
010

© 2012 KPMG, an Australian partnership and a member firm of the KPMG network of independent member firms affiliated with KPMG International Cooperative (“KPMG International”), a Swiss entity. All rights reserved. Printed in Australia The KPMG name, logo and "cutting through complexity" are registered trademarks or trademarks of KPMG International. Liability limited by a scheme approved under Professional Standards Legislation.
22
4. Transparency of decision-making processes
Internal Audit considered the minutes of the Corporate Executive meetings from the period January 2009 to September 2011 to understand the adequacy and transparency of the decision-making process and final approval of the decision to implement the Head Contractor Model. In particular, we considered the evidence of rigour of the constructive debate amongst Management and Executive regarding the final approval.
As indicated on the timeline (Figure 2), at the Corporate Executive meeting on 29 January 2010, a Decision Paper was submitted for the approval of the Procurement Plan. At that meeting, the members of the Corporate Executive requested additional information regarding timeframes; critical success requirements; systems support requirements; and a cost benefit analysis, should the proposed model be adopted.
A Briefing Note was tabled at the Corporate Executive meeting on the 9 February 2010 which addressed these concerns. Refer to Table 1 above for consideration of the adequacy of the response.
The Decision Paper was subsequently approved and endorsed by the Corporate Executive on 10 February 2010 and the Procurement Plan approved by the Director General on 19 February 2010.
Internal Audit consulted several members of the Corporate Executive team who confirmed that there was a significant amount of discussion and debate regarding the planned implementation of the model. However, from a governance perspective, we note that the meeting minutes do not accurately reflect the level of discussion, or if any questions/concerns were raised by members and how these were resolved. Refer to “Lessons Learnt 3.1”.
It should be noted that the Procurement Plan specifically recommended that a trial of the model be piloted at one regional and one metropolitan region in order to test the validity of the assumptions and expected benefits. The recommendation for a trial version was also recorded as such in the Briefing Note, the Corporate Executive meeting minutes, and the Decision Paper.
However, we were advised that the decision that was made at the Corporate Executive meeting on 10 February 2010 was for the Head Contractor Model to be implemented in full, and not on a trial basis. This was confirmed with members of the Corporate Executive. The endorsed Decision Paper and meeting minutes do not accurately capture this, and therefore there is no record of the decision to implement the Head Contractor Model in full and not on a trial basis as recommended. Refer to “Lessons Learnt 3.1”.
5. Consistency of record-keeping practices
Due to the extended time period from initial concept planning to implementation, several staff members and consultants were involved in the process and as such a large number of project related documents, plans and reports were created. Several key documents and files were not able to be provided to Internal Audit, due to misplacement or loss. Several files have been marked as “missing” in TRIM (the Department’s electronic document management system), and certain key reports do not appear to have been stored electronically, and associated hardcopies have been misplaced. These include the 2008 internal report on the maintenance operations and the planning documents used to support the procurement process. Refer “Lessons Learnt 4.1”.

© 2012 KPMG, an Australian partnership and a member firm of the KPMG network of independent member firms affiliated with KPMG International Cooperative (“KPMG International”), a Swiss entity. All rights reserved. Printed in Australia The KPMG name, logo and "cutting through complexity" are registered trademarks or trademarks of KPMG International. Liability limited by a scheme approved under Professional Standards Legislation.
23
Recommendations
Presented below is a summary of key lessons learnt for the Department regarding decision-making processes and business cases. In addition, the progress of actions to implement these lessons is also noted.
Lessons Learnt Progress made to date
1.1 Ensure that a formal business case is developed and approved for all strategic projects, to support Project Board members and the Corporate Executive in effective decision-making around the viability and validity of the project.
The Department has since established a Project Management Office and implemented a Project Management Methodology based on PRINCE2.
This methodology includes the requirement to complete a business case, and provides a template for a business case, which includes the different business options; advantages and disadvantages of each option; and cost analysis.
2.1. The rationale for undertaking the project should be documented in the business case. These reasons should be linked to the organisational strategy and objectives to assist with goal congruence, and to ensure that only projects that assist the Department in achieving its goals are approved and resourced.
2.2. The business case should clearly establish the different business options. At a minimum, this should include the “do nothing, do something, and do something more” options.
Each option should be analysed and quantified where possible, and the business case should make a recommendation regarding which option should be accepted.
2.3. The business case should clearly analyse the expected benefits and dis-benefits of each option. These benefits should be relevant and project specific, and should allow comparison between options where possible.
2.4. The business case should include a detailed cost analysis of the preferred option. This analysis should include quantifiable costs and expected savings in order to calculate a Net Present Value (NPV).
The assumptions used in the calculations should be clearly articulated and based on a reasonable projection of costs and savings.
3.1. The Corporate Executive and/or Project Board meetings should accurately capture the details of relevant decisions relating to key strategic projects. Such details may include noting the key discussion points, the full decision, and the key rationale/factors taken into account.
The recording of the final decision should accurately reflect the actual decision made by Corporate Executive/Project Board.
4.1 Ensure all key project documents are stored electronically within TRIM, and hardcopy documents are filed and stored with Information Services and Records Management.

© 2012 KPMG, an Australian partnership and a member firm of the KPMG network of independent member firms affiliated with KPMG International Cooperative (“KPMG International”), a Swiss entity. All rights reserved. Printed in Australia The KPMG name, logo and "cutting through complexity" are registered trademarks or trademarks of KPMG International. Liability limited by a scheme approved under Professional Standards Legislation.
24
3.2 Implementation of the Model
Objective
To consider the actions taken to implement the new arrangements prior to and following 1 July 2010.
Approach
1. Consider the formulation of a project team to implement the Head Contractor Model, including allocation of roles and responsibilities to key project members, including the Project Sponsor.
Consider the adequacy and existence of a project management methodology used for the implementation, including existence of key project documentation such as a project plan, budget; detailed implementation plan and/or activities; and other project initiation documentation.
2. Consider the appropriateness of the approach taken to implement the Head Contractor Model, including the adequacy of the roll-out strategy; the transition arrangements that were in place during the implementation; and the extent of monitoring activities over the implementation, including monitoring progress, scope, time, and budget to baselines.
3. Consider the approach for identifying and handling risks and issues that occurred during the implementation.
Overview of the project implementation stages
The project to implement the Head Contractor Model was completed in three overarching phases (including various stages). This is diagrammatically represented below:
Figure 3: Overview of the project implementation stages
Sub Project 3Commercial Operations
Sub Project 2Data and Reporting
Crisis Management and Stabilisation
Project Close Out
Stage 1 Stage 2 Stage 3
SLA & KPI Enforcement and BAUHandover
Objective 3Budget Reporting and Monitoring
Objective 1Head Contractor‘s Compliance with
KPI’s and SLA’s
Objective 4Measure & reduce overdue jobs
Objective 2Reduce vacant properties by 50%
Aug 2010 Sep 2010 Mar 2011
Sub Project 1Issues and Reporting
Re-ImplementationImplementationInitiation
Feb 2010Mar 2009
© 2012 KPMG, an Australian partnership and a member firm of the KPMG network of independent member firms affiliated with KPMG International Cooperative (“KPMG International”), a Swiss entity. All rights reserved. Printed in Australia The KPMG name, logo and "cutting through complexity" are registered trademarks or trademarks of KPMG International. Liability limited by a scheme approved under Professional Standards Legislation.
25
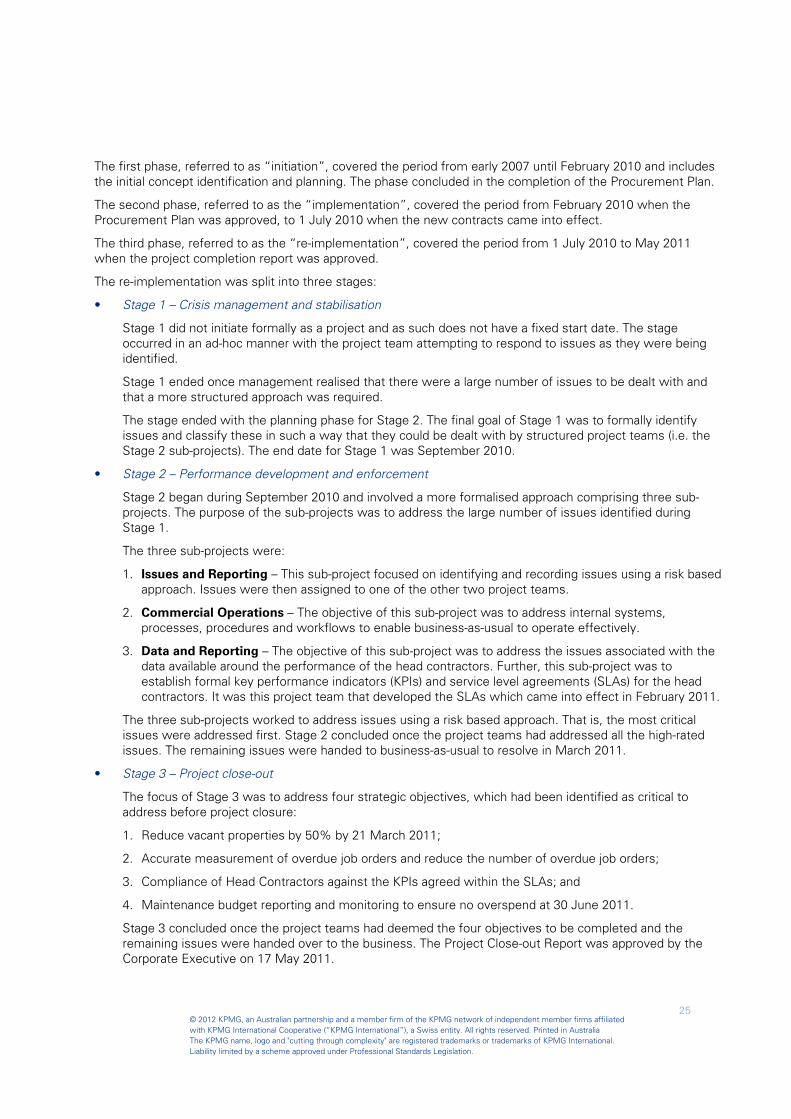
The first phase, referred to as “initiation”, covered the period from early 2007 until February 2010 and includes the initial concept identification and planning. The phase concluded in the completion of the Procurement Plan.
The second phase, referred to as the “implementation”, covered the period from February 2010 when the Procurement Plan was approved, to 1 July 2010 when the new contracts came into effect.
The third phase, referred to as the “re-implementation”, covered the period from 1 July 2010 to May 2011 when the project completion report was approved.
The re-implementation was split into three stages:
• Stage 1 – Crisis management and stabilisation
Stage 1 did not initiate formally as a project and as such does not have a fixed start date. The stage occurred in an ad-hoc manner with the project team attempting to respond to issues as they were being identified.
Stage 1 ended once management realised that there were a large number of issues to be dealt with and that a more structured approach was required.
The stage ended with the planning phase for Stage 2. The final goal of Stage 1 was to formally identify issues and classify these in such a way that they could be dealt with by structured project teams (i.e. the Stage 2 sub-projects). The end date for Stage 1 was September 2010.
• Stage 2 – Performance development and enforcement
Stage 2 began during September 2010 and involved a more formalised approach comprising three sub-projects. The purpose of the sub-projects was to address the large number of issues identified during Stage 1.
The three sub-projects were:
1. Issues and Reporting – This sub-project focused on identifying and recording issues using a risk based approach. Issues were then assigned to one of the other two project teams.
2. Commercial Operations – The objective of this sub-project was to address internal systems, processes, procedures and workflows to enable business-as-usual to operate effectively.
3. Data and Reporting – The objective of this sub-project was to address the issues associated with the data available around the performance of the head contractors. Further, this sub-project was to establish formal key performance indicators (KPIs) and service level agreements (SLAs) for the head contractors. It was this project team that developed the SLAs which came into effect in February 2011.
The three sub-projects worked to address issues using a risk based approach. That is, the most critical issues were addressed first. Stage 2 concluded once the project teams had addressed all the high-rated issues. The remaining issues were handed to business-as-usual to resolve in March 2011.
• Stage 3 – Project close-out
The focus of Stage 3 was to address four strategic objectives, which had been identified as critical to address before project closure:
1. Reduce vacant properties by 50% by 21 March 2011;
2. Accurate measurement of overdue job orders and reduce the number of overdue job orders;
3. Compliance of Head Contractors against the KPIs agreed within the SLAs; and
4. Maintenance budget reporting and monitoring to ensure no overspend at 30 June 2011.
Stage 3 concluded once the project teams had deemed the four objectives to be completed and the remaining issues were handed over to the business. The Project Close-out Report was approved by the Corporate Executive on 17 May 2011.

© 2012 KPMG, an Australian partnership and a member firm of the KPMG network of independent member firms affiliated with KPMG International Cooperative (“KPMG International”), a Swiss entity. All rights reserved. Printed in Australia The KPMG name, logo and "cutting through complexity" are registered trademarks or trademarks of KPMG International. Liability limited by a scheme approved under Professional Standards Legislation.
26
Observations
1. Formulation of the project, project team and project management methodology Senior management advised Internal Audit that the new model was a significant change to the way in which the Department does business. A change of that nature warrants treatment as a formal, adequately resourced project. In this case, the change was structured as a business-as-usual procurement process rather than a project. The maintenance operations team viewed the implementation as a new form of contracting which required a procurement process to implement. We have noted a number of breakdowns in implementation of the model which may have been avoided and/or addressed at an earlier stage had the change been treated as a project; and consistently sponsored and managed in a manner reflecting its nature. Refer to “Lessons Learnt 5.1”. With treatment as a business-as-usual procurement process, we noted: • No formal project methodology was followed and no formal project documentation was compiled. At
the time, the Department did not have a standard project methodology in place and varied disciplines were applied by business units. In this case, a more disciplined approach should have triggered a formal business case request and review process; and documented decision making and recordkeeping protocols.
• The transition was not well implemented. A more disciplined approach would also have triggered specific consideration of the change management, planning and risk management aspects noted below.
• There was no clear, consistent executive sponsorship throughout the initiation and implementation. Such sponsorship implicitly fell under the mandate of the General Manager Service Delivery. However, due to occupancy changes in that role, the first implementation (including contract award and operational commencement) was overseen by an acting General Manager (following initiation by the substantive General Manager). The acting General Manager advised Internal Audit that he viewed his role as overseeing the tender process and selection of contractors, from a procurement and probity perspective. However given the significance of the change, this stage of the project should have received significant executive level oversight to monitor progress and risks and to ensure transition readiness. Adopting a formal project methodology would also have assisted with clarifying the role of Sponsor and ensuring it was adequately fulfilled.
2. Implementation approach, roll-out strategy and monitoring the implementation
The first implementation followed the Department’s standard procurement process, which broadly includes the following steps:
1. Create the Procurement Plan 2. Issue the Request for Tender 3. Evaluate tenders and select preferred vendors 4. Negotiate and sign contracts 5. Contract start date
There was limited consideration of implementation planning or developing a roll-out strategy for the first implementation. The Procurement Plan was the primary planning document that was used and it did not detail the steps involved to move from a direct contracting model of 700 contractors to a head contractor model of three contractors. The lack of change management and implementation planning may have lead to the following issues: • There was limited consideration of the impact the change would have on existing business processes
and work practices at a regional and head office level. Refer to “Lessons Learnt 6.1”. • There was limited consideration of the system compatibility between the Department and the head
contractors. The first implementation did not sufficiently take into account whether the Department’s Caretaker system and the head contractors’ systems would interface correctly to enable job orders to be processed efficiently. This proved to be a significant challenge once the contracts were initiated, as the issuing and completion of job orders were not being accurately processed across the systems. In addition, this influenced what performance management processes the Department could implement, as they were receiving limited performance data from the systems.
© 2012 KPMG, an Australian partnership and a member firm of the KPMG network of independent member firms affiliated with KPMG International Cooperative (“KPMG International”), a Swiss entity. All rights reserved. Printed in Australia The KPMG name, logo and "cutting through complexity" are registered trademarks or trademarks of KPMG International. Liability limited by a scheme approved under Professional Standards Legislation.
27
• There was no formal communication plan prepared during the first implementation to efficiently engage all stakeholders (including the previous contractors and the Department’s regional staff members). Internal Audit noted limited training and communication was provided to operational staff, especially at a regional level, about the planned change in contracting model and the anticipated impact this would have on staff and contractors.
Management noted market resistance was a significant impediment to implementation.
However, we note that during the re-implementation, regional stakeholder engagement was a key focus area and significant effort was expended to inform and train the regional staff. This included regional road shows, workshops and the compilation of a Regional Officer’s Handbook.
As described on page 25, the re-implementation followed a more structured approach to implementation. This was assisted by the use of a formally approved project management methodology, and included
• Creating Project Management Plans for each of the stages of the re-implementation;
• Developing a Communication Strategy;
• Weekly Project Highlight Reports, which monitored the progress of each of the stages; and
• Regular reporting to the Corporate Executive.
For the re-implementation, the Department engaged several consultants to assist in the project management, including a Program Director and Project Managers for the different stages. These consultants were responsible for overseeing the project teams and preparing the required project plans and reports.
Internal Audit noted that during the re-implementation, the project teams prepared several documents that the operational business-as-usual staff would be required to use to manage the contracts including the key performance indicators and service level agreements; a Contract Management Plan and a Quality Management Plan for the management and administration of the contracts. However, we noted there was limited involvement from the Department’s business-as-usual staff in developing these documents, which may have led to a lack of buy-in from the staff. For example, the Department’s current contract management team were not aware that the Contract Management and Quality Management Plans had been created, and were in the process of developing their own versions. Refer to “Lessons Learnt 7.1”.
Internal Audit also noted inconsistencies in the handover of key documents and project related knowledge between the project teams and the business-as-usual staff. This was exacerbated by the fact that many of the project managers were consultants who left the Department after the project. Refer to “Lessons Learnt 7.2”.
3. Risk management during project implementation
A risk assessment was included in the original Procurement Plan. These risks were identified as risks to the successful procurement of head contractors, rather than the successful implementation of the head contractor model.
A risk workshop facilitated by RiskCover was held in May 2010 to identify risks relevant to the introduction of the new contracts. Internal Audit was advised that this risk assessment process was brief, and we noted that the process was not as comprehensive as would be expected for a project of this complexity, nature and scale. We also noted a lack of assignment of risk owners; responsibilities; and limited descriptions of mitigating controls within the risk register. We note our scope did not include discussions with RiskCover and/or detailed exploration of the reasons for this.
Further, Internal Audit noted that there was limited follow-up by the Department of actions taken to monitor the risks as well as the implementation of the mitigating strategies.
A second risk workshop was held in September 2010 during the re-implementation phase. The purpose of this workshop was to re-consider the risks identified in the original risk workshop. However, there was no ongoing monitoring of risks and limited reporting of key risks to the Project Board and Corporate Executive. Risks were also included in the Project Management Plans for Stage 2 and 3 of the re-implementation.
The above mentioned observations may all be a result of the lack of consistent application of an overarching risk management approach for the implementation and re-implementation. Refer to “Lessons Learnt 8.1”.

© 2012 KPMG, an Australian partnership and a member firm of the KPMG network of independent member firms affiliated with KPMG International Cooperative (“KPMG International”), a Swiss entity. All rights reserved. Printed in Australia The KPMG name, logo and "cutting through complexity" are registered trademarks or trademarks of KPMG International. Liability limited by a scheme approved under Professional Standards Legislation.
28
Recommendations
Presented below is a summary of key lessons learnt for the Department regarding decision-making processes and business cases. In addition, the progress of actions to implement these lessons is also noted.
Lessons Learnt Progress made to date
5.1. Critically consider whether a change to existing business process be handled as a project. If it is run as a project, ensure a standard project methodology is adopted which requires the necessary project planning documentation.
The Department has since implemented a formal Project Management Methodology which is based on the principles of PRINCE2.
This methodology includes the requirement to produce project initiation documentation such as project plans; communication plans; implementation plans and documents the role of the project sponsor.
It was also noted that during the re-implementation, a version of this methodology was applied, and Project Management Plans was created for each stage.
6.1. Impact assessments should be performed as part of the project planning process. This would include determining the likely impact that business change would have on processes and systems.
Further, an impact assessment could assist with identifying relevant stakeholders impacted by the project, and developing strategies to adequately engage them in the change process.
To address the system compatibility issue, the Department now makes use of the internally developed Housing Management System Electronic Data Interface (HMS-EDI), which provides an interface between the Caretaker system and the head contractors’ systems.
During the re-implementation, regional stakeholder engagement was a key focus area and significant effort was expended to inform and train the regional staff.
This included regional road shows, workshops and the compilation of a Regional Officer’s Handbook.
7.1. Ensure adequate representation of operational staff on project teams, to facilitate buy-in to project deliverables and outcomes.
The Department has since implemented a formal Project Management Methodology which is based on the principles of PRINCE2.
In a PRINCE2 project, the Senior User is responsible for representing the needs of the business and should ensure the project outcomes are suitable to the requirements of the business.
7.2. A formal handover should occur at each change in key project roles, such as the project sponsor or project manager. In addition, there should be adequate handovers between the project teams and the operational staff.
8.1. Each project should follow an overarching risk management approach which should outline:
• The risk methodology adopted (e.g. risk classification and ratings);
• When and how the risk assessment will take place;
• The documenting of risks within the risk register and how the risk register will be continuously updated and monitored;
• How mitigation strategies will be monitored for implementation; and
• The assignment of risk owners and overall responsibility for risk management in the project.
The project risk management strategy should ideally be aligned to the Department’s risk management strategy to ensure risk classification is consistent across projects.
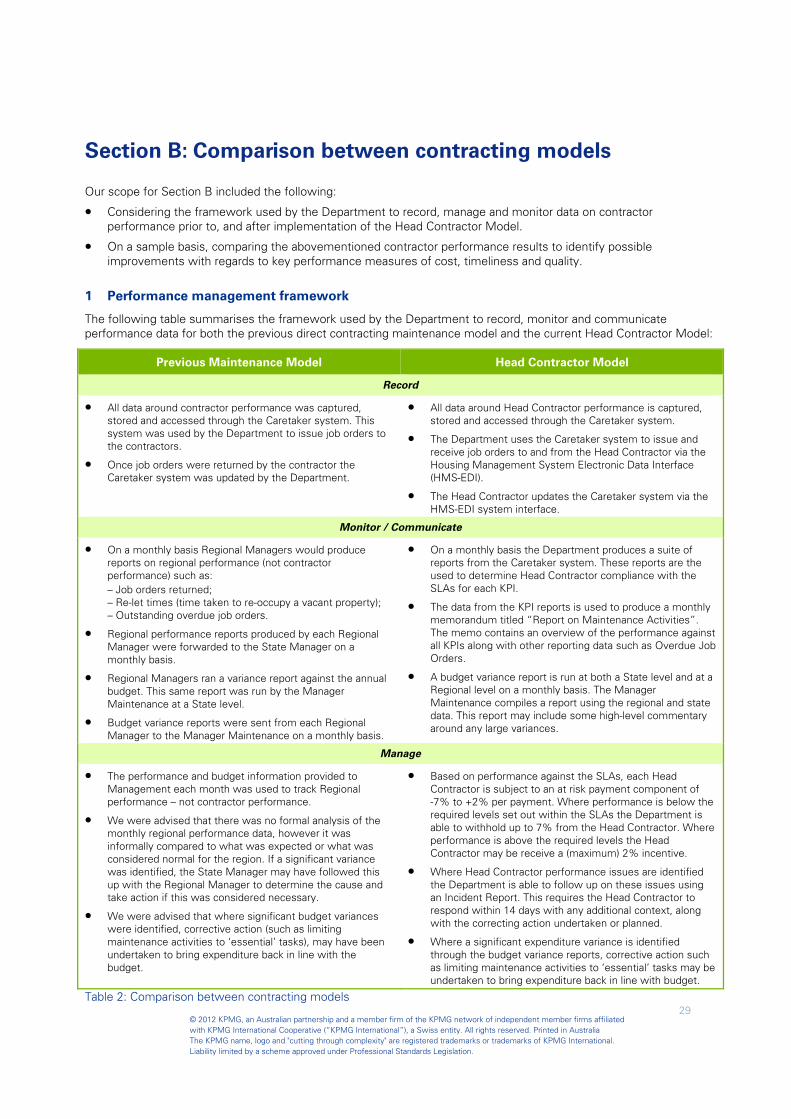
© 2012 KPMG, an Australian partnership and a member firm of the KPMG network of independent member firms affiliated with KPMG International Cooperative (“KPMG International”), a Swiss entity. All rights reserved. Printed in Australia The KPMG name, logo and "cutting through complexity" are registered trademarks or trademarks of KPMG International. Liability limited by a scheme approved under Professional Standards Legislation.
29
Section B: Comparison between contracting models
Our scope for Section B included the following:
• Considering the framework used by the Department to record, manage and monitor data on contractor performance prior to, and after implementation of the Head Contractor Model.
• On a sample basis, comparing the abovementioned contractor performance results to identify possible improvements with regards to key performance measures of cost, timeliness and quality.
1 Performance management framework
The following table summarises the framework used by the Department to record, monitor and communicate performance data for both the previous direct contracting maintenance model and the current Head Contractor Model:
Previous Maintenance Model Head Contractor Model
Record
• All data around contractor performance was captured, stored and accessed through the Caretaker system. This system was used by the Department to issue job orders to the contractors.
• Once job orders were returned by the contractor the Caretaker system was updated by the Department.
• All data around Head Contractor performance is captured, stored and accessed through the Caretaker system.
• The Department uses the Caretaker system to issue and receive job orders to and from the Head Contractor via the Housing Management System Electronic Data Interface (HMS-EDI).
• The Head Contractor updates the Caretaker system via the HMS-EDI system interface.
Monitor / Communicate
• On a monthly basis Regional Managers would produce reports on regional performance (not contractor performance) such as: – Job orders returned; – Re-let times (time taken to re-occupy a vacant property); – Outstanding overdue job orders.
• Regional performance reports produced by each Regional Manager were forwarded to the State Manager on a monthly basis.
• Regional Managers ran a variance report against the annual budget. This same report was run by the Manager Maintenance at a State level.
• Budget variance reports were sent from each Regional Manager to the Manager Maintenance on a monthly basis.
• On a monthly basis the Department produces a suite of reports from the Caretaker system. These reports are the used to determine Head Contractor compliance with the SLAs for each KPI.
• The data from the KPI reports is used to produce a monthly memorandum titled “Report on Maintenance Activities”. The memo contains an overview of the performance against all KPIs along with other reporting data such as Overdue Job Orders.
• A budget variance report is run at both a State level and at a Regional level on a monthly basis. The Manager Maintenance compiles a report using the regional and state data. This report may include some high-level commentary around any large variances.
Manage
• The performance and budget information provided to Management each month was used to track Regional performance – not contractor performance.
• We were advised that there was no formal analysis of the monthly regional performance data, however it was informally compared to what was expected or what was considered normal for the region. If a significant variance was identified, the State Manager may have followed this up with the Regional Manager to determine the cause and take action if this was considered necessary.
• We were advised that where significant budget variances were identified, corrective action (such as limiting maintenance activities to ‘essential’ tasks), may have been undertaken to bring expenditure back in line with the budget.
• Based on performance against the SLAs, each Head Contractor is subject to an at risk payment component of -7% to +2% per payment. Where performance is below the required levels set out within the SLAs the Department is able to withhold up to 7% from the Head Contractor. Where performance is above the required levels the Head Contractor may be receive a (maximum) 2% incentive.
• Where Head Contractor performance issues are identified the Department is able to follow up on these issues using an Incident Report. This requires the Head Contractor to respond within 14 days with any additional context, along with the correcting action undertaken or planned.
• Where a significant expenditure variance is identified through the budget variance reports, corrective action such as limiting maintenance activities to ‘essential’ tasks may be undertaken to bring expenditure back in line with budget.
Table 2: Comparison between contracting models
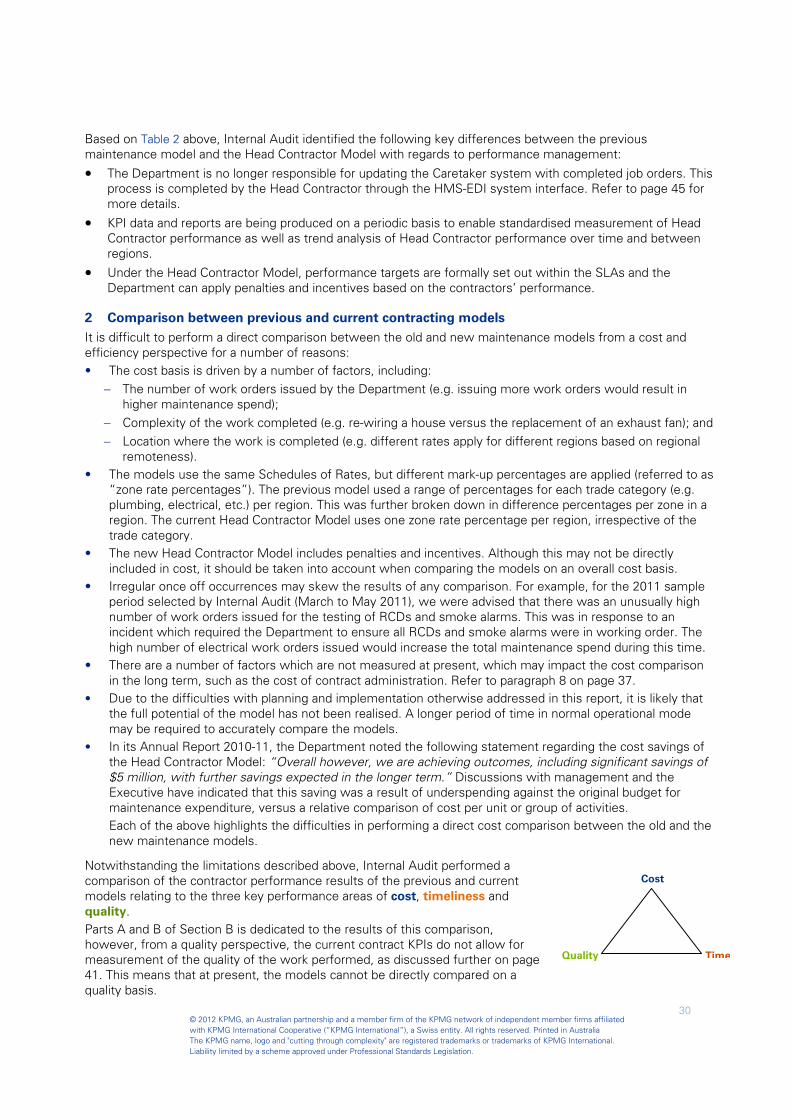
© 2012 KPMG, an Australian partnership and a member firm of the KPMG network of independent member firms affiliated with KPMG International Cooperative (“KPMG International”), a Swiss entity. All rights reserved. Printed in Australia The KPMG name, logo and "cutting through complexity" are registered trademarks or trademarks of KPMG International. Liability limited by a scheme approved under Professional Standards Legislation.
30
Time
Cost
Quality
Based on Table 2 above, Internal Audit identified the following key differences between the previous maintenance model and the Head Contractor Model with regards to performance management:
• The Department is no longer responsible for updating the Caretaker system with completed job orders. This process is completed by the Head Contractor through the HMS-EDI system interface. Refer to page 45 for more details.
• KPI data and reports are being produced on a periodic basis to enable standardised measurement of Head Contractor performance as well as trend analysis of Head Contractor performance over time and between regions.
• Under the Head Contractor Model, performance targets are formally set out within the SLAs and the Department can apply penalties and incentives based on the contractors’ performance.
2 Comparison between previous and current contracting models It is difficult to perform a direct comparison between the old and new maintenance models from a cost and efficiency perspective for a number of reasons: • The cost basis is driven by a number of factors, including:
− The number of work orders issued by the Department (e.g. issuing more work orders would result in higher maintenance spend);
− Complexity of the work completed (e.g. re-wiring a house versus the replacement of an exhaust fan); and − Location where the work is completed (e.g. different rates apply for different regions based on regional
remoteness). • The models use the same Schedules of Rates, but different mark-up percentages are applied (referred to as
“zone rate percentages”). The previous model used a range of percentages for each trade category (e.g. plumbing, electrical, etc.) per region. This was further broken down in difference percentages per zone in a region. The current Head Contractor Model uses one zone rate percentage per region, irrespective of the trade category.
• The new Head Contractor Model includes penalties and incentives. Although this may not be directly included in cost, it should be taken into account when comparing the models on an overall cost basis.
• Irregular once off occurrences may skew the results of any comparison. For example, for the 2011 sample period selected by Internal Audit (March to May 2011), we were advised that there was an unusually high number of work orders issued for the testing of RCDs and smoke alarms. This was in response to an incident which required the Department to ensure all RCDs and smoke alarms were in working order. The high number of electrical work orders issued would increase the total maintenance spend during this time.
• There are a number of factors which are not measured at present, which may impact the cost comparison in the long term, such as the cost of contract administration. Refer to paragraph 8 on page 37.
• Due to the difficulties with planning and implementation otherwise addressed in this report, it is likely that the full potential of the model has not been realised. A longer period of time in normal operational mode may be required to accurately compare the models.
• In its Annual Report 2010-11, the Department noted the following statement regarding the cost savings of the Head Contractor Model: “Overall however, we are achieving outcomes, including significant savings of $5 million, with further savings expected in the longer term.” Discussions with management and the Executive have indicated that this saving was a result of underspending against the original budget for maintenance expenditure, versus a relative comparison of cost per unit or group of activities. Each of the above highlights the difficulties in performing a direct cost comparison between the old and the new maintenance models.
Notwithstanding the limitations described above, Internal Audit performed a comparison of the contractor performance results of the previous and current models relating to the three key performance areas of cost, timeliness and quality. Parts A and B of Section B is dedicated to the results of this comparison, however, from a quality perspective, the current contract KPIs do not allow for measurement of the quality of the work performed, as discussed further on page 41. This means that at present, the models cannot be directly compared on a quality basis.

© 2012 KPMG, an Australian partnership and a member firm of the KPMG network of independent member firms affiliated with KPMG International Cooperative (“KPMG International”), a Swiss entity. All rights reserved. Printed in Australia The KPMG name, logo and "cutting through complexity" are registered trademarks or trademarks of KPMG International. Liability limited by a scheme approved under Professional Standards Legislation.
31
Part A: Comparison based on cost
3 Comparison between Schedules of Rates
Whilst noting the difficulties and limitations associated with a cost comparison as described on the previous page, Internal Audit compared the zone rate percentages applied to the Schedule of Rates under the previous and current model, and applied these to a sample of maintenance expenditure in order to quantify the difference.
4 Overall comparison between Schedules of Rates
Both contracting models use the same Schedules of Rates, but different mark-up percentages are applied (referred to as “zone rate percentages”). The previous model used a range of percentages for each trade category (e.g. plumbing, electrical, etc.) per region. This was further broken down in difference percentages per zone in a region. The current Head Contractor Model uses one zone rate percentage per region, irrespective of the trade category.
Table 3 below provides an overview of the zone rate percentages between 2009 and 2011. Please note the zone rate percentage for 2009 has been averaged across the trade categories for comparison purposes.
Overall, Table 3 indicates that the mark-up percentage in the Head Contractor Model is higher in the Kimberley, Pilbara and Goldfields region, but lower in the three Metropolitan regions and Geraldton/Midwest region.
In order to quantify the differences in percentage in dollar values, Internal Audit selected a sample of maintenance expenditure, sourced from Caretaker, for a three month period in 2009 and 2011. The three month period selected was 1 March to 31 May for both 2009 and 2011.
Internal Audit obtained the total maintenance spend for each trade category (e.g. plumbing, electrical) in the 2011 sample period, and removed the 2011 zone rate percentage in order to calculate a baseline maintenance spend. We then applied the 2009 zone rate percentages to this baseline, in order to facilitate a comparison between 2009 and 2011.
We note that the Consumer Price Index (CPI) was measured at between 2.8% and 1.8% during the period March 2009 and May 2011 (source: Reserve Bank of Australia).
Zone rate percentage
2009 (%)
Zone rate percentage
2011 (%)A Kimberley 187.85 225.00
B Wheatbelt 151.15 157.00
1 Metropolitan North 103.05 98.60
2 Metropolitan South 109.38 95.00
3 Metropolitan South East 104.08 98.40
4 Albany (Southern) 157.88 154.50
5 Bunbury (South West) 132.33 140.22
6 Kalgoorlie Goldfields 159.84 168.00
7 Geraldton (Midwest) 161.39 139.20
8 Pilbara 197.96 230.30
Region
Table 3: Comparison between zone rate percentages

© 2012 KPMG, an Australian partnership and a member firm of the KPMG network of independent member firms affiliated with KPMG International Cooperative (“KPMG International”), a Swiss entity. All rights reserved. Printed in Australia The KPMG name, logo and "cutting through complexity" are registered trademarks or trademarks of KPMG International. Liability limited by a scheme approved under Professional Standards Legislation.
32
The results are presented in Table 4 below in a summarised format; refer to Appendix 3 for a full table of calculations. Figure 4 presents the result by maintenance trade category, whilst Figure 5 presents the results by region.
Figure 4: Zone rate percentages applied to maintenance spend by trade category
Baseline maintenance
spend ($) Maintenance
spend in 2009 ($) Maintenance
spend in 2011 ($) (excluding zone rate
percentage) (including zone rate
percentage) (including zone rate
percentage)
Carpentry 1,502,247.77 3,451,118.27 3,297,797.00 (153,321.27)
Cleaning 108,915.29 237,515.80 239,043.00 1,527.20
Electrical 813,163.98 1,782,355.37 1,828,730.00 46,374.63
Fencing 140,015.36 337,315.82 309,227.00 (28,088.82)
Floor covering 21,336.31 45,899.40 44,305.00 (1,594.40)
Gas 654,535.26 1,337,457.30 1,396,748.00 59,290.70
Glazing 102,085.87 279,780.22 240,415.00 (39,365.22)
Painting 32,910.51 78,580.24 75,486.00 (3,094.24)
Pest control 144,105.23 288,272.56 334,481.00 46,208.44
Plumbing 1,095,873.01 2,317,538.55 2,446,185.00 128,646.45
Tree management 343,268.62 763,069.85 756,097.00 (6,972.85)
Reticulation 87,210.53 195,223.79 180,352.00 (14,871.79)
Total 5,045,667.74 11,114,127.17 11,148,866.00 34,738.83
% change 0.31%
Maintenance Trade Category
Difference in total spend between
2009 and 2011 ($)
Table 4: Application of zone rate percentages to maintenance spend per trade category
-
500,000.00
1,000,000.00
1,500,000.00
2,000,000.00
2,500,000.00
3,000,000.00
3,500,000.00
4,000,000.00
Comparison of zone rate percentages applied to maintenance spend, per trade category
Maintenance spend in 2009 ($) Maintenance spend in 2011 ($)

© 2012 KPMG, an Australian partnership and a member firm of the KPMG network of independent member firms affiliated with KPMG International Cooperative (“KPMG International”), a Swiss entity. All rights reserved. Printed in Australia The KPMG name, logo and "cutting through complexity" are registered trademarks or trademarks of KPMG International. Liability limited by a scheme approved under Professional Standards Legislation.
33
-
500,000.00
1,000,000.00
1,500,000.00
2,000,000.00
2,500,000.00
3,000,000.00 Comparison of zone rate percentages applied to maintenance spend, per region
Maintenance spend in 2009 ($) Maintenance spend in 2011 ($)
Figure 5: Zone rate percentages applied to maintenance spend by region
To further assist in comparing the data, the average maintenance spend per work order for 2009 and 2011 was calculated, by dividing the total maintenance spend calculated in Table 4 by the total number of work orders for the period. The results are presented in Table 5 and Figure 6 below.
Table 5: Difference in average maintenance spend per work order between 2009 and 2011
Baseline maintenance
spend ($) Maintenance
spend in 2009 ($) Maintenance
spend in 2011 ($)
(excluding zone rate percentage)
(including zone rate percentage)
(including zone rate percentage)
Metropolitan North 1,379,388.22 2,724,684.05 15,025 181.34 2,739,465.00 16,379 167.25 (14.09)
Metropolitan South 951,781.54 1,989,885.67 11,045 180.16 1,855,974.00 10,737 172.86 (7.30)
Metropolitan South East 1,268,375.50 2,551,322.96 11,396 223.88 2,516,457.00 13,931 180.64 (43.24)
Geraldton (Midwest) 306,498.33 790,170.23 4,360 181.23 733,144.00 4,597 159.48 (21.75)
Albany (Southern) 111,623.97 281,445.61 2,195 128.22 284,083.00 1,933 146.96 18.74
Bunbury (South West) 245,046.21 563,704.24 3,846 146.57 588,650.00 4,081 144.24 (2.33)
Wheatbelt 107,150.19 273,592.27 3,022 90.53 275,376.00 2,870 95.95 5.42
Kalgoorlie Goldfields 105,079.85 274,746.04 3,208 85.64 281,614.00 2,573 109.45 23.81
Kimberley 207,512.31 579,226.49 5,155 112.36 674,415.00 5,106 132.08 19.72
Pilbara 363,211.63 1,085,349.60 4,776 227.25 1,199,688.00 4,474 268.15 40.90
Total 5,045,667.74 11,114,127.17 64,028 173.58 11,148,866.00 66,681 167.20 (6.39)
% change -4%
Difference in average work order between 2009 and 2011 ($)
RegionNumber of work orders
2009
Average per work order
2009 ($)
Number of work orders
2011
Average per work order
2011 ($)

© 2012 KPMG, an Australian partnership and a member firm of the KPMG network of independent member firms affiliated with KPMG International Cooperative (“KPMG International”), a Swiss entity. All rights reserved. Printed in Australia The KPMG name, logo and "cutting through complexity" are registered trademarks or trademarks of KPMG International. Liability limited by a scheme approved under Professional Standards Legislation.
34
Figure 6: Comparison of average spend per work order between 2009 and 2011
-
50.00
100.00
150.00
200.00
250.00
300.00
Comparison of average spend per work order between 2009 and 2011
Average per work order 2009 ($) Average per work order 2011 ($)

© 2012 KPMG, an Australian partnership and a member firm of the KPMG network of independent member firms affiliated with KPMG International Cooperative (“KPMG International”), a Swiss entity. All rights reserved. Printed in Australia The KPMG name, logo and "cutting through complexity" are registered trademarks or trademarks of KPMG International. Liability limited by a scheme approved under Professional Standards Legislation.
35
Part B: Comparison based on timeliness
The main method by which the Department measures the timeliness of work completed is through the Key Performance Indicators (KPI) contained in the Service Level Agreement (SLA). In order to compare the models based on timeliness, Internal Audit considered the contractor performance results against the KPIs.
5 Key Performance Indicator (KPI) overview
Table 6 below identifies the KPIs currently in place for the Head Contractor Model. Each KPI has a service level that has been agreed with the Head Contractor through a Service Level Agreement.
No. KPI Service Level KPI Target Compliance
Requirement Effective
Compliance Requirement2
001 Timeliness of completion of Emergency Works
Normal Hours Monday to Friday 7:30am to 4:00pm
Within 3 hours for Perth metropolitan areas
Within 4 hours for WA non-metropolitan areas
To complete or make safe 100% of Emergency Job Orders issued within the required timeframe
95% 95%
002 Timeliness of completion of Emergency Works
After Hours Monday to Friday 4:01 pm to 7:29 am and all day Saturday, Sunday and Public Holidays
Within 3 hours for Perth metropolitan areas
Within 4 hours for WA non-metropolitan areas
To complete or make safe 100% of Emergency Job Orders issued within the required timeframe
95% 95%
003(a) Timeliness of completion of Priority Works
Monday to Thursday 8:00 am to 5:00 pm
Within 48 elapsed hours on Business Days (excluding Public Holidays)
To complete 80% of Priority Job Orders issued within the required timeframe
95% 76%
003(b) Timeliness of completion of Priority Works
Friday 8:00am to 4:00pm
Completed by 5:00pm the next Saturday (where Saturday is a Public Holiday, the Job Order is to be completed by 5:00pm the following business day
To complete 80% of Priority Job Orders issued within the required timeframe
95% 76%
004 Timeliness of completion of Routine Works
Within 14 calendar days (including Saturday, Sunday and Public Holidays)
To complete 80% of Routine Job Orders issued within the required timeframe
95% 76%
005 Timeliness of completion of Major Works
Within 28 calendar days (including Saturday, Sunday and Public Holidays)
To complete 80% of Major Job Orders issued within the required timeframe
95% 76%
006 Timeliness of completion of Vacant premises
By the agreed date and time of Job Order
To complete 80% of Vacant Premises Job Orders issued within the required timeframe
95% 76%
007 Timeliness of submission of Invoices
Within 14 calendar days To submit 80% of Invoices for Job Orders issued within the required timeframe
95% 76%
008 Timeliness of submission of Quality Assurance Reports
Within 14 calendar days To submit Quality Assurance reports on up to 10% of random Job Orders the Department has selected for checking.
100% 100%
Table 6: Key Performance Indicators under the Head Contractor Model
2 Effective Compliance Requirement is determined by multiplying the KPI Target with the Compliance Requirement

© 2012 KPMG, an Australian partnership and a member firm of the KPMG network of independent member firms affiliated with KPMG International Cooperative (“KPMG International”), a Swiss entity. All rights reserved. Printed in Australia The KPMG name, logo and "cutting through complexity" are registered trademarks or trademarks of KPMG International. Liability limited by a scheme approved under Professional Standards Legislation.
36
6 Overview of datasets used for KPI comparison
Internal Audit selected a three month dataset from 2009 and 2011 in order to compare the performance of the previous model (2009) and the Head Contractor Model (2011). The three month period selected was 1 March to 31 May for both 2009 and 2011.
The total value of each of the datasets has been reflected in Figure 7. The datasets are comprised of 64,028 and 66,681 job orders for 2009 and 2011 respectively. Figure 8 shows the similarity in the split within each dataset between the 10 regions. The data was taken directly from Caretaker.
The similarities in dollar value, number of job orders and regional spread between the two datasets, has enabled Internal Audit to make reasonable comparisons between the performances of the two maintenance models by applying the current KPI measures to both datasets.
Figure 9: Comparison of breakdown of number of records across metro and non-metro regions between 2009 and 2011 datasets
Figure 10: Comparison of breakdown of dollar value of records across metro and non-metro regions between 2009 and 2011 datasets
37,466 - 59%
26,562 - 41%
Number of Records - Metro / Non-Metro 2009
Metro 2009
Non-Metro 2009
41,047 - 62%
25,634 - 38%
Number of Records - Metro / Non-Metro 2011
Metro 2011
Non-Metro 2011
$9,350,727 -39%
$14,718,946 -61%
Dollar Value of Records - Metro / Non-Metro 2009
Metro 2009
Non-Metro 2009
$14,186,345 - 51%
$13,717,121 - 49%
Dollar Value of Records - Metro / Non-Metro 2011
Metro 2011
Non-Metro 2011
Figure 7: Comparison of 2009 and 2011 datasets, by dollar value
5%8%
17%
24%
18%
7%
7%
3%
6%5%
No. of Records 2009
4%8%
16%
24%21%
7%
7%
3%6%
4%
No. of Records 2011
GOLDFIELDS
KIMBERLEY
METRO FREMANTLE
METRO NORTH
METRO SOUTHEAST
MID WEST / GASCOYNE
PILBARA
SOUTHERN
SOUTHWEST
WHEATBELT
Figure 8: Comparison of number of records by region as a percentage of the total dataset between 2009 and 2011
$24,069.67
$27,903.47
2009 Dataset
2011 Dataset
Total Dollar Value of 2009 and 2011 Datasets ($,000)

© 2012 KPMG, an Australian partnership and a member firm of the KPMG network of independent member firms affiliated with KPMG International Cooperative (“KPMG International”), a Swiss entity. All rights reserved. Printed in Australia The KPMG name, logo and "cutting through complexity" are registered trademarks or trademarks of KPMG International. Liability limited by a scheme approved under Professional Standards Legislation.
37
7 Key Performance Indicator (“KPI”) data comparison
Internal Audit used the KPIs currently in place as the basis of comparison between the previous model and the Head Contractor Model based on timeliness. This was possible as a result of:
• The data used to measure the current KPIs is recorded in the Caretaker system for both maintenance models. That is, Internal Audit used the same data fields from Caretaker for both datasets; and
• The similarities in dollar value, number of job orders and regional spread, as depicted in Figure 7 and Figure 8 above.
However, KPI006, KPI007 and KPI008 are new to the Head Contractor Model and as such require data that was not captured during the previous model. As a result the data analysis over the following pages does not include KPI006, KPI007 and KPI008.
Figure 11 overleaf summarises the results of the data analysis using both datasets. Based on Figure 11 there appears to be an overall decrease in the level of compliance from 2009 to 2011. The percentage change column shows an average decrease in compliance of 18.3%. Internal Audit also observed that from the 2011 dataset the KPI005 score is the only KPI that has remained relatively constant and exceeds the effective compliance requirement.
Figure 12 overleaf provides a comparison of the KPI score compliance percentage between the 2009 and 2011 datasets.
8 Interpretation of the KPI data
Whilst the two datasets selected were comparable in terms of dollar value, number of job orders and regional spread (as depicted in Figure 8, Figure 9 and Figure 10 above), the following items need to be taken into consideration when interpreting the data:
• It was generally accepted that the previous maintenance model promoted quick and timely response to job orders, due to the direct contracting method. This was taken into account when developing the KPIs for the Head Contractor Model, and the majority of the KPIs are focused on timeliness, in order to ensure a timely response level was maintained.
However, the limited implementation planning did not identify strategies to overcome the inherent nature of a head contractor model (i.e. where there is a three-way relationship instead of two (the Department, the head contractor and the subcontractor)), therefore it may take more time for the response levels to be at the same level as previously reported. This may have influenced the performance results shown in Figure 11.
• Timely response levels are not the only advantage of a head contracting model. When deciding to implement the model, the Department considered other factors such as improved contractor accountability; introduction of enhanced performance drivers (via incentives and penalties); improved quality of workmanship through consistency of standards; reduced administration processes; shifting from reactive to planned maintenance and improved ability to resolve issues and disputes. At present, the current performance management framework does not allow reliable comparison in these areas.
• During the initial application of the KPIs, the Department and the head contractors were still coming to terms with the new system interfaces and associated performance measurement processes. As such, there may have been underlying issues in data collection and system interface which may affect the overall performance results.
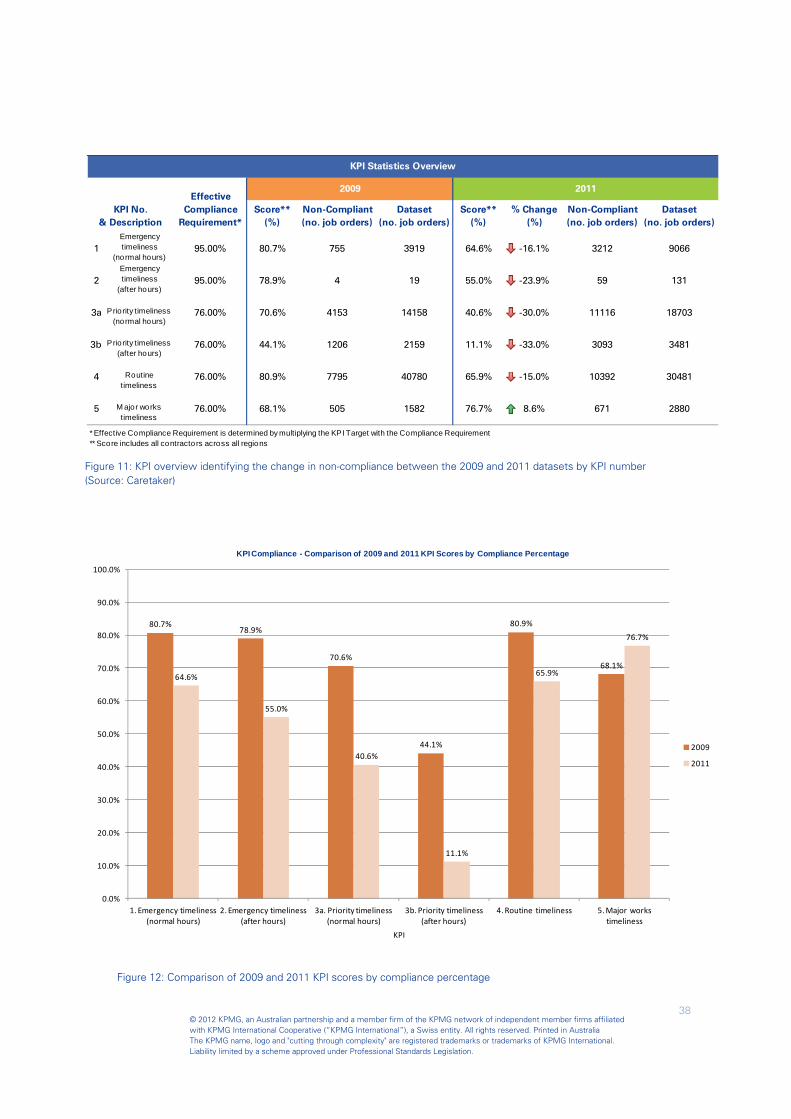
© 2012 KPMG, an Australian partnership and a member firm of the KPMG network of independent member firms affiliated with KPMG International Cooperative (“KPMG International”), a Swiss entity. All rights reserved. Printed in Australia The KPMG name, logo and "cutting through complexity" are registered trademarks or trademarks of KPMG International. Liability limited by a scheme approved under Professional Standards Legislation.
38
Figure 11: KPI overview identifying the change in non-compliance between the 2009 and 2011 datasets by KPI number (Source: Caretaker)
Score**(%)
Non-Compliant(no. job orders)
Dataset(no. job orders)
Score**(%)
% Change(%)
Non-Compliant(no. job orders)
Dataset(no. job orders)
1Emergency timeliness
(normal hours)95.00% 80.7% 755 3919 64.6% -16.1% 3212 9066
2Emergency timeliness
(after hours)95.00% 78.9% 4 19 55.0% -23.9% 59 131
3a Priority timeliness (normal hours)
76.00% 70.6% 4153 14158 40.6% -30.0% 11116 18703
3b Priority timeliness(after hours)
76.00% 44.1% 1206 2159 11.1% -33.0% 3093 3481
4 Routine timeliness
76.00% 80.9% 7795 40780 65.9% -15.0% 10392 30481
5 M ajor works timeliness
76.00% 68.1% 505 1582 76.7% 8.6% 671 2880
* Effective Compliance Requirement is determined by multiplying the KPI Target with the Compliance Requirement** Score includes all contractors across all regions
2009 2011
KPI Statistics Overview
Effective Compliance
Requirement*KPI No.
& Description
80.7%78.9%
70.6%
44.1%
80.9%
68.1%64.6%
55.0%
40.6%
11.1%
65.9%
76.7%
0.0%
10.0%
20.0%
30.0%
40.0%
50.0%
60.0%
70.0%
80.0%
90.0%
100.0%
1. Emergency timeliness (normal hours)
2. Emergency timeliness(after hours)
3a. Priority timeliness (normal hours)
3b. Priority timeliness(after hours)
4. Routine timeliness 5. Major works timeliness
KPI
KPI Compliance - Comparison of 2009 and 2011 KPI Scores by Compliance Percentage
2009
2011
Figure 12: Comparison of 2009 and 2011 KPI scores by compliance percentage

© 2012 KPMG, an Australian partnership and a member firm of the KPMG network of independent member firms affiliated with KPMG International Cooperative (“KPMG International”), a Swiss entity. All rights reserved. Printed in Australia The KPMG name, logo and "cutting through complexity" are registered trademarks or trademarks of KPMG International. Liability limited by a scheme approved under Professional Standards Legislation.
39
Summary of Section B: Comparison between contracting models When comparing the two models based on the critical success factors of cost, timeliness and quality, our analysis above can be summarised as follows (noting the restrictions and limitations set out in paragraph 2 on page 30 and paragraph 8 on page 37):
• From a cost perspective, the comparisons performed by Internal Audit (refer Table 4 on page 32) indicate that the costs (applying consistent base) are broadly comparable between the models at a total spend level. However, there are indications that savings can be achieved (with appropriate management discipline applied), based on the decrease in the average cost per work order (refer Table 5 on page 33).
However, it is important to note the items discussed under “Comparison between previous and current contracting models”, paragraph 2 on page 30, and the CPI which was measured at between 2.8% and 1.8% during the period March 2009 and May 2011.
• From a timeliness perspective, the KPI data comparison performed by Internal Audit (refer Figure 11 and Figure 12 on page 38) indicates a lower percentage of compliance to the timeliness KPIs under the new Head Contractor Model.
However, it is important to note the items discussed under “Interpretation of data”, paragraph 8 on page 37.
• From a quality perspective, the current Head Contractor Model contract KPIs do not allow for measurement of the quality of the work performed by the contractors, as discussed further on page 41.
This means that at present, the models cannot be directly compared on a quality basis.
We note our comments on paragraph 2 on page 30, and our recommendation R7 on page 50 with respect to enabling a more thorough measurement of success of the model, and a direct comparison to the prior model.
Providing the means to measure and drive improved maintenance outcomes One of the key benefits identified by the Department of implementing the Head Contractor Model was the ability of the Head Contractor Model to provide the Department with the means to measure and drive improved maintenance outcomes.
The definition of “improved maintenance outcomes” would include a range of aspects, such as reduced cost; improved quality; improved timeliness; improved ability to resolve disputes; improved contractor accountability and reduced administration processes. We note that at present the Department has not made an evaluation of these aspects in order to measure the overall success of the Head Contractor Model (refer page 50 for further details).
The comparison and analysis performed by Internal Audit in Sections B and C indicated the following regarding the Model’s ability to drive improved maintenance outcomes:
• Due to the issues experienced during implementation, it is likely that the Head Contractor Model has not reached its full potential and full benefits may only be realised in the longer term.
• There are indications in the cost structure that savings can be achieved, with appropriate management discipline applied, based on the items discussed in the summary above, and the analysis performed on page 30 onwards.
• There are differences in the performance management framework between the Models (refer page 29), with key improvements relating to the introduction of formal performance targets; a penalty and incentive scheme; and improved performance reporting and trend analysis.
• There are opportunities to improve the adequacy and appropriateness of the key performance indicators (KPIs), particularly introducing a measure of quality of work; and reviewing the KPI targets (refer page 41).
Further, there are opportunities to improve the performance management processes, such as introducing stricter controls over the recording of performance data (refer page 45); and improved clarity in the application of maintenance work categories (refer page 47).
By addressing these issues, the Department will improve the Model’s ability to measure and drive improved maintenance outcomes.
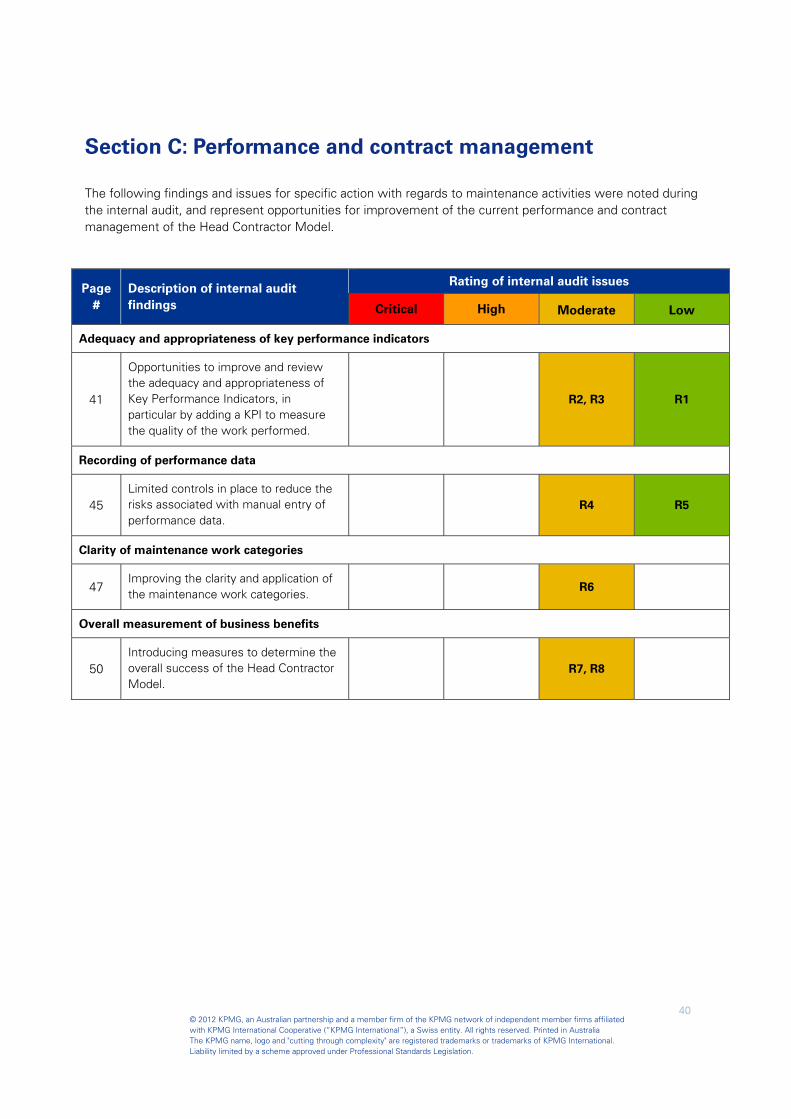
© 2012 KPMG, an Australian partnership and a member firm of the KPMG network of independent member firms affiliated with KPMG International Cooperative (“KPMG International”), a Swiss entity. All rights reserved. Printed in Australia The KPMG name, logo and "cutting through complexity" are registered trademarks or trademarks of KPMG International. Liability limited by a scheme approved under Professional Standards Legislation.
40
Section C: Performance and contract management
The following findings and issues for specific action with regards to maintenance activities were noted during the internal audit, and represent opportunities for improvement of the current performance and contract management of the Head Contractor Model.
Page #
Description of internal audit findings
Rating of internal audit issues
Critical High Moderate Low
Adequacy and appropriateness of key performance indicators
41
Opportunities to improve and review the adequacy and appropriateness of Key Performance Indicators, in particular by adding a KPI to measure the quality of the work performed.
R2, R3 R1
Recording of performance data
45 Limited controls in place to reduce the risks associated with manual entry of performance data.
R4 R5
Clarity of maintenance work categories
47 Improving the clarity and application of the maintenance work categories.
R6
Overall measurement of business benefits
50 Introducing measures to determine the overall success of the Head Contractor Model.
R7, R8
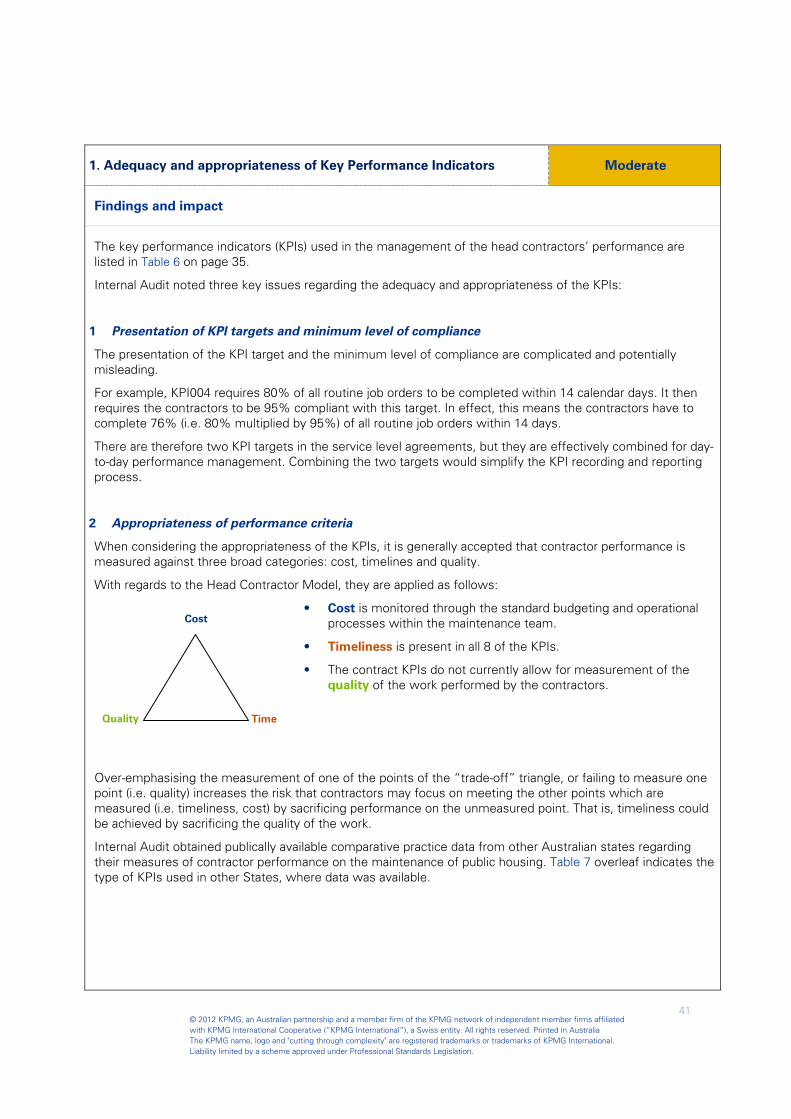
© 2012 KPMG, an Australian partnership and a member firm of the KPMG network of independent member firms affiliated with KPMG International Cooperative (“KPMG International”), a Swiss entity. All rights reserved. Printed in Australia The KPMG name, logo and "cutting through complexity" are registered trademarks or trademarks of KPMG International. Liability limited by a scheme approved under Professional Standards Legislation.
41
Time
Cost
Quality
1. Adequacy and appropriateness of Key Performance Indicators Moderate
Findings and impact
The key performance indicators (KPIs) used in the management of the head contractors’ performance are listed in Table 6 on page 35.
Internal Audit noted three key issues regarding the adequacy and appropriateness of the KPIs:
1 Presentation of KPI targets and minimum level of compliance
The presentation of the KPI target and the minimum level of compliance are complicated and potentially misleading.
For example, KPI004 requires 80% of all routine job orders to be completed within 14 calendar days. It then requires the contractors to be 95% compliant with this target. In effect, this means the contractors have to complete 76% (i.e. 80% multiplied by 95%) of all routine job orders within 14 days.
There are therefore two KPI targets in the service level agreements, but they are effectively combined for day-to-day performance management. Combining the two targets would simplify the KPI recording and reporting process.
2 Appropriateness of performance criteria
When considering the appropriateness of the KPIs, it is generally accepted that contractor performance is measured against three broad categories: cost, timelines and quality.
With regards to the Head Contractor Model, they are applied as follows:
• Cost is monitored through the standard budgeting and operational processes within the maintenance team.
• Timeliness is present in all 8 of the KPIs.
• The contract KPIs do not currently allow for measurement of the quality of the work performed by the contractors.
Over-emphasising the measurement of one of the points of the “trade-off” triangle, or failing to measure one point (i.e. quality) increases the risk that contractors may focus on meeting the other points which are measured (i.e. timeliness, cost) by sacrificing performance on the unmeasured point. That is, timeliness could be achieved by sacrificing the quality of the work.
Internal Audit obtained publically available comparative practice data from other Australian states regarding their measures of contractor performance on the maintenance of public housing. Table 7 overleaf indicates the type of KPIs used in other States, where data was available.

© 2012 KPMG, an Australian partnership and a member firm of the KPMG network of independent member firms affiliated with KPMG International Cooperative (“KPMG International”), a Swiss entity. All rights reserved. Printed in Australia The KPMG name, logo and "cutting through complexity" are registered trademarks or trademarks of KPMG International. Liability limited by a scheme approved under Professional Standards Legislation.
42
Table 7 below indicates that KPIs relating to quality and tenant satisfaction are common in other States:
KPI Criteria WA VIC3 ACT4
Timeliness of works
Contractual compliance
Tenant Satisfaction
Quality of service delivered
Table 7: KPI criteria in other States
KPI008 “Timeliness of submission of Quality Assurance (QA) reports” requires the head contractors to undertake desktop audits of 5%-10% of the paid job orders per quarter, in order to control the quality of the work performed by the subcontractors.
However, KPI008 measures the timeliness by which the contractors submit their QA reports to the Department, and does not measure the actual content or results of the QA reports. Therefore a head contractor could be meeting this KPI by submitting the QA reports on time, but the QA reports could be indicating poor quality of maintenance work performed, which would not necessarily be identified by the Department.
3 Appropriateness of the KPI targets
The summary KPI reports for June, July and August 2011 indicate that all three head contractors have been consistently failing to achieve the KPI targets for KPI001 to KPI006 with very few exceptions.
This may be an indication that the KPI targets within the Service Level Agreement (SLA) need review and possible revision as they may not be achievable.
To consider this, Internal Audit obtained comparative practice data from other Australian states regarding their measures of contractor performance on the maintenance of public housing. This is presented in Table 8: Comparison of KPIs in other States overleaf.
From this data, the average response time per work category across the other States (i.e. excluding WA) can be calculated as follows:
Emergency works: 8.5 hours
Priority works: 72 hours
Routine works: 17 days
In comparison with other States and the averages noted above, it would seem that the KPI targets in the WA SLAs, especially those relating to emergency and priority works in non-metro areas, may be too high. When interpreting the data, it is important to take into account the remoteness of regional Western Australia versus the other states, for some maintenance zones.
3 Maintenance Manual, Department of Human Services VIC, available at www.dhs.vic.gov.au/about/documents/policies/maintenance_manual 4 Annual Report 2010-11, Department of Community Services ACT, available at www.dhcs.act.gov.au/home/publications/annual_reports/2010-11/2/agency_performance/housing_act
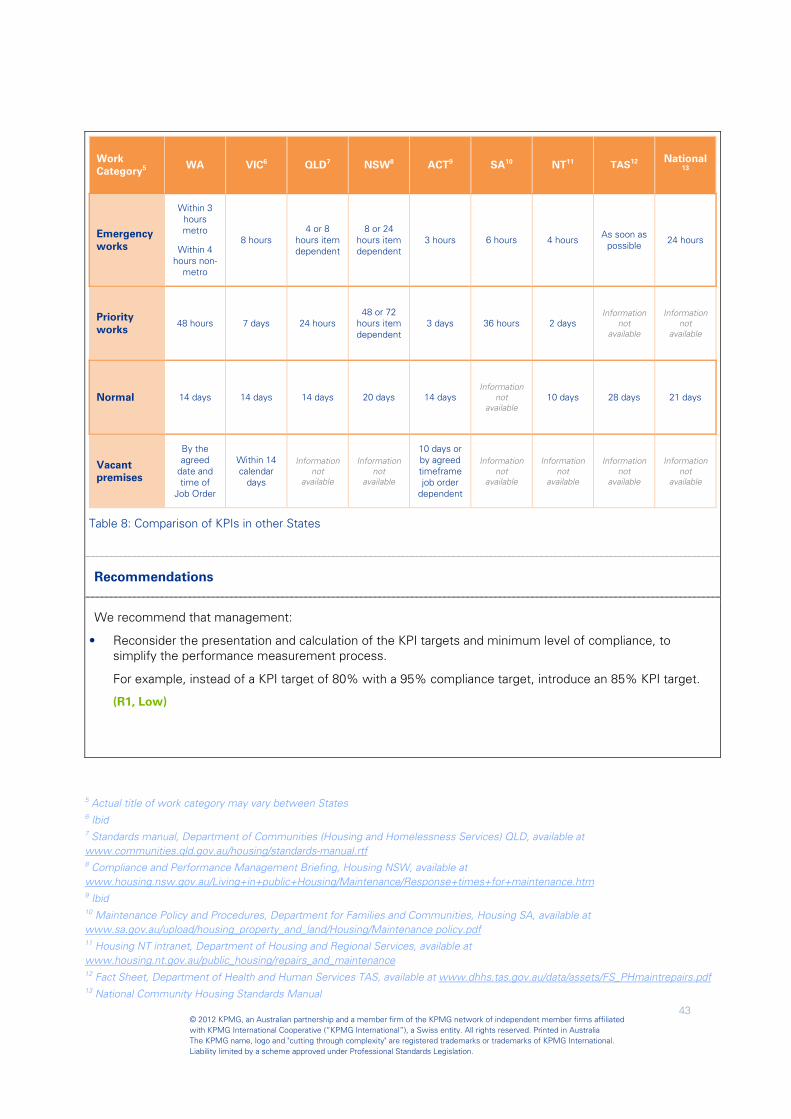
© 2012 KPMG, an Australian partnership and a member firm of the KPMG network of independent member firms affiliated with KPMG International Cooperative (“KPMG International”), a Swiss entity. All rights reserved. Printed in Australia The KPMG name, logo and "cutting through complexity" are registered trademarks or trademarks of KPMG International. Liability limited by a scheme approved under Professional Standards Legislation.
43
Work Category5
WA VIC6 QLD7 NSW8 ACT9 SA10 NT11 TAS12 National
13
Emergency works
Within 3 hours metro
Within 4 hours non-
metro
8 hours 4 or 8
hours item dependent
8 or 24 hours item dependent
3 hours 6 hours 4 hours As soon as
possible 24 hours
Priority works
48 hours 7 days 24 hours 48 or 72
hours item dependent
3 days 36 hours 2 days Information
not available
Information not
available
Normal 14 days 14 days 14 days 20 days 14 days Information
not available
10 days 28 days 21 days
Vacant premises
By the agreed
date and time of
Job Order
Within 14 calendar
days
Information not
available
Information not
available
10 days or by agreed timeframe job order
dependent
Information not
available
Information not
available
Information not
available
Information not
available
Table 8: Comparison of KPIs in other States
Recommendations
We recommend that management:
• Reconsider the presentation and calculation of the KPI targets and minimum level of compliance, to simplify the performance measurement process.
For example, instead of a KPI target of 80% with a 95% compliance target, introduce an 85% KPI target.
(R1, Low)
5 Actual title of work category may vary between States 6 Ibid 7 Standards manual, Department of Communities (Housing and Homelessness Services) QLD, available at www.communities.qld.gov.au/housing/standards-manual.rtf 8 Compliance and Performance Management Briefing, Housing NSW, available at www.housing.nsw.gov.au/Living+in+public+Housing/Maintenance/Response+times+for+maintenance.htm 9 Ibid 10 Maintenance Policy and Procedures, Department for Families and Communities, Housing SA, available at www.sa.gov.au/upload/housing_property_and_land/Housing/Maintenance policy.pdf 11 Housing NT intranet, Department of Housing and Regional Services, available at www.housing.nt.gov.au/public_housing/repairs_and_maintenance 12 Fact Sheet, Department of Health and Human Services TAS, available at www.dhhs.tas.gov.au/data/assets/FS_PHmaintrepairs.pdf 13 National Community Housing Standards Manual

© 2012 KPMG, an Australian partnership and a member firm of the KPMG network of independent member firms affiliated with KPMG International Cooperative (“KPMG International”), a Swiss entity. All rights reserved. Printed in Australia The KPMG name, logo and "cutting through complexity" are registered trademarks or trademarks of KPMG International. Liability limited by a scheme approved under Professional Standards Legislation.
44
• Introduce a KPI regarding the quality of the work performed, in order to balance the trade-off between time and quality, and to prevent unintentional behavioural consequences.
For example, the KPI for quality could be 80% of work satisfactorily performed, as measured by the results from the Quality Assurance reporting process. Consideration may also be given to other KPIs such as tenant satisfaction.
(R2, Moderate)
• Review all KPI targets to determine their appropriateness. In particular, consideration should be given to the emergency and priority work order times in non-metro areas. In reviewing the KPIs, management should consult with the head contractors to obtain their input. The revised KPIs should be formally reflected in the SLAs and/or contracts.
As part of reviewing the KPIs, it may be necessary to review the penalty and incentive scheme to ensure they are appropriate, based on comparative practice and alignment with the objectives of the new Head Contractor Model.
(R3, Moderate)
Agreed Management action(s)
R1 Action:
Agreed. All KPIs are to be reviewed in line with the review of the Head Contractor Model.
R2 Action:
Agreed. A Quality Management Form is to be implemented for use by tenants and regional staff to report issues of substandard HMC work.
Consideration of client satisfaction survey to be from Service Delivery Central-wide portfolio.
R3 Action:
Agreed. All KPIs are to be reviewed in line with the review of the Head Contractor Model.
Responsibility Manager Contracts
Target date August 2012
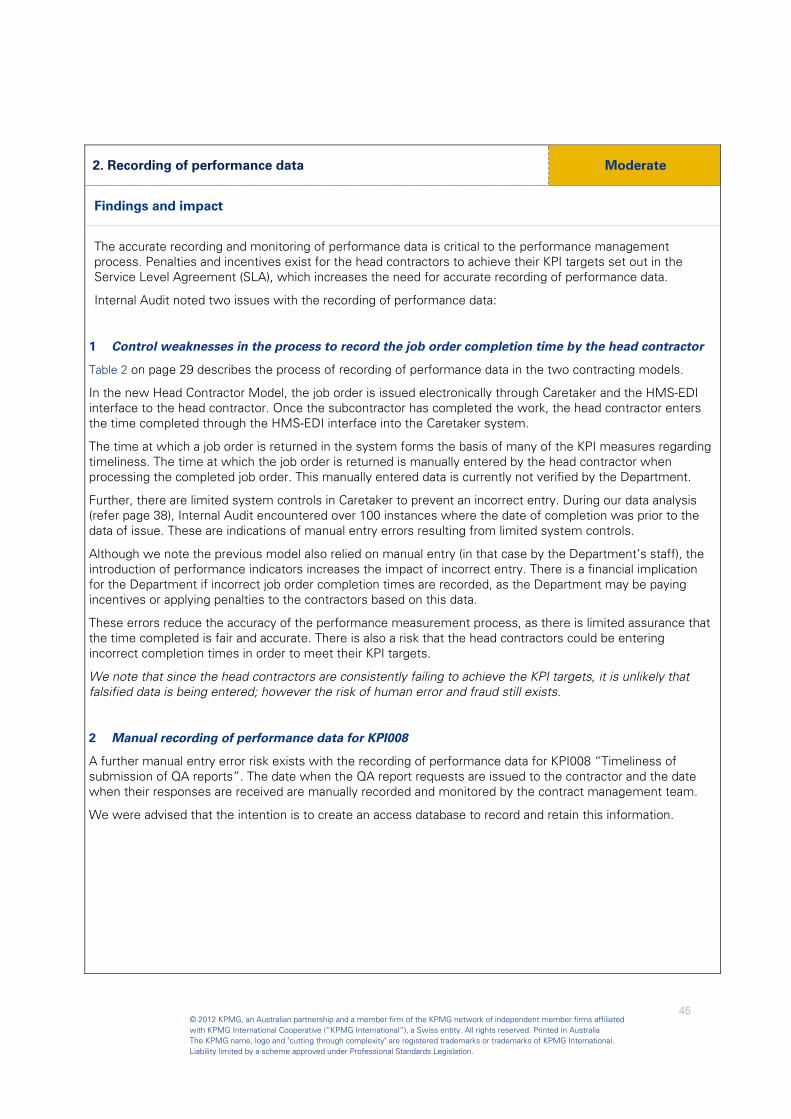
© 2012 KPMG, an Australian partnership and a member firm of the KPMG network of independent member firms affiliated with KPMG International Cooperative (“KPMG International”), a Swiss entity. All rights reserved. Printed in Australia The KPMG name, logo and "cutting through complexity" are registered trademarks or trademarks of KPMG International. Liability limited by a scheme approved under Professional Standards Legislation.
45
2. Recording of performance data Moderate
Findings and impact
The accurate recording and monitoring of performance data is critical to the performance management process. Penalties and incentives exist for the head contractors to achieve their KPI targets set out in the Service Level Agreement (SLA), which increases the need for accurate recording of performance data.
Internal Audit noted two issues with the recording of performance data:
1 Control weaknesses in the process to record the job order completion time by the head contractor
Table 2 on page 29 describes the process of recording of performance data in the two contracting models.
In the new Head Contractor Model, the job order is issued electronically through Caretaker and the HMS-EDI interface to the head contractor. Once the subcontractor has completed the work, the head contractor enters the time completed through the HMS-EDI interface into the Caretaker system.
The time at which a job order is returned in the system forms the basis of many of the KPI measures regarding timeliness. The time at which the job order is returned is manually entered by the head contractor when processing the completed job order. This manually entered data is currently not verified by the Department.
Further, there are limited system controls in Caretaker to prevent an incorrect entry. During our data analysis (refer page 38), Internal Audit encountered over 100 instances where the date of completion was prior to the data of issue. These are indications of manual entry errors resulting from limited system controls.
Although we note the previous model also relied on manual entry (in that case by the Department’s staff), the introduction of performance indicators increases the impact of incorrect entry. There is a financial implication for the Department if incorrect job order completion times are recorded, as the Department may be paying incentives or applying penalties to the contractors based on this data.
These errors reduce the accuracy of the performance measurement process, as there is limited assurance that the time completed is fair and accurate. There is also a risk that the head contractors could be entering incorrect completion times in order to meet their KPI targets.
We note that since the head contractors are consistently failing to achieve the KPI targets, it is unlikely that falsified data is being entered; however the risk of human error and fraud still exists.
2 Manual recording of performance data for KPI008
A further manual entry error risk exists with the recording of performance data for KPI008 “Timeliness of submission of QA reports”. The date when the QA report requests are issued to the contractor and the date when their responses are received are manually recorded and monitored by the contract management team.
We were advised that the intention is to create an access database to record and retain this information.

© 2012 KPMG, an Australian partnership and a member firm of the KPMG network of independent member firms affiliated with KPMG International Cooperative (“KPMG International”), a Swiss entity. All rights reserved. Printed in Australia The KPMG name, logo and "cutting through complexity" are registered trademarks or trademarks of KPMG International. Liability limited by a scheme approved under Professional Standards Legislation.
46
Recommendations
We recommend that management:
• Design and implement controls to ensure the manual entry of the job order completion time by the head contractor accurately reflects the actual completion time. This could include:
− Implementing a detective control, by incorporating the validation of the job order completion time to supporting evidence as part of the Quality Assurance report (this could be done on a sample basis); and
− Investigate the use of a system control within Caretaker that prevents the job order completion date to be prior to the job order issue date.
(R4, Moderate)
• As management intends to do, create and maintain an Access database to record and monitor the performance data for KPI008.
(R5, Low)
Agreed Management action(s)
R4 Action:
Due to the procurement of a new primary database, no further upgrades to Caretaker will be progressed.
However, the new Northgate system will be reviewed to determine functionality and if any enhancements are required.
In the interim, management will consider how this requirement can be incorporated into the QA&BI process that is being developed.
R5 Action:
The Access database is no longer required. All information is recorded in monthly Excel spreadsheets. The information is available to review all KPIs to facilitate the monitoring of HMC performance.
In addition, as per R4, the new Northgate system will be reviewed to determine functionality and if any enhancements are required.
Responsibility Manager Contracts
Target date August 2012
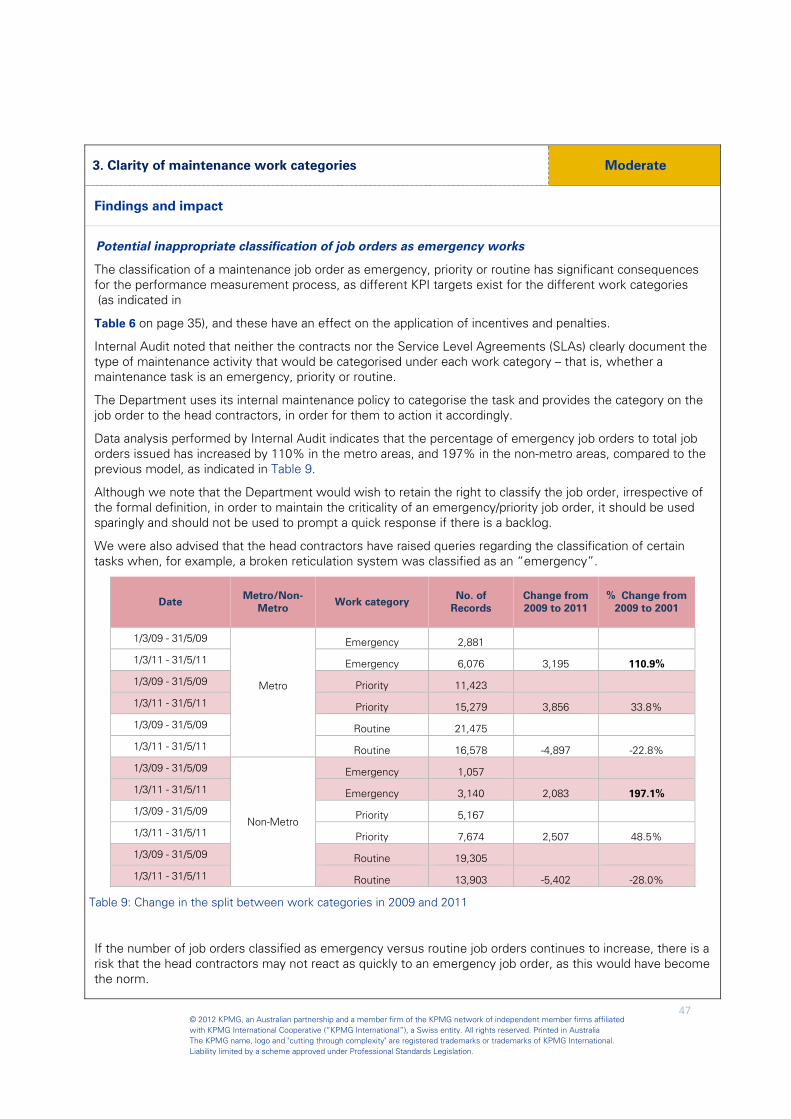
© 2012 KPMG, an Australian partnership and a member firm of the KPMG network of independent member firms affiliated with KPMG International Cooperative (“KPMG International”), a Swiss entity. All rights reserved. Printed in Australia The KPMG name, logo and "cutting through complexity" are registered trademarks or trademarks of KPMG International. Liability limited by a scheme approved under Professional Standards Legislation.
47
3. Clarity of maintenance work categories Moderate
Findings and impact
Potential inappropriate classification of job orders as emergency works
The classification of a maintenance job order as emergency, priority or routine has significant consequences for the performance measurement process, as different KPI targets exist for the different work categories (as indicated in
Table 6 on page 35), and these have an effect on the application of incentives and penalties.
Internal Audit noted that neither the contracts nor the Service Level Agreements (SLAs) clearly document the type of maintenance activity that would be categorised under each work category – that is, whether a maintenance task is an emergency, priority or routine.
The Department uses its internal maintenance policy to categorise the task and provides the category on the job order to the head contractors, in order for them to action it accordingly.
Data analysis performed by Internal Audit indicates that the percentage of emergency job orders to total job orders issued has increased by 110% in the metro areas, and 197% in the non-metro areas, compared to the previous model, as indicated in Table 9.
Although we note that the Department would wish to retain the right to classify the job order, irrespective of the formal definition, in order to maintain the criticality of an emergency/priority job order, it should be used sparingly and should not be used to prompt a quick response if there is a backlog.
We were also advised that the head contractors have raised queries regarding the classification of certain tasks when, for example, a broken reticulation system was classified as an “emergency”.
Date Metro/Non-
Metro Work category
No. of Records
Change from 2009 to 2011
% Change from 2009 to 2001
1/3/09 - 31/5/09
Metro
Emergency 2,881
1/3/11 - 31/5/11 Emergency 6,076 3,195 110.9%
1/3/09 - 31/5/09 Priority 11,423
1/3/11 - 31/5/11 Priority 15,279 3,856 33.8%
1/3/09 - 31/5/09 Routine 21,475
1/3/11 - 31/5/11 Routine 16,578 -4,897 -22.8%
1/3/09 - 31/5/09
Non-Metro
Emergency 1,057
1/3/11 - 31/5/11 Emergency 3,140 2,083 197.1%
1/3/09 - 31/5/09 Priority 5,167
1/3/11 - 31/5/11 Priority 7,674 2,507 48.5%
1/3/09 - 31/5/09 Routine 19,305
1/3/11 - 31/5/11 Routine 13,903 -5,402 -28.0%
Table 9: Change in the split between work categories in 2009 and 2011
If the number of job orders classified as emergency versus routine job orders continues to increase, there is a risk that the head contractors may not react as quickly to an emergency job order, as this would have become the norm. in categories

© 2012 KPMG, an Australian partnership and a member firm of the KPMG network of independent member firms affiliated with KPMG International Cooperative (“KPMG International”), a Swiss entity. All rights reserved. Printed in Australia The KPMG name, logo and "cutting through complexity" are registered trademarks or trademarks of KPMG International. Liability limited by a scheme approved under Professional Standards Legislation.
48
Recommendations
We recommend that management:
• Ensure the contractors and Department staff are aware of the types of maintenance tasks for each work category (this is available to public housing tenants in the “If Something Breaks Down” factsheet on the Department’s website). The Department staff should ensure they classify a job order as per the documented guidance.
Further, ensure the emergency and priority classifications are in line with the policy guidance, to avoid issuing emergency/priority job orders for non-emergency/priority tasks.
In order to ensure change in behaviour is evidenced, management could monitor the progress through the KPI statistics to determine the number of emergency job orders issued as a percentage of total job orders.
(R6, Moderate)
Agreed Management action(s)
R6 Action:
A circular (1/2012) has been distributed to all regional staff and Housing Direct providing clear instructions on the issuing of emergency and priority job orders.
A review of all maintenance policies is to be programmed in the calendar year. Consideration of monitoring progress regarding the number of emergency job orders issued will be factored into activities undertaken as part of R7 and R8.
Responsibility Manager Maintenance
Target date December 2012
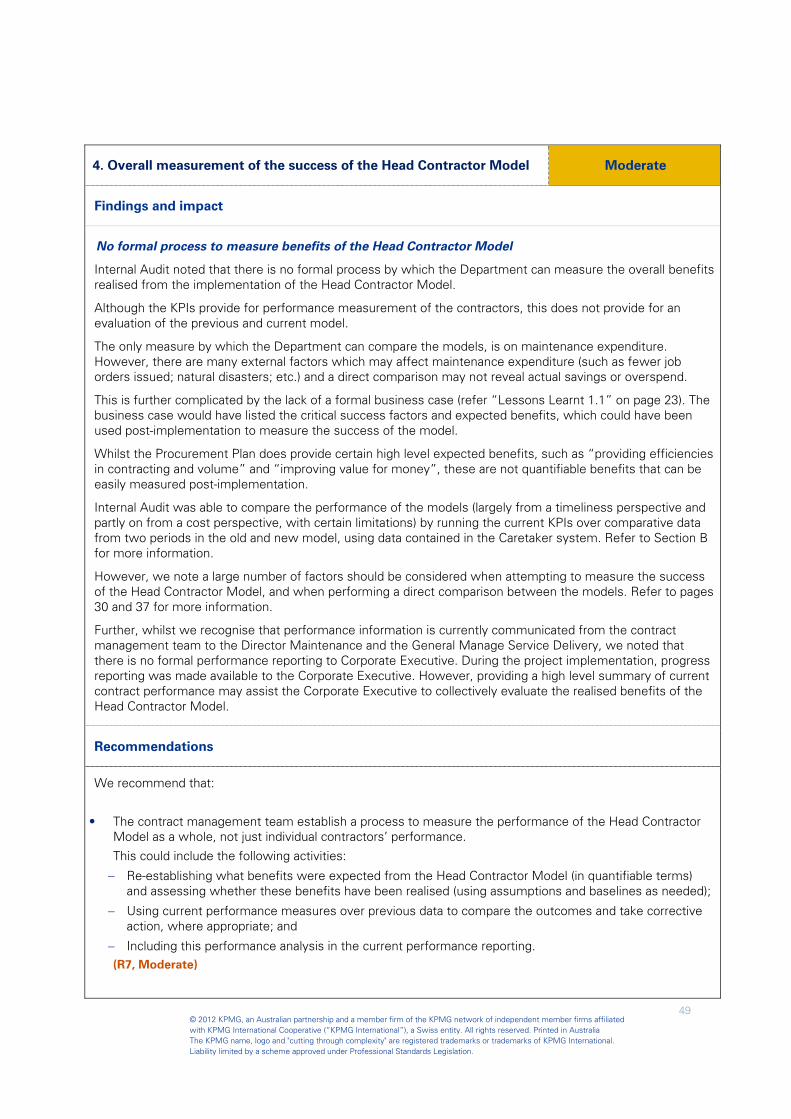
© 2012 KPMG, an Australian partnership and a member firm of the KPMG network of independent member firms affiliated with KPMG International Cooperative (“KPMG International”), a Swiss entity. All rights reserved. Printed in Australia The KPMG name, logo and "cutting through complexity" are registered trademarks or trademarks of KPMG International. Liability limited by a scheme approved under Professional Standards Legislation.
49
4. Overall measurement of the success of the Head Contractor Model Moderate
Findings and impact
No formal process to measure benefits of the Head Contractor Model
Internal Audit noted that there is no formal process by which the Department can measure the overall benefits realised from the implementation of the Head Contractor Model.
Although the KPIs provide for performance measurement of the contractors, this does not provide for an evaluation of the previous and current model.
The only measure by which the Department can compare the models, is on maintenance expenditure. However, there are many external factors which may affect maintenance expenditure (such as fewer job orders issued; natural disasters; etc.) and a direct comparison may not reveal actual savings or overspend.
This is further complicated by the lack of a formal business case (refer “Lessons Learnt 1.1” on page 23). The business case would have listed the critical success factors and expected benefits, which could have been used post-implementation to measure the success of the model.
Whilst the Procurement Plan does provide certain high level expected benefits, such as “providing efficiencies in contracting and volume” and “improving value for money”, these are not quantifiable benefits that can be easily measured post-implementation.
Internal Audit was able to compare the performance of the models (largely from a timeliness perspective and partly on from a cost perspective, with certain limitations) by running the current KPIs over comparative data from two periods in the old and new model, using data contained in the Caretaker system. Refer to Section B for more information.
However, we note a large number of factors should be considered when attempting to measure the success of the Head Contractor Model, and when performing a direct comparison between the models. Refer to pages 30 and 37 for more information.
Further, whilst we recognise that performance information is currently communicated from the contract management team to the Director Maintenance and the General Manage Service Delivery, we noted that there is no formal performance reporting to Corporate Executive. During the project implementation, progress reporting was made available to the Corporate Executive. However, providing a high level summary of current contract performance may assist the Corporate Executive to collectively evaluate the realised benefits of the Head Contractor Model.
Recommendations
We recommend that:
• The contract management team establish a process to measure the performance of the Head Contractor Model as a whole, not just individual contractors’ performance.
This could include the following activities:
− Re-establishing what benefits were expected from the Head Contractor Model (in quantifiable terms) and assessing whether these benefits have been realised (using assumptions and baselines as needed);
− Using current performance measures over previous data to compare the outcomes and take corrective action, where appropriate; and
− Including this performance analysis in the current performance reporting. (R7, Moderate)
© 2012 KPMG, an Australian partnership and a member firm of the KPMG network of independent member firms affiliated with KPMG International Cooperative (“KPMG International”), a Swiss entity. All rights reserved. Printed in Australia The KPMG name, logo and "cutting through complexity" are registered trademarks or trademarks of KPMG International. Liability limited by a scheme approved under Professional Standards Legislation.
50
• Consider providing a high-level summary of the performance reporting to Corporate Executive to enable an ongoing evaluation of the Head Contractor Model.
This could be incorporated into the Service Delivery Update report which can be discussed at the Corporate Executive meetings on a bi-monthly basis. We note that the contract management team is producing detailed reporting and trend analysis, which could be used as a basis and reproduced in a summarised manner. (R8, Moderate)
Agreed Management action(s)
R7 Action:
Completed. The development of the SLA KPIs assists to measure the success of the Head Contractor Model as a whole and to assess individual contractor performance. An overall assessment of the Head Contractor Model is presented to Corp Ex by stating the current month’s average compliance targets achieved. This includes the number of vacant properties in 'outstanding' / 'overdue' status.
Additionally, the Compliance model run by Maintenance Operation branch assists to review overall the success of job order compliancy by all Head Contractors. The Operation audit team also identify any trends with over charging made against issued job orders. The assessment of the information provided by the Auditors is assessed by the Contracts team and if issues are found, formal communication or action is raised with the relevant Head Contractor. This also assists in assessing if operational processes need to be developed to reduce future incidents of non compliance, or if regional training is required to promote the contractual obligations of the contract.
R8 Action:
Agreed. The development of a Maintenance dashboard indicator for Corporate Executive is in progress. The dashboard will show the progress against budget and HMC. all measurement
Responsibility Manager Contracts
Target date March 2012

© 2012 KPMG, an Australian partnership and a member firm of the KPMG network of independent member firms affiliated with KPMG International Cooperative (“KPMG International”), a Swiss entity. All rights reserved. Printed in Australia The KPMG name, logo and "cutting through complexity" are registered trademarks or trademarks of KPMG International. Liability limited by a scheme approved under Professional Standards Legislation.
51
In accordance with the 2011/2012 Internal Audit Plan as approved by the Audit Committee, an internal audit of the Department of Housing’s Head Contractor Maintenance Model was performed.
The key aspects of the internal audit, as detailed below, were agreed with Department Management.
Objective
The key objective of the review of the introduction and implementation of the Head Contractor Maintenance model was to provide information for management to answer the following high level questions:
• Was there an appropriate business case for the decision to adopt the new Head Contractor model?
• Is the Head Contractor Maintenance model an improvement on the previous maintenance arrangements with regard to cost and efficiency?
• Does the Head Contractor Maintenance model provide the Department with the means of measuring and driving improved maintenance outcomes?
• Are the existing contracts and service level agreements providing adequate controls and performance monitoring?
• Have appropriate performance measurement metrics and reporting mechanisms been put in place?
Scope
In the context of the above objectives, the internal audit involved consideration of the following broad issues:
• The adequacy and robustness of the Department’s decision making process that led to the introduction of the Head Contractor Maintenance Model;
• The actions taken by the Department to implement the new arrangements prior to and following 1 July 2010;
• Head contractor performance in the period 1 July 2010 to 30 June 2011 (the engagement considered performance results and information captured by the Department and excluded consultation with the individual Head Contractors);
• The adequacy of the existing contracts and associated service level agreements between the Department and the Head Contractors, with regards to controls and performance monitoring (not our scope did not involve a legal or commercial contract review); and
• Implementation of appropriate performance measurement metrics and reporting mechanisms.
Approach
Our approach for delivering the engagement was performed in six stages:
Stage 1 – Initiation and planning
• Met with the General Manager, Service Delivery to confirm scope and approach.
• Identified all the relevant contacts and stakeholders to the project;
• Developed the project approach, timeline and key tasks to be completed.
• Finalised the Project Plan and provided to key stakeholders.
• Commenced with the initial information gathering.
Appendix 1 - Objective, scope and approach

© 2012 KPMG, an Australian partnership and a member firm of the KPMG network of independent member firms affiliated with KPMG International Cooperative (“KPMG International”), a Swiss entity. All rights reserved. Printed in Australia The KPMG name, logo and "cutting through complexity" are registered trademarks or trademarks of KPMG International. Liability limited by a scheme approved under Professional Standards Legislation.
52
Stage 2 – Fieldwork
2-1 Decision-making processes and business case
• Considered how the business need for the Head Contractor Model was identified and developed into a business case, including the role and responsibility of the Project Sponsor.
• Confirmed the existence and adequacy of the business case for the Head Contractor Model, including the level of detail included in the business case (e.g. analysis of options) and existence of robust project evaluation procedures.
• Reconstructed, at a high-level, a timeline of events leading up to the approval of the Head Contractor Model to identify key actions and approvals in the decision-making process.
• Inspected relevant documentation, including Executive Meeting minutes, to understand the adequacy and transparency of the decision-making process and final approval.
2-2 Implementation of the Head Contractor Model
• Considered the formulation of a project team to implement the Head Contractor Model, including allocation of roles and responsibilities to key project members.
• Considered the adequacy and existence of a project management methodology used for the implementation, including the existence of key project documentation.
• Considered the transition arrangements that were in place during the implementation.
• Considered the appropriateness of the approach taken to implement the Head Contractor Model, including the adequacy of the roll-out strategy.
• Considered the extent of monitoring activities over the implementation, including monitoring progress, scope, time, and budget to baselines.
• Considered the approach for identifying and handling risks and issues that occurred during the implementation.
2-3 Current versus previous contractor performance
• Considered the framework used by the Department to record, manage and monitor data on contractor performance (including cost) prior to, and after implementation of the Head Contractor Model.
• On a sample basis, compared the abovementioned contractor performance results to identify possible improvements with regards to performance measures.
Where comparisons between the previous and new performance data was not feasible due to data formats and other reasons, our analysis was based on a series of assumptions.
2-4 Contracts, performance metrics and reporting
• Established what contracts and service level agreements are in place between the Department and the Head Contractors.
• Established what performance metrics are in place to measure the performance of the Head Contractors, in terms of cost and efficiency. Considered whether the CSFs and KPIs support the desired outcomes of the Maintenance Programs.
• Considered the process by which the Department captures and records performance information, and how this is analysed critically.
• Identified what reporting is produced by the Department on contractor performance.
• Considered the follow up actions are taken by the Department to rectify poor contractor performance.
Stage 3 – Consultation and confirmation
• Analysed and collated findings from fieldwork.
• Held a workshop with key stakeholders to confirm and validate findings.
• Briefed the key stakeholders on the preliminary findings.

© 2012 KPMG, an Australian partnership and a member firm of the KPMG network of independent member firms affiliated with KPMG International Cooperative (“KPMG International”), a Swiss entity. All rights reserved. Printed in Australia The KPMG name, logo and "cutting through complexity" are registered trademarks or trademarks of KPMG International. Liability limited by a scheme approved under Professional Standards Legislation.
53
Stage 4 – Draft report and recommendations
• Compiled draft report with recommendations for improvements.
• Discussed recommendations with process owners to confirm viability.
• Delivered draft report to Director-General and Office of the Minister for Housing
Stage 5 – Facilitate management action plans
• Assisted management in developing action plans to address recommendations for improvement. This involved:
- Providing the draft report to management for comment;
- Assisting management in reviewing their action plans to consider whether the actions address the key issues/concerns and whether the estimated completion date is practical; and
- Assisting management in prioritising actions plans to ensure high risk areas are addressed in a timely fashion, and considering the possibility of utilising existing business-as-usual projects to address the issues.
Stage 6 – Final report and briefing
• Compiled final report, including summary of key findings, recommendations and management action plans.
• Delivered final report to the Department’s Audit Committee and the Office of the Minister for Housing.
The internal audit was performed primarily by way of discussion with Department staff, observation, limited sample testing and consideration of policies, procedures and supporting documentation.
Discussions with management and relevant staff, included the following personnel:
- Grahame Searle, Director General
- Steve Parry, General Manager Service Delivery
- Paul Whyte, General Manager Commercial and Business Operations
- Will Carroll, Director Built Form and Civil Construction
- Sarah Ronald, Director Maintenance
- David Shanks, Manager Maintenance
- Trevor Gregory, Regional Manager Geraldton
- Karen Branch, Housing Services Manager Cannington
- Steve Willard, Manager Executive Services
- Narele Barrow, Contract Manager Maintenance
- Spencer Stacey, Project Manager
- Nicky Mitchell, Project Manager
- Jo Pastor, Project Manager
- Andrew Bray, Corporate Risk Consultant
- Jodi Weeks, Corporate Executive Assistant
- Dom Gerard, Senior Procurement Manager
- John Bucknall, Contract Information Systems
- Seong Kim, Maintenance Contract Information Systems
- Kumar Vadivale, ICT Business Developer
- Majid Bassiri, ICT Business Analyst
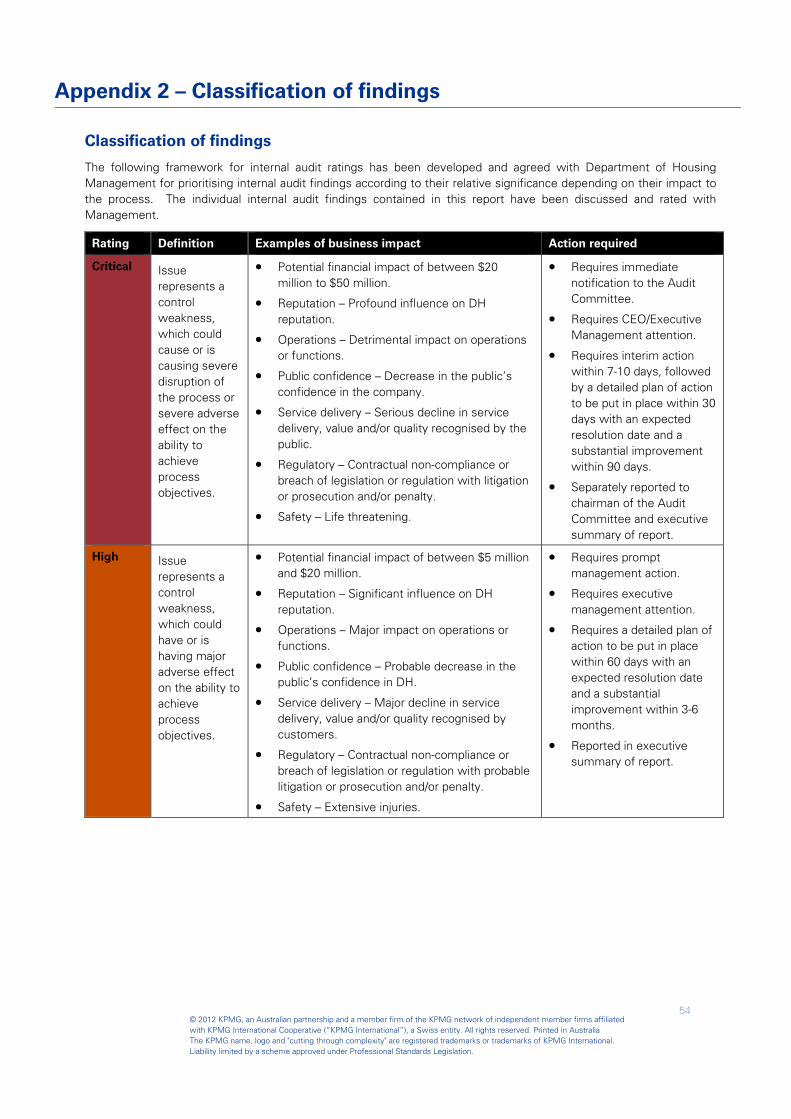
© 2012 KPMG, an Australian partnership and a member firm of the KPMG network of independent member firms affiliated with KPMG International Cooperative (“KPMG International”), a Swiss entity. All rights reserved. Printed in Australia The KPMG name, logo and "cutting through complexity" are registered trademarks or trademarks of KPMG International. Liability limited by a scheme approved under Professional Standards Legislation.
54
Classification of findings
The following framework for internal audit ratings has been developed and agreed with Department of Housing Management for prioritising internal audit findings according to their relative significance depending on their impact to the process. The individual internal audit findings contained in this report have been discussed and rated with Management.
Rating Definition Examples of business impact Action required
Critical Issue represents a control weakness, which could cause or is causing severe disruption of the process or severe adverse effect on the ability to achieve process objectives.
• Potential financial impact of between $20 million to $50 million.
• Reputation – Profound influence on DH reputation.
• Operations – Detrimental impact on operations or functions.
• Public confidence – Decrease in the public’s confidence in the company.
• Service delivery – Serious decline in service delivery, value and/or quality recognised by the public.
• Regulatory – Contractual non-compliance or breach of legislation or regulation with litigation or prosecution and/or penalty.
• Safety – Life threatening.
• Requires immediate notification to the Audit Committee.
• Requires CEO/Executive Management attention.
• Requires interim action within 7-10 days, followed by a detailed plan of action to be put in place within 30 days with an expected resolution date and a substantial improvement within 90 days.
• Separately reported to chairman of the Audit Committee and executive summary of report.
High Issue represents a control weakness, which could have or is having major adverse effect on the ability to achieve process objectives.
• Potential financial impact of between $5 million and $20 million.
• Reputation – Significant influence on DH reputation.
• Operations – Major impact on operations or functions.
• Public confidence – Probable decrease in the public’s confidence in DH.
• Service delivery – Major decline in service delivery, value and/or quality recognised by customers.
• Regulatory – Contractual non-compliance or breach of legislation or regulation with probable litigation or prosecution and/or penalty.
• Safety – Extensive injuries.
• Requires prompt management action.
• Requires executive management attention.
• Requires a detailed plan of action to be put in place within 60 days with an expected resolution date and a substantial improvement within 3-6 months.
• Reported in executive summary of report.
Appendix 2 – Classification of findings

© 2012 KPMG, an Australian partnership and a member firm of the KPMG network of independent member firms affiliated with KPMG International Cooperative (“KPMG International”), a Swiss entity. All rights reserved. Printed in Australia The KPMG name, logo and "cutting through complexity" are registered trademarks or trademarks of KPMG International. Liability limited by a scheme approved under Professional Standards Legislation.
55
Rating Definition Examples of business impact Action required
Moderate Issue represents a control weakness, which could have or is having significant adverse effect on the ability to achieve process objectives.
• Potential financial impact of between $1 million and $5 million.
• Reputation – Moderate impact on DH reputation.
• Operations – Moderate impact on operations or functions.
• Public confidence – Possible decrease in the public’s confidence in DH.
• Service delivery – Moderate decline in service delivery, value and/or quality recognised by customers.
• Regulatory – Contractual non-compliance or breach of legislation or regulation with threat of litigation or prosecution and/or penalty.
• Safety – Medical treatment required.
• Requires short-term management action.
• Requires general management attention.
• Requires a detailed plan of action to be put in place within 90 days with an expected resolution date and a substantial improvement within 6-9 months.
• Reported in executive summary of report.
Low Issue represents a minor control weakness, with minimal but reportable impact on the ability to achieve process objectives.
• Potential financial impact of up to $1 million.
• Reputation – Mild impact on DH reputation.
• Operations – Minor impact on internal business only.
• Public confidence – Should not decrease the public’s confidence in the company.
• Service delivery – Minimal decline in service delivery, value and/or quality recognised by customers.
• Regulatory – Contractual non-compliance or breach of legislation or regulation with unlikely litigation or prosecution and/or penalty.
• Safety – First aid treatment.
• Requires management action within a reasonable time period.
• Requires process manager attention.
• Timeframe for action is subject to competing priorities and cost/benefit analysis, e.g. 9-12 months.
• Reported in detailed findings in report.

© 2012 KPMG, an Australian partnership and a member firm of the KPMG network of independent member firms affiliated with KPMG International Cooperative (“KPMG International”), a Swiss entity. All rights reserved. Printed in Australia The KPMG name, logo and "cutting through complexity" are registered trademarks or trademarks of KPMG International. Liability limited by a scheme approved under Professional Standards Legislation.
56
The following table supports the summary table and figure presented in Section B: Comparison between contracting models.
Note that only those maintenance trade categories where all data (as per the requirements below), could be obtained for both 2009 and 2011 have been included in this analysis.
1.Supporting details for Table 4: Application of zone rate percentages to maintenance spend per trade category:
Baseline maintenance
spend ($) Maintenance
spend in 2009 ($) Maintenance
spend in 2011 ($) (excluding zone rate
percentage) (including zone rate
percentage) (including zone rate
percentage)
Kimberley 75,408.31 203 228,361.49 225 245,077.00 16,715.51
Wheatbelt 30,222.18 159 78,275.44 157 77,671.00 (604.44)
Metropolitan North 385,740.68 106 793,082.85 99 766,081.00 (27,001.85)
Metropolitan South 321,695.38 120 707,729.85 95 627,306.00 (80,423.85)
Metropolitan South East 393,117.94 114 839,962.01 98 779,946.00 (60,016.01)
Albany (Southern) 20,722.99 160 53,879.76 155 52,740.00 (1,139.76)
Bunbury (South West) 61,375.82 133 143,107.96 140 147,437.00 4,329.04
Kalgoorlie Goldfields 31,551.12 163 82,821.69 168 84,557.00 1,735.31
Geraldton (Midwest) 93,885.03 164 247,941.84 139 224,573.00 (23,368.84)
Pilbara 88,528.31 212 275,955.38 230 292,409.00 16,453.62
Total 1,502,247.77 - 3,451,118.27 - 3,297,797.00 (153,321.27)
Kimberley 4,225.23 210 13,098.22 225 13,732.00 633.78
Wheatbelt 2,664.20 152 6,700.47 157 6,847.00 146.53
Metropolitan North 23,701.41 89 44,795.66 99 47,071.00 2,275.34
Metropolitan South 22,991.28 109 47,994.30 95 44,833.00 (3,161.30)
Metropolitan South East 28,799.40 95 56,158.82 98 57,138.00 979.18
Albany (Southern) 1,808.64 136 4,272.92 155 4,603.00 330.08
Bunbury (South West) 6,381.65 112 13,497.19 140 15,330.00 1,832.81
Kalgoorlie Goldfields 3,942.91 160 10,264.71 168 10,567.00 302.29
Geraldton (Midwest) 9,487.46 186 27,099.63 139 22,694.00 (4,405.63)
Pilbara 4,913.11 178 13,633.88 230 16,228.00 2,594.12
Total 108,915.29 - 237,515.80 - 239,043.00 1,527.20
Kimberley 46,917.85 175 129,024.08 225 152,483.00 23,458.92
Wheatbelt 15,419.07 153 39,061.63 157 39,627.00 565.37
Metropolitan North 232,282.98 96 455,739.21 99 461,314.00 5,574.79
Metropolitan South 166,657.95 110 349,981.69 95 324,983.00 (24,998.69)
Metropolitan South East 172,552.42 88 324,398.55 98 342,344.00 17,945.45
Albany (Southern) 14,027.11 134 32,823.44 155 35,699.00 2,875.56
Bunbury (South West) 32,552.24 136 76,769.04 140 78,197.00 1,427.96
Kalgoorlie Goldfields 9,505.22 158 24,523.48 168 25,474.00 950.52
Geraldton (Midwest) 42,242.47 153 107,014.27 139 101,044.00 (5,970.27)
Pilbara 81,006.66 200 243,019.98 230 267,565.00 24,545.02
Total 813,163.98 - 1,782,355.37 - 1,828,730.00 46,374.63
Kimberley 2,878.46 198 8,573.02 225 9,355.00 781.98
Wheatbelt 4,801.95 128 10,948.44 157 12,341.00 1,392.56
Metropolitan North 13,567.98 121 29,985.23 99 26,946.00 (3,039.23)
Metropolitan South 29,623.59 114 63,320.42 95 57,766.00 (5,554.42)
Metropolitan South East 45,950.10 136 108,442.24 98 91,165.00 (17,277.24)
Albany (Southern) 1,105.70 168 2,957.74 155 2,814.00 (143.74)
Bunbury (South West) 10,881.28 138 25,933.71 140 26,139.00 205.29
Kalgoorlie Goldfields 6,785.82 163 17,869.33 168 18,186.00 316.67
Geraldton (Midwest) 17,723.24 168 47,577.06 139 42,394.00 (5,183.06)
Pilbara 6,697.24 224 21,708.64 230 22,121.00 412.36
Total 140,015.36 - 337,315.82 - 309,227.00 (28,088.82)
Zone rate percentage
2009 (%)
Zone rate percentage
2011 (%)
Maintenance Trade Category
Region Difference between
2009 and 2011 ($)
Carpentry
Electrical
Fencing
Cleaning
Appendix 3 – Supporting details of cost comparison calculations
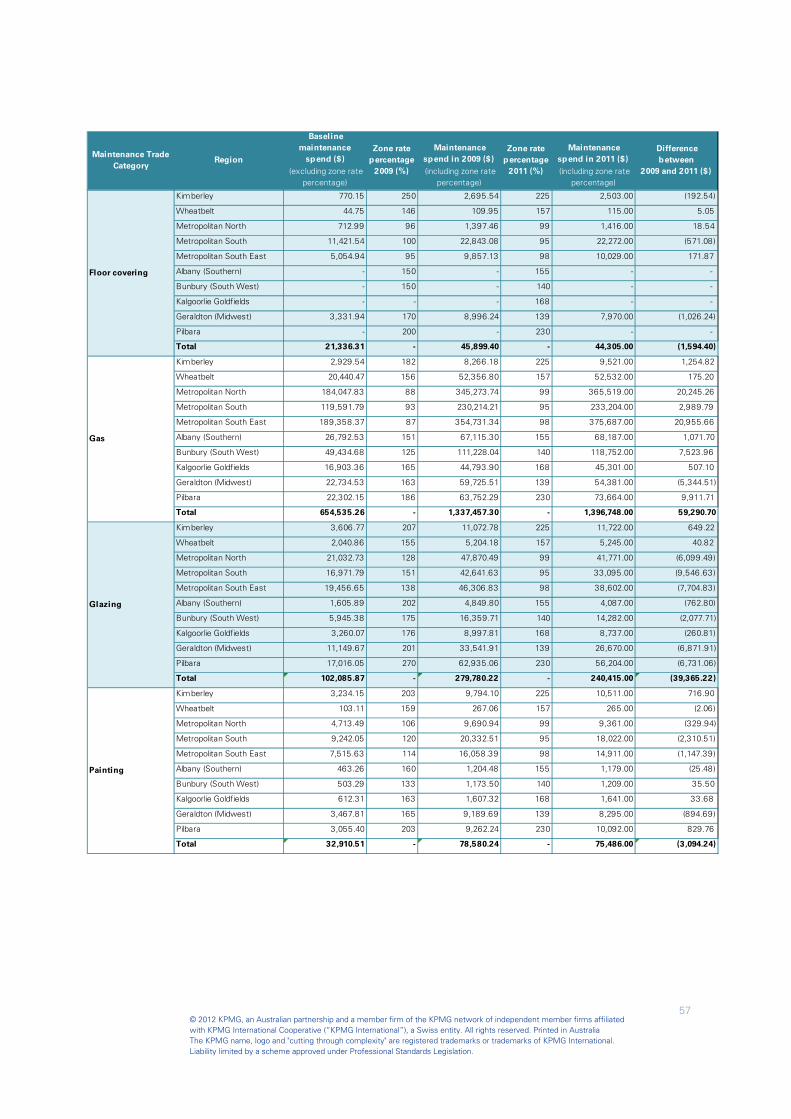
© 2012 KPMG, an Australian partnership and a member firm of the KPMG network of independent member firms affiliated with KPMG International Cooperative (“KPMG International”), a Swiss entity. All rights reserved. Printed in Australia The KPMG name, logo and "cutting through complexity" are registered trademarks or trademarks of KPMG International. Liability limited by a scheme approved under Professional Standards Legislation.
57
Baseline maintenance
spend ($) Maintenance
spend in 2009 ($) Maintenance
spend in 2011 ($) (excluding zone rate
percentage) (including zone rate
percentage) (including zone rate
percentage)
Zone rate percentage
2009 (%)
Zone rate percentage
2011 (%)
Maintenance Trade Category
Region Difference between
2009 and 2011 ($)
Kimberley 770.15 250 2,695.54 225 2,503.00 (192.54)
Wheatbelt 44.75 146 109.95 157 115.00 5.05
Metropolitan North 712.99 96 1,397.46 99 1,416.00 18.54
Metropolitan South 11,421.54 100 22,843.08 95 22,272.00 (571.08)
Metropolitan South East 5,054.94 95 9,857.13 98 10,029.00 171.87
Albany (Southern) - 150 - 155 - -
Bunbury (South West) - 150 - 140 - -
Kalgoorlie Goldfields - - - 168 - -
Geraldton (Midwest) 3,331.94 170 8,996.24 139 7,970.00 (1,026.24)
Pilbara - 200 - 230 - -
Total 21,336.31 - 45,899.40 - 44,305.00 (1,594.40)
Kimberley 2,929.54 182 8,266.18 225 9,521.00 1,254.82
Wheatbelt 20,440.47 156 52,356.80 157 52,532.00 175.20
Metropolitan North 184,047.83 88 345,273.74 99 365,519.00 20,245.26
Metropolitan South 119,591.79 93 230,214.21 95 233,204.00 2,989.79
Metropolitan South East 189,358.37 87 354,731.34 98 375,687.00 20,955.66
Albany (Southern) 26,792.53 151 67,115.30 155 68,187.00 1,071.70
Bunbury (South West) 49,434.68 125 111,228.04 140 118,752.00 7,523.96
Kalgoorlie Goldfields 16,903.36 165 44,793.90 168 45,301.00 507.10
Geraldton (Midwest) 22,734.53 163 59,725.51 139 54,381.00 (5,344.51)
Pilbara 22,302.15 186 63,752.29 230 73,664.00 9,911.71
Total 654,535.26 - 1,337,457.30 - 1,396,748.00 59,290.70
Kimberley 3,606.77 207 11,072.78 225 11,722.00 649.22
Wheatbelt 2,040.86 155 5,204.18 157 5,245.00 40.82
Metropolitan North 21,032.73 128 47,870.49 99 41,771.00 (6,099.49)
Metropolitan South 16,971.79 151 42,641.63 95 33,095.00 (9,546.63)
Metropolitan South East 19,456.65 138 46,306.83 98 38,602.00 (7,704.83)
Albany (Southern) 1,605.89 202 4,849.80 155 4,087.00 (762.80)
Bunbury (South West) 5,945.38 175 16,359.71 140 14,282.00 (2,077.71)
Kalgoorlie Goldfields 3,260.07 176 8,997.81 168 8,737.00 (260.81)
Geraldton (Midwest) 11,149.67 201 33,541.91 139 26,670.00 (6,871.91)
Pilbara 17,016.05 270 62,935.06 230 56,204.00 (6,731.06)
Total 102,085.87 - 279,780.22 - 240,415.00 (39,365.22)
Kimberley 3,234.15 203 9,794.10 225 10,511.00 716.90
Wheatbelt 103.11 159 267.06 157 265.00 (2.06)
Metropolitan North 4,713.49 106 9,690.94 99 9,361.00 (329.94)
Metropolitan South 9,242.05 120 20,332.51 95 18,022.00 (2,310.51)
Metropolitan South East 7,515.63 114 16,058.39 98 14,911.00 (1,147.39)
Albany (Southern) 463.26 160 1,204.48 155 1,179.00 (25.48)
Bunbury (South West) 503.29 133 1,173.50 140 1,209.00 35.50
Kalgoorlie Goldfields 612.31 163 1,607.32 168 1,641.00 33.68
Geraldton (Midwest) 3,467.81 165 9,189.69 139 8,295.00 (894.69)
Pilbara 3,055.40 203 9,262.24 230 10,092.00 829.76
Total 32,910.51 - 78,580.24 - 75,486.00 (3,094.24)
Floor covering
Gas
Glazing
Painting

© 2012 KPMG, an Australian partnership and a member firm of the KPMG network of independent member firms affiliated with KPMG International Cooperative (“KPMG International”), a Swiss entity. All rights reserved. Printed in Australia The KPMG name, logo and "cutting through complexity" are registered trademarks or trademarks of KPMG International. Liability limited by a scheme approved under Professional Standards Legislation.
58
Kimberley 17,543.38 139 41,870.21 225 57,016.00 15,145.79
Wheatbelt 4,365.37 137 10,352.16 157 11,219.00 866.84
Metropolitan North 40,510.57 80 72,919.03 99 80,454.00 7,534.97
Metropolitan South 18,005.13 80 32,409.23 95 35,110.00 2,700.77
Metropolitan South East 26,308.47 87 49,109.14 98 52,196.00 3,086.86
Albany (Southern) 928.09 155 2,366.64 155 2,362.00 (4.64)
Bunbury (South West) 5,692.28 100 11,384.56 140 13,674.00 2,289.44
Kalgoorlie Goldfields 6,001.12 128 13,692.55 168 16,083.00 2,390.45
Geraldton (Midwest) 16,887.96 115 36,309.11 139 40,396.00 4,086.89
Pilbara 7,862.85 127 17,859.91 230 25,971.00 8,111.09
Total 144,105.23 - 288,272.56 - 334,481.00 46,208.44
Kimberley 15,717.54 182 44,349.65 225 51,082.00 6,732.35
Wheatbelt 21,607.39 164 57,043.52 157 55,531.00 (1,512.52)
Metropolitan North 357,199.40 88 670,106.07 99 709,398.00 39,291.93
Metropolitan South 169,178.46 93 325,668.54 95 329,898.00 4,229.46
Metropolitan South East 243,888.61 87 456,884.66 98 483,875.00 26,990.34
Albany (Southern) 29,109.63 151 72,919.61 155 74,084.00 1,164.39
Bunbury (South West) 53,090.08 125 119,452.69 140 127,533.00 8,080.31
Kalgoorlie Goldfields 24,658.58 165 65,345.24 168 66,085.00 739.76
Geraldton (Midwest) 55,479.93 163 145,750.41 139 132,708.00 (13,042.41)
Pilbara 125,943.38 186 360,018.16 230 415,991.00 55,972.84
Total 1,095,873.01 - 2,317,538.55 - 2,446,185.00 128,646.45
Kimberley 33,309.85 138 79,110.88 225 108,257.00 29,146.12
Wheatbelt 4,760.31 135 11,162.93 157 12,234.00 1,071.07
Metropolitan North 67,478.35 110 141,535.84 99 134,012.00 (7,523.84)
Metropolitan South 56,286.15 125 126,643.85 95 109,758.00 (16,885.85)
Metropolitan South East 118,889.62 115 255,612.68 98 235,877.00 (19,735.68)
Albany (Southern) 15,060.12 159 39,055.91 155 38,328.00 (727.91)
Bunbury (South West) 14,664.47 138 34,842.79 140 35,227.00 384.21
Kalgoorlie Goldfields 349.63 130 804.14 168 937.00 132.86
Geraldton (Midwest) 28,300.59 120 62,261.29 139 67,695.00 5,433.71
Pilbara 4,169.54 189 12,039.55 230 13,772.00 1,732.45
Total 343,268.62 - 763,069.85 - 756,097.00 (6,972.85)
Kimberley 971.08 210 3,010.34 225 3,156.00 145.66
Wheatbelt 680.54 210 2,109.69 157 1,749.00 (360.69)
Metropolitan North 48,399.80 132 112,287.53 99 96,122.00 (16,165.53)
Metropolitan South 10,116.41 99 20,106.37 95 19,727.00 (379.37)
Metropolitan South East 17,483.37 93 33,801.18 98 34,687.00 885.82
Albany (Southern) - - - 155 - -
Bunbury (South West) 4,525.02 120 9,955.04 140 10,870.00 914.96
Kalgoorlie Goldfields 1,509.70 167 4,025.87 168 4,046.00 20.13
Geraldton (Midwest) 1,807.69 164 4,763.27 139 4,324.00 (439.27)
Pilbara 1,716.92 201 5,164.51 230 5,671.00 506.49
Total 87,210.53 - 195,223.79 - 180,352.00 (14,871.79)
5,045,667.74 - 11,114,127.17 - 11,148,866.00 34,738.83
0.31%Grand Total
Pest control
Plumbing
Tree management
Reticulation
Baseline maintenance
spend ($) Maintenance
spend in 2009 ($) Maintenance
spend in 2011 ($) (excluding zone rate
percentage) (including zone rate
percentage) (including zone rate
percentage)
Zone rate percentage
2009 (%)
Zone rate percentage
2011 (%)
Maintenance Trade Category
Region Difference between
2009 and 2011 ($)