intermediate access to buffer-separated managed lanes · intermediate access to buffer-separated...
TRANSCRIPT

Technical Report Documentation Page 1. Report No. FHWA/TX-07/0-5547-1
2. Government Accession No.
3. Recipient's Catalog No.
4. Title and Subtitle INTERMEDIATE ACCESS TO BUFFER-SEPARATED MANAGED LANES
5. Report Date September 2006 Resubmitted: November 2006 Resubmitted: February 2007 Published: March 2007
6. Performing Organization Code
7. Author(s) Kay Fitzpatrick, Marcus A. Brewer, and Eun Sug Park
8. Performing Organization Report No. Report 0-5547-1 10. Work Unit No. (TRAIS)
9. Performing Organization Name and Address Texas Transportation Institute The Texas A&M University System College Station, Texas 77843-3135
11. Contract or Grant No. Project 0-5547 13. Type of Report and Period Covered Technical Report: September 2005-August 2006
12. Sponsoring Agency Name and Address Texas Department of Transportation Research and Technology Implementation Office P. O. Box 5080 Austin, Texas 78763-5080
14. Sponsoring Agency Code
15. Supplementary Notes Project performed in cooperation with the Texas Department of Transportation and the Federal Highway Administration. Project Title: Best Practices for Access between Toll Lanes and Free Lanes URL: http://tti.tamu.edu/documents/0-5547-1.pdf 16. Abstract The objective of this Texas Department of Transportation (TxDOT) research project was to develop guidance materials on intermediate access to a buffer-separated toll lane. To develop the material, researchers gathered other state guidelines, reviewed the literature, and recorded operations at five intermediate access sites. From videotapes of the sites, characteristics of approximately 8400 vehicles that moved into or out of the managed lane were recorded. Examples of the characteristics measured included where the vehicle entered or left the lane (early, within the opening, or late) and the lane of origin for the vehicle. Volume counts for 5-minute periods were associated with each maneuver. Approximately 9 percent of the vehicles crossed the solid white markings (i.e., were not in compliance with the pavement markings). Compliance was better for the longer access opening length (1500 ft) as compared to the 1160-ft access opening length. A surprisingly large number of maneuvers at the intermediate access openings (over 7 percent) involve vehicles passing slower-moving vehicles. At the two sites with the larger quantity of data between 40 and 80 percent of the passing vehicles involved a vehicle leaving the managed lane to pass a slower-moving managed-lane vehicle. Findings from one field site demonstrated that when presented with the opportunity to enter a managed lane that is located very close to an entrance ramp, drivers will attempt to cross multiple lanes to do so. 17. Key Words Intermediate Access, Managed Lanes, Buffer Separation, Weaving Maneuvers
18. Distribution Statement No restrictions. This document is available to the public through NTIS: National Technical Information Service Springfield, Virginia 22161 http://www.ntis.gov
19. Security Classif.(of this report) Unclassified
20. Security Classif.(of this page) Unclassified
21. No. of Pages 106
22. Price
Form DOT F 1700.7 (8-72) Reproduction of completed page authorized


INTERMEDIATE ACCESS TO BUFFER-SEPARATED MANAGED LANES
by
Kay Fitzpatrick, Ph.D., P.E. Research Engineer
Texas Transportation Institute
Marcus A. Brewer, P.E. Assistant Research Engineer
Texas Transportation Institute
and
Eun Sug Park, Ph.D. Associate Research Scientist
Texas Transportation Institute
Report 0-5547-1 Project 0-5547
Project Title: Best Practices for Access between Toll Lanes and Free Lanes
Performed in cooperation with the Texas Department of Transportation
and the Federal Highway Administration
September 2006
Resubmitted: November 2006 Resubmitted: February 2007
Published: March 2007
TEXAS TRANSPORTATION INSTITUTE The Texas A&M University System College Station, Texas 77843-3135


v
DISCLAIMER
The contents of this report reflect the views of the authors, who are responsible for the
facts and the accuracy of the data presented herein. The contents do not necessarily reflect the
official view or policies of the Federal Highway Administration (FHWA) or the Texas
Department of Transportation. This report does not constitute a standard, specification, or
regulation. The engineer in charge was Kay Fitzpatrick, P.E. (TX-86762).

vi
ACKNOWLEDGMENTS
This project was conducted in cooperation with TxDOT and FHWA.
The authors thank the members of TxDOT’s Project Monitoring Committee for their
guidance during the study:
• Joseph Carrizales, Austin District, TxDOT, Project Director
• Bob Daigh, Austin District, TxDOT, Program Coordinator
• Christine Conner, Austin District, Project Advisor
• Linda Blume-Grimsely, San Antonio District, Project Advisor
• Wade Odell, Research and Technology Implementation Office, TxDOT, Research
Engineer
The following individuals assisted the research team in identifying sites or in
coordinating the data collection at a specific site. Their assistance contributed to the success of
this project and their aid is greatly appreciated:
• Jim Mims – Project Manager, Waller/West Harris Area Office, TxDOT Houston
District
• Daniel Loving – ITS Analyst, DalTrans Traffic Management Center, TxDOT Dallas
District
• Deborah Allen – Control Center Operator, DalTrans Traffic Management Center,
TxDOT Dallas District
• Rick Cortez – Freeway Management Engineer, DalTrans Traffic Management Center,
TxDOT Dallas District
• Nick Thompson – Operations Manager, Minnesota Department of Transportation
(MnDOT)
• Grant Schultz – Assistant Professor, Brigham Young University
• David Schwartz – Utah Department of Transportation, Region 2

vii
The following TxDOT personnel assisted the research team with reviews of the pavement
markings proposed for the guidelines. Their assistance in understanding the tradeoffs between
different markings is appreciated:
• Michael Chacon, Traffic Operations Division, TxDOT
• Doug Skowronek, Traffic Operations Division, TxDOT
Assisting the authors of the report in collecting and reducing data or in analyzing the data
were the following Texas Transportation Institute (TTI) staff:
• Sara Roby, Student Worker
• Curtis White, Student Worker
• Ivan Lorenz, Associate Research Specialist
• Todd Hausman, Associate Research Specialist
• Jim Carvell, Senior Research Engineer
• Ginger Goodin, Research Engineer

viii

ix
TABLE OF CONTENTS LIST OF FIGURES ..................................................................................................................... xi LIST OF TABLES ..................................................................................................................... xiii CHAPTER 1 INTRODUCTION................................................................................................ 1
RESEARCH OBJECTIVES ....................................................................................................... 2 ORGANIZATION ...................................................................................................................... 3
CHAPTER 2 REVIEW OF PREVIOUS RESEARCH............................................................ 5 BACKGROUND ........................................................................................................................ 5 TYPES OF ACCESS TO AND FROM MANAGED LANES .................................................. 6
Continuous Access.................................................................................................................. 6 Restricted Access – Terminal ................................................................................................. 6 Restricted Access – Intermediate............................................................................................ 7
SAFETY ................................................................................................................................... 10 DESIGN OF INTERMEDIATE MANAGED-LANE ACCESS ............................................. 12
Buffer Opening ..................................................................................................................... 12 Buffer Width ......................................................................................................................... 15
TRAFFIC CONTROL FOR ACCESS ..................................................................................... 16 Signing .................................................................................................................................. 16 Markings ............................................................................................................................... 18
LOCATION OF ACCESS WITH RESPECT TO OTHER RAMPS ....................................... 19 CHAPTER 3 COLLECTION OF FIELD DATA................................................................... 23
SITE SELECTION AND EVALUATION............................................................................... 23 MANEUVERS DATA COLLECTION ................................................................................... 26
Data Collection with Camcorders......................................................................................... 26 Data Collection with TMC Cameras..................................................................................... 36
SPEED DATA COLLECTION ................................................................................................ 38 CHAPTER 4 REDUCTION OF FIELD DATA ..................................................................... 41
MANEUVERS DATA.............................................................................................................. 41 Maneuver Characteristics...................................................................................................... 42 Summary Tables ................................................................................................................... 46
TRAFFIC VOLUME COUNTS............................................................................................... 46 SPEED DATA .......................................................................................................................... 47
Verification of Accuracy....................................................................................................... 48 VEHICLE POSITION IN LANE DATA ................................................................................. 48
CHAPTER 5 FINDINGS FROM FIELD STUDIES.............................................................. 51 MANEUVERS.......................................................................................................................... 51
Compliance with Respect to Access Opening Length.......................................................... 52 Abort Maneuvers .................................................................................................................. 59 Passing Maneuvers................................................................................................................ 60 Maneuver Time..................................................................................................................... 64
USE OF TURN SIGNAL ......................................................................................................... 67 SPEED ...................................................................................................................................... 68
Comparison of Speeds between Lane 4 and HOV Lane....................................................... 69 Time of Day .......................................................................................................................... 70 Influence of Congestion and Incidents ................................................................................. 72

x
LOCATION OF ACCESS WITH RESPECT TO ENTRANCE RAMP ................................. 73 VEHICLE POSITION WITHIN LANE................................................................................... 78
CHAPTER 6 SUMMARY AND CONCLUSIONS................................................................. 83 SUMMARY OF RESEARCH.................................................................................................. 83 CONCLUSIONS....................................................................................................................... 84
Maneuvers............................................................................................................................. 84 Passing Maneuvers................................................................................................................ 85 Maneuver Time..................................................................................................................... 85 Location of Access with Respect to Other Ramps................................................................ 86 Vehicle Position within Lane................................................................................................ 86
APPENDIX GUIDELINES....................................................................................................... 89 REFERENCES............................................................................................................................ 91

xi
LIST OF FIGURES Figure 1-1. Examples of Separations between Managed Lanes and General-Purpose Lanes. ...... 1 Figure 1-2. Examples of At-Grade Access to Managed Lanes Located within General-
Purpose Lanes. ........................................................................................................... 2 Figure 2-1. Example of Layouts for Managed Lane Entry Terminal with Slip Ramps (from
Managed Lanes Handbook) (1). ................................................................................ 7 Figure 2-2. Buffer-Separated Intermediate Access with and without Weave Lane (from
Managed Lanes Handbook) (1). ................................................................................ 8 Figure 2-3. Arrangements for Successive Ramps from TxDOT Roadway Design Manual
(Reproduction of Roadway Design Manual Figure 3-37) (3).................................. 10 Figure 2-4. Utah I-15 Express Lane Access Design (7, 8). ......................................................... 13 Figure 2-5. Photograph of I-15 Express Lane Opening Transition in Salt Lake City. ................ 14 Figure 2-6. Photograph of I-15 Express Lane Opening in Salt Lake City................................... 14 Figure 2-7. Caltrans Weave Distance at Buffer-Separated HOV Facilities (2). .......................... 15 Figure 2-8. Example of a Section of the I-394 HOT Lane in Minneapolis (10).......................... 16 Figure 2-9. Example of Signing for the Intermediate Entry to and Exit from Barrier- or
Buffer-Separated HOV Lanes (Reproduction of TMUTCD Figure 2E-47) (11). ... 17 Figure 2-10. Example of Striping Pattern for an HOV Lane (12). .............................................. 18 Figure 2-11. Excerpts from TxDOT Typical Standards for Freeway Pavement Markings,
FPM(2)-00A (13). .................................................................................................... 19 Figure 2-12. Termination of Managed Lane as a “Free” Lane to Inside (1). .............................. 20 Figure 3-1. HOV Lanes in Dallas. ............................................................................................... 24 Figure 3-2. HOV Lanes in Houston............................................................................................. 25 Figure 3-3. HOT Lane Access Point on I-394 EB at US-169, Minneapolis, MN. ...................... 26 Figure 3-4. Camcorder Installation at Site 1................................................................................ 28 Figure 3-5. Camcorder Installation at Site 3................................................................................ 29 Figure 3-6. Camcorder Field of View at Site 3............................................................................ 29 Figure 3-7. Closed Median Area on I-10 Near Sites 4 and 5....................................................... 30 Figure 3-8. Camcorder Field of View at Sites 4 and 5. ............................................................... 30 Figure 3-9. I-635 (LBJ Freeway) WB HOV Lane Access at Rosser........................................... 31 Figure 3-10. I-35E (Stemmons Freeway) NB HOV Lane Access at Whitlock. .......................... 32 Figure 3-11. I-10 (Katy Freeway) EB HOV Lane Access at Fry Road....................................... 33 Figure 3-12. I-10 (Katy Freeway) EB HOV Lane Access at Barker-Cypress............................. 34 Figure 3-13. I-394 EB HOV Lane Access at US-169.................................................................. 35 Figure 3-14. Image from Dallas TMC Camera on I-635 EB at Josey (18). ................................ 36 Figure 3-15. Image from MnDOT Camera on I-394 EB at US-169, Minneapolis, MN (19)...... 37 Figure 3-16. Spot Speed Data Collection at Site 1. ..................................................................... 38 Figure 3-17. Spot Speed and Distance Readout from Laser Gun at Site 1.................................. 39 Figure 4-1. Sample Image of Video for Maneuvers Data............................................................ 43 Figure 4-2. Division of Access Opening and Lane Assignments at Site 1. ................................. 44 Figure 4-3. Example of Shifting Vehicle Position in HOV Lane Near Access Opening. ........... 49 Figure 4-4. Example of Shifting Vehicle Position in Adjacent General-Purpose Lane Near
Access Opening. ...................................................................................................... 50 Figure 5-1. Mosaic Plot of Proportion of Maneuvers by Zone.................................................... 54

xii
Figure 5-2. Mosaic Plot of Proportion of Maneuver by Zone for Sites with 1100, 1160, and 1500 ft Access Opening Lengths. ..................................................................... 57
Figure 5-3. Mosaic Plot of Proportion of Maneuver by Compliance for Sites with 1160 and 1500 ft Access Opening Lengths. ..................................................................... 58
Figure 5-4. Percent of Maneuvers Involving a Pass or Abort...................................................... 61 Figure 5-5. Proportion of Passing Vehicles to 5-Minute HOV Lane Volume............................. 63 Figure 5-6. Proportion of Passing Vehicles to 5-Minute Adjacent General-Purpose Lane
Volume..................................................................................................................... 64 Figure 5-7. Percent of Maneuvers for Different Maneuver Times by 5-Minute HOV
Lane Count............................................................................................................... 66 Figure 5-8. Percent of Maneuvers for Different Maneuver Times by 5-Minute Adjacent
Lane Count............................................................................................................... 67 Figure 5-9. Use of Turn Signal. ................................................................................................... 68 Figure 5-10. Individual Speeds in Lane 4 by Time of Day. ........................................................ 71 Figure 5-11. Individual Speeds in the HOV Lane by Time of Day............................................. 71 Figure 5-12. Example of Cross-Facility Weave from Ramp to HOV Lane. ............................... 74 Figure 5-13. 85th Percentile Speeds on Lane 4 and HOV Lane during Ramp-to-HOV Lane
Maneuvers................................................................................................................ 77 Figure 5-14. Vehicle Location When Dataset Contains Only Passenger Cars. ........................... 79 Figure 5-15. Vehicle Location When Dataset Contains Heavy Trucks in Lane 4....................... 81 Figure A-1. Intermediate Access Opening................................................................................... 90

xiii
LIST OF TABLES Table 2-1. Weaving Distances for Managed Lane Cross-Freeway Maneuvers from
Managed Lanes Handbook (1). ................................................................................. 20 Table 3-1. Summary of Maneuvers Data Collected..................................................................... 27 Table 4-1. Summary of Site Characteristics. ............................................................................... 42 Table 4-2. Sample of Spreadsheet Containing Reduced Maneuvers Data. ................................. 45 Table 4-3. Summary of Maneuvers Data Reduced...................................................................... 46 Table 4-4. Summary of Speed Data Collected............................................................................. 47 Table 4-5. Sample of Reduced and Formatted Speed Data. ........................................................ 48 Table 5-1. Number of Maneuvers by Site.................................................................................... 52 Table 5-2. Number of Maneuvers by Site and by Zone............................................................... 53 Table 5-3. Results from Evaluation of Access Zones Difference for All Sites. .......................... 55 Table 5-4. Results from Evaluation of Access Zones Difference for Sites with 1100,
1160, and 1500 ft Access Opening Lengths.............................................................. 56 Table 5-5. Results from Evaluation of Compliance Difference for Sites with 1160 and
1500 ft Access Opening Lengths............................................................................... 59 Table 5-6. Percent of Passing Vehicles........................................................................................ 60 Table 5-7. Results from Logistic Evaluation of Passing Probability........................................... 62 Table 5-8. Average Maneuver Time per Site and Lane Origin. .................................................. 65 Table 5-9. Number of Vehicles included in Speed Datasets. ...................................................... 68 Table 5-10. Comparison of Speed Data for May 8 Off-Peak Period........................................... 69 Table 5-11. Comparison of Speed Data for May 8 PM Peak Period........................................... 70 Table 5-12. Comparison of Behavior during High- and Low-Speed Periods.............................. 73 Table 5-13. Number of Vehicles Weaving from Ramp to HOV Lane Observed during
Study.......................................................................................................................... 75 Table 5-14. Approximate Distance Traveled by Ramp Vehicle Entering HOV Lane. ............... 76 Table 5-15. Vehicle Counts during Ramp-to-HOV Lane Maneuvers. ........................................ 78 Table 5-16. Vehicle Location within Lanes When Dataset Contains Only Passenger Cars........ 79 Table 5-17. Vehicle Location within Lanes When Dataset Contains Heavy Trucks in
Lane 4. ....................................................................................................................... 81

xiv

1
CHAPTER 1
INTRODUCTION
Agencies have installed various types of treatments to separate interior managed lanes
from general-purpose lanes at existing projects (see Figure 1-1) and are looking at options for
future projects. Interior managed lanes can include high-occupancy vehicle (HOV) lanes, toll
lanes, and high occupancy toll (HOT) lanes. The treatments to separate the managed lanes from
the general-purpose lanes must include access points, they must control traffic, and they must
perform at an acceptable level of safety. Some of the treatments are more costly in construction
or maintenance, while others are a hindrance to emergency access. The aesthetics of the
treatment along with their cross section needs are other factors considered during selection.
(a) Barrier Separation (b) Pylon Separation
(c) Solid Line Separation (d) Dashed Line Separation Figure 1-1. Examples of Separations between Managed Lanes and General-Purpose Lanes.

2
Access to these interior managed lanes has been achieved using elevated ramps and at-
grade ramps. At-grade access includes intermediate access and slip ramp terminal access with
examples shown in Figure 1-2. In this project the research focused on the investigation of
intermediate at-grade access. Previous work has investigated when a direct access ramp should
be considered rather than an at-grade access point. At-grade access is also more in concert with
the use of delineators and pavement markings as separators rather than raised concrete barriers.
(a) Intermediate Access (b) Slip Ramp Access Figure 1-2. Examples of At-Grade Access to Managed Lanes Located within General-
Purpose Lanes. RESEARCH OBJECTIVES
The objective of the project was to develop guidance suitable for use by an engineer or
designer in decisions related to providing access to and from toll lanes located within general-
purpose lanes (GPL). The Appendix of this report includes draft materials that could be
incorporated into a TxDOT publication.
Additional objectives for this research project that supported the development of
guidance material included the following:
• Identify the location where drivers are entering or exiting a managed lane located
within general-purpose lanes.

3
• Determine whether the location where the vehicle is entering or exiting varies as a
function of access opening length, type of maneuver, or amount of traffic present.
• Record speed performance of drivers near an access to an internal high-occupancy
vehicle lane.
• Comment on vehicle placement within a lane and whether that placement is affected
by the markings present.
• Comment on the behavior of drivers moving from an entrance ramp across several
lanes to enter an HOV lane at a selected site.
ORGANIZATION
The research findings are presented in six chapters, including this chapter, and the
Appendix. A brief summary of the material in each chapter follows:
• Chapter 1: Introduction contains a brief overview of the project. It also explains the
research objectives and provides an overview of the contents of the report.
• Chapter 2: Review of Previous Research presents a summary of previous work.
• Chapter 3: Collection of Field Data discusses the methodology used to collect the
field data.
• Chapter 4: Reduction of Field Data presents the procedure used to create the
datasets used in the evaluations.
• Chapter 5: Findings from Field Studies presents the results from analyzing the
data obtained during field studies.
• Chapter 6: Summary and Conclusions summarizes the project and presents the
conclusions from the project.
• Appendix: Guidelines present draft materials that can be included in TxDOT
publications or the Managed Lanes Handbook (1).

4

5
CHAPTER 2
REVIEW OF PREVIOUS RESEARCH
BACKGROUND
In this project the research focused on the investigation of issues associated with
intermediate at-grade access. At-grade access is more in concert with the use of delineators and
pavement markings as separators. Within this portion of the project, researchers reviewed
existing literature and design guidelines to determine the state-of-the-practice regarding
intermediate access to and from toll lanes.
The number of toll lanes adjacent to or within general-purpose lanes in the United States
is very small, and there were none in Texas at the time of this research project. Also, stand-alone
toll facilities do not provide the same interaction with vehicles because of their separated
construction. However, many of the operational characteristics of adjacent HOV lanes are
similar to those of toll lanes within general-purpose lanes; therefore, much of the information
presented here is from HOV lane sources.
The types of information gathered by the research team included:
• General characteristics for similar types of access for HOV and toll lanes.
• Safety of HOV lanes.
• Design characteristics of intermediate access including:
o buffer opening length, and
o buffer width.
• Traffic control needs for intermediate access by:
o signing, and
o markings.
Following is a summary of information currently known on the topics listed above.

6
TYPES OF ACCESS TO AND FROM MANAGED LANES
There are two general approaches to providing access: at-grade access and grade-
separated access. This research project did not investigate grade-separated access issues. At-
grade access represents the most commonly used treatment with concurrent-flow managed lanes.
At-grade access can occur at the start or end of the managed lane or at some midpoint along the
facility. Within the facility, the access can be:
• unrestricted or unlimited (continuous) access, or
• restricted or limited access.
Continuous Access
Continuous access allows eligible vehicles to enter and leave the lane at any point. No
weave, acceleration, or deceleration lane is provided. The striping used to separate the general-
purpose and the managed lanes, along with signing and pavement markings, should all indicate
that access can occur at any point. The unlimited access concept is used in projects where no
buffer separates the managed lane and the general-purpose lanes.
Restricted Access – Terminal
Restricted or limited access regulates the locations where vehicles can enter and leave a
managed lane. Slip ramps are typically used at terminals, particularly with barrier-separated
facilities. One benefit of slip ramps is that they provide for ingress or egress but not for both
movements at the same location, eliminating the need to weave traffic in both directions.
Figure 2-1 provides examples of entrance and exit locations with slip ramps from the Managed
Lanes Handbook (1).
The Managed Lanes Handbook recommends that a managed lane continue as a general-
purpose lane when terminated. If the managed lane volumes do not exceed 1000 vehicles per
hour, a merge area of approximately 1500 ft downstream of the slip ramp may be acceptable but
effects on the general-purpose lanes should be checked. It should also be noted that the merge

7
tapers in design are desirably 115:1 with a minimum of 60:1, and diverge tapers are desirably
50:1 with a minimum of 20:1.
Entrances to the managed-lane facility are to be designed as lane changes to prevent
motorists from entering the facility unintentionally.
Paint Stripe or BufferShoulder ShoulderManaged Lane
FreewayFreeway
Freeway
Varies1000 ft
[305 m] Min.
20:1 or Standard Exit Ramp Taper
Varies, 720 ft [219 m] Min.
115:1115:1 Desirable60:1 Minimum
Example of Entrance to Concurrent-Flow Managed Lane
*
Barrier
ShoulderShoulderManaged LaneMerge Lane
Freeway
2500 ft [762 m] Min.600 ft [183 m]Varies, 720 ft [219 m] Min.
115:1115:1 desirable
60:1 minimum 50:1
Example of Exit from Concurrent-Flow Managed Lane
* Or Standard Entrance Ramp Taper
Paint Stripe or Buffer
Figure 2-1. Example of Layouts for Managed Lane Entry Terminal with Slip Ramps (from Managed Lanes Handbook) (1).
Restricted Access – Intermediate
With restricted access and an intermediate location, the same section may accommodate
both those moving into the managed lane and those leaving the managed lane. In some
situations, however, only ingress or only egress may be allowed. A special weave or
acceleration or deceleration lane is typically not provided since it is assumed that the vehicles are
generally moving at the same speed. An opening or merge area of 1300 to 1500 ft has been

8
recommended in previous publications (1). Figure 2-2 illustrates a schematic for a buffer-
separated option with and without a weave lane.
CLMedianBarrier
Shoulder
Mixed Flow
Weave Lane
Shoulder
80:1 Min.Buffer
80:1 Min.
Varies Varies
Same Design Can Be Used in Opposite Direction
BUFFER-SEPARATED OPTION (WEAVE LANE)
50:1 50:1
1300 ft [400 m] Min.
Managed HOV Lane
4 ft[1.2 m] 12 ft
[3.6 m]12 ft
[3.6 m] Buffer 4 ft[1.2 m]
4000 ft Varies [1220 m]
CLBufferMedian
Barrier
30:1 20:1
Mixed Flow
BUFFER-SEPARATED OPTION (NO WEAVE LANE)
Managed HOV Lane
Same Design Can Be Used in Opposite Direction
Buffer4 ft[1.2 m] Buffer 4 ft
[1.2 m]
1300 ft [400 m] Min.
Figure 2-2. Buffer-Separated Intermediate Access with and without Weave Lane (from
Managed Lanes Handbook) (1).
The California Department of Transportation (Caltrans) provides information on
ingress/egress for buffer-separated facilities in their 2003 update to their High-Occupancy
Vehicle Guidelines for Planning, Design and Operations (2). They also provide the following on
where to locate at-grade access:
“At-grade access is not intended to serve every on and off-ramp. When it is operationally possible, ingress and egress locations are based on the following criteria:
1. To serve every freeway-to-freeway connection. 2. To serve high volume ramps.

9
3. Ramps with high number of carpools. 4. When adjacent to park and ride facilities. 5. When requested by transit districts. 6. To assist in the modification of local commute patterns (may be at local
request). 7. To help balance and optimize interchange operational level of service
(LOS) within a local jurisdiction, within a corridor, or within a region. 8. To support and encourage ride sharing programs (HOV demand/usage).
As applied to the buffer-separated facilities, ingress and egress are relative to the origin and destination patterns of HOVs. If the majority of HOVs originate upstream and have destinations downstream of the facility, they will all use the lane facility and there will be little impact related to intermediate access points. However, intermediate access points will allow fuller use of the facility. The operation of weaving sections needs to be considered.”
The type of weaving that occurs when an exit ramp closely follows an entrance ramp may
be similar enough to the type of weaving expected at an intermediate access opening that its
guidelines may be appropriate. The minimum acceptable distance between ramps is dependent
upon the merge, diverge, and weaving operations that take place between ramps as well as
distances required for signing. The TxDOT Roadway Design Manual states that the Highway
Capacity Manual is to be used for analysis of these requirements (3, 4). A figure (reproduced as
Figure 2-3) is provided in the Roadway Design Manual to show the minimum distances between
ramps for various ramp configurations. Key dimensions are:
Entrance Ramp Followed by Exit Ramp (see Figure 2-3 for control points)
• Minimum weaving length without auxiliary lane equals 2000 ft
• Minimum weaving length with auxiliary lane equals 1500 ft
Exit Ramp Followed by Exit Ramp
• Minimum distance 1000 ft

10
EXIT RAMP FOLLOWED BY EXIT RAMP
ENTRANCE RAMP FOLLOWED BY EXIT RAMP
Minimum weaving length without auxiliary lane 2000 ft [600 m]M h 15 45inimum weaving length wit auxiliary lane 00 ft [ 0 m]
Minimum distance 1000 ft [300 m]
Desirable control points A-A
Minimum control points B-B
CASE 2
CASE 1
CASE 3 CASE 4
ENTRANCE RAMP FOLLOWED BY ENTRANCE RAMP EXIT RAMP FOLLOWED BY ENTRANCE RAMP The distance between an exit ramp
followed by an entrance ramp will be governed by the geometrics of the connections to the adjacent roadway or connecting roadway.
This situation will be encounteredonly on infrequent occasions andspecial design treatment will berequired. It will usually requirean added freeway lane.
The distances shown above are generally used but reference should be made tothe AASHTO publication "A Policy on Geometric Design of Highways and Streets"and the Highway Capacity Manual for more specific information since operationalaspects are influenced by traffic volumes and may require longer distances.
ARRANGEMENTS FOR SUCCESSIVE RAMPS
Figure 2-3. Arrangements for Successive Ramps from TxDOT Roadway Design Manual (Reproduction of Roadway Design Manual Figure 3-37) (3).
SAFETY
The Texas Transportation Institute in a previous project conducted a study of crashes
related to high-occupancy vehicle lanes in Dallas, Texas, and found that buffer-separated HOV
lanes (without a barrier separating HOV lane traffic from “general purpose” traffic adjacent to
the HOV lanes) with reduced lane, shoulder and buffer widths have higher injury crash rates as
compared to barrier-separated HOV lanes (5). The two buffer-separated HOV lane sites in the
study were 11 or 11.5 ft wide, typically had a 2- or 3-ft inside shoulder and a 2.5- or 3-ft buffer
between the HOV lane and the adjacent 11-ft general-purpose lane. The one barrier-separated
HOV lane site had a 12-ft HOV lane with a 10-ft shoulder.
Specifically, the main results of the study were as follows:
• The implementation of buffer-separated concurrent-flow HOV lanes in two Dallas
freeway corridors experienced increased injury crash rates of 41 to 56 percent. The

11
general-purpose lane adjacent to the HOV lane experienced an increase in injury
crash rate of 153 percent to 188 percent.
• The increase in injury crashes is likely due to the speed differential between the HOV
lane and the general-purpose lanes.
• The reduced widths for the travel lanes, shoulders, and buffer may have contributed
to the increase in incidents.
The TTI research team conducted a review of 1150 crash reports on the two buffer-
separated HOV lanes obtained from the Accident Records Bureau of the Texas Department of
Public Safety. They found the following trends in crash characteristics related to crashes
involving the HOV lane and the adjacent general-purpose (AGP) lane (Lane 1):
• Vehicles in Lane 1 are trying to avoid suddenly stopped general-purpose traffic by
quickly moving into the HOV lane and are involved in a crash with a fast-moving
HOV lane vehicle.
• Vehicles stop suddenly in Lane 1 and are rear-ended by a following vehicle.
• Vehicles that move suddenly from the HOV lane to Lane 1 are rear-ended by another
vehicle in Lane 1 that is unable to adequately decelerate.
• Illegal lane changes (i.e., crossing the double white line) from the HOV lane and
Lane 1 at locations other than proper access points are causing both rear-end and
sideswipe crashes.
• Vehicles in highly congested Lane 1 are attempting to move into the HOV lane while
still traveling at low speeds and are involved in a crash with a faster-moving vehicle
in the HOV lane.
• Stopped traffic in the HOV lane due to a disabled vehicle (e.g., vehicle with flat tire)
causes rear-end crashes because fast-moving vehicles in the HOV lane are not
anticipating stopped traffic.
TTI concluded that the crash analysis indicated a need to increase the inside shoulder of
the buffer-separated HOV lane to at least 10 ft wide and the buffer between the HOV lane and
the adjacent general-purpose lane to 4 ft wide. This cross section, according to TTI, will “allow
two vehicles with a large speed differential to avoid a collision. It will allow HOV-lane vehicles

12
to slow or stop, if necessary, to wait for gaps in the general-purpose lanes and will allow enough
room for another HOV lane vehicle to pass” (5). This cross section also provides enough room
for a slow-moving vehicle in the general-purpose lanes to move into the HOV lane and
accelerate without completely obstructing the HOV lane or Lane 1. In addition, a faster-moving
vehicle in the HOV lane has a better chance of moving past a slower-moving vehicle that has not
sufficiently accelerated.
DESIGN OF INTERMEDIATE MANAGED-LANE ACCESS
Design considerations for intermediate managed-lane access include the following (1):
• Where possible, the same geometric criteria should be applied as would be used for a
freeway ramp.
• For at-grade access with the adjacent freeway lanes, designated outlets should be
strategically positioned so as to minimize erratic weaving to reach nearby freeway
exits.
• Vehicles entering the managed-lanes facility should be required to make an overt
maneuver to enter the lane. A freeway lane should not end at a managed lanes
entrance; the freeway lane should be moved laterally and the managed-lanes entrance
located out of the normal path of travel.
• Safety lighting should be applied for all access locations using the same warrants
applied for urban freeway entrance and exit ramps.
Buffer Opening
The Managed Lanes Handbook (1) recommends a minimum buffer opening length at an
intermediate access of 1300 ft. The distance of 1500 ft has also been recommended (1, 6). The
Roadway Design Manual suggests 2000 ft when an entrance ramp is followed by an exit ramp.
I-15 in Salt Lake City has an express lane that is separated from the general-purpose lane
using pavement markings. The length of the opening is 2000 ft as shown in Figure 2-4 (7). The

13
details are also shown in Figure 2-4 (8). Figure 2-5 and Figure 2-6 are photographs of the
markings at one of the openings.
1/2 Mile 2000 ft
1/2 Mile
RS-9RS-10
RS-12
RS-11
See Detail Below
DETAIL
EXPRESS LANE
ACCESS LOCATION
GENERAL PURPOSE LANE 8" Dotted White Line
8" Solid White Line
Figure 2-4. Utah I-15 Express Lane Access Design (7, 8).

14
Figure 2-5. Photograph of I-15 Express Lane Opening Transition in Salt Lake City.
Figure 2-6. Photograph of I-15 Express Lane Opening in Salt Lake City.

15
Caltrans provides information on ingress/egress for buffer-separated facilities in their
2003 update to their High-Occupancy Vehicle Guidelines for Planning, Design and Operations
(2). For the buffer opening, their guideline is 1315 ft (see Figure 2-7).
Note: 1 m = 0.305 ft
Figure 2-7. Caltrans Weave Distance at Buffer-Separated HOV Facilities (2).
Buffer Width
The Federal Highway Administration (FHWA) guidelines are equivalent to those shown
in Figure 2-2, stating that separation width between express (managed) lanes and general-
purpose lanes is 4 ft wide, according to A Guide for HOT Lane Development (6). The AASHTO
Guide for High-Occupancy Vehicle Facilities uses a graphic that is similar to Figure 2-2;
however, the dimensions, including the buffer width, were removed (9). The text states that the
distance is 1300 to 1500 ft and that a weave analysis can assist in determining the appropriate
length for the conditions.
Minnesota and Salt Lake City, however, use a smaller buffer width. Salt Lake City’s I-15
express lane project buffer zone consists of two 8-inch solid white lines 8 inches apart, resulting
in a buffer 24 inches wide (7). Minnesota’s I-394 MnPass express lane project also has express
lane separation consisting of two 8-inch solid white lines 8 inches apart, resulting in a buffer
24 inches wide (10). Figure 2-8 illustrates the separation between the express lane and the
general-purpose lane on I-394. The I-394 express lanes are barrier-separated for 3 mi and are a
buffer-separated concurrent-flow lane for 8 mi. Crossing the double white line is a moving
violation, and the fine for the offense is $130.

16
Caltrans 2003 High-Occupancy Vehicle Guidelines for Planning, Design and Operations
(2) did not include a suggested dimension for their buffer width for buffer-separated HOV
facilities. They do provide suggestions when the HOV facility is separated by a barrier.
Figure 2-8. Example of a Section of the I-394 HOT Lane in Minneapolis (10).
TRAFFIC CONTROL FOR ACCESS
Signing
Signing at the entrance to or exit from a managed-lane facility is essential. An example
of signing for the intermediate entry to and exit from barrier- or buffer-separated HOV lanes is
included in the Texas Manual on Uniform Traffic Control Devices (TMUTCD) and reproduced
in Figure 2-9 (11). Another TxDOT research project (0-5446) is investigating signing for toll
roads. The project is developing example layouts for signing of various situations associated
with toll roads including the scenario of when a toll lane(s) is located within a general-purpose
highway.

17
Figure 2-9. Example of Signing for the Intermediate Entry to and Exit from Barrier- or
Buffer-Separated HOV Lanes (Reproduction of TMUTCD Figure 2E-47) (11).

18
Markings
The markings used at an intermediate access point vary by regions. Figure 2-5 and
Figure 2-6 show examples of markings being used in Salt Lake City. Figure 2-10 is another
example showing an aerial view of the markings on I-35 in Dallas (12). The managed lane is
separated from the general-purpose lanes with double white lines (see top of Figure 2-10). The
opening appears to use 3-ft white markings followed by a 12-ft gap, which is typical for entrance
and exit ramps, as shown in Figure 2-11 (13).
When preferential lane and word markings are used, they are to be white and are to be
positioned laterally in the center of the preferred-use lane.
Figure 2-10. Example of Striping Pattern for an HOV Lane (12).
Buffer

19
Figure 2-11. Excerpts from TxDOT Typical Standards for Freeway Pavement Markings,
FPM(2)-00A (13).
LOCATION OF ACCESS WITH RESPECT TO OTHER RAMPS
Information on geometric design features for ramps is available in a number of sources,
including the AASHTO A Policy on Geometric Design of Highways and Streets (14) and the
TxDOT Roadway Design Manual (3). An issue for managed lanes within a general-purpose lane
is where to place the ramp with respect to other entrance and exit ramps. General guidelines are
provided (900 to 1000 ft); however, these guidelines are not always sensitive to:
• the expected ramp volume;
• the anticipated destination of the ramp vehicles (e.g., the next exit ramp or a
downstream entrance to a managed-lane facility); or
• the number of lanes on the freeway.
For example, the FHWA’s A Guide for HOT Lane Development specifies a buffer
opening of 1500 ft with a weaving distance of 1000 ft per lane between the ramps and opening
(6). Caltrans suggests 660 ft per lane (see Figure 2-7).

20
Work performed and documented in TxDOT Research Project 0-4160 (15), focused on
the weaving scenario between a managed-lane exit followed by a general-purpose exit (or
general-purpose entrance followed by a managed-lane entrance). The recommendations from
that project have been included in the Managed Lanes Handbook and are shown in
Table 2-1. Figure 2-12 shows the weaving distance when a managed lane is terminated.
Table 2-1. Weaving Distances for Managed Lane Cross-Freeway Maneuvers from
Managed Lanes Handbook (1). Design Year
Volume Level Allow up to 10 mph
(16 km/h) Mainlane Speed Reduction for Managed
Lane Weaving?
Intermediate Ramp (between Freeway Entrance/Exit and
Managed Lanes Entrance/Exit)?
Recommended Minimum Weaving Distance Per
Lane, ft
No 500 Yes Yes 600 No 700
Medium (LOS C or D)
No Yes 750 No 600 Yes Yes 650 No 900
High (LOS E or F)
No Yes 950
Note: The provided weaving distances are appropriate for freeway vehicle mixes with up to 10% heavy vehicles; higher percentages of heavy vehicles will require increasing the per lane weaving distance. The value used should be based on engineering judgment, though a maximum of an additional 250 ft per lane is suggested.
Outside Freeway Lane Drop
Managed Lane
Freeway
Buffer or Barrier
1000 ft (305 m)
1000 ft (305 m)
1000 ft (305 m)
Exit Only
California Planning Criteria: Desirable - 1000 ft (305 m), Minimum - 500 ft (150 m) per lane change
Distance
Based
on
Weaving
Evaluation
Figure 2-12. Termination of Managed Lane as a “Free” Lane to Inside (1).
Research conducted in a later part of the TxDOT Managed Lane project looked at the
effects on corridor operations when several pairs of ramps are modeled. The results are
documented in Managed Lane Ramp and Roadway Design Issues (16). Key findings from the
simulation included the following:
• In each weaving level comparison, the average freeway speed dropped faster for the
shorter ramp spacing. This change in speed shows that operations are more sensitive
to small increases in traffic volumes when ramp spacing is shorter.

21
• The number of vehicles attempting to weave across the four freeway lanes to enter the
managed lanes can have a pronounced impact on the operations of the freeway. With
the exception of short spacing in combination with high initial freeway volumes, the
average freeway speeds recorded from the simulation runs are generally above
45 mph until approximately 500 vehicles per hour are attempting to weave across the
freeway and enter the managed lanes.
• High-Occupancy Vehicle Facilities: A Planning, Design, and Operations Manual
(17) indicates that a direct connect ramp should be considered when ramp volume is
400 veh/hr. The findings from Research Project 0-4160 (16) supported that number.
When considering average speeds, the number is about 500 veh/hr for the freeway
traffic and about 300 veh/hr for the entrance weaving traffic. Using the simulation
findings, a value of 400 veh/hr could be a reflection of a rounded value that gives
consideration for both average freeway speeds and average entrance vehicle speeds.
A direct connect ramp should be considered at 275 veh/hr if the preference is to
consider lowest speeds observed (a more conservative situation).

22

23
CHAPTER 3
COLLECTION OF FIELD DATA
This chapter contains descriptions of the field studies in this project, explaining the
methods used in site selection and evaluation, maneuvers data collection, and speed data
collection.
SITE SELECTION AND EVALUATION
Researchers wanted to observe operations at sites on the state highway system that were
as similar as possible to the toll lane access points considered in this project. To this end,
members of the research team reviewed available information on functioning HOV lanes in
Texas to determine the number of possible study sites available.
A review of information from previous research efforts on TxDOT Project 0-4160 and an
Internet search of metro traffic management agencies produced the following list of HOV lanes
as potential candidate sites for field studies:
• I-35E (Stemmons Freeway, Dallas) from I-635 to SH 121
• I-635 (LBJ Freeway, Dallas) from Luna/I-35E to US-75 (North Central Expressway)
• I-30 (East R.L. Thornton Freeway, Dallas) from US-75/I-45 to Jim Miller
• I-35E/US-67 (South R.L. Thornton/Marvin Love Freeway, Dallas) from Camp
Wisdom to I-30
• US-290 (NW Freeway, Houston) from FM 1960 to I-610/NW Transit Center
• I-10 (Katy Freeway, Houston) from SH 99 (Grand Parkway) to Washington
• I-45 (Gulf Freeway, Houston) from Dixie Farm Road to Dowling
• I-45 (North Freeway, Houston) from FM 1960 to Milam/Travis
• US-59 (SW Freeway, Houston) from West Airport to Shepherd
• US-59 (Eastex Freeway, Houston) from Will Clayton to Quitman

24
Researchers made trips to Dallas and Houston in October and November 2005 to drive
these sites to observe their access configurations and review operations from the driver’s
perspective. Researchers also looked at roadway characteristics and operations. The lanes in
Dallas varied primarily by type of separation (painted stripe or raised barrier); Figure 3-1 shows
examples of each.
(a) Barrier-Separated HOV Lane on Northbound R.L. Thornton Freeway
(b) Stripe-Separated HOV Lane on Northbound Stemmons Freeway
Figure 3-1. HOV Lanes in Dallas.
Researchers also drove the Northwest Freeway, Katy Freeway, and Gulf Freeway HOV
lanes in Houston. The vast majority of HOV lane-miles in Houston are barrier-separated; only
the outer segment of the Katy Freeway facility was button-separated at the time of site selection.
Figure 3-2 shows examples.
The barrier-separated HOV facilities do not have the type of access of concern in this
project. Many of the access points on barrier-separated facilities are direct ramps, while the rest
are unidirectional (entrance-only or exit-only). Because of this, researchers focused their efforts
on stripe-separated HOV facilities that allow greater flexibility in maneuvers and would more
closely resemble conditions on managed lanes with at-grade access.

25
(a) Entrance to Barrier-Separated HOV Lane on Katy Freeway
(b) Button-Separated HOV Lane on Katy Freeway
Figure 3-2. HOV Lanes in Houston.
The research team needed locations where observers could view the entire length of the
access point and any adjacent mainline on- or off-ramps so that all access maneuvers could be
observed within the same field of view. With those characteristics in mind, researchers selected
five sites within Texas as candidates for data collection at HOV access points:
• I-635 (LBJ Freeway) WB at Rosser Road (Midway on-ramp)
• I-635 (LBJ Freeway) EB at Josey (I-35E SB on-ramp)
• I-35E (Stemmons Freeway) NB at Whitlock
• I-10 (Katy Freeway) EB at Barker-Cypress (between Fry Road and Barker-Cypress)
• I-10 (Katy Freeway) EB at Fry Road (between Mason Road and Fry Road)
In addition, researchers made contact with representatives from the Minnesota DOT
(MnDOT) concerning high-occupancy toll lanes around the Minneapolis-St. Paul metropolitan
area. Using cameras from their traffic management center, MnDOT provided images of access
points along the I-394 MnPASS HOT lane in Minneapolis for review, agreeing to provide
limited video footage of operations if desired. Researchers selected one access point for further
study: I-394 EB at US-169. The HOT lane is separated by a double painted stripe, and the entire
access point is visible within a single field of view. Figure 3-3 shows an image of this site.

26
Figure 3-3. HOT Lane Access Point on I-394 EB at US-169, Minneapolis, MN.
(Image courtesy of Minnesota DOT)
MANEUVERS DATA COLLECTION
Researchers recognized that multiple characteristics would need to be observed and
recorded for each access maneuver during the observation period for each study site. This meant
that not all data could be observed and processed on-site in real time; instead, a sizeable portion
of the data would have to be processed off-site at a later date. In order to observe all maneuvers
at or near the study sites, and to provide a permanent record of the maneuvers for later review,
researchers sought to record traffic at the sites through the use of video cameras, in the form of
either camcorders or traffic management center cameras. In addition, researchers recorded
physical characteristics of each site they visited, using handwritten notes and sketches and taking
digital photographs. Table 3-1 lists a summary of when the maneuvers data were collected.
Data Collection with Camcorders
At most of the candidate locations in Texas, researchers were able to record video using
camcorders mounted on tripods. During the initial drive-through visit of each site and the site
setup phase of the data collection site visits, researchers looked for locations where either a
camcorder or a video trailer could be positioned to capture images of the entire access point.

27
Camcorders are preferable to the video trailer, because installation is easier and the camcorder is
much less conspicuous.
Table 3-1. Summary of Maneuvers Data Collected.
Site City Location Date Time of Day Hours of Data
11/16/05 12:50 - 5:05 PM 4.25 5/8/06 1:30 - 7:00 PM 5.5 5/9/06 7:00 AM - 1:00 PM 6.0 1 Dallas
I-635 WB at Midway
(recorded from Rosser Road) 5/10/06 9:00 AM - 3:00 PM 6.0
2 Dallas I-635 EB at Josey 1/5/06 8:00 AM - 2:00 PM 6.0
3 Dallas I-35E NB at Whitlock 11/17/05 10:45 AM - 2:45 PM 4.0
4 Houston I-10 EB at Barker-Cypress 12/6/05 8:10 AM - 3:55 PM 7.75
5 Houston I-10 EB at Fry 12/5/05 10:25 AM - 4:55 PM 6.5 11/17/05 7:10 - 8:10 AM 1.0 1/18/06 7:30 - 10:00 AM 2.5 4/3/06 6:30 - 8:30 AM 2.0 4/4/06 6:30 - 8:30 AM 2.0 4/5/06 6:30 - 8:30 AM 2.0 4/6/06 6:30 - 8:30 AM 2.0
6 Minneapolis I-394 EB at US-169
4/7/06 6:30 - 8:30 AM 2.0
At each site, members of the research team found a location where a camcorder could be
mounted with a view of the entire access point and observed from a safe location. For Site 1,
researchers were able to use the Rosser Road overpass to set up the data collection equipment, as
shown in Figure 3-4. The camcorder was positioned on the sidewalk of the overpass,
overlooking the freeway lanes below. The camcorder lens was then aimed through the chain
links of the fence to gain an unobstructed view of the study site. Rosser Road is a residential
collector, and the low-volume street provided an environment conducive to data collection.

28
(a) Camcorder and Tripod on Overpass (b) Camcorder Field of View
Figure 3-4. Camcorder Installation at Site 1.
At Site 3, researchers took a different approach, utilizing a guide sign mounted on the
median barrier as a base on which to install the camcorder. As shown in Figures 3-5 and 3-6, the
camcorder and tripod were temporarily attached to the sign using straps; this setup provided a
direct line of sight along the HOV lane, similar to the driver’s perspective. Despite its proximity
to the travel lanes, however, the slim profile of the camcorder and tripod made it relatively
inconspicuous to adjacent drivers passing at high speeds.
Sites 4 and 5 were adjacent sites that were very similar, in that portions of the freeway
were under construction during the data collection period. The configuration of the freeway
lanes at that time allowed researchers to install the data collection equipment within the median,
which was closed, as shown in Figure 3-7. The resulting camcorder view was similar to that at
Site 3, adjacent to the HOV lane along the left shoulder, as shown in Figure 3-8.

29
Figure 3-5. Camcorder Installation at Site 3.
Figure 3-6. Camcorder Field of View at Site 3.

30
Figure 3-7. Closed Median Area on I-10 Near Sites 4 and 5.
Figure 3-8. Camcorder Field of View at Sites 4 and 5.
In addition to the video data from the camcorder, researchers also made a sketch of each
site, using recorded key measurements of geometric features and distances, and took pictures of
each site. Figures 3-9 to 3-13 are sketches of the five sites included in the evaluations.

31
Rosser Rd. Overpass
1160
ft
From M
idway
740
ft
Camcorder
Figure 3-9. I-635 (LBJ Freeway) WB HOV Lane Access at Rosser.

32
1100
ft43
2 ft
Enfo
rcem
ent O
peni
ng
Camcorder
Figure 3-10. I-35E (Stemmons Freeway) NB HOV Lane Access at Whitlock.

33
1350
ft
Camcorder
1000
ft
To F
ry R
d.
Figure 3-11. I-10 (Katy Freeway) EB HOV Lane Access at Fry Road.

34
920
ft
Camcorder
500
ft
To B
arke
r-Cyp
ress
Figure 3-12. I-10 (Katy Freeway) EB HOV Lane Access at Barker-Cypress.

35
Shelard Pkwy. Overpass
To U
S-16
9 SB
To U
S-1
69 N
B
TMCCamera
From U
S-169 SB
From
US
-169
NB
1500
ft
Figure 3-13. I-394 EB HOV Lane Access at US-169.

36
Data Collection with TMC Cameras
Sites 2 and 6 were unique in that video cameras from the local traffic management center
(TMC) were used to record the data, rather than camcorders. TMC cameras have a distinct
perspective, in that they have the ability to show a sizeable field of view from above the travel
lanes, and they generally have above-average pan/tilt/zoom capabilities. One potential
disadvantage is that the locations of TMC cameras are fixed, and they may not be positioned in
locations ideal for collecting data. Another disadvantage is that if there is an incident on the
roadway that needs monitoring, TMC staff members are required to give the incident priority and
stop recording images of the study site until the incident is resolved. In this project, researchers
contacted representatives at the Dallas TMC and at MnDOT, who both agreed to provide
samples of available video for review.
After reviewing images from a number of locations in Dallas, researchers decided the
TMC camera on I-635 at Josey had the greatest potential to show the viewing angle needed to
observe access maneuvers. That camera produces images similar to the one shown in
Figure 3-14 (18) when looking west and focusing on the HOV lane access point.
Figure 3-14. Image from Dallas TMC Camera on I-635 EB at Josey (18).
The image in Figure 3-14 is clear for viewing traffic in the foreground; however, the
access point at this location is so long that the upstream end is barely visible. After several
attempts, it was determined that the entire length of the access point could not be viewed with

37
one camera at sufficient resolution to collect maneuver data. Researchers and TMC staff also
attempted to use two adjacent cameras to generate a composite image, but that attempt also was
unsuccessful, and researchers decided not to pursue further efforts at this site.
As previously mentioned, researchers made contact with the Minnesota DOT in regard to
operations on its HOT lane facility in Minneapolis. MnDOT provided still images from several
cameras along the I-394 corridor for review, and researchers selected the camera on I-394 at
US-169 for further study. A sample image looking west from that camera is shown in
Figure 3-15, and the eastbound HOT lane access point is toward the top of the image (19).
Figure 3-15. Image from MnDOT Camera on I-394 EB at US-169, Minneapolis, MN (19).
Staff members at the MnDOT Traveler Information Center were able to use the camera to
zoom in on the access point, providing a field of view similar to that shown in Figure 3-3. This
view was sufficient to see the entire access point and record access maneuvers at that location.
Researchers requested more data from MnDOT, who provided the data for Site 6 that are listed
in Table 3-1.
The video-based maneuvers data were reduced to determine characteristics of each access
maneuver within the field of view. Descriptions of the data reduction process are provided in
Chapter 4.

38
SPEED DATA COLLECTION
To help gain an appreciation for the speeds at which traffic moved through an access
point, researchers collected spot speed data at Site 1 during video data collection on May 8-10,
2006. The environment at Site 1 was well-suited for speed data collection, because researchers
had ample room to set up the necessary equipment next to the camcorder used to collect
maneuver data, as shown in Figure 3-16.
Figure 3-16. Spot Speed Data Collection at Site 1.
Researchers set up equipment to collect spot speed data in the HOV lane and in the
adjacent general-purpose lane. For each lane, researchers used a lidar gun (commonly referred to
as a laser gun) connected to a laptop computer. The use of laser guns in speed data collection
has two major advantages over radar. First, laser guns can measure distance to a vehicle as well
as the speed of that vehicle (see Figure 3-17), (while radar guns only measure speed), which
allows researchers to determine speeds at a particular location within the access point. The
second advantage of laser over radar is that the signal transmitted travels in a straight line
whereas the radar transmission is conically shaped. The narrower beam has at least two distinct

39
advantages associated with it; it is harder to detect with conventional radar and laser detectors,
and it allows for more precise measurements of individual speeds. Thus, the researcher can track
a specific vehicle and record a speed-distance profile if desired.
Figure 3-17. Spot Speed and Distance Readout from Laser Gun at Site 1.
To measure speed and distance, hundreds of infrared light pulses are released from the
gun every second. As each pulse is transmitted, a time is started. When the energy of the light
pulse is received by the device, the time is stopped. Based on elapsed time, the distance is
calculated using the known speed of light through the atmosphere. An algorithm is used to
derive the speed of the target from a successive number of range calculations. TTI developed a
software program to transmit the speed (in mph), time of day, and distance (in ft) from the laser
gun to a laptop computer. The transfer of data occurs at a rate of approximately three times per
second, so in spot speed studies such as this, each targeted vehicle actually yields two or three
speed-distance readings before the researcher stops tracking the vehicle.

40
Using a separate gun-and-laptop unit for each lane allowed researchers to collect two
distinct datasets to compare speeds in the adjacent lanes. However, during data collection, an
equipment malfunction disabled one of the guns. For the remainder of the data collection period,
researchers used the single gun to switch periodically between lanes, making comments within
the data file to note in which lane speeds were being collected. Researchers transferred the
collected speed and distance data into a spreadsheet for error-checking and analysis, which will
be described in Chapter 4.

41
CHAPTER 4
REDUCTION OF FIELD DATA
This chapter contains descriptions of the procedures used in this project to reduce,
format, and verify the accuracy of the data collected in the field studies described in Chapter 3.
MANEUVERS DATA
The speed and maneuvers data from the field studies are collected in a raw state, and the
dataset requires reduction and formatting before researchers can begin analyzing it. For the
maneuvers data from the video, each maneuver had to be reviewed individually, and various
characteristics about each maneuver were noted.
Researchers used digital-format 8 mm cassette camcorders to record the data at Sites 1, 3,
4, and 5. This recording format has several advantages over VHS and other formats. First, it is
compact in size, so the camcorders can be less conspicuous while in use than VHS or VHS-C.
Second, it is a very common format, so tapes and players are easy to obtain. Third, the digital-
format 8 mm cassette has an advantage over other 8 mm formats, in that it has greatly expanded
frame-by-frame capabilities, including the ability to record and display the frame number as part
of the time-date stamp. This format is very useful in analyzing data collected from high-speed
traffic.
The maneuvers data submitted from TMC cameras were recorded on VHS format. In
order to reduce all of the maneuvers data to the same level of detail, the footage from Site 6 was
copied onto Digital8 tapes.
Researchers developed a spreadsheet template to record the numerical data as the
technician viewed the video. The spreadsheet contained four separate pages: one for entering all
of the site characteristics and time-of-day information, a second for recording all of the
maneuver characteristics, a third for recording traffic volume counts, and a fourth for a summary
table. Table 4-1 lists a summary of the site characteristics.

42
Table 4-1. Summary of Site Characteristics.
City Location Speed Limit, mph
Number of GP Lanes
Access Length, ft
Number of
Zones
Zone Length,
ft
Dallas I-635 WB at Rosser 60 4 1160 3 387
Dallas I-35E NB at Whitlock 60 4 1100 3 367
Houston I-10 EB at Barker-Cypress 55 3 920 2 460
Houston I-10 EB at Fry 55 3 1350 3 450
Minneapolis I-394 EB at US-169 55 3 1500 3 500
Maneuver Characteristics
On the maneuver characteristics page of the spreadsheet, technicians recorded 15 distinct
characteristics for each lane change maneuver that attempted access into or out of the HOV/HOT
lane. These characteristics are:
• maneuver number,
• time in view (Time when vehicle is first visible in camera view),
• beginning lane (Lane occupied by the vehicle at Time in view),
• signal use (Did the driver use turn signals when making the maneuver?),
• signal frame (Hour-minute-second-frame on tape when signal is first visible),
• signal time (Time of day when signal is first visible),
• crossing frame (Hour-minute-second-frame on tape when vehicle first crosses the lane
line),
• crossing time (Time of day when vehicle first crosses the lane line),
• crossing access position (Lane position when vehicle first crosses the lane line),
• finish frame (Hour-minute-second-frame on tape when vehicle finishes crossing the lane
line),
• finish time (Time of day when vehicle finishes crossing the lane line),
• finish access position (Lane position when vehicle finishes crossing the lane line),
• finish lane (Lane occupied by the vehicle at Finish time),

43
• maneuver relative to HOV lane (Maneuver of vehicle in relation to HOV lane: in, out,
pass, abort), and
• time needed to complete maneuver.
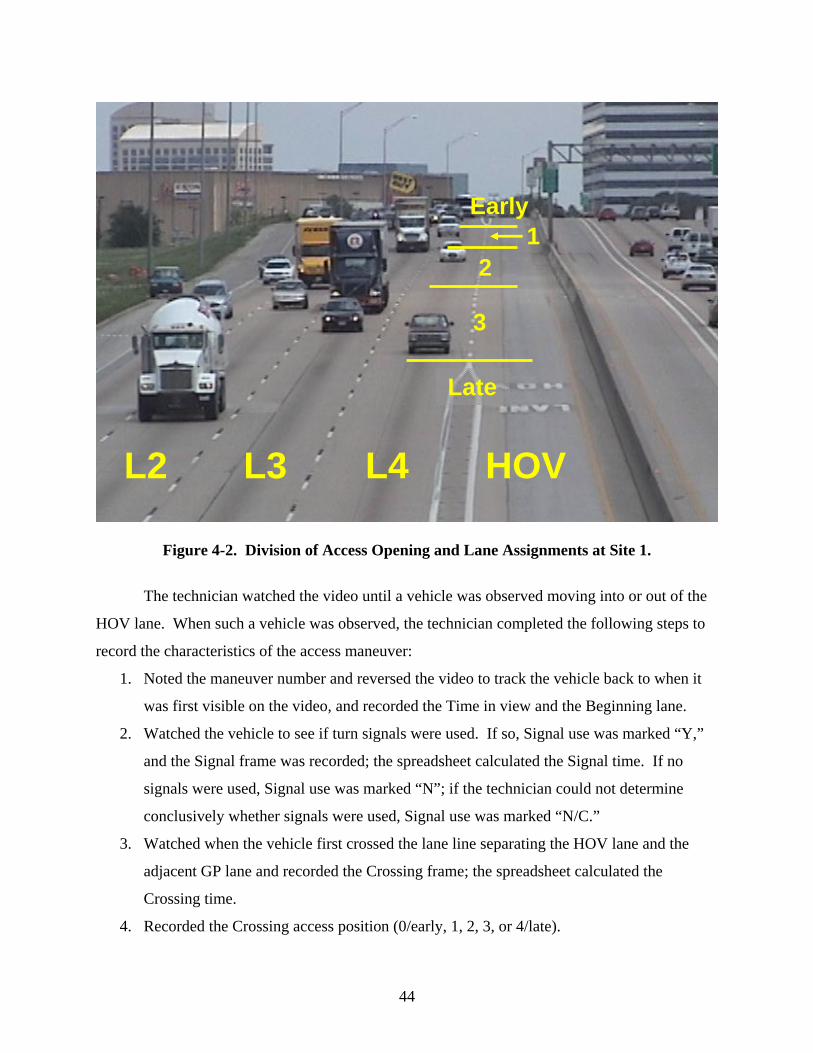
Technicians reviewed the video record of each access maneuver at each site to record the
above characteristics. A sample image of video is shown in Figure 4-1. For each site,
researchers divided the access opening into either two or three equal zones, depending on the
length of the opening. This division was used to determine the crossing access position and
finish access position listed above. Vehicles’ access position could be defined by up to five
categories: Zone 0/early (prior to the opening), Zone 1 (first zone), Zone 2 (second zone), Zone 3
(third zone), and Zone 4/late (after the opening). Figure 4-2 illustrates the five zones.
Figure 4-1. Sample Image of Video for Maneuvers Data.
44
Figure 4-2. Division of Access Opening and Lane Assignments at Site 1.
The technician watched the video until a vehicle was observed moving into or out of the
HOV lane. When such a vehicle was observed, the technician completed the following steps to
record the characteristics of the access maneuver:
1. Noted the maneuver number and reversed the video to track the vehicle back to when it
was first visible on the video, and recorded the Time in view and the Beginning lane.
2. Watched the vehicle to see if turn signals were used. If so, Signal use was marked “Y,”
and the Signal frame was recorded; the spreadsheet calculated the Signal time. If no
signals were used, Signal use was marked “N”; if the technician could not determine
conclusively whether signals were used, Signal use was marked “N/C.”
3. Watched when the vehicle first crossed the lane line separating the HOV lane and the
adjacent GP lane and recorded the Crossing frame; the spreadsheet calculated the
Crossing time.
4. Recorded the Crossing access position (0/early, 1, 2, 3, or 4/late).
Early 1
L2 L3 L4 HOV
Late
3
2

45
5. Watched when the vehicle finished crossing the lane line separating the HOV lane and
the adjacent GP lane and recorded the Finish frame; the spreadsheet calculated the Finish
time.
6. Recorded the Finish access position (0/early, 1, 2, 3, or 4/late).
7. Recorded the Finish lane.
8. Recorded the maneuver relative to the HOV lane.
9. Made comments if necessary to describe any unique conditions or characteristics of the
maneuver.
10. Verified that the spreadsheet calculated the Time needed to complete maneuver.
When completed, the spreadsheet page had one row per maneuver containing all
characteristics listed above. Table 4-2 shows a partial sample of a spreadsheet. Some segments
of video could not be reduced. In addition to the TMC video at Site 2 mentioned in Chapter 3,
some portions of the video at Site 6 were recorded at times before sunrise; these portions could
not be reduced because lane lines were not visible, and individual vehicles were difficult or
impossible to distinguish. Also, small portions of TMC video at Site 6 were lost as the camera
was focused on an incident and diverted away from the access point. Table 4-3 lists the amount
of data that was reduced from each site for each study period.
Table 4-2. Sample of Spreadsheet Containing Reduced Maneuvers Data. # Time in
View Begin Lane
Signal?
S-Time (calc)
C-Time (calc)
C-Access Position
F-Time (calc)
F-Access Position
Finish Lane
Ref. to HOV
4 8:14:55 3 N 8:15:01.97 2 8:15:03.67 2 HOV In 5 8:15:07 2 Y 8:15:13.83 8:15:15.90 2 8:15:17.33 Late HOV In 6 8:15:46 3 Y 8:15:47.40 8:15:49.13 1 8:15:50.83 1 HOV In 7 8:16:43 HOV N 8:16:50.47 2 8:16:51.73 2 3 Out 8 8:16:44 3 Y 8:16:51.40 8:16:52.50 2 8:16:52.50 2 HOV In 9 8:16:54 3 N 8:16:58.07 1 8:17:00.17 2 HOV In
10 8:17:00 2 Y 8:17:02.30 8:17:03.67 1 8:17:04.80 1 HOV In 11 8:17:03 3 Y 8:17:05.07 8:17:06.67 1 8:17:08.50 1 HOV In 12 8:17:09 3 Y 8:17:09.07 8:17:10.00 Early 8:17:11.47 1 HOV In 13 8:17:36 3 Y 8:17:35.60 8:17:36.60 Early 8:17:37.73 1 HOV In # = Vehicle number All times are in hour:minute:second

46
Table 4-3. Summary of Maneuvers Data Reduced.
City Location Date Time of Day Hours of Data Reduced
11/16/05 12:50 - 5:05 PM 4.25 5/8/06 1:30 - 7:00 PM 5.5 5/9/06 7:00 AM - 1:00 PM 6.0 Dallas I-635 WB at Rosser
5/10/06 9:00 AM - 3:00 PM 6.0 Dallas I-35E NB at Whitlock 11/17/05 10:45 AM - 2:45 PM 4.0
Houston I-10 EB at Barker-Cypress 12/6/05 8:10 AM - 3:55 PM 7.75
Houston I-10 EB at Fry 12/5/05 10:25 AM - 4:55 PM 6.5 1/18/06 7:30 - 10:00 AM 2.5 4/3/06 6:30 - 8:30 AM 2.0 4/4/06 6:30 - 8:30 AM 2.0 4/5/06 6:30 - 8:30 AM 2.0 4/6/06 6:30 - 8:30 AM 2.0
Minneapolis I-394 EB at US-169
4/7/06 6:30 - 8:30 AM 2.0
Summary Tables
The summary table page was used to generate a table summarizing the characteristics of
maneuvers at the site during the data collection period, categorized by signal use, maneuver type,
and crossing lane position. The spreadsheet program has a supplemental statistical function that
will calculate and display summary tables of large amounts of data sorted on the variables
selected by the user. Examples of these tables and their use in further analysis of the data are
provided in Chapter 5.
TRAFFIC VOLUME COUNTS
The traffic volumes page of the spreadsheet was used to record the manual count of the
5-minute traffic volumes in the HOV lane and the adjacent GP lane for the duration of the data
collection period, as viewed on the video. Technicians viewed the video and, using an electronic
traffic counter or a manual clicker-counter, recorded in the spreadsheet the number of vehicles
traveling in the HOV lane and the adjacent GP lane every 5 minutes.

47
SPEED DATA
Speed data were collected at Site 1 on Monday through Wednesday, May 8-10, 2006.
Technicians divided the data collection into five time periods, a summary of which is shown in
Table 4-4. The speed data collected by the laser gun were sent to a laptop computer and stored
in a text file. A text file was created by each gun for each time period in which data were
colleted. Each text file was then imported into a spreadsheet where the data could be more easily
reduced, formatted, and analyzed. The initial round of data reduction involved checking for
erroneous entries, such as negative distances or unrealistic speeds, which indicated that the beam
from the gun was not locked on to the target vehicle. These entries were removed from the data
file.
Table 4-4. Summary of Speed Data Collected. Date Day Period Time of Day Hours of Data
5/8/06 Monday Off-peak 1:30 – 3:00 PM 1.5 5/8/06 Monday PM peak 4:45 – 6:15 PM 1.5 5/9/06 Tuesday AM peak 7:15 – 8:30 AM 1.25 5/9/06 Tuesday Off-peak 8:30 – 10:00 AM 1.5 5/10/06 Wednesday Off-peak 9:00 – 11:30 AM 1.5
Formatting the data was a multi-step process. First, the data were checked for translation
errors in converting from text to spreadsheet (i.e., numbers stored as text, date-time codes
displayed as number strings, etc.); these errors were corrected on an individual basis. Next, the
data were organized into columns to facilitate reading and analysis. Because the data were
collected by two different guns for part of the data collection period, the two data files for each
time period had to be merged into one and the data arranged chronologically and spatially. The
data were color-coded to identify their source and then placed into the same page of a
spreadsheet; this merging resulted in one composite dataset for the time period. Then, the data
were sorted chronologically and separated by lane. Table 4-5 shows a sample of the reduced,
formatted data.

48
Table 4-5. Sample of Reduced and Formatted Speed Data. Date Lane Time Speed (mph) Distance (ft)
5/8/2006 4 1:56:53 PM 60 1217 5/8/2006 4 1:56:54 PM 61 1190 5/8/2006 HOV 1:56:57 PM 75 1276 5/8/2006 HOV 1:56:57 PM 75 1243 5/8/2006 4 1:56:59 PM 72 1589 5/8/2006 HOV 1:57:02 PM 71 997 5/8/2006 HOV 1:57:02 PM 71 974 5/8/2006 4 1:57:04 PM 72 1608 5/8/2006 4 1:57:04 PM 72 1577 5/8/2006 HOV 1:57:05 PM 70 1370 5/8/2006 HOV 1:57:05 PM 70 1339 5/8/2006 4 1:57:10 PM 71 1332
Verification of Accuracy
After the first series of data reduction and formatting was completed, researchers
reviewed the resulting spreadsheet files and the corresponding video to check for errors. This
review included watching video segments a second time and recording maneuvers data to verify
that maneuvers were originally recorded correctly. It also included spot-checking the
spreadsheet files for questionable entries such as negative times, unrealistically long times to
complete maneuvers (greater than 10 seconds), odd number of passing maneuvers, and invalid
entries in vehicle position. These entries were reviewed individually and either verified or
corrected.
VEHICLE POSITION IN LANE DATA
While watching the videotapes of the Rosser site, the researchers noticed that it appeared
that vehicles were shifting their position within the lane as they drove near the access opening, as
illustrated in the series of images shown in Figures 4-3 and 4-4. Especially near the beginning of
the opening, vehicles in the HOV lane and in the lane adjacent to the HOV lane were closer
together within the opening as compared to their position when the lane lines were solid. The
transition at the end of the parallel white lines has the white lines continuing at an angle until

49
they meet at a point. The broken white line extends from the point, which placed it about
midway between the two solid parallel white lines. A brief review of a sample of the video by a
human factors expert indicated that drivers may be tracking along the angled portion of the solid
white line and shifting their vehicle position due to the markings.
(a) Near Beginning of Zone 3 (b) Near Middle of Zone 3
(c) Near End of Access Opening (d) Downstream of Access Opening Figure 4-3. Example of Shifting Vehicle Position in HOV Lane Near Access Opening.
To verify the observation that drivers were shifting their vehicle position within the lane,
vehicle positions were measured from the video. Measurements were recorded at two locations
selected because the researchers felt reliable measurements could be made at those locations.
(Attempting to measure vehicle positions further upstream of these locations would result in the
likelihood of less precise data due to the image quality.) The first location was at the start of
Zone 3, represented by image (a) in Figures 4-3 and 4-4, and the second location was at the HOV
LANE pavement markings, represented by image (d). The start of Zone 3 was approximately

50
367 ft from where the two solid lines met at the point. The HOV lane markings were about
120 ft downstream from the point.
(a) Near Beginning of Zone 3 (b) Near Middle of Zone 3
(c) Near End of Access Opening (d) Downstream of Access Opening Figure 4-4. Example of Shifting Vehicle Position in Adjacent General-Purpose Lane Near
Access Opening.
Only vehicles that did not change lanes within the study area were measured. The video
was advanced until a vehicle in Lane 4 (i.e., the lane adjacent to the HOV lane) was at the start
of Zone 3 (see Figure 4-2 for illustration of zones). The distance between the vehicle and the
pavement marking on either side of the vehicle was measured. Next the video was advanced
until a vehicle in the HOV lane or the lane next to Lane 4 (i.e., Lane 3) was at the start of Zone 3.
Generally only a few frames were needed to be advanced to move this vehicle to the start of
Zone 3. The position of the vehicle in the neighboring lane was then measured. The process
continued until a minimum of 100 passenger cars and 100 heavy trucks were measured in Lane 4
along with the associated neighboring vehicles.

51
CHAPTER 5
FINDINGS FROM FIELD STUDIES
MANEUVERS
The number of attempts to enter or leave the HOV lane was counted for the five sites.
Table 5-1 lists the number of maneuvers that occurred at the sites along with which of the
following categories applied to the vehicle at the start of each maneuver (i.e., when the front of
the vehicle first crosses the lane line):
• moving into the HOV lane (In);
• moving out from the HOV lane (Out);
• representing an aborted maneuver (Abort) – for example, attempted to enter or leave
the HOV lane and did not complete the lane change; or
• representing a passing maneuver (Passing) – for example, a vehicle in the HOV lane
leaves the HOV lane to pass a slower-moving HOV lane vehicle and then re-enters
the HOV lane.
The counts listed in Table 5-1 also represent the number of vehicles except for the
passing category. Each count represents one maneuver, and a vehicle would make two
maneuvers during a pass. Therefore, if the number of vehicles that are passing at a site is
desired, the number of maneuvers would need to be divided by two because a passing would
include two maneuvers (e.g., leaving the HOV lane and then re-entering the HOV lane
downstream). For example, three vehicles completed passes at the Barker-Cypress site (six
maneuvers divided by two).
The majority of the observed maneuvers were moving into the HOV lane – a reflection of
the time of day and location for the sites. A surprisingly large number of maneuvers (7 percent)
were vehicles passing a slower-moving vehicle. Additional observations on the passing
behaviors are discussed in the following sections.
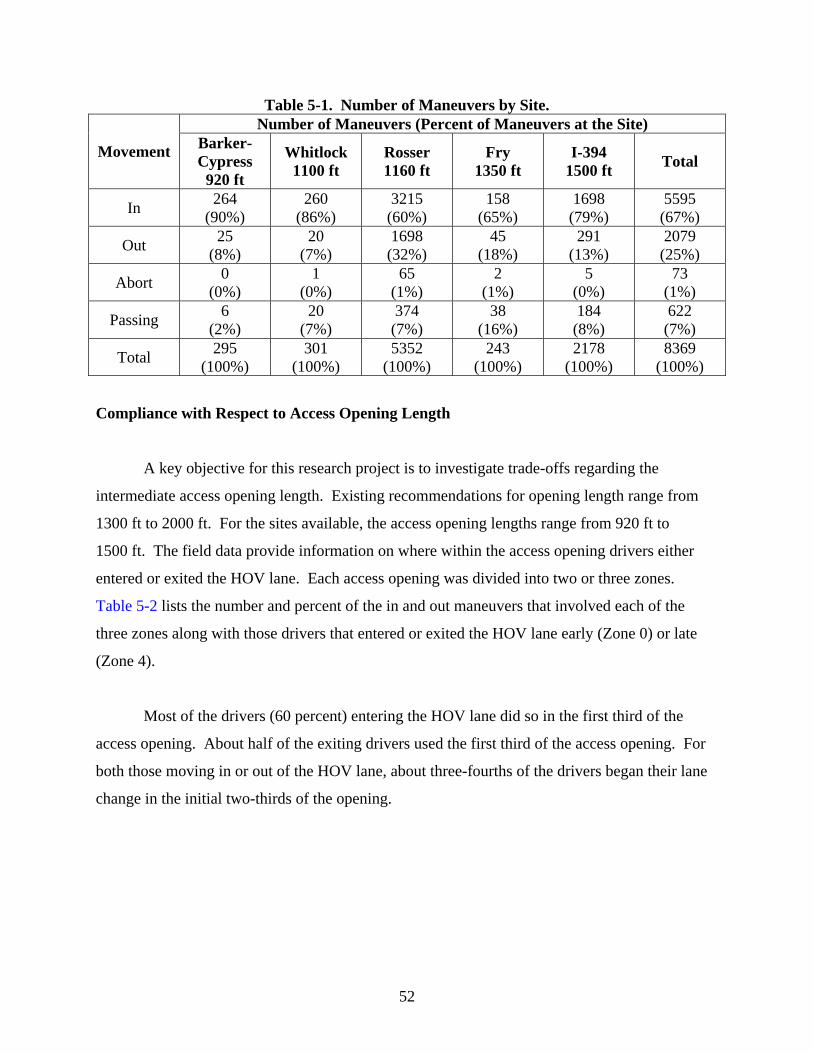
52
Table 5-1. Number of Maneuvers by Site. Number of Maneuvers (Percent of Maneuvers at the Site)
Movement Barker-Cypress
920 ft
Whitlock 1100 ft
Rosser 1160 ft
Fry 1350 ft
I-394 1500 ft Total
In 264 (90%)
260 (86%)
3215 (60%)
158 (65%)
1698 (79%)
5595 (67%)
Out 25 (8%)
20 (7%)
1698 (32%)
45 (18%)
291 (13%)
2079 (25%)
Abort 0 (0%)
1 (0%)
65 (1%)
2 (1%)
5 (0%)
73 (1%)
Passing 6 (2%)
20 (7%)
374 (7%)
38 (16%)
184 (8%)
622 (7%)
Total 295 (100%)
301 (100%)
5352 (100%)
243 (100%)
2178 (100%)
8369 (100%)
Compliance with Respect to Access Opening Length
A key objective for this research project is to investigate trade-offs regarding the
intermediate access opening length. Existing recommendations for opening length range from
1300 ft to 2000 ft. For the sites available, the access opening lengths range from 920 ft to
1500 ft. The field data provide information on where within the access opening drivers either
entered or exited the HOV lane. Each access opening was divided into two or three zones.
Table 5-2 lists the number and percent of the in and out maneuvers that involved each of the
three zones along with those drivers that entered or exited the HOV lane early (Zone 0) or late
(Zone 4).
Most of the drivers (60 percent) entering the HOV lane did so in the first third of the
access opening. About half of the exiting drivers used the first third of the access opening. For
both those moving in or out of the HOV lane, about three-fourths of the drivers began their lane
change in the initial two-thirds of the opening.

53
Table 5-2. Number of Maneuvers by Site and by Zone. Number of Maneuvers
(Percent of Maneuvers at the Site) Zone Barker-
Cypress 920 ft
Whitlock 1100 ft
Rosser 1160 ft
Fry 1350 ft
I-394 1500 ft Total
In Zone 0 (early)
27 (10%)
5 (2%)
165 (5%)
13 (8%)
14 (1%)
224 (4%)
Zone 1 146 (55%)
142 (54%)
1741 (54%)
56 (36%)
1309 (76%)
3394 (60%)
Zone 2 72 (27%)
63 (24%)
585 (18%)
21 (13%)
233 (14%)
974 (18%)
Zone 3 No Zone 3 38 (14%)
520 (16%)
31 (20%)
153 (9%)
742 (13%)
Zone 4 (late)
20 (8%)
15 (6%)
215 (7%)
37 (23%)
7 (0%)
294 (5%)
Total 265 263 3226 158 1716 5628 Out
Zone 0 (early)
2 (8%)
1 (6%)
35 (2%)
6 (13%)
1 (0%)
45 (2%)
Zone 1 5 (21%)
2 (12%)
846 (50%)
13 (29%)
140 (51%)
1006 (49%)
Zone 2 15 (63%)
12 (70%)
403 (24%)
3 (7%)
69 (25%)
502 (25%)
Zone 3 No Zone 3 2 (12%)
299 (18%)
7 (15%)
56 (21%)
364 (18%)
Zone 4 (late)
2 (8%)
0 (0%)
106 (6%)
16 (36%)
7 (3%)
131 (6%)
Total 24 17 1689 45 273 2048
A mosaic plot was used to illustrate the change in proportion for the different entering
positions for the five sites. Figure 5-1 shows the mosaic plot for all the sites ordered by the
access opening length for those vehicles moving into the HOV lane. A mosaic plot is a plot
divided into small rectangles such that the area of each rectangle is proportional to a frequency
count of interest. The proportions shown on the x-axis represent the relative sizes of the total
number of maneuvers at each site. The proportions shown on the y-axis (response probabilities)
represent the frequency of maneuvers belonging to each zone divided by the total number of
maneuvers at each site. How the response probabilities vary for the different sites (as
represented by the length of their access opening) can be seen by comparing the heights of Y
levels (Zone) across the X levels (Lengths).

54
0.00
0.25
0.50
0.75
1.00
9201100 1160 1350 1500
Length (ft)
Pro
porti
on 4
3210
(Zone 0 = Early Entry, Zone 1 = First Third of Opening or First Half of Opening for Site with 920 ft Length, Zone 2 = Second Third of Opening or Second Half
of Opening for Site with 920 ft Length, Zone 3 = Final Third of Opening, Zone 4 = Late Entry)
Figure 5-1. Mosaic Plot of Proportion of Maneuvers by Zone.
Figure 5-1 clearly shows the quantity of data available at the Rosser site (length equals
1160 ft) and the I-394 site (length equals 1500 ft) since those blocks of data are much wider than
the blocks for the other three sites. The information provided on the y-axis provides a visual
representation of the proportion of vehicles entering in different zones including those zones that
would be considered a violation. A question explored in the research was the following: “is the
proportion of vehicles in violation a function of the intermediate access opening length?” If
higher numbers (or proportion) of violations occur at shorter lengths, this could indicate that
drivers are having difficulties in entering the managed lane within the available access opening.
Of course, other factors could also enter into the driver’s decision, such as the likelihood of being
ticketed for crossing the solid markings. The preference, however, would be to provide a design
that encourages compliance.

55
The data represented in Figure 5-1 were used to address the question of interest – whether
the proportions of access zones (0/Early, 1, 2, 3, and 4/Late) were significantly different across
the sites. This question can be answered by conducting the likelihood ratio chi-square test or the
Pearson Chi-square test. Table 5-3 provides the results of the evaluations. The chi-square
statistics test that the distribution of the Y-variable (access zone) is the same for each site. It is a
test of marginal homogeneity. The null hypothesis is that the true access zone category
proportions are the same for all the sites. Both the likelihood ratio chi-square test and the Pearson
Chi-square test resulted in significant p-values of less than .0001 (see Table 5-3). The data
support the conclusion that the frequency of maneuvers for each category of access zone is
different over the different sites.
Table 5-3. Results from Evaluation of Access Zones Difference for All Sites.
Source DF -LogLike RSquare (U) Model 16 283.3585 0.0435 Error 5608 6235.0550 C. Total 5624 6518.4136 N 5628
Test ChiSquare Prob>ChiSq Likelihood Ratio 566.717 <.0001 Pearson 517.662 <.0001
A visual review of Figure 5-1 indicates that the percent of violations (i.e., the proportions
shown for Zone 0/Early or Zone 4/late) is similar or decreases with increasing intermediate
access opening length for the sites with access opening lengths of 920, 1100, and 1160 ft. The
trend of decreasing violations for increasing access opening length is not continued for the site
with the 1350-ft access opening. A characteristic of that site includes the use of buttons rather
than markings to separate the general-purpose lane from the HOV lane. The site was also in a
transition phase as construction was occurring near the study location (but not actively during the
data collection period); therefore, the buttons used at the sites with 920-ft and 1350-ft access
openings may not have clearly communicated to drivers the location of the beginning or ending
of the access opening as the sites that use solid white lane line markings. Therefore, the 920-ft
and 1350-ft access opening sites were removed from the dataset and the evaluations redone.
Figure 5-2 shows the mosaic plots and Table 5-4 provides the statistical test results. As before,

56
the findings indicated that the frequency of maneuvers for each category of access zone is
different for the different sites.
Table 5-4. Results from Evaluation of Access Zones Difference for Sites with 1100, 1160, and 1500 ft Access Opening Lengths.
(a) In – Entering the HOV Lane (b) Out – Exiting the HOV Lane Source DF -LogLike RSquare (U)Model 8 184.5783 0.0313Error 5193 5703.7219 C. Total 5201 5888.3002 N 5205 Test ChiSquare Prob>ChiSqLikelihood Ratio 369.157 <.0001Pearson 315.627 <.0001
Source DF -LogLike RSquare (U)Model 8 16.9277 0.0069Error 1967 2433.1549 C. Total 1975 2450.0825 N 1979 Test ChiSquare Prob>ChiSqLikelihood Ratio 33.855 <.0001Pearson 33.369 <.0001
The previous evaluation demonstrated that the frequency of maneuvers for each category
of access zone is different for the different sites. That evaluation included each zone as a unique
category; for example, Zone 1 was considered as different from Zone 2, etc. Another evaluation
was conducted to determine if there is a difference between those in compliance (i.e., within
Zones 1, 2, and 3) and those not in compliance (i.e., within Zones 0/early and 4/late) with the
markings. The question of interest here is whether the compliance rates are significantly
different for different opening lengths. Specifically, we are interested in determining if the
probability of compliance is greater for length equal 1500 ft than 1160 ft. Figure 5-3 shows the
mosaic plots, and the results of the evaluations are in Table 5-5. Because this is a 2-by-2
contingency table, Fisher’s exact test can be implemented in addition to the chi-square tests.
Unlike the chi-square tests, Fisher’s exact test does not require a large sample size/cell
frequency. It is an exact test (based on hypergeometric distribution) that can be applied even
when the sample size is small. The null hypothesis is that the true compliance rates are the same
for both lengths. As shown in the last portion of Table 5-5, p-values for three different
alternative hypotheses are given for Fisher’s exact test. (The right-tailed test seems to be the
most interesting one in this case.) The chi-square tests give p-values for the two-tailed tests.
All three tests (the likelihood ratio chi-square test, the Pearson Chi-square test, and Fisher’s exact

57
test) resulted in significant p-values of less than .001. The data support the conclusion that the
compliance rate is greater for length equal 1500 ft than 1160 ft.
0.00
0.25
0.50
0.75
1.00
Length (ft)
Pro
porti
on
43210
1100 1160 1500
(a) In – Entering the HOV Lane
0.00
0.25
0.50
0.75
1.00
Length (ft)
Pro
porti
on
43210
1100 1160 1500
(b) Out – Exiting the HOV Lane
Figure 5-2. Mosaic Plot of Proportion of Maneuver by Zone for Sites with 1100, 1160, and 1500 ft Access Opening Lengths.

58
C
ompl
ianc
e
0.00
0.25
0.50
0.75
1.00
1160 1500
Length
0
1
(a) In – Entering the HOV Lane
Com
plia
nce
0.00
0.25
0.50
0.75
1.00
1160 1500
Length
0
1
(b) Out – Exiting the HOV Lane
1 = Vehicle crossed broken line markings (considered to be in compliance) 0 = Vehicle crossed solid line markings either before or after the access opening (considered to be not in compliance)
Figure 5-3. Mosaic Plot of Proportion of Maneuver by Compliance for Sites with 1160 and
1500 ft Access Opening Lengths.

59
Table 5-5. Results from Evaluation of Compliance Difference for Sites with 1160 and 1500 ft Access Opening Lengths.
(a) In – Entering the HOV Lane (b) Out – Exiting the HOV Lane Source DF -LogLike RSquare (U)Model 1 107.3227 0.0774Error 4912 1279.2883 C. Total 4913 1386.6109 N 4914 Test ChiSquare Prob>ChiSqLikelihood Ratio
214.645 <.0001
Pearson 165.354 <.0001 Fisher's Exact Test
Prob Alternative Hypothesis
Left 1.0000 Prob(Comply=1) is greater for Length=1160 than 1500
Right <.0001 Prob(Comply=1) is greater for Length=1500 than 1160
2-Tail <.0001 Prob(Comply=1) is different across Length
Source DF -LogLike RSquare (U)Model 1 7.01442 0.0132Error 1988 524.97286 C. Total 1989 531.98728 N 1990 Test ChiSquare Prob>ChiSqLikelihood Ratio
14.029 0.0002
Pearson 11.214 0.0008 Fisher's Exact Test
Prob Alternative Hypothesis
Left 0.9999 Prob(Comply=1) is greater for Length=1160 than 1500
Right 0.0002 Prob(Comply=1) is greater for Length=1500 than 1160
2-Tail 0.0004 Prob(Comply=1) is different across Length
Abort Maneuvers
Less than 1 percent of all maneuvers observed at the five sites were categorized as abort
maneuvers. These were maneuvers where a driver attempted to either enter or leave the HOV
lane and was not successful in the lane change. Most of these maneuvers occurred at Rosser,
which is not surprising since most of the maneuvers within the dataset are at Rosser. As a
percentage, each site had 1 percent or less of its maneuvers in the abort category (see Table 5-1).
Therefore a relationship between access opening length and number or percentage of abort
maneuvers cannot be determined from the sample available.

60
Passing Maneuvers
Of the 8369 maneuvers observed at the five sites, 7 percent involved a passing action (see
Table 5-1). Table 5-6 shows the number of vehicles passing by their initial lane of origin. For
example at the Barker-Cypress site (access opening length of 920 ft) all three of the vehicles
involved in a passing maneuver began the pass from a general-purpose lane. None of the HOVs
initiated a pass at that site. For Rosser (length equals 1160 ft) over 40 percent of the vehicles
began the pass from the HOV lane, which means that 60 percent of those passing began the pass
from a general-purpose lane. These general-purpose lane drivers are utilizing the HOV lane and
the opening to that lane to pass slower-moving general-purpose vehicles. At the I-394 site
almost all of the passing vehicles (84 percent) involved a vehicle in an HOV lane that left the
HOV lane and passed a slower-moving vehicle in the HOV lane on the right before returning to
the HOV lane.
Table 5-6. Percent of Passing Vehicles.
Total Passing Vehicles
Vehicles that Began the Pass from a General-
purpose Lane
Vehicles that Began the Pass from the HOV
Lane
Percent of Passing
Vehicles that Began the Pass from the HOV
Lane
Length (ft)
Vehicles Pro(%)* Vehicles Pro(%) Vehicles Pro(%) % 920 1100 1160 1350 1500
3 10 187 19 92
1.0 3.6 3.8 9.4 4.6
3 10 110 17 15
1.0 3.6 2.2 8.4 0.8
0 0 77 2 77
0.0 0.0 1.6 1.0 3.9
0 0 41 11 84
Total 311 155 156 * Pro=Represent the proportion of passing vehicles at the site, calculated as number of passing vehicles divided by the number of vehicles moving in or out of the HOV lane (not including passing vehicles)
The percent of passing maneuvers appears to be sensitive to the length of the access
opening. Figure 5-4 shows the percent of the maneuvers by access opening length. For the
locations with longer intermediate access opening lengths, a greater proportion of the maneuvers
involved passing vehicles. A logistic regression evaluation of the probability of passing

61
(computed using those maneuvers involving a lane change) found that length was statistically
significant when all five sites are considered. Three sites had less than 300 maneuvers each as
compared to the other two sites which had 2086 or 5165 observations. When the two sites with
the greater number of observations are compared, the length of the opening is no longer
significant. Stated in another manner, the percent of passing at the site with 1160 ft is not
statistically different from the percent of passing at the site with 1500 ft.
0
24
6
810
12
1416
18
900 1200 1500
Access Opening Length (ft)
Per
cent
of M
aneu
ver (
%) Passing
Abort
Figure 5-4. Percent of Maneuvers Involving a Pass or Abort.
Logistic regression was also used to determine if the probability of passing is influenced
by the volume present during the maneuver. Table 5-7 provides the findings from the regression.
When the passing begins from the HOV lane, both the HOV lane count and the adjacent general-
purpose lane count are significant. When the passing begins from a general-purpose lane, only
the HOV lane count is significant. When the parameter estimates are examined, the sign on the
estimate (either negative or positive) indicates that the proportion of passing decreases as the
HOV lane count increases when the vehicle originates the pass from the general-purpose lane.
The general-purpose lane vehicles use the HOV lane less for passing as the volume in the HOV
lane increases. The proportion of passing increases as the HOV lane count increases (and as the
adjacent general-purpose lane count decreases) when the passing maneuver begins in the HOV

62
lane. As more vehicles use the HOV lane, the likelihood of being behind a slower-moving
vehicle increases along with the desire to pass. To assist in illustrating these findings, plots were
generated by binning the volume data into 25 veh/5-minute bins. Following is additional
discussion and observations on passing maneuvers.
Table 5-7. Results from Logistic Evaluation of Passing Probability.
Model:
0 1 1 2 2log Prob(Passing) b b X b XProb(Non - Passing)
⎛ ⎞= + +⎜ ⎟
⎝ ⎠ X1: AGP Lane Count X2: HOV Count Separate Analysis by Begin Lane
Nominal Logistic Fit for Passing/Non-passing Begin Lane=general-purpose lane other than adjacent lane Lack Of Fit Source DF -LogLikelihood ChiSquareLack Of Fit 383 39.884919 79.76984Saturated 385 12.389523 Prob>ChiSqFitted 2 52.274441 1.0000 Parameter Estimates Term Estimate Std Error ChiSquare Prob>ChiSqIntercept -3.3696839 1.1625093 8.40 0.0037AGP Lane Count
0.00346447 0.0118529 0.09 0.7701
HOV Count
-0.0436747 0.022974 3.61 0.0573
For log odds of 1/2 (1: Passing, 2: Non-passing) Effect Likelihood Ratio Tests Source Nparm DF L-R
ChiSquare Prob>ChiSq
AGP Lane Count
1 1 0.08689779 0.7682
HOV Count 1 1 5.74767871 0.0165 Nominal Logistic Fit for Passing/Non-passing Begin Lane=general-purpose lane adjacent to HOV lane Lack Of Fit Source DF -LogLikelihood ChiSquareLack Of Fit 536 200.90008 401.8002Saturated 538 418.98715 Prob>ChiSqFitted 2 619.88723 1.0000 Parameter Estimates Term Estimate Std Error ChiSquare Prob>ChiSqIntercept -2.6831479 0.3382772 62.91 <.0001AGP Lane Count
0.00316304 0.0029321 1.16 0.2807
HOV Count
-0.026694 0.0044297 36.32 <.0001
For log odds of 1/2 Effect Likelihood Ratio Tests Source Nparm DF L-R
ChiSquare Prob>ChiSq
AGP Lane Count
1 1 1.18023654 0.2773
HOV Count 1 1 49.0697066 <.0001
Nominal Logistic Fit for Passing/Non-passing Begin Lane=HOV lane Lack Of Fit Source DF -LogLikelihood ChiSquareLack Of Fit 418 237.53848 475.077Saturated 420 320.13398 Prob>ChiSqFitted 2 557.67246 0.0278 Parameter Estimates Term Estimate Std Error ChiSquare Prob>ChiSqIntercept -2.4392746 0.4516752 29.17 <.0001AGP Lane Count
-0.0064884 0.0031608 4.21 0.0401
HOV Count
0.01485387 0.0032355 21.08 <.0001
For log odds of 1/2 Effect Likelihood Ratio Tests Source Nparm DF L-R
ChiSquare Prob>ChiSq
AGP Lane Count
1 1 4.0628714 0.0438
HOV Count 1 1 19.6117748 <.0001

63
The decision to pass should be influenced by the volume and speed present. Similar to
two-lane rural highways, drivers in the HOV lane would be interested in being able to pass a
slower-moving vehicle. The intermediate access opening provides an opportunity to pass the
slower-moving vehicle. Of course, a sufficient gap must be present in the neighboring lane
before the pass will occur. The proportion of passing vehicles as compared to both the 5-minute
HOV lane volume and the volume in the adjacent general-purpose lane are shown in Figure 5-5
and Figure 5-6. A smaller passing proportion is present when the HOV lane volume is high (see
Figure 5-5). This finding is reasonable since there are fewer gaps in the HOV lane to receive the
passing vehicle. A similar trend is present with the adjacent lane volume; however, the
proportion of passing at the lower count levels (representing less than 1200 veh/hr/lane) shows
some variability (see Figure 5-6). At the lower volumes for the general-purpose lane, drivers
may be able to complete their passing maneuver within the general-purpose lane and not have to
use the HOV lane for passing. As volumes increase in the general-purpose lanes, the HOV lane,
which generally has fewer vehicles than the general-purpose lanes, becomes more attractive as a
passing option.
0.0
1.0
2.0
3.0
4.0
5.0
6.0
7.0
0-24 25-49 50-74 75-99 100-124
5-Minute HOV Lane Volume
Pro
porti
on o
f Pas
sing
V
ehic
les
Starting in HOV Starting in GPL
Figure 5-5. Proportion of Passing Vehicles to 5-Minute HOV Lane Volume.

64
0.01.02.03.04.05.06.07.08.09.0
50-74 75-99 100-124 125-149 150-174 175-199
5-Minute Adjacent Lane Volume
Pro
porti
on o
f Pas
sing
V
ehic
les
Starting in HOV Starting in GPL
Figure 5-6. Proportion of Passing Vehicles to 5-Minute Adjacent General-Purpose Lane
Volume.
Most of the drivers performed their passing maneuvers quickly, in general more quickly
than when a single lane change is occurring. Approximately 50 percent of all drivers made their
lane change in under 2 sec. About 65 percent of the drivers in a passing maneuver used less than
2 sec for their lane changes.
Of course, volumes may affect both the desire and the ability of drivers to pass, when the
HOV lane and the adjacent lane are filled with slower-moving vehicles. Thus, drivers may take
more distance to execute the maneuver, at the risk of being a violator on their second lane
change. Passing vehicles crossed the solid white line at a slightly higher percent than all vehicles
observed. Approximately 12 percent of the passing vehicles crossed the solid white line as
compared to 9 percent of all lane changes. Drivers were not able to re-enter their original lane as
quickly as desired.
Maneuver Time
Maneuver time was calculated as being the difference in time between when the vehicle
first crossed the lane line separating the HOV lane and the general-purpose lane to when the

65
vehicle finished crossing the lane line. Note that maneuver time represents the time to cross the
lane line rather than the time to move from the center of one lane to another lane. Comparisons
between sites within this study are appropriate; however, comparing the maneuver time from this
study with time to complete a lane change would not be appropriate without adjusting the data
from this study to account for the extra distance that a vehicle travels moving from the center of
a lane to the lane line and then from the lane line to the center of the new lane. The time to cross
the lane line rather than the time to change lanes was selected in this study to provide a more
consistent technique for collecting the data across the multiple sites.
Table 5-8 lists the average maneuver time for each site. While the data are listed by the
beginning lane of the maneuver, note that the maneuver is still only for the time to cross the lane
line and does not include the time between moving from the original lane to the lane line. The
time to cross the lane line was greater at Rosser (2.24 sec) as compared to the other sites (ranging
between 1.56 and 1.94 sec). Reasons that drivers would take longer at Rosser are not apparent.
Table 5-8. Average Maneuver Time per Site and Lane Origin. Average Maneuver Time (sec)
Origin Lane of Maneuver
Barker-Cypress
920 ft
Whitlock 1100 ft
Rosser 1160 ft
Fry 1350 ft
I-394 1500 ft All Sites
Maneuver began in general-purpose lane not adjacent
to HOV lane
1.42 1.26 1.81 1.51 1.77 1.74
Maneuver began in general-purpose
lane adjacent to HOV lane
1.59 1.64 2.18 1.80 1.91 2.04
Maneuver began in HOV lane 1.74 1.88 2.48 1.62 2.11 2.38
All maneuvers 1.56 1.61 2.24 1.72 1.94 2.10
The time to cross from one lane to another lane may increase as the volume in the
receiving lane increases due to drivers clearly indicating their desire to change lanes (by moving
to the lane line) and then positioning their vehicle to fit within the available gaps at the higher
vehicle volume. Another argument may be that the maneuver time for lower volumes may be

66
higher since drivers are not pressured to complete their maneuver within a small gap. Figure 5-7
shows the distribution of maneuver time for 25 veh/5-minute bins for those moving from the
adjacent general-purpose lane to the HOV lane. Figure 5-8 shows the distribution for those
moving from the HOV lane to the adjacent general-purpose lane. A clear trend of increasing or
decreasing maneuver time for increases in volume is not present in either graph.
Statistical evaluations were conducted to determine if available variables are related to
maneuver time. Variables included in the evaluations were site (or length), the 5-minute volume
counts on the HOV lane and the adjacent general-purpose lane, the access zone, compliance with
the markings, and origin lane of maneuver. While in many cases the variables included in the
evaluation were statistically significant, the overall model was very poor. In most situations the
models would only explain less than 10 percent of the variation in the data. Therefore, although
a particular variable may be related to maneuver time, there are other variables needed to better
explain the variation in maneuver times. For example, characteristics of the driver or the speed
of the vehicle at the time of the maneuver may be able to explain a greater portion of the
variability in maneuver time than the variables currently available.
Maneuver time from adjacent general purpose lane to HOV lane
0%
20%
40%
60%
80%
100%
0-24 25-49 50-74 75-99 100-124 125-149
5-Minute HOV Lane Count
Per
cent
of M
aneu
vers
0-1 1-2 2-3 3-4 >4
Figure 5-7. Percent of Maneuvers for Different Maneuver Times by 5-Minute HOV Lane Count.

67
Maneuver time from HOV lane to general purpose lane
0%
20%
40%
60%
80%
100%
25-49 50-74 75-99 100-124 125-149 150-174 175-199
5-Minute Adjacent Lane Count
Perc
ent o
f Man
euve
rs
0-1 1-2 2-3 >3
Figure 5-8. Percent of Maneuvers for Different Maneuver Times by 5-Minute Adjacent Lane Count.
USE OF TURN SIGNAL
Researchers recorded whether a driver used the turn signal during the maneuver. Data
for approximately 7000 drivers are available for analysis (the use of a turn signal could not be
determined from the video for the remaining vehicles). Figure 5-9 shows the mosaic plots for
opening length, movement category (in, out, abort, or passing), lane of origin for the maneuver,
and compliance. Overall about 55 percent of the drivers used their turn signal. For opening
length, a chi-square statistical test revealed that the use of the turn signal did vary by site.
Additional analysis indicated that the use of a turn signal was not directly related to the length of
the opening. As shown in Figure 5-9 (a) a linear increase (or decrease) in turn signal usage as
the opening length increased is not present. For both the type of movement and the lane of
origin, the data indicated that there are statistical differences. Those moving out of the HOV
lane used their turn signal more than those moving into the HOV lane or in a passing or abort
maneuver. Only 36 percent of those in a passing maneuver used their turn signal. Drivers
making multiple lane changes to reach the HOV lane used their turn signal more frequently than
drivers that were only making one lane change into the HOV lane. The proportion of signal use

68
is independent of whether the driver is in compliance with the markings. For both conditions –
in compliance or not in compliance – about 55 percent of the drivers used their turn signal.
Sig
nal
0.00
0.25
0.50
0.75
1.00
9201100
1160 1350 1500
Length
N
Y
Sig
nal
0.00
0.25
0.50
0.75
1.00
Abort In Out Passing
Reference to HOV
N
Y
(a) Opening Length (b) Movement Category
Sig
nal
0.00
0.25
0.50
0.75
1.00
0 1 2
Rel Begin Lane
N
Y
Sig
nal
0.00
0.25
0.50
0.75
1.00
0 1
Comply
N
Y
(c) Lane of Origin (2=HOV Lane, 1=Lane Adjacent to HOV Lane, and 0=Lanes Not
Adjacent to HOV Lane)
(d) Compliance (0=Crossed the Solid White Lines and 1=Crossed the Broken White
Line) Figure 5-9. Use of Turn Signal.
SPEED
Speed data were collected at Rosser on Monday through Wednesday, May 8-10, 2006.
Technicians divided the data collection into five time periods totaling 8.25 hours, a summary of
which is shown in Table 5-9. During these time periods, technicians recorded 8533 individual
spot speeds in the HOV lane and in Lane 4, adjacent to the HOV lane.
Table 5-9. Number of Vehicles included in Speed Datasets.
Date Day Period Time of Day Hours of Data
Lane 4 Speeds
HOV Speeds
5/8/06 Monday Off-peak 1:30 – 3:00 PM 1.5 1132 580 5/8/06 Monday PM peak 4:45 – 6:15 PM 1.5 1205 1184 5/9/06 Tuesday AM peak 7:15 – 8:30 AM 1.25 669 498 5/9/06 Tuesday Off-peak 8:30 – 10:00 AM 1.5 731 536 5/10/06 Wednesday Off-peak 9:00 – 11:30 AM 2.5 903 1095

69
Comparison of Speeds between Lane 4 and HOV Lane
In general, speeds in the HOV lane were higher than in Lane 4 for corresponding periods
of time. As noted in Chapter 3, technicians could not collect speed data in both lanes for the
entire 8.25 hours; however, a comparison of time periods when data were collected in both lanes
shows higher HOV lane speeds in virtually every time segment. The larger differences in speeds
often corresponded to peak travel times, and could be pinpointed to times when congestion
and/or a downstream incident in the GP lanes caused traffic to slow down substantially in
Lane 4, while the HOV lane was largely unaffected. As an example, Tables 5-10 and 5-11 show
the comparison of Lane 4 and HOV lane speeds for corresponding time periods on May 8.
The rightmost columns of Tables 5-10 and 5-11 show the difference between the HOV
lane speeds and the Lane 4 speeds for each time period. Average speeds in the HOV lane were
between 0.9 and 28.8 mph higher than in Lane 4, and 85th percentile speeds in the HOV lane
were between 0.0 and 14.0 mph higher. Most of the low-magnitude differences were in the off-
peak period, where traffic tended to flow more constantly in all lanes.
Table 5-10. Comparison of Speed Data for May 8 Off-Peak Period.
Start End
Lane 4 Avg
Speed (mph)
Lane 4 85th
Speed (mph)
Lane 4
Count
HOV Avg
Speed (mph)
HOV 85th
Speed (mph)
HOV Count
Avg Diff
(mph)
85th Diff
(mph) 1:50 PM 1:55 PM 69.8 74.2 53 72.2 78.7 14 2.4 4.5 1:55 PM 2:00 PM 67.4 71.0 82 70.8 74.9 35 3.4 3.9 2:00 PM 2:05 PM 69.4 76.0 111 72.1 76.0 30 2.7 0.0 2:05 PM 2:10 PM 67.1 71.0 160 69.9 79.0 37 2.8 8.0 2:10 PM 2:15 PM 70.4 72.0 38 71.3 77.0 29 0.9 5.0 2:15 PM 2:20 PM 65.4 69.0 26 72.1 77.0 43 6.7 8.0 2:20 PM 2:25 PM 66.7 70.0 70 71.9 83.0 49 5.2 13.0 2:25 PM 2:30 PM 66.1 69.0 78 68.4 74.0 29 2.3 5.0 2:30 PM 2:35 PM 69.1 72.0 107 71.1 77.0 44 2.0 5.0 2:35 PM 2:40 PM 65.6 70.0 121 71.5 75.8 35 5.9 5.8 2:40 PM 2:45 PM 68.2 72.0 111 73.2 78.0 52 5.0 6.0 2:45 PM 2:50 PM 66.3 70.0 120 71.6 76.0 38 5.3 6.0 2:50 PM 2:55 PM 65.4 69.0 51 67.0 70.5 20 1.5 1.5

70
Table 5-11. Comparison of Speed Data for May 8 PM Peak Period.
Start End
Lane 4 Avg
Speed (mph)
Lane 4 85th
Speed (mph)
Lane 4
Count
HOV Avg
Speed (mph)
HOV 85th
Speed (mph)
HOV Count
Avg Diff
(mph)
85th Diff
(mph) 5:15 PM 5:20 PM 57.2 61.0 97 64.2 69.0 87 7.0 8.0 5:20 PM 5:25 PM 54.1 59.5 78 62.9 68.0 75 8.8 8.6 5:25 PM 5:30 PM 54.6 59.5 98 64.2 68.0 49 9.6 8.6 5:30 PM 5:35 PM 53.7 59.0 115 61.8 67.0 48 8.0 8.0 5:35 PM 5:40 PM 27.5 49.7 50 56.3 63.1 94 28.8 13.4 5:40 PM 5:45 PM 27.4 41.0 75 45.3 55.0 101 17.9 14.0 5:45 PM 5:50 PM 50.0 53.0 95 57.9 63.0 104 7.9 10.0 5:50 PM 5:55 PM 48.5 54.3 99 62.8 68.0 68 14.3 13.7 5:55 PM 6:00 PM 46.5 60.0 96 59.5 65.0 75 12.9 5.0 6:00 PM 6:05 PM 64.3 69.0 106 66.9 72.0 61 2.7 3.0 6:05 PM 6:10 PM 67.1 72.0 111 69.2 75.0 52 2.1 3.0 6:10 PM 6:15 PM 63.6 71.1 87 69.2 74.0 47 5.6 2.9
Time of Day
Overall the speeds in the HOV lane are generally higher than speeds in Lane 4. The
average speed measured for vehicles in the HOV lane was 64.4 mph, compared to 60.4 mph for
Lane 4 vehicles. Figures 5-10 and 5-11 show that, as expected, speeds are more likely to
fluctuate during the morning and afternoon peak periods due to congestion and incidents, and
these effects can be felt to varying degrees in the GP lanes and the HOV lane.

71
0
10
20
30
40
50
60
70
80
90
100
7:00 8:00 9:00 10:00 11:00 12:00 13:00 14:00 15:00 16:00 17:00 18:00 19:00Time of Day
Lane
4 S
peed
(mph
)
Figure 5-10. Individual Speeds in Lane 4 by Time of Day.
0
10
20
30
40
50
60
70
80
90
100
7:00 8:00 9:00 10:00 11:00 12:00 13:00 14:00 15:00 16:00 17:00 18:00 19:00
Time of Day
HO
V L
ane
Spe
ed (m
ph)
Figure 5-11. Individual Speeds in the HOV Lane by Time of Day.

72
Influence of Congestion and Incidents
In Figures 5-10 and 5-11 most of the speeds are between 60 and 80 mph; however, there
are three time periods identified with speeds recorded below 40 mph. An examination of these
three time periods showed that they corresponded with periods of high congestion and/or an
incident. To investigate the potential effects of congestion and incidents on the types and
characteristics of the maneuvers into or out of the HOV lane, researchers performed a more
detailed review comparing performance during low-speed time periods (when speed in the lane
is less than 40 mph) as compared to high-speed time periods (speed is greater than 60 mph).
Each maneuver that occurred when speed data were available was classified as occurring during
a low-speed time period (less than 40 mph), a high-speed time period (greater than 60 mph), or a
moderate-speed time period (between 40 and 60 mph).
Table 5-12 presents the comparison between the low-speed and high-speed time periods.
About 150 maneuvers were observed during low-speed periods as compared to 750 maneuvers
during high-speed periods; therefore, percentages are used to illustrate the findings. Compliance
with the pavement markings is similar during both high- and low-speed periods for both lanes.
Overall between 14 and 18 percent of the motorists are driving over the solid lines. The level of
passing appears to not be influenced by the speed in the adjacent general-purpose lane. When
speeds are low in the HOV lane, however, no passing maneuvers were observed as compared to
8 percent of all maneuvers in the high-speed in HOV lane period involving a passing maneuver.
Aborts also appear to be more influenced by the lower speeds in the HOV lane as compared to
the general-purpose lane. A slightly higher percentage of the maneuvers were abort maneuvers
when the speeds in the HOV lane were low. The number of maneuvers involving a vehicle
weaving from the ramp to the HOV lane appears to be influenced by low speeds in both the
general-purpose lane and the HOV lane. No maneuvers were recorded for a ramp vehicle
moving to the HOV lane during low-speed periods as compared to 4 to 5 percent of the
maneuvers during high-speed periods. The lower speeds (and associated higher volumes) limit
the availability of gaps needed by drivers to weave across the multiple lanes and access the HOV
lane.

73
Table 5-12. Comparison of Behavior during High- and Low-Speed Periods.
Percent of Maneuvers That Involved the Following Behavior:Speed Level Not in
Compliance Passing Abort Weaving from Ramp
Lane 4 (Adjacent General-Purpose Lane) Speed High
(> 60 mph) 18% 9% 3% 4%
Low (< 40 mph) 17% 8% 2% 0%
HOV Lane Speed High
(> 60 mph) 14% 8% 2% 5%
Low (< 40 mph) 17% 0% 6% 0%
LOCATION OF ACCESS WITH RESPECT TO ENTRANCE RAMP
At one of the field study sites a ramp was located just upstream of the intermediate
access. The ramp vehicles weaving across all the general-purpose lanes and then merging into
the HOV lane could be observed on the video of the site; an example of such a maneuver is
shown in the series of images in Figure 5-12. The access opening began approximately 100 ft
beyond the end of the ramp gore. A vehicle moving from the ramp and entering the HOV lane
near the end of the access opening would have done so in approximately 1250 ft with five lane
changes. This represents lane changes in approximately 250 ft per lane, a distance that is much
less than the values currently being recommended in design guides as shown in Table 2-1.
The maneuver in Figure 5-12 represents the most aggressive lane change maneuver
observed from all the video recorded at every study site. The highlighted pickup truck began at
the entrance ramp and merged across all four general-purpose lanes. Figure 5-12 (d) shows the
lane change from Lane 4 to the HOV lane, which occurs in Zone 2 of the access opening;
therefore, the driver of the pickup completed five lane changes in less than 900 ft from the gore
of the entrance ramp, or about 180 ft per lane change. The final two lane changes were almost
one continuous action by the driver, as were the first two lane changes.
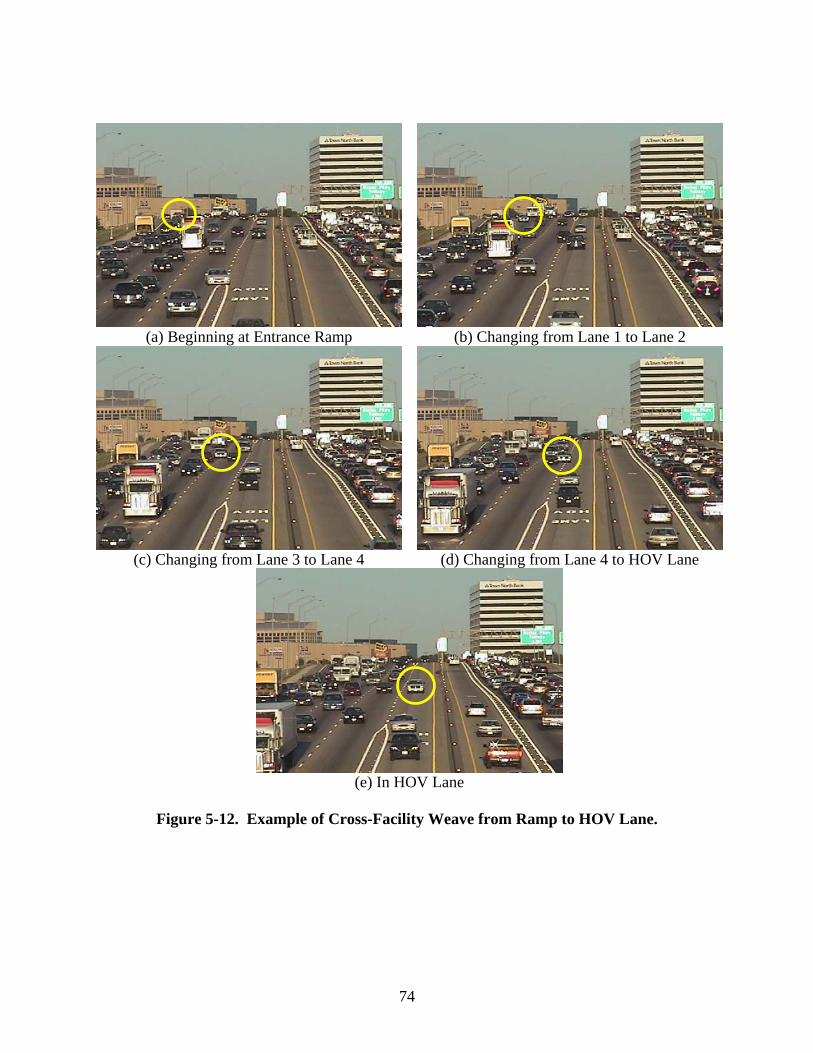
74
(a) Beginning at Entrance Ramp (b) Changing from Lane 1 to Lane 2
(c) Changing from Lane 3 to Lane 4 (d) Changing from Lane 4 to HOV Lane
(e) In HOV Lane
Figure 5-12. Example of Cross-Facility Weave from Ramp to HOV Lane.

75
Obviously, completing this maneuver requires aggressive driving, but it also requires an
assumption of available gaps of adequate length. It would be difficult to thoroughly scan for
gaps in adjacent lanes in a maneuver of this nature, which is why the recommended lane change
values in Table 2-1 and other guides are higher.
Table 5-13 provides the number of ramp vehicles observed during the 21.75 hours of
collected video. Approximately 1.3 percent of the vehicles entering the freeway at the entrance
ramp attempted to enter the HOV lane at the access opening being observed. The 236
maneuvers over the 21.75 hours of data collection represent approximately 11 cross-facility
weaving maneuvers in each hour observed or about one cross-facility weaving maneuver every
5 minutes.
Table 5-13. Number of Vehicles Weaving from Ramp to HOV Lane Observed during Study.
Date, Time Hours of Data Total Number of Ramp Vehicles
Number of Ramp Vehicles Weaving into HOV Lane
Percent of Ramp Vehicles Weaving into HOV Lane
11/16/05 12:50 to 5:05 pm 4.25 4071 112 2.8
5/8/06 1:30 to 7:00 pm 5.5 4971 81 1.6
5/9/06 7 am to 1 pm 6.0 4273 15 0.4
5/10/06 9 am to 3 pm 6.0 5015 28 0.6
Total 21.75 18,330 236 1.3
Of the 236 ramp vehicles observed attempting to enter the HOV lane, six vehicles
aborted their maneuver (i.e., they attempted to enter the HOV lane and were not successful).
These six vehicles represent 2.5 percent of the vehicles that clearly indicated a desire to move
from the ramp to the HOV lane. Additional ramp vehicles may also have been unsuccessful in
their attempts to enter the HOV lane (e.g., not being able to weave across all general-purpose
lanes); however, that number could not be determined from the data.

76
For the remaining 230 ramp vehicles, their entry zone is listed in Table 5-14. Distances
from the end of the painted gore are also provided in the table; however, note that these distances
are approximate and do not reflect the exact distances used by the vehicles in making the
maneuvers. In several cases the driver would cross the painted gore at the start of the maneuver,
which would increase the total distance being used by the driver to complete the cross-facility
maneuver. Most drivers who made the maneuver entered in Zone 3 (the final third of the access
opening) or entered the HOV lane late (i.e., across the solid white lines). Of special note is that
more than one in five of the observed vehicles (23 percent) made the five lane changes in less
than 875 ft.
Table 5-14. Approximate Distance Traveled by Ramp Vehicle Entering HOV Lane. Number of Vehicles Moving from Ramp to HOV Lane
(% of Ramp Vehicles Making Maneuver) Date Zone 1
(100-475 ft from gore)
Zone 2 (475-875 ft from gore)
Zone 3 (875-1250 ft from gore)
Zone 4/Late (more than
1250 ft from gore) 11/16/05 4 (4) 20 (19) 59 (55) 24 (22) 5/8/06 2 (2) 20 (25) 34 (43) 24 (30) 5/9/06 1 (7) 3 (20) 6 (40) 5 (33) 5/10/06 0 (0) 2 (7) 18 (64) 8 (29)
All Days 7 (3) 45 (20) 117 (51) 61 (26)
The speeds of vehicles in both the HOV lane and in the adjacent GP lane were measured
for several hours during the study. While these speeds are not the exact speeds of the weaving
ramp vehicles they can provide an appreciation of the speeds on the freeway during the
maneuvers. The speeds of all vehicles in Lane 4 or the HOV lane within 5 minutes of the subject
ramp vehicle were identified and the 85th percentile speed determined for the 5-minute time
block. Speeds of vehicles in Lane 4 were available during 81 of the ramp vehicle maneuvers and
speeds of vehicles in the HOV lane for 111 ramp vehicle maneuvers. Figure 5-13 shows the
cumulative distribution of the Lane 4 and HOV lane speeds. Over 85 percent of the weaving
maneuvers occurred when the freeway speeds were 55 mph or greater. In all cases, the HOV
lane speed was 55 mph or greater.

77
The cross-facility weaving maneuvers are also occurring during high volume levels. The
number of vehicles in Lane 4 and in the HOV lane was counted for the 5-minute period
associated with the time that the ramp vehicle weaved to the HOV lane (see Table 5-15). Many
of the maneuvers occurred when Lane 4 volumes were as high as 150 vehicles in a 5-minute
period (equivalent to 1800 vehicles/hour/lane). The number of vehicles in the HOV lane for the
majority of the maneuvers was on the order of 25 to 99 vehicles for a 5-minute count
(representing 300 to 1200 vehicles/hour/lane).
0
20
40
60
80
100
0 20 40 60 80Speed During Ramp Vehicles Maneuvers to HOV Lane
(mph)
Cum
ulat
ive
Dis
tribu
tion
(%)
Lane 4 HOV
Figure 5-13. 85th Percentile Speeds on Lane 4 and HOV Lane during Ramp-to-HOV Lane
Maneuvers.

78
Table 5-15. Vehicle Counts during Ramp-to-HOV Lane Maneuvers. HOV
5-minute Count Lane 4
5-minute Count 0-24 25-49 50-74 75-99 100-124 Total 50-74 75-99
100-124 125-149 150-174 175-199 200-224
1 1 0 2 1 0 0
4 0 21 12 48 13 0
0 7 5 7 35 21 0
0 5 0 6 32 6 1
0 0 0 0 0 2 0
5 13 26 27 116 42 1
Total 5 98 75 50 2 230
The observations of vehicles merging from the ramp to the HOV lane indicate that
drivers are completing the maneuver in distances that are shorter than currently recommended.
They are also completing these maneuvers during high volume levels and typical highway
speeds. While these maneuvers are possible, the question still remains if shorter distances are
desirable. Because of limits of the study, specific reactions to these cross-facility weaving
vehicles (e.g., are other vehicles braking or making lane changes to accommodate the weaving
vehicles) and number of accidents at this type of location could not be collected. A TxDOT
research project which began in the fall of 2006 will explore these issues more fully.
The type of buffer between the general-purpose lane and the managed lane should also
have an influence on the weaving behavior. The consequence of using extra distance to
complete the maneuver and enter a buffer-separated lane after the solid white lines have begun is
the small possibility of a ticket. Therefore, drivers may be more willing to attempt the maneuver
when the buffer is markings rather than when the buffer is a raised barrier or pylons. Over
25 percent of the cross-weaving vehicles observed at the study site were not in compliance with
the markings in that they entered the HOV lane after the solid white lines had begun.
VEHICLE POSITION WITHIN LANE
The positions of vehicles within the HOV lane, the lane adjacent to the HOV lane, and
the lane next to the adjacent lane were measured from the video at the Rosser site. Table 5-16
lists the number of vehicles measured along with the average position of the vehicles within each

79
lane. Figure 5-14 illustrates the findings for the condition when only passenger cars are present.
The dot and its associated distance value provide the average lane position for the edge of the
vehicle. For example, at Location 1, vehicles in Lane 3 are an average of 2.60 ft from the lane
line. The error bars extending from the dot represent one standard deviation of the data. When
the bars are longer, greater variation is present within that set of data.
Table 5-16. Vehicle Location within Lanes When Dataset Contains Only Passenger Cars.
Lane 3 All Passenger
Cars
Lane 4 All Passenger Cars
HOV Lane All Passenger
Cars Location Statistics
Left Right Left Right Left Right Average (ft) 2.60 2.29 14.86 21.05 26.69 33.10
Standard Deviation (ft) 0.98 0.78 1.00 0.98 1.00 1.11 1 Sample Size 152 152 238 238 156 156 Average (ft) 2.70 2.15 14.76 20.85 27.08 33.79
Standard Deviation (ft) 0.82 0.83 0.79 0.65 0.98 0.96 2 Sample Size 152 152 212 212 156 156
Change from Location 1 to Location 2 0.10 0.13 -0.10 -0.20 0.38 0.69
I-635 WB at Rosser, DallasOnly Passenger Cars in all Lanes
2.60
8.71
26.69
33.10
2.70
8.85
27.08
33.79
14.86
21.05
14.76
20.85
1111
23.5
3636
22
25
0 1 2 3
Location
Dis
tanc
e (ft
)
Figure 5-14. Vehicle Location When Dataset Contains Only Passenger Cars.
HOV
L4
L3

80
The values for Lane 3 represent a base condition where the HOV lane markings should
not be influencing the position of the vehicles. The difference in position between the two
measurement locations is about 0.1 ft for Lane 3. So vehicles in Lane 3 are maintaining a
relatively straight path within the lane. For Lane 4, the vehicles have shifted approximately
0.1 to 0.2 ft away from the HOV lane. The shift in lane position is more pronounced for the
vehicles in the HOV lane. The shift from the location with the broken line to the location with
the solid white markings is between 0.4 and 0.7 ft.
Therefore, based upon the findings from this single site, vehicles appear to be shifting
their position within the HOV lane in response to the pavement markings. To form a more
conclusive finding regarding the effects of the pavement markings, data are needed from a
similar site with different markings. Such a site is not available within this research project.
Also desirable would be to track individual vehicles from prior to the opening to after the
opening ends to determine if the vehicles were shifting their position after the opening began and
then shifting again after the opening ends. The tracking of individual vehicles would also permit
the association of where the shifting is occurring to the condition of the pavement markings (e.g.,
broken line, transition area, solid line). Specifically tracking vehicles would have required a
different data collection approach than what was needed elsewhere within this research.
Figure 5-15 shows the position of vehicles when the vehicle in the lane adjacent to the
HOV lane is a heavy truck (average width of 8.0 ft versus an average passenger car width of
6.25 ft. Table 5-17 lists the findings. The data in Lane 4 represent only large trucks while the
vehicles in the lanes neighboring Lane 4 are all passenger cars. A similar shift of position within
a lane between the locations within the broken white line to the location with the solid white
parallel lines can be seen. The heavy trucks shifted their position away from the HOV lane by
approximately 0.3 ft. Within the HOV lane the passenger cars were shifting their position by
about 0.5 ft.

81
Table 5-17. Vehicle Location within Lanes When Dataset Contains Heavy Trucks in Lane 4.
Lane 3 All Passenger
Cars
Lane 4 All Heavy Trucks
HOV Lane All Passenger
Cars Location Statistics
Left Right Left Right Left Right Average (ft) 2.13 8.80 13.57 21.78 26.82 33.48
Standard Deviation (ft) 0.89 0.91 0.72 0.71 1.07 1.11 1 Sample Size 86 86 136 136 72 72 Average (ft) 2.43 8.88 13.55 21.46 27.32 33.90
Standard Deviation (ft) 0.83 0.81 0.64 0.58 0.86 0.87 2 Sample Size 86 86 136 136 72 72
Change from Location 1 to Location 2 (ft) 0.30 0.08 -0.02 -0.32 0.50 0.42
I-635 WB at Rosser, DallasLarge Trucks in Lane 4, Passenger Cars in Lane 3 and HOV Lane
2.13
8.80
26.82
33.48
2.43
8.88
27.32
33.90
13.57
21.78
13.55
21.46
11 11
23.5
36 36
22
25
0 1 2 3
Location
Dis
tanc
e (ft
)
Figure 5-15. Vehicle Location When Dataset Contains Heavy Trucks in Lane 4.
HOV
L4
L3

82

83
CHAPTER 6
SUMMARY AND CONCLUSIONS
SUMMARY OF RESEARCH
Access to interior managed lanes has been achieved using elevated ramps and at-grade
ramps. At-grade access includes intermediate access and slip ramp terminal access. The
objective of this TxDOT research project was to develop guidance on intermediate access to and
from buffer-separated toll lanes located within general-purpose lanes. The Appendix contains
the guidance material. This material could be incorporated in future editions of the Managed
Lanes Handbook or portions could be integrated into the Roadway Design Manual, the Texas
Manual on Uniform Traffic Control Devices, or in a TxDOT standard sheet.
For intermediate access openings, other communities recommend opening lengths
between 1300 ft and 2000 ft. While the recommended buffer width is 4 ft or greater, many sites
have a 2- to 3-ft width. Between 500 and 1000 ft per lane change is suggested for determining
where an access opening should be located with respect to upstream entrance ramps or
downstream exit ramps.
To assist in developing the guidance material, researchers recorded operations at five
intermediate access sites. The sites were either to a high-occupancy vehicle lane or a high-
occupancy toll lane and were located in Dallas, Houston, and Minneapolis. The length of the
openings was between 920 and 1500 ft. Speed limits were either 55 or 60 mph, and there were
three to four general-purpose lanes present.
From videotapes of the sites, characteristics of each vehicle that moved into or out of the
managed lane were recorded. Information was collected from the video for approximately
8400 maneuvers. Examples of the characteristics measured included where the vehicle entered
or left the managed lane (early, within one of two or three equal-distance zones, or late), the lane
of origin for the vehicle, and the length of time to complete the lane change. Speeds were
recorded at one of the sites for several days. These speeds were associated with the maneuvers

84
so that a comparison could be made when high speeds were present versus when low speeds
were present. Volume counts for 5-minute periods were associated with each maneuver.
While watching the videotapes at one of the sites the researchers noticed that it appeared
that vehicles were shifting their position within the lane as they drove near the access opening
especially at the start of the opening. The styles of the markings at this site may be influencing
drivers. To verify the observation that drivers were shifting their vehicle position within the lane,
vehicle positions were measured from the video. Measurements were recorded at two locations
– location 1 was about 360 ft prior to the transition between broken lane line and solid lane lines
and location 2 was about 120 ft after the transition.
A summary of key findings from the research is included in the following section.
CONCLUSIONS
Following are the major conclusions from the research.
Maneuvers
The number of attempts to enter or leave the HOV lane was counted for the five sites.
Key findings include the following:
• A surprisingly large number of maneuvers (7 percent) were vehicles passing a slower-
moving vehicle.
• For those moving in or out of the HOV lane, about three-fourths of the drivers began
their lane change in the initial two-thirds of the opening.
• Approximately 9 percent of those moving into the HOV lane and 8 percent of those
moving out of the HOV lane crossed the solid white markings (i.e., were not in
compliance with the pavement markings). The percent of non-compliance increased
to about 15 percent during those periods with low speeds (less than 40 mph) and high
speeds (greater than 60 mph).

85
• The percent of maneuvers in compliance with the pavement markings varied by the
length of the intermediate access opening. The compliance rate was greater for the
longer access opening length (1500 ft) as compared to the 1160-ft access opening
length.
Passing Maneuvers
A surprisingly large number of maneuvers at the intermediate access openings involved
vehicles passing slower-moving vehicles. Over 7 percent of all maneuvers involved a passing
vehicle. At the two sites with the larger quantity of data, between 40 and 80 percent of the
passing vehicles involved a vehicle leaving the HOV lane to pass a slower vehicle in the HOV
lane. The proportion of passing maneuvers was found to be statistically related to the 5-minute
HOV lane volume count. As the HOV lane volume increases, the proportion of passing
maneuvers initiated from general-purpose lanes decreases. Depending upon the characteristics
of a site, the provision of a passing lane within a one-lane managed-lane facility could improve
service.
Maneuver Time
Maneuver time was calculated as being the difference in time between (a) when the
vehicle first crossed the lane line separating the HOV lane and the general-purpose lane and (b)
when the vehicle finished crossing the lane line. The average time to cross the lane line was
2.1 seconds for all the sites. While selected variables were found to be related to maneuver time,
the relationship between the variables and maneuver time was not always logical and the
variables only explained at best 10 percent of the variation in the data. Other variables are
needed to better explain why drivers use more (or less) time to cross the lane line to or from the
HOV lane.

86
Location of Access with Respect to Other Ramps
Findings from one field site demonstrated the following:
• When presented with the opportunity to enter a managed lane that is located very
close to an entrance ramp, drivers will attempt to cross multiple lanes to do so. At
one location, vehicles were observed to weave from the entrance ramp across four
general-purpose lanes and enter the HOV lane in distances that are shorter than
currently recommended.
• Most drivers who made the ramp-to-HOV lane weave maneuver entered in:
o Zone 3 (the final third of the access opening, which would represent
between 875 and 1250 ft of weaving distance as a minimum; distance is
probably longer since many drivers were observed driving over the
marked gore at the start of the maneuver) or
o the HOV lane late (which would represent greater than 1250 ft of
weaving).
• A small number (2.5 percent) of the ramp vehicles attempting to enter the HOV lane
aborted their maneuver near the HOV lane. Additional ramp vehicles may also have
been unsuccessful in their attempt to enter the HOV lane; however, that number could
not be determined from the data.
• The successful weaving of ramp vehicles across multiple lanes occurred at typical
freeway speeds and during high volumes.
The above findings represent only one site. Another TxDOT project which began in the
fall of 2006 will more fully examine the issues associated with the location of the access
opening.
Vehicle Position within Lane
Based upon the findings from a single site, vehicles appear to be shifting their position
within the HOV lane and in some cases the lane adjacent to the HOV lane in response to the
pavement markings. The transition from broken lane line to solid double lane lines includes a

87
point (see Figure 2-10) that may be drawing the driver’s attention. To minimize that potential,
the researchers recommend that the solid lane lines end without having the point and that the
broken lane line continues from the solid lane line that is closest to the general-purpose lane (see
the Appendix).

88

89
APPENDIX
GUIDELINES
To permit intermediate access to a buffer-separated managed lane from the general-
purpose lane, an intermediate access opening can be used. Figure A-1 illustrates key dimensions
for an intermediate access opening.
The use of at-grade access is not intended to serve every on- and off-ramp. Crash rates
have been found to be higher at buffer- versus barrier-separated managed lanes with many of the
crashes associated with the access openings. Therefore the inclusion of an intermediate opening
needs to consider the trade-offs between safety and operations. Following are additional
suggestions to consider on when and where to include intermediate openings (2):
• to serve every freeway-to-freeway connection,
• to serve high volume ramps,
• to serve ramps with high number of carpools,
• when adjacent to park and ride facilities,
• when requested by transit districts,
• to assist in the modification of local commute patterns (may be at local request),
• to help balance and optimize interchange operational level of service within a local
jurisdiction, within a corridor, or within a region, and
• to support and encourage ride sharing programs (HOV lane demand/usage).

90
See Detail A See Detail C
Shoulder
Intermediate Access
Managed Lane
4" WhiteLane Lines
4" YellowEdge Line
GeneralPurposeLanes
1300' Minimum - 1500' Desired
Shoulder or Median
All pavement marking materials shall meet the required Departmental Material Specifications as specified in plans.
= Direction of travel.
Notes:
4' T
ypic
al
Managed Lane
General Purpose Lane
8" White Line
8" White Line
Detail A
8" White Line4'
Typ
ical
Detail C
3' 3' 12'12'
Managed Lane
General Purpose Lane
3' 12'
45'
Raised Pavement Markers Type II-C-R
8" White Line
Detail B
3' 3' 12'12'
Managed Lane
General Purpose Lane
3' 12'
45'
Raised Pavement Markers Type II-C-R
3'
See Detail B
Raised Pavement Markers Type I-C or Type II-C-R
40' Max. - 20' Desirable1" Gap
Figure A-1. Intermediate Access Opening.

91
REFERENCES
1 Kuhn, B., G. Goodin, A. Ballard, M. Brewer, R. Brydia, J. Carson, S. Chrysler, T. Collier,
K. Fitzpatrick, D. Jasek, C. Toycen, and G. Ullman. Managed Lanes Handbook. Report No.
FHWA/TX-06/0-4160-24, Texas Transportation Institute, The Texas A&M University
System, College Station, TX, October 2005.
2 Caltrans. High-Occupancy Vehicle Guidelines for Planning, Design and Operations.
Sacramento, CA. 2003. Accessed from:
http://www.dot.ca.gov/hq/traffops/systemops/hov/hov_sys/guidelines/index.html. Accessed
August 2006.
3 Texas Department of Transportation. Roadway Design Manual. Austin, TX,
October 2005. http://manuals.dot.state.tx.us/dynaweb/coldesig/rdw/@Generic__BookView.
Accessed November 2005.
4 Highway Capacity Manual. Transportation Research Board, National Research Council,
2000.
5 Cothron, A. S., S. E. Ranft, C. H. Walters, D. W. Fenno, and D. Lord. Crash Analysis of
Selected High-Occupancy Vehicle Facilities in Texas: Methodology, Findings, and
Recommendations. Report 0-4434-1, Texas Transportation Institute, The Texas A&M
University System, College Station, TX, 2004.
6 A Guide for HOT Lane Development. Federal Highway Administration, U.S. Department of
Transportation, Washington, DC, March 2003.
7 Utah Department of Transportation. “I-15 Express Lane Access Sign Detail.” Sheet No.
DT-06, March 2006.
8 Utah Department of Transportation. “I-15 Express Lane Access Detail.” Sheet No. DT-05,
March 2006.
9 Guide for High-Occupancy Vehicle Facilities. American Association of State Highway and
Transportation Officials, Washington, DC, 2004.
10 “Opinions on the Minneapolis HOT Project Generally Positive After Nearly One Year of
Operation.” Urban Transportation Monitor, April 14, 2006.

92
11 Texas Department of Transportation. Texas Manual on Uniform Traffic Control Devices,
Austin, TX, March 2006. http://www.dot.state.tx.us/trf/mutcd2006.htm. Accessed
August 2006.
12 I-35E South of Valwood/Valley View, Northbound Access Opening, Dallas, Texas -- Base
Map with 2005 Aerial Photo. Accessed from: www.dfwmaps.com. Accessed October 21,
2005.
13 Typical Standards for Freeway Pavement Markings, Entrance and Exit Ramps. FPM(2)-
00A. Texas Department of Transportation, Austin, TX, August 2000. Accessed from:
ftp://ftp.dot.state.tx.us/pub/txdot-info/cmd/cserve/standard/traffic/fpm2000.pdf. Accessed
August 2006.
14 A Policy on Geometric Design of Highways and Streets. American Association of State
Highway and Transportation Officials, Washington, DC, 2001.
15 Venglar, S., D. Fenno, S. Goel, and P. Shrader. Managed Lanes – Traffic Modeling. Report
No. FHWA/TX-02/0-4160-4, Texas Transportation Institute, The Texas A&M University
System, College Station, TX, January 2002.
16 Fitzpatrick, K., M. A. Brewer, and S. Venglar. Managed Lane Ramp and Roadway Design
Issues. Report No. FHWA/TX-03/0-4160-10, Texas Transportation Institute, The Texas
A&M University System, College Station, TX, January 2003.
17 Fuhs, C. A. High-Occupancy Vehicle Facilities: A Planning, Design, and Operations
Manual. Parsons Brinckerhoff, Inc., New York, NY, December 1990.
18 TxDOT DalTrans. I-635 at Josey. Accessed from: http://www.daltrans.org/dal-cam-nf.asp.
Accessed June 29, 2006.
19 MnDOT Regional Transportation Management Center. Accessed from:
http://www.dot.state.mn.us/tmc/trafficinfo/metrocams/cameras/reference/c906ref.html.
Accessed June 29, 2006.