interlaboratory proficiency test determination of...
TRANSCRIPT

Istituto Superiore di Sanità IZS Lombardia ed Emilia Romagna
Dip. Sanità Pubblica Veterinaria e Sicurezza Alimentare “Bruno Ubertini”
Laboratorio Nazionale di Riferimento per il
latte e i prodotti a base di latte
Centro di Referenza Nazionale per la
qualità del latte bovino
final report rev. 0
Interlaboratory Proficiency Test
Determination of alkaline phosphatase activity in milk with fluorimetric method
in semi-skimmed lyophilized cow milk
PT code : PT-IZSLER-ALP1 2014
date of publication: 12 november 2014
English version

____________________________________________________________________________________________________________ Report: PT-IZSLER-ALP1 2014 Page 2 of 20
PT-IZSLER-ALP1 2014
Determination of alkaline phosphatase activity in milk with fluorimetric method
in semi skimmed lyophilized cow milk
Date of the trial july 2014
Revision number REPORT FINALE – rev. 0
Code PT-IZSLER-ALP1 2014
Responsible draft report Dr. E. Buffoli Centro di Referenza Nazionale Qualità Latte Bovino
Responsible statistic elaboration A. Marcolini Centro di Referenza Nazionale Qualità Latte Bovino
Responsible samples organization Dr.ssa M.R. Massaro LNR per il latte e i prodotti a base di latte
Responsible coordination and supervision
Dr. G. Bolzoni Centro di Referenza Nazionale Qualità Latte Bovino Dr.ssa A.M. Ferrini LNR per il latte e i prodotti a base di latte
Date report 12 novembre 2014
Centro di Referenza Nazionale Qualità Latte Bovino/Italian Reference Centre for Cow Milk Quality
(RC-CMQ)
Tel. (+39) 0302290 (541) (225) (246) (284)
Fax (+39) 0302290537 ; e-mail: [email protected]
Laboratorio Nazionale di Riferimento per il latte e i prodotti a base di latte/ Italian NRL for milk and
milk products ( NRL-MMP)
Tel. (+39) 06 4990 2368 (3516)
Fax (+39) 06 4990 2368 ; e-mail: [email protected]

____________________________________________________________________________________________________________ Report: PT-IZSLER-ALP1 2014 Page 3 of 20
Introduction
The activity of phosphatase alkaline is considered to be the main pasteurization tracer of milk.
COMMISSION REGULATION (EC) No 1664/2006 amending Regulation (EC) No 2074/2005,
establishes that ISO 11816:1 “Milk and milk products – determination of alkaline phosphatase activity
– Part 1: Fluorimetric method for milk and milk-based drinks” is the method to apply as reference
method for the determination of alkaline phosphatase activity in milk. The same Regulation establishes
also that:
2. The alkaline phosphatase activity is expressed as milliunits of enzyme activity per litre (mU/l). A unit of alkaline
phosphatase activity is the amount of alkaline phosphatase enzyme that catalyses the transformation of 1 micromole of
substrate per minute.
3. An alkaline phosphatase test is considered to give a negative result if the measured activity in cow's milk is not higher
than 350 mU/l.
4. The use of alternative analytical methods is acceptable when the methods are validated against the reference method ISO
11816:1 in accordance with internationally accepted protocols.
The Italian National Reference Laboratory for Milk and Milk Products (NRL-MMP) in concert with
the Italian Reference Centre for Cow Milk Quality (RC-CMQ) organized in summer 2014 an
interlaboratory comparison (PVI) for the laboratories in charge of the official control in Italy (IIZZSS)
to evaluate their performance with regard to the determination of the activity of alkaline phosphatase
in cow milk with the method prescribed for the official control ISO 11816:1. As consequence, the
number of participant IIZZSS was strongly limited by the availability of the instrument Fluorophos
Test System (Advanced Instruments, Norwood, Us.) and by the possibility to run the analyses with
ISO 11816:1 method.
For this, it was decided to involve in the activities organized at national level by NRL-MMP and RC-
CMQ, also laboratories outside the net of IIZZSS as fruitfully just made , in occasion of the project
for the conversion line for the total bacterial count in milk with cytometric instruments (2012).
The present trial required the preparation of samples with homogeneity and stability characteristics in
compliance with ISO 13528:2005. In the light of resources optimization, it was also the occasion for
field experiments of a Current Research Project (007/2012 financed by the Italian Ministry of Health)
finalized to the preparation of reference materials in lyophilized matrix with assigned values and relative
uncertainties. Finally, the organization of this trial was also an opportunity to start a discussion with
____________________________________________________________________________________________________________ Report: PT-IZSLER-ALP1 2014 Page 4 of 20
EURL- MMP (ANSES in Maisons Alfort) concerning the standardization of samples preparation for
interlaboratory trials.
As prosecution of this study, other activities are just planned at national level, to consider the
performances of laboratories using alternative methods in compliance with Reg. (EC) n°1664/2006 for
the determination of the activity of alkaline phosphatase.
Besides the technical and statistical results, the main value of this work relies on the start of a
coordinated and shared activity in Italy also for the fluorimetric method for the determination of the
phosphatase activity in milk. In fact, although this analysis is a regular and frequent task in a milk
laboratory for the importance of this parameter from hygienic and technologic points of view, yet no
specific interlaboratory trials had been implemented at national level in Italy.
In line with the activities of EURL-MMP and with the scope of a better standardization of the
application of the Reference Method, other dairy matrices will be considered in a near future.
Il Responsabile NRL-MMP Il Dirigente Responsabile
Dott.ssa Anna Maria Ferrini Dr. Giuseppe Bolzoni
Dip Sanità Pubblica Veterinaria e Sicurezza Alimentare RC-CMQ
ISS - Roma IZSLER - Brescia

____________________________________________________________________________________________________________ Report: PT-IZSLER-ALP1 2014 Page 5 of 20
General informations
Participant laboratories
The PT involved 19 laboratories , 2 of which could not send results in time for instrumental problems
and another 1 send the results so late that it was not possible to include it in the statistical elaboration
(tab. 1)
Table 1: participant laboratories
Laboratorio Paese Accreditamento
EURL M-MP A.N.S.E.S Maisons Alfort (F) X
Associazione Allevatori del Friuli Venezia Giulia Codroipo (UD) X
Associazione Regionale Allevatori Lombardia Crema (CR)
Bio-Lat S.n.c. Lusciano (CE) X
Caseificio Sociale di Manciano S.c.a. Manciano (GR)
CASTALAB di Bussolati & Miti Fidenza (PR) X
Centrale del latte di Firenze Pistoia Livorno S.p.a. Firenze (FI)
CHELAB - SILLIKER S.r.l. Resana (TV)
ECO-LAT S.r.l. Lodi (LO) X
EPTA-NORD S.r.l. Conselve (PD)
Francia Latticini S.p.a. Sonnino (LT)
I.Z.S. Lazio Toscana Roma (RM) X
I.Z.S. Lombardia Emilia Romagna - CRNQLB Brescia (BS) X
I.Z.S. Piemonte Liguria Valle d’Aosta Torino (TO) X
Latteria Soresina S.c.a. Peschiera Borromeo (MI)
Marino S.r.l. Santa Maria a Vico (CE) X
Trentingrana - CONCAST S.c.a. Trento (TN) X
Università degli Studi di Milano - DEFENS Milano (MI)
Veneto Agricoltura Thiene (VI) X

____________________________________________________________________________________________________________ Report: PT-IZSLER-ALP1 2014 Page 6 of 20
Organisation of the proficiency testing trial (PT)
Laboratories equipped with Fluorophos® Test System, Advanced Instruments, Norwood, US were
invited by a circular mail to the PT and informed of the method to apply, the number of samples and
the relevant dates for samples reception, analysis and data transmission. Participant laboratories
received the following documents:
- “acknowledgement of receipt “ to fill upon receipt
- “operative protocol ” with all the relevant instructions for the test performance
- “results form” to fill with the analyses results
Samples were shipped in the second week of July 2014. All participants laboratories received the
samples free of charge. The deadline for running the analyses was indicated within the 30 July 2014. No
precise day to run the analyses was required due to the stability of the lyophilized samples.
SAMPLES
Each laboratory received 4 vials. Each vial had to be analyzed three times in repeatability conditions,
starting from the sampling. Vial samples were randomly coded:
- 1 sample “60” → lyophilized/ pasteurized /semi skimmed cow milk
- 1 sample “600” → lyophilized /thermized /semi skimmed cow milk
- 2 samples “6000” (A and B) → lyophilized/no-heat-treated/semi skimmed cow milk (raw milk
diluted 1: 100 with "ALP free" milk to obtain ready to use samples)
One additional vial of lyophilized/“ALP free”/semi skimmed cow milk , labelled “calibrator” was
enclosed in the shipment to verify the calibration ratio of each instrument used for the analyses.
According to the operative protocol, all the vials had to be reconstituted with 2.0 g of demineralized
water on a technical balance, throughly mixed (in case, vortexed) till complete solution and immediately
analyzed after reconstitution.
Laboratories were also requested to report the following functionality controls:
- Daily A/D Test (302 ± 4; 602 ± 12)
- Reagent Control (< 1200)
- Calibration Ratio
- Phosphacheck Controls (facultative): Neg < 10; Normal < 40; Pos 500 ±100 mU/L)

____________________________________________________________________________________________________________ Report: PT-IZSLER-ALP1 2014 Page 7 of 20
Homogeneity and stability of the samples
The homogeneity was preliminarily tested according to ISO guide 35 (Reference materials — General and statistical principles for certification) and , in addition and only for the sample “6000” , also using the results of the inter laboratory test on both vials of the “6000” sample.
Before the interlaboratory test, a number of randomly chosen samples equivalent to the 5% the total
samples prepared for each level of alcaline phosfatase was analysed in duplicate under repeatability
conditions, starting from the sampling.
The between bottles standard deviations (Sbb) obtained by ANOVA analysis were summarized in the
box below. According to the criteria defined in ISO 13528: 2005 B.2, the level of homogeneity
observed was deemed satisfactory for the purposes of use.
Between Bottles Standard Deviation (Sbb):
sample “60” = 2,20 mU/L
sample “600” = 14,78 mU/L
sample “6000” = 173,37 mU/L
sample “6000” = 95 mU/L (evaluated during the PT)
Note: The homogeneity value calculated for each level of determination was successively used for the
evaluation of the expected uncertainty measurement of the samples.
Due to the lyophilized status of the samples the complete series of stability tests is scheduled over a
long term period (5-7 years). A first short-term evaluation was performed in the period elapsing
between the controls on each batch at the production time and the trial, according to ISO 13528:2005
(Statistical methods for use in proficiency testing by interlaboratory comparisons): 4 samples for each
level of alkaline phosphatase were randomly selected and analysed in duplicate under repeatability
conditions, starting from the sampling. Results obtained were fully satisfactory respect to ISO
13528:2005 limits for homogeneity.
RESULTS AND ELABORATION
References:
ISO 13528:2005,
ISO 11816-1:2013
ISO guide 35, 2006
ISO 5725-2:1994
(Excel®)spreadsheets and statistics procedures in code R were used for the elaboration of results.

____________________________________________________________________________________________________________ Report: PT-IZSLER-ALP1 2014 Page 8 of 20
Data received
14 laboratories fully observed the operative indications supplied.
- laboratory 12 sent samples results (with a marked delay), but no data for control of the
instrumental functionality (laboratory 12 results are reported in table 2, but were not considered
in the statistical evaluations)
- laboratory 13 did not run the analyses for prolonged instrument problems
- 2 laboratories did not submit data for the instrument set-up; one of them did not report the
value of the calibration ratio (however both labs were kept in the final elaboration)
- 1 laboratory reported difficulties in the dissolution of 2 samples pointing out particulate matter
in suspension
- No one submitted comments on transportation or reception of the material.
ELABORATION
The test results are summarized in Table 2. The calculation of the expected values at all the levels of alkaline phosphatase was made by robust estimation, as specified by ISO 13528: 2005 5.6.1 and 5.6.2.
Table 2: -Results of the analyses (expressed in mU / L)
LAB.
code
Sample 60 Sample 600 Sample 6000 A Sample 6000 B
Rep. A Rep. B Rep. C Rep. A Rep. B Rep. C Rep. A Rep. B Rep. C Rep. A Rep. B Rep. C
1 104,8 98,4 100,7 845,4 795,3 786,5 9361 9202 9285 9913 8915 9552
2 66,7 64,4 71,3 530 539,7 523,1 4735 4675 4675 4785 4808 4785
3 132,9 105,7 126,0 942,4 982,8 1027,9 7608 7599 7364 7617 7640 7948
4 39,5 32,6 37,2 965,4 945,6 914,8 7829 7861 7732 7511 7815 8040
5 81 86 88 752 723 752 5953 6059 5953 5811 5778 5769
6 93 93 93 779 777 779 6040 6105 6086 5953 5898 5866
7 133,3 130,6 130,6 954,3 939,6 939,6 7328 7231 7309 7498 7318 7249
8 108 108 100 913 930 928 6997 7185 7052 6836 6804 6730
10 80,9 79,1 84,6 754,4 750,7 745,2 5870 5820 5801 5811 5870 5880
11 52,9 74,9 46 719,4 739,2 719,4 5958 5778 5789 5737 5774 5732
14 83,7 83,7 91,9 647 653 661 5346 5241 5384 4850 4925 5038
15 79,1 73,6 75,4 720,8 715,3 715,3 5829 5939 5985 5930 5834 5737
16 118,1 128,3 109,9 793,4 809,5 807,7 5958 6100 6178 5893 5788 5921
18 84 98 92 745 747 751 5889 5760 5990 5958 5962 5962
19 87,8 87,8 87,8 780,1 778,3 770,5 6109 6063 6050 6017 6063 6096
24 96,1 97,9 97,9 784,7 781,0 782,9 5972 5939 5958 5999 5926 5976
12 96,2 81,3 83,1 642,8 567,6 633,9 4981 4540 4602 n.e. n.e. n.e.
n.a.= not analyzed

____________________________________________________________________________________________________________ Report: PT-IZSLER-ALP1 2014 Page 9 of 20
The overall evaluation of the PT is illustrated in Fig 1 in which, for each participating laboratory and
for each level of alkaline phosphatase , the distribution of the results , the difference between replicas
and the number of eventual "abnormal"results are evidenced
Fig 1. Box-plot
.
12
34
56
78
10
11
14
15
16
18
19
24
40 60 80 100 120
12
34
56
78
10
11
14
15
16
18
19
24
600 700 800 900 1000
12
34
56
78
10
11
14
15
16
18
19
24
5000 6000 7000 8000 9000 10000
sample “60” sample “600” sample “6000”

____________________________________________________________________________________________________________ Report: PT-IZSLER-ALP1 2014 Page 10 of 20
A further overall evaluation of the PT results was made according to the indication of ISO 13528:2005,
8.4. In particular, the repeatability of measurements was evaluated by the Mandel’s k factor (Fig.2) (ISO
5725-2:1994). The sample "6000" with 6 determinations (2 samples in 3 replicates) is in blue whereas
samples "60" and "600" with 3 determinations each, are reported in red. The horizontal lines represent
the limits of the expected deviation, respectively, with P = 99% in whole line and P = 95% in dotted
line.
Note: - Laboratory 1: sample "600" and sample "6000" - Laboratory 3: sample "60" and sample "600" - Laboratory 11: sample "60" - Laboratory 14: Sample "6000" On the contrary, the laboratories 6 and 19 for the sample "60" obtained 2 extremely low indicators, due to numerically identical replicas.
Fig 2 Mandel’s K.

____________________________________________________________________________________________________________ Report: PT-IZSLER-ALP1 2014 Page 11 of 20
The dispersion between laboratories was analyzed through the parameter Mandel's h (Fig 3) , that
represents, for each laboratory, the means of the three samples analyzed also in this case , according
to the limits of significance respectively: P= 99% in whole line and P = 95% in dotted line.
To note:
- Laboratory 1 for the average value of the sample "6000" (P = 99%)
- Laboratory 2 and 4, respectively, for samples "600" and "60" (P = 95%)
Fig. 3: Mandel’s h
Note: it should be noted that these statistical analyses confirm the level of homogeneity of the sample
results (Mandel's k) and low dispersion of the averaged results given by participants (Mandel's h), but
do not individuate real outliers.
The statistics computed and used below for the performance evaluation (robust mean and robust
standard deviation) do not require the selection of "valid" data.
This, after all, well suits the specific purposes of this PT, being the first of its kind at our national level
for this method and being the participant laboratories characterized by no completely uniform
experiences and skill.

____________________________________________________________________________________________________________ Report: PT-IZSLER-ALP1 2014 Page 12 of 20
Definition of the standard deviation assigned for the test:
In the absence of criteria available for all the 3 chosen levels of alkaline phosphatase activity of the
samples for the reference method (ISO 11816-1: 20136), the standard deviation of the observations
obtained in the test, was estimated by the " robust standard deviations of the averaged mean values of
each laboratory, as shown in ISO 13528: 2005 point 6.6.1.
Assigned standard deviation for the PT:
sample “60” = 23.86 mU/L
sample “600” = 117.62 mU/L
sample “6000”= 1058.81 mU/L
Definition of the assigned value X and of its uncertainty Expected values of each level of alkaline phosphatase were fixed as the robust means “X” according to ISO 13528:2005 C.1. The statistical software R (package MetRology, function algA) was used for the application of the algorithms
Assigned value X:
X sample “60”= 90.77 mU/L
X sample “600”= 792.65 mU/L
X sample “6000”= 6297.20 mU/L
Consequently, the uncertainty ux of the assigned values was estimated:
as:
Where:
s * = robust standard deviation of the averages of each laboratory (23,86 for the sample "60", 117.62
for the sample "600", 1058.81 for sample "6000").
p = 16, number of laboratories involved in the estimate.
Standard measurement uncertainty X:
sample “60”= 7.46 mU/L
sample “600”= 36.76 mU/L
sample “6000”= 330. 88 mU/L

____________________________________________________________________________________________________________ Report: PT-IZSLER-ALP1 2014 Page 13 of 20
The estimated uncertainties appear reasonable compared to the criteria defined in ISO 13528: 2005 4.2
The obtained uncertainty of measurement resulted slightly higher than the expected limits, but
acceptable and could therefore be considered negligible in the calculation of the z-score.
Statistics calculation of performances
Laboratory performance was evaluated in terms of z-score:
where :
“x” is the laboratory mean for each level of alkaline phosphatase and “X” the robust mean obtained
from all the results for that level
The performance of each laboratory was estimated according to the following criteria:
• |z| ≤ 2: satisfactory
• 2 < |z| ≤ 3: questionable. The lab should verify its procedures and their implementation
• |z| > 3: unsatisfactory. Controls and corrective actions must be taken
z-score values are reported in tab 3, 4 e 5 ( and fig 4, 5 e 6)
ID
Sample “60” 7,46 7,15
Sample “600” 36,76 35,28
Sample “6000” 330,88 317,64

____________________________________________________________________________________________________________ Report: PT-IZSLER-ALP1 2014 Page 14 of 20
Table 3: Sample “60”
laboratory Averaged values n°data
1 101,30 3 0,44
2 67,46 3 -0,97
3 121,53 3 1,28
4 36,43 3 -2,27
5 85,00 3 -0,24
6 93,00 3 0,09
7 131,50 3 1,70
8 105,33 3 0,61
10 81,53 3 -0,38
11 57,93 3 -1,37
14 86,43 3 -0,18
15 76,03 3 -0,61
16 118,76 3 1,17
18 91,33 3 0,02
19 87,80 3 -0,12
24 97,30 3 0,27
Table 4: sample “600”
laboratory Averaged values n°data
1 809,06 3 0,13
2 530,93 3 -2,22
3 984,36 3 1,62
4 941,93 3 1,26
5 742,33 3 -0,42
6 778,33 3 -0,12
7 944,50 3 1,29
8 923,66 3 1,11
10 750,10 3 -0,36
11 726,00 3 -0,56
14 653,66 3 -1,18
15 717,13 3 -0,64
16 803,53 3 0,09
18 747,66 3 -0,38
19 776,30 3 -0,13
24 782,86 3 -0,08

____________________________________________________________________________________________________________ Report: PT-IZSLER-ALP1 2014 Page 15 of 20
Table 5: sample “6000”
laboratory Averaged values n°data
1 9371,28 6 2,90
2 4743,83 6 -1,46
3 7629,33 6 1,25
4 7798,00 6 1,41
5 5887,16 6 -0,38
6 5991,33 6 -0,28
7 7322,16 6 0,96
8 6934,00 6 0,60
10 5842,00 6 -0,42
11 5794,66 6 -0,47
14 5130,66 6 -1,10
15 5875,66 6 -0,39
16 5973,00 6 -0,30
18 5920,16 6 -0,35
19 6066,33 6 -0,21
24 5961,66 6 -0,31
Fig 4: grafical representation of z-scores for sample “60”

____________________________________________________________________________________________________________ Report: PT-IZSLER-ALP1 2014 Page 16 of 20
Fig 5: grafical representation of z-scores for sample “600”
Fig 6: grafical representation of z-scores for sample “6000”
Evaluation of PT results and conclusions

____________________________________________________________________________________________________________ Report: PT-IZSLER-ALP1 2014 Page 17 of 20
Overall, the PT outcome was considered satisfactory. For each level of contamination the results of 16
laboratories were available and, for each level, "only" 1 of 16 laboratory reported 1 of 3 values of z-
score > 2: Laboratory 4 for sample "60", Laboratory 2 for sample "600", and Laboratory 1 for the
sample "6000". However the performances of these laboratories for the remaining 2 tests were z-
scored in the range of full acceptability (Tab. 3-5 ).
The overall analysis of the z-scores obtained, given that all laboratories applied the same method, could
evidence that the majority of the laboratories were grouped around very low and fairly homogeneous
values. Hence, the overall situation of uniformity of the laboratories involved in this first experience
can be regarded as an element of robustness for the evaluation of the title definition for the reference
material tested in the course of this trial (see Appendix 1).
We thank all the laboratories that with their participation allowed us to get a very representative picture
of the Italian situation in the realization of this PT. Considering the importance of the meaning of the
parameter alkaline phosphatase in milk, it is worth to evaluate in the short future, the performance of
laboratories that use alternative methods for this parameter
IL DIRIGENTE RESPONSABILE
Dr. G. Bolzoni
____________________________________________________________________________________________________________ Report: PT-IZSLER-ALP1 2014 Page 18 of 20
ADDITIONAL CONCLUSION
For information purposes, in Annex 1 are reported some statistical key points that RC-CMQ of
IZSLER of Brescia obtained in the course of the Italian Project (007/2012) for the determination of
the titles and the relative uncertainties of experimental batches of reference material in lyophilized
matrix. In the last table, differences, in terms of mean value and uncertainty of measurement, resulting
from this second step of the work done, are reported.
It results that the contribution of the PT was more than satisfactory. It is in our intention to further
develop the process to determine the title of the reference material produced (and of those currently in
the experimental phase in cream, butter, cheese matrices) through raising the number of collaborating
laboratories.
With this in mind, besides the involvement of much more Italian laboratories for future activities,
preliminary contacts with the EURL-MMP ANSES Paris (who took part in this test) were taken to try
to involve in similar future activities other reference laboratories with clear experience in the
application of the fluorimetric method and comunity interlaboratory trials.
192020
ISTITUTO ZOOPROFILATTICO SPERIMENTALE DELLA LOMBARDIA E DELL'EMILIA ROMAGNA
“BRUNO UBERTINI” (ENTE SANITARIO DI DIRITTO PUBBLICO)
Centro di Referenza Nazionale Qualità Latte Bovino
Sede legale: Via Bianchi, 9 25124 BRESCIA tel. 03022901 fax 0302425251 http://www.izsler.it/
____________________________________________________________________________________________________________ Report: PT-IZSLER-ALP1 2014 Page 19 of 20
ANNEX I
SUMMARY OF EVALUATIONS CONDUCTED FOR THE DEFINITION OF THE
TITLE OF THE REFERENCE MATERIALS
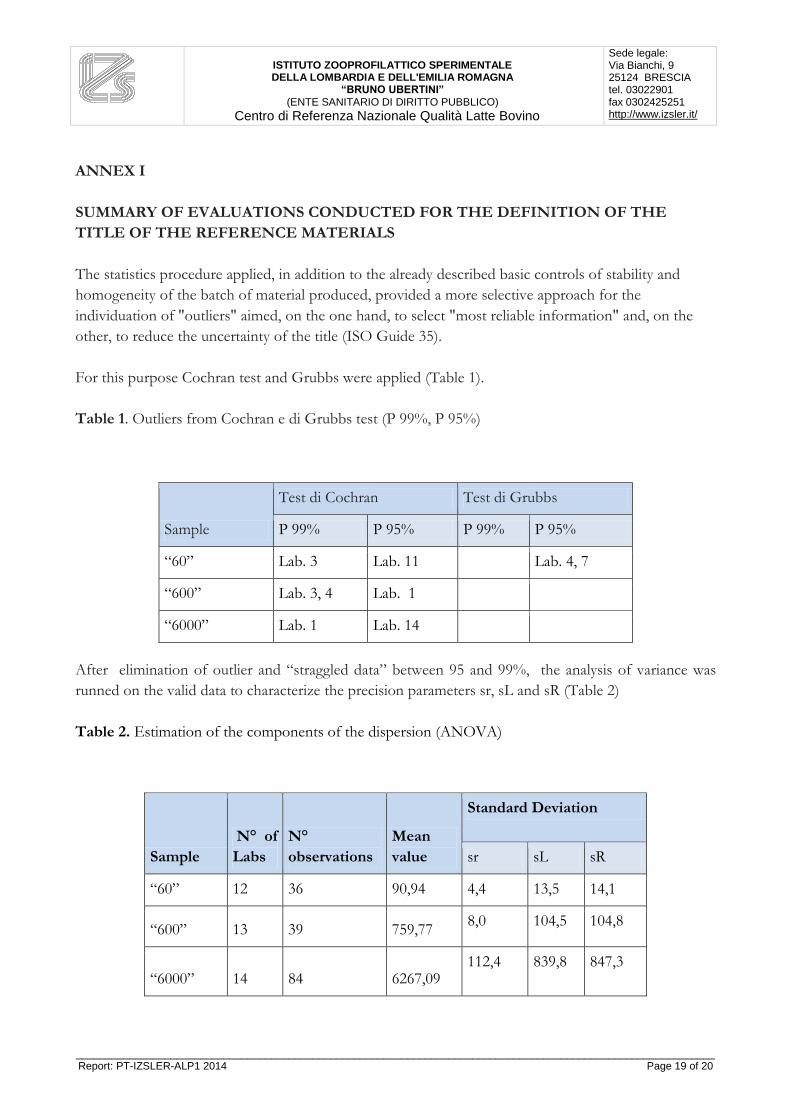
The statistics procedure applied, in addition to the already described basic controls of stability and
homogeneity of the batch of material produced, provided a more selective approach for the
individuation of "outliers" aimed, on the one hand, to select "most reliable information" and, on the
other, to reduce the uncertainty of the title (ISO Guide 35).
For this purpose Cochran test and Grubbs were applied (Table 1).
Table 1. Outliers from Cochran e di Grubbs test (P 99%, P 95%)
Sample
Test di Cochran Test di Grubbs
P 99% P 95% P 99% P 95%
“60” Lab. 3 Lab. 11 Lab. 4, 7
“600” Lab. 3, 4 Lab. 1
“6000” Lab. 1 Lab. 14
After elimination of outlier and “straggled data” between 95 and 99%, the analysis of variance was
runned on the valid data to characterize the precision parameters sr, sL and sR (Table 2)
Table 2. Estimation of the components of the dispersion (ANOVA)
Sample
N° of
Labs
N°
observations
Mean
value
Standard Deviation
sr sL sR
“60” 12 36 90,94 4,4 13,5 14,1
“600” 13 39 759,77 8,0 104,5 104,8
“6000” 14 84 6267,09 112,4 839,8 847,3
202020
ISTITUTO ZOOPROFILATTICO SPERIMENTALE DELLA LOMBARDIA E DELL'EMILIA ROMAGNA
“BRUNO UBERTINI” (ENTE SANITARIO DI DIRITTO PUBBLICO)
Centro di Referenza Nazionale Qualità Latte Bovino
Sede legale: Via Bianchi, 9 25124 BRESCIA tel. 03022901 fax 0302425251 http://www.izsler.it/
____________________________________________________________________________________________________________ Report: PT-IZSLER-ALP1 2014 Page 20 of 20
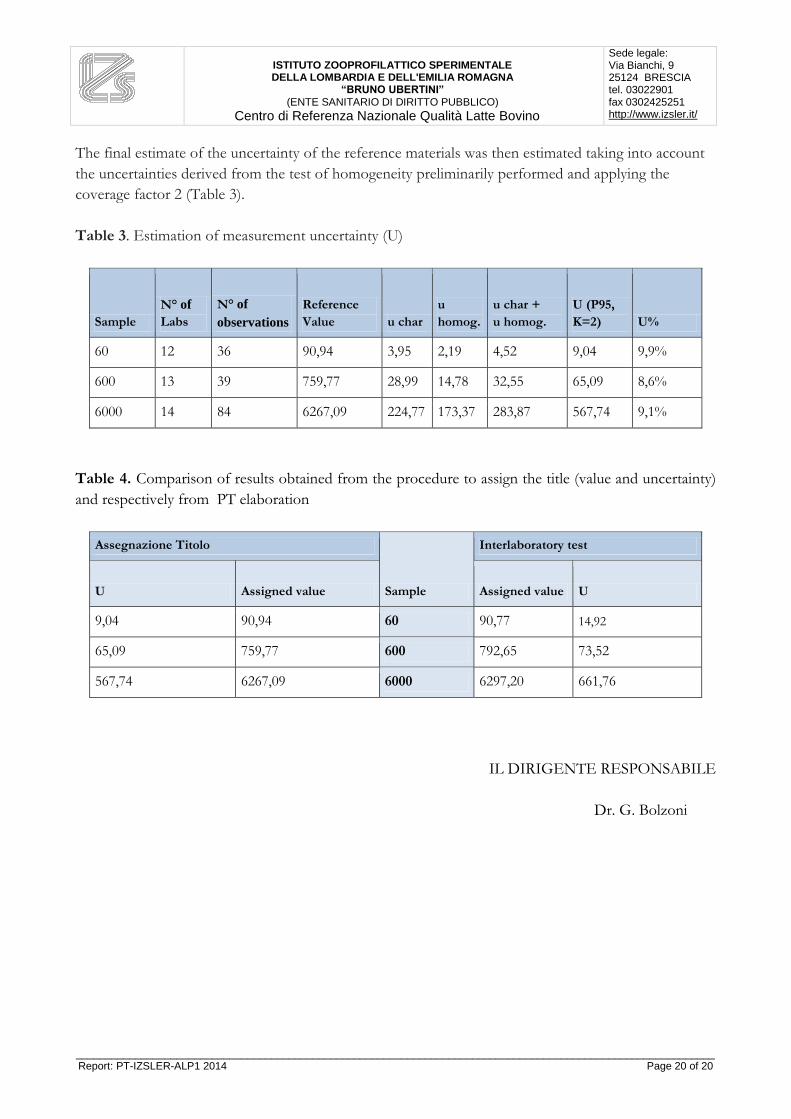
The final estimate of the uncertainty of the reference materials was then estimated taking into account
the uncertainties derived from the test of homogeneity preliminarily performed and applying the
coverage factor 2 (Table 3).
Table 3. Estimation of measurement uncertainty (U)
Sample
N° of
Labs
N° of
observations
Reference
Value u char
u
homog.
u char +
u homog.
U (P95,
K=2) U%
60 12 36 90,94 3,95 2,19 4,52 9,04 9,9%
600 13 39 759,77 28,99 14,78 32,55 65,09 8,6%
6000 14 84 6267,09 224,77 173,37 283,87 567,74 9,1%
Table 4. Comparison of results obtained from the procedure to assign the title (value and uncertainty)
and respectively from PT elaboration
Assegnazione Titolo
Sample
Interlaboratory test
U Assigned value Assigned value U
9,04 90,94 60 90,77 14,92
65,09 759,77 600 792,65 73,52
567,74 6267,09 6000 6297,20 661,76
IL DIRIGENTE RESPONSABILE
Dr. G. Bolzoni