interim results · review of the six months competitive performance from regional segment continued...
TRANSCRIPT

INTERIM RESULTSFOR THE SIX MONTHS ENDED 1 APRIL
2018

PRESENTATION OUTLINE
1 REVIEW OF THE SIX MONTHS
2
3
4
5
6
7
CAPITAL INVESTMENT
FINANCIAL PERFORMANCE
TRADING PERFORMANCE
MARKET-LEADING BRANDS
INNOVATION
OUTLOOK
JOB015236_Rhodes_AnalystBook_SlidesTemplate – May 18, 2018 5:15 PM
RHODES FOOD GROUP INTERIM RESULTS 2018 1
REVIEW OF THE SIX MONTHS
JOB015236_Rhodes_AnalystBook_SlidesTemplate – May 18, 2018 5:15 PM
RHODES FOOD GROUP INTERIM RESULTS 2018 2
REVIEW OF THE SIX MONTHS
▪ Competitive performance from regional segment
▪ Continued market share gains across core categories
▪ Trading conditions constrained domestically and regionally
▪ International impacted by higher canned fruit costs due to drought,
stronger Rand, weak market for industrial purees and concentrates
▪ Acquistions of Pakco and Ma Baker contributed revenue of R209m
▪ Increased capital investment programme
JOB015236_Rhodes_AnalystBook_SlidesTemplate – May 18, 2018 5:15 PM
RHODES FOOD GROUP INTERIM RESULTS 2018 3
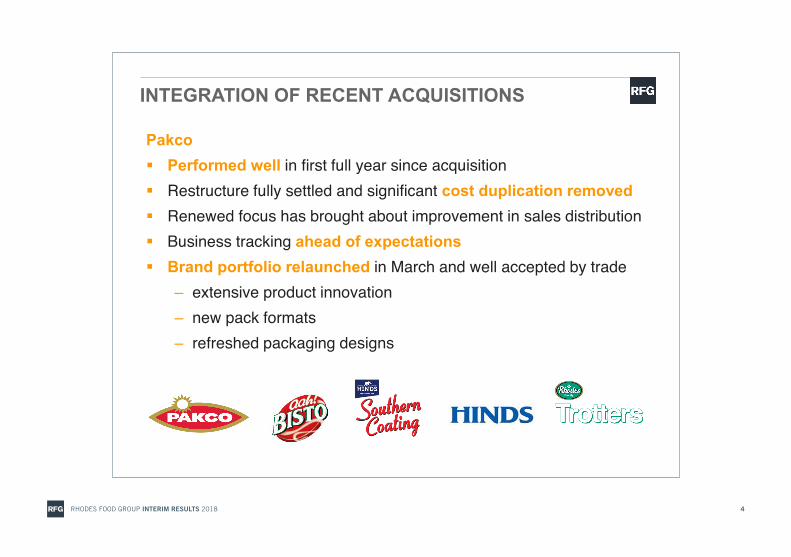
INTEGRATION OF RECENT ACQUISITIONS
Pakco▪ Performed well in first full year since acquisition▪ Restructure fully settled and significant cost duplication removed▪ Renewed focus has brought about improvement in sales distribution▪ Business tracking ahead of expectations▪ Brand portfolio relaunched in March and well accepted by trade
– extensive product innovation– new pack formats– refreshed packaging designs
JOB015236_Rhodes_AnalystBook_SlidesTemplate – May 18, 2018 5:15 PM
RHODES FOOD GROUP INTERIM RESULTS 2018 4

INTEGRATION OF RECENT ACQUISITIONS
Ma Baker▪ Integration has taken longer than initially planned▪ Top-line maintained but operating issues took time to settle▪ Once-off costs resulted in a loss for first half▪ Changes made to management team▪ Pietermaritzburg plant restructured to focus only on baking,
repackaging and distribution▪ Automation of Pinetown plant completed in April▪ Integration challenges addressed and
business now profitable▪ Focus on improving margins to
achieve expected level of profit
JOB015236_Rhodes_AnalystBook_SlidesTemplate – May 18, 2018 5:15 PM
RHODES FOOD GROUP INTERIM RESULTS 2018 5

FINANCIAL PERFORMANCE
JOB015236_Rhodes_AnalystBook_SlidesTemplate – May 18, 2018 5:15 PM
RHODES FOOD GROUP INTERIM RESULTS 2018 6

FINANCIAL PERFORMANCE
▪ Turnover +16.6% to R2.5 billion– Regional +19.5%
– International +3.6%
▪ Gross profit margin 25.3% (2017: 27.1%)– Regional fresh foods impacted by lower Ma Baker margins
– Regional long life foods consistent with prior year
– Increased costs and currency impact on international
▪ Operating cost growth, excluding acquisitions, contained to 9.2%– Depreciation and amortisation R19 million higher owing to higher capex
over past two years and acquisitions of Pakco and Ma Baker
– Further impacted by once-off Ma Baker costs and Alibaba relocation
Note: The reporting period comprises 26 trading weeks compared to 27 weeks in the comparable prior period
JOB015236_Rhodes_AnalystBook_SlidesTemplate – May 18, 2018 5:15 PM
RHODES FOOD GROUP INTERIM RESULTS 2018 7
FINANCIAL PERFORMANCE
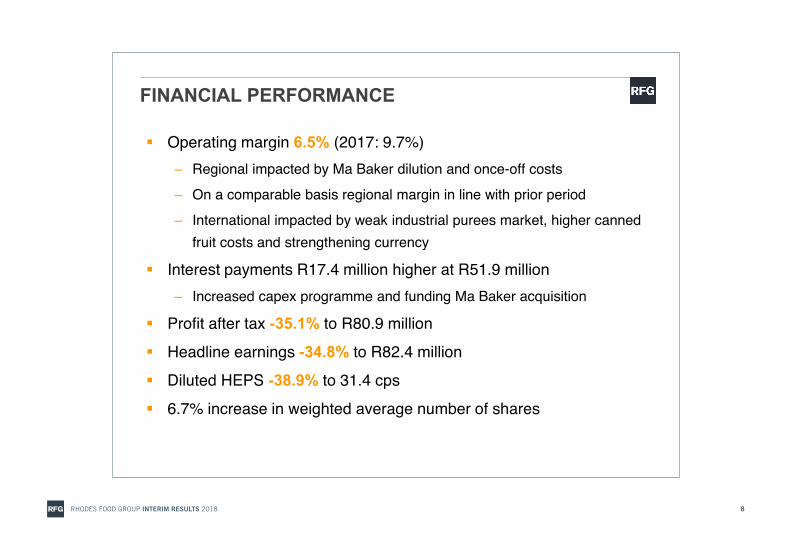
▪ Operating margin 6.5% (2017: 9.7%)– Regional impacted by Ma Baker dilution and once-off costs
– On a comparable basis regional margin in line with prior period
– International impacted by weak industrial purees market, higher canned fruit costs and strengthening currency
▪ Interest payments R17.4 million higher at R51.9 million– Increased capex programme and funding Ma Baker acquisition
▪ Profit after tax -35.1% to R80.9 million
▪ Headline earnings -34.8% to R82.4 million
▪ Diluted HEPS -38.9% to 31.4 cps
▪ 6.7% increase in weighted average number of shares
JOB015236_Rhodes_AnalystBook_SlidesTemplate – May 18, 2018 5:15 PM
RHODES FOOD GROUP INTERIM RESULTS 2018 8

INCOME STATEMENT
R’m H1 2018 H1 2017 % changeTurnover 2 507 2 151 16.6Cost of goods sold (1 874) (1 567) 19.5Gross profit 633 584 8.4
Gross profit margin 25.3% 27.1%Other income 36 41 (11.6)Operating costs (507) (417) 21.7Operating profit 162 208 (22.2)Net interest paid (52) (34) 50.3Profit before tax 110 174 (36.6)Tax (30) (49) (38.7)Profit after tax 80 125 (35.1)
Diluted HEPS 31.4c 51.4c (38.9)WAN shares in issue (‘m) 252.6 236.7 6.7
JOB015236_Rhodes_AnalystBook_SlidesTemplate – May 18, 2018 5:15 PM
RHODES FOOD GROUP INTERIM RESULTS 2018 9
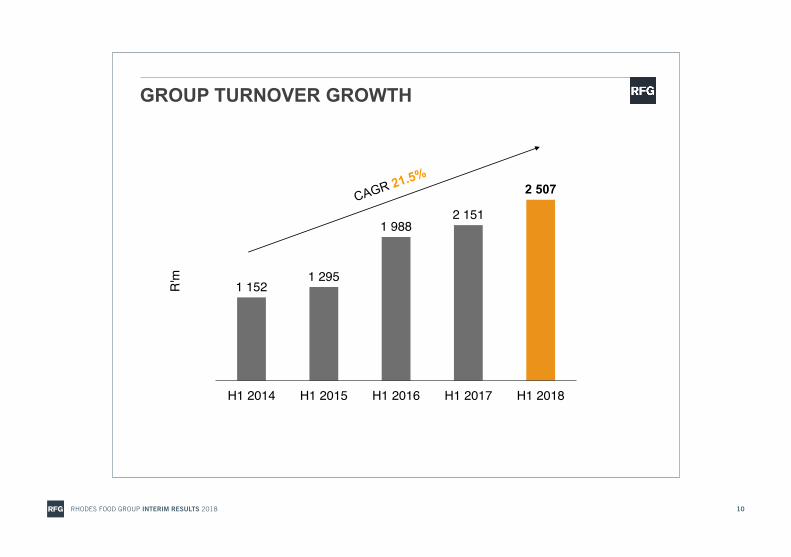
GROUP TURNOVER GROWTH
1 1521 295
1 9882 151
2 507
H1 2014 H1 2015 H1 2016 H1 2017 H1 2018
R'm
JOB015236_Rhodes_AnalystBook_SlidesTemplate – May 18, 2018 5:15 PM
RHODES FOOD GROUP INTERIM RESULTS 2018 10
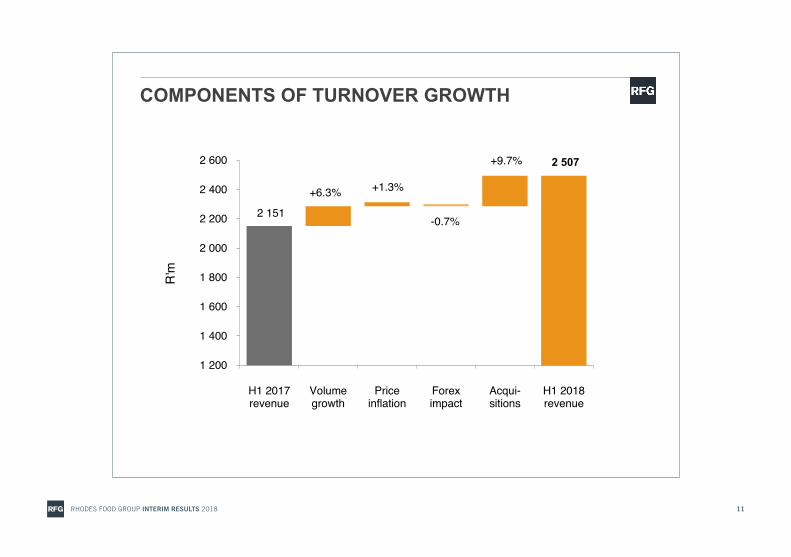
COMPONENTS OF TURNOVER GROWTH
R'm
2 151
+6.3% +1.3%
-0.7%
2 507
1 200
1 400
1 600
1 800
2 000
2 200
2 400
2 600
H1 2017revenue
Volumegrowth
Priceinflation
Foreximpact
Acqui-sitions
H1 2018revenue
+9.7%
JOB015236_Rhodes_AnalystBook_SlidesTemplate – May 18, 2018 5:15 PM
RHODES FOOD GROUP INTERIM RESULTS 2018 11

SEGMENTAL TURNOVER
350 345 500 396 411
429 503
949 1 066 1 251373 447
539 689
845
H1 2014 H1 2015 H1 2016 H1 2017 H1 2018International Regional - Long Life Regional - Fresh
R'm
JOB015236_Rhodes_AnalystBook_SlidesTemplate – May 18, 2018 5:15 PM
RHODES FOOD GROUP INTERIM RESULTS 2018 12
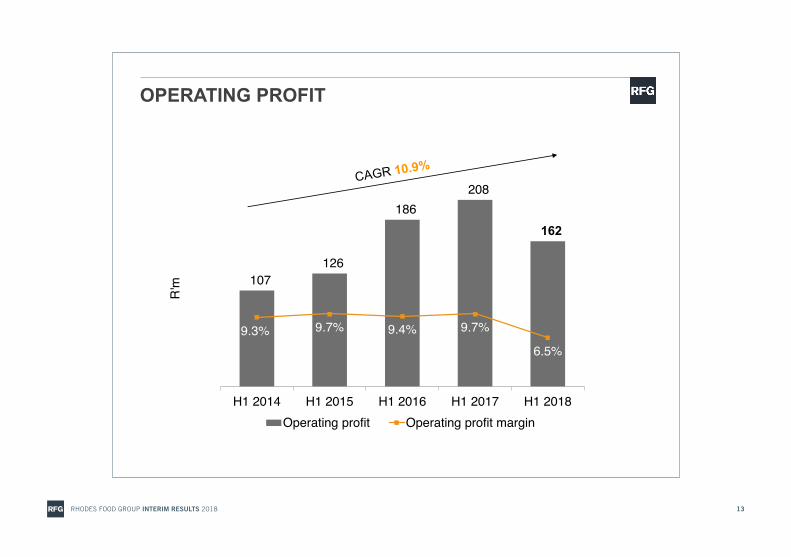
107 126
186 208
162
9.3% 9.7% 9.4% 9.7%
6.5%
0%
5%
10%
15%
20%
25%
30%
-
50
100
150
200
250
H1 2014 H1 2015 H1 2016 H1 2017 H1 2018Operating profit Operating profit margin
OPERATING PROFIT
R'm
JOB015236_Rhodes_AnalystBook_SlidesTemplate – May 18, 2018 5:15 PM
RHODES FOOD GROUP INTERIM RESULTS 2018 13
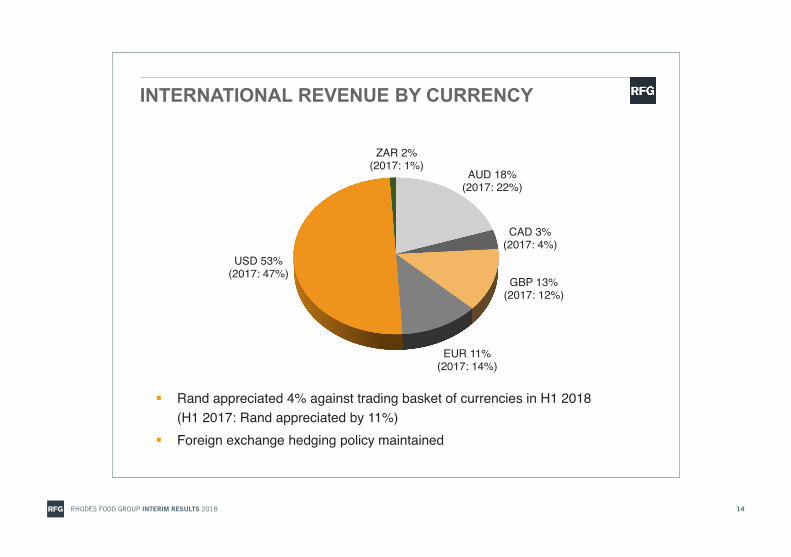
INTERNATIONAL REVENUE BY CURRENCY
AUD 18% (2017: 22%)
CAD 3% (2017: 4%)
GBP 13% (2017: 12%)
EUR 11% (2017: 14%)
USD 53% (2017: 47%)
ZAR 2%(2017: 1%)
▪ Rand appreciated 4% against trading basket of currencies in H1 2018 (H1 2017: Rand appreciated by 11%)
▪ Foreign exchange hedging policy maintained
JOB015236_Rhodes_AnalystBook_SlidesTemplate – May 18, 2018 5:15 PM
RHODES FOOD GROUP INTERIM RESULTS 2018 14

BALANCE SHEET - ASSETS
R’m H1 2018 H1 2017 % change
Non-current assets 2 334 1 914 21.9Property, plant & equipment 1 659 1 272 30.4Intangible assets & goodwill 647 633 2.2Biological assets 11 9 20.0Other non-current assets 17 -
Current assets 2 260 2 103 7.5Inventory 1 393 1 320 5.5Accounts receivable 779 702 11.0Biological assets 11 19 (43.7)Other current assets 60 22 177.8Bank balance & cash on hand 17 40 (56.9)
Total assets 4 594 4 017 14.4
JOB015236_Rhodes_AnalystBook_SlidesTemplate – May 18, 2018 5:15 PM
RHODES FOOD GROUP INTERIM RESULTS 2018 15
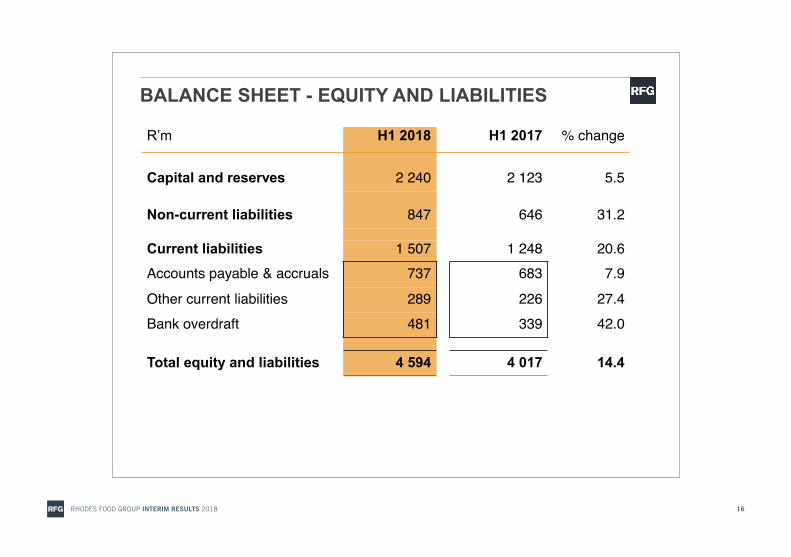
BALANCE SHEET - EQUITY AND LIABILITIES
R’m H1 2018 H1 2017 % change
Capital and reserves 2 240 2 123 5.5
Non-current liabilities 847 646 31.2
Current liabilities 1 507 1 248 20.6Accounts payable & accruals 737 683 7.9
Other current liabilities 289 226 27.4Bank overdraft 481 339 42.0
Total equity and liabilities 4 594 4 017 14.4
JOB015236_Rhodes_AnalystBook_SlidesTemplate – May 18, 2018 5:15 PM
RHODES FOOD GROUP INTERIM RESULTS 2018 16
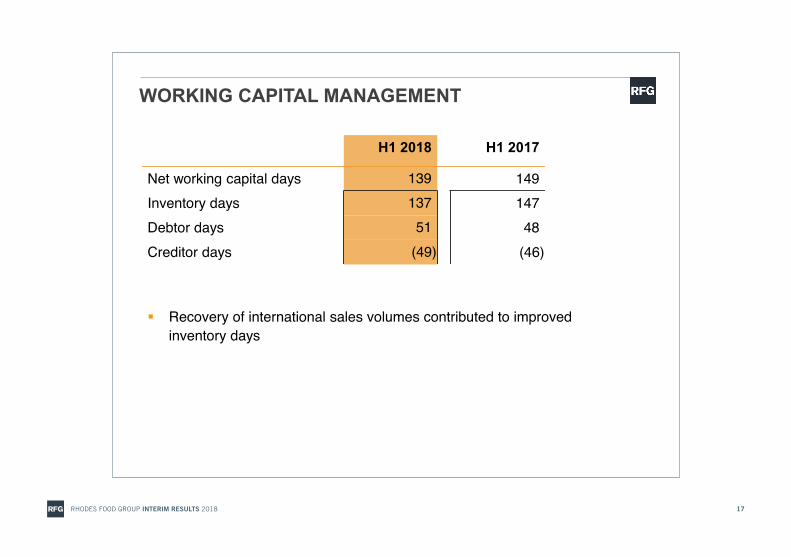
WORKING CAPITAL MANAGEMENT
H1 2018 H1 2017
Net working capital days 139 149Inventory days 137 147Debtor days 51 48Creditor days (49) (46)
▪ Recovery of international sales volumes contributed to improved inventory days
JOB015236_Rhodes_AnalystBook_SlidesTemplate – May 18, 2018 5:15 PM
RHODES FOOD GROUP INTERIM RESULTS 2018 17

CASH MANAGEMENT
240
(103)
(68)76
(82)(105) (3)
(264) (300)
(200)
(100)
-
100
200
300
Operatingcashflows
Workingcapital
changes
Net interestand tax paid
Dividendspaid
Loansraised
Loansrepaid
Other Purchaseand disposal
of PPE
R'm
JOB015236_Rhodes_AnalystBook_SlidesTemplate – May 18, 2018 5:15 PM
RHODES FOOD GROUP INTERIM RESULTS 2018 18

TRADING PERFORMANCE
JOB015236_Rhodes_AnalystBook_SlidesTemplate – May 18, 2018 5:15 PM
RHODES FOOD GROUP INTERIM RESULTS 2018 19

REVENUE CONTRIBUTION
JOB015236_Rhodes_AnalystBook_SlidesTemplate – May 18, 2018 5:15 PM
RHODES FOOD GROUP INTERIM RESULTS 2018 20

REGIONAL PERFORMANCE
R’m H1 2018 H1 2017 % change
Revenue 2 097 1 755 19.5Long Life 1 252 1 066 17.4Fresh 845 689 22.7
Gross profit margin 27.5% 28.9%Operating profit 164 162 1.4Operating profit margin 7.8% 9.2%
▪ Components of turnover growth– Volume growth 5.1%– Price/mix 2.5%– Acquisitions 11.9%
▪ Operating margin diluted by once-off costs and Ma Baker loss in Fresh Foods
JOB015236_Rhodes_AnalystBook_SlidesTemplate – May 18, 2018 5:15 PM
RHODES FOOD GROUP INTERIM RESULTS 2018 21

REGIONAL PERFORMANCE
▪ Continued strong organic growth
▪ Strong performance from bakery category, driven by new products
▪ Continued good growth in pies, snacking and ready meals
▪ Fruit juice performed well in highly competitive environment
▪ Manufacturing and distribution agreement concluded with BOS Brands
▪ Sales in sub-Saharan Africa slowed to 19.6% as strengthening Rand
made products less price competitive in certain markets
▪ Pakco products gaining good traction and new launches will add further momentum
JOB015236_Rhodes_AnalystBook_SlidesTemplate – May 18, 2018 5:15 PM
RHODES FOOD GROUP INTERIM RESULTS 2018 22

INTERNATIONAL PERFORMANCE
R’m H1 2018 H1 2017 % change
Revenue 411 396 3.6Gross profit margin 16.8% 25.3%Operating (loss)/profit (1) 50 (102.7)Operating profit margin (0.5)% 12.6%
▪ Components of turnover growth– Price/mix (4.1)%– Volumes 11.5%– Forex (3.9)%
▪ R51m movement in operating profit had a significant effect on group results▪ Canned fruit market stable but H1 operating margin well below guided 10%▪ Losses incurred on industrial products
JOB015236_Rhodes_AnalystBook_SlidesTemplate – May 18, 2018 5:15 PM
RHODES FOOD GROUP INTERIM RESULTS 2018 23

INTERNATIONAL PERFORMANCE
▪ Export volumes recovered
▪ Impacted by increased cost of canned fruit owing to drought in
Western Cape over the past two years
▪ Industrial puree market remains weak
▪ Further impacted by strengthening Rand
▪ Industrial product costs will reduce in H2 due to the lower price
paid for fruit
▪ Business is on track to be utilising 50% of industrial product output
internally by 2019
JOB015236_Rhodes_AnalystBook_SlidesTemplate – May 18, 2018 5:15 PM
RHODES FOOD GROUP INTERIM RESULTS 2018 24
CAPITAL INVESTMENT PROGRAMME
JOB015236_Rhodes_AnalystBook_SlidesTemplate – May 18, 2018 5:15 PM
RHODES FOOD GROUP INTERIM RESULTS 2018 25

WELL CAPITALISED PRODUCTION BASE
15 production facilities located close to source
of raw materials and markets
* Site being consolidated into facilities at Groot Drakenstein
*
JOB015236_Rhodes_AnalystBook_SlidesTemplate – May 18, 2018 5:15 PM
RHODES FOOD GROUP INTERIM RESULTS 2018 26

INCREASED CAPITAL INVESTMENT
▪ Ongoing investment to expand capacity and enhance efficiencies across production base
▪ R1bn capital investment programme from 2017 – 2019
▪ Estimated R850m invested in FY2017 and FY2018
▪ Investing in new and upgraded facilities, mainly for new product categories entered through acquisition
▪ Priority to ensure projects are completed in FY2018 to generate returns to enhance group earnings
▪ Capex to reduce in FY2019 and normalise in FY2020
JOB015236_Rhodes_AnalystBook_SlidesTemplate – May 18, 2018 5:15 PM
RHODES FOOD GROUP INTERIM RESULTS 2018 27
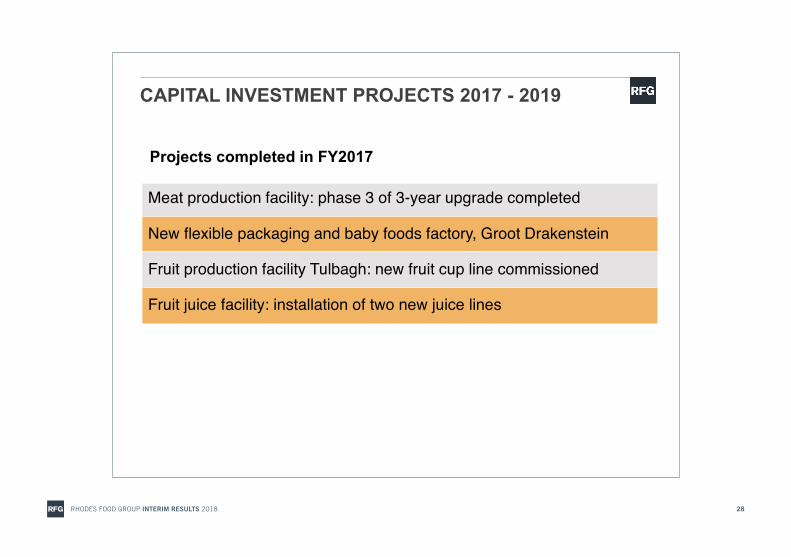
CAPITAL INVESTMENT PROJECTS 2017 - 2019
Projects completed in FY2017
Meat production facility: phase 3 of 3-year upgrade completed
New flexible packaging and baby foods factory, Groot Drakenstein
Fruit production facility Tulbagh: new fruit cup line commissioned
Fruit juice facility: installation of two new juice lines
JOB015236_Rhodes_AnalystBook_SlidesTemplate – May 18, 2018 5:15 PM
RHODES FOOD GROUP INTERIM RESULTS 2018 28

CAPITAL INVESTMENT PROJECTS 2017 - 2019
Installation of clear base juice concentrate plant**Relocation of pulps and purees to Groot Drakenstein
New food technology laboratory and product development centre**Dry packed foods (Pakco): overhaul of dry-packed facility and installation of two new packaging lines**
New baked bean production facility, Krugersdorp**Pies and pastries KZN (Ma Baker): new automated pie making line**
Bakery facility: installation of new line for non-pie pastry products**Expansion of ready meals plant to accommodate consolidation of snacking (former Alibaba Foods business) (early FY2019 completion)
New 1 000ha pineapple plantation on leased land in Swaziland (over three years)
** Projects completed during H1 and early H2 FY2018
JOB015236_Rhodes_AnalystBook_SlidesTemplate – May 18, 2018 5:15 PM
RHODES FOOD GROUP INTERIM RESULTS 2018 29

CAPITAL INVESTMENT PROJECTS
Groot Drakensteinproduction hub
Dairy plant
New lab and product development centre
Fruit cold stores
Ready meals plant
New ready meals factory services
New ready meals extension
New clear juice plantNew pulps and purees location
Regional DC
New baby food plant
Ready meals bulk store
RFG head office
JOB015236_Rhodes_AnalystBook_SlidesTemplate – May 18, 2018 5:15 PM
RHODES FOOD GROUP INTERIM RESULTS 2018 30

CAPITAL INVESTMENT PROJECTS
Food technology laboratory and product development centre Groot Drakenstein
JOB015236_Rhodes_AnalystBook_SlidesTemplate – May 18, 2018 5:15 PM
RHODES FOOD GROUP INTERIM RESULTS 2018 31
CAPITAL INVESTMENT PROJECTS
Clear juice concentrate plantGroot Drakenstein
JOB015236_Rhodes_AnalystBook_SlidesTemplate – May 18, 2018 5:15 PM
RHODES FOOD GROUP INTERIM RESULTS 2018 32
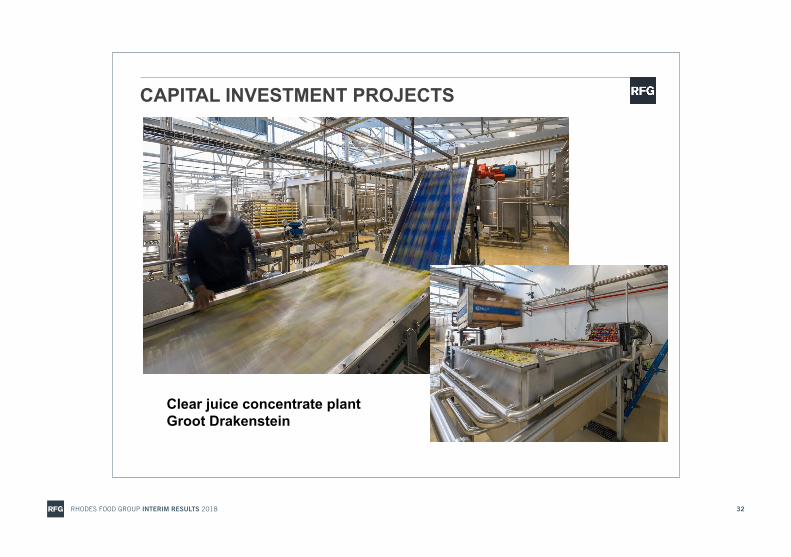
CAPITAL INVESTMENT PROJECTS
Clear juice concentrate plant
JOB015236_Rhodes_AnalystBook_SlidesTemplate – May 18, 2018 5:15 PM
RHODES FOOD GROUP INTERIM RESULTS 2018 33

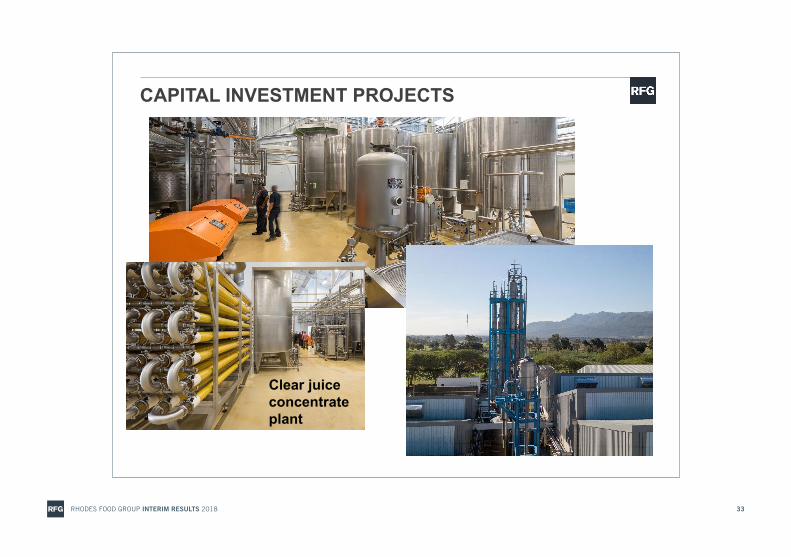
CAPITAL INVESTMENT PROJECTS
Baked beans production facility Krugersdorp
JOB015236_Rhodes_AnalystBook_SlidesTemplate – May 18, 2018 5:15 PM
RHODES FOOD GROUP INTERIM RESULTS 2018 34
MARKET-LEADING BRANDS
JOB015236_Rhodes_AnalystBook_SlidesTemplate – May 18, 2018 5:15 PM
RHODES FOOD GROUP INTERIM RESULTS 2018 35

EXPANDING BRAND PORTFOLIO
JOB015236_Rhodes_AnalystBook_SlidesTemplate – May 18, 2018 5:15 PM
RHODES FOOD GROUP INTERIM RESULTS 2018 36

MARKET SHARE (RFG as manufacturer)
Market shares* (%) March 2017
March 2018
Position
Jams 48 48 1
Canned fruit 46 46 1
Canned vegetables 19 16 2
Canned meats & meals 66 72 1
Long life fruit juices 17 22 2
Salads and pickles 21 24 3
* Moving annual total. Retailers scanning data processed by IRI Worldwide (market shares in the defined retail channel, in retail prices)
JOB015236_Rhodes_AnalystBook_SlidesTemplate – May 18, 2018 5:15 PM
RHODES FOOD GROUP INTERIM RESULTS 2018 37

BRAND SHARE
Brand shares* (%) March 2017
March 2018
Position
Jams 27 29 2
Canned fruit 26 26 2
Canned pineapple 55 53 1
Canned vegetables 16 13 2
Canned tomato 29 31 1
Corned meat 50 59 1
100% fruit juice 10 16 2
Infant food meals 6 8 2
Salads and pickles 13 15 3* Moving annual total. Retailers scanning data processed by IRI Worldwide (market shares in the defined retail channel, in retail prices)
JOB015236_Rhodes_AnalystBook_SlidesTemplate – May 18, 2018 5:15 PM
RHODES FOOD GROUP INTERIM RESULTS 2018 38

INNOVATION: PRODUCT AND PACKAGING
JOB015236_Rhodes_AnalystBook_SlidesTemplate – May 18, 2018 5:15 PM
RHODES FOOD GROUP INTERIM RESULTS 2018 39
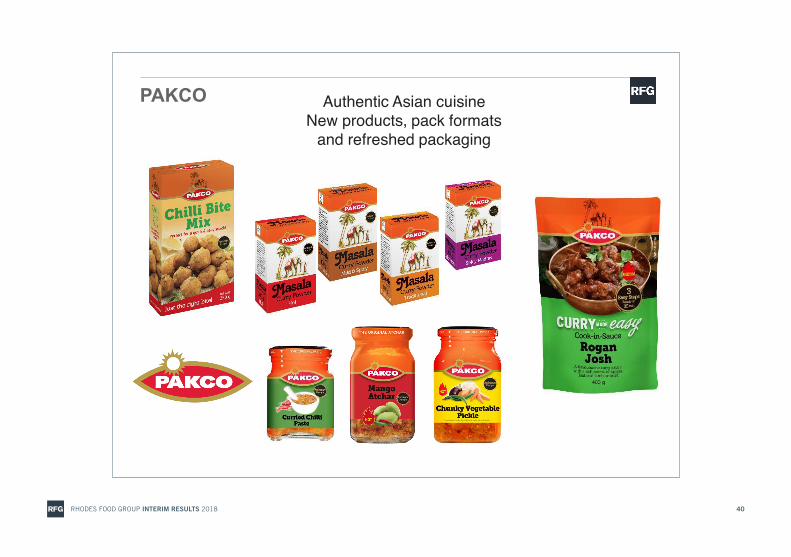
PAKCO Authentic Asian cuisineNew products, pack formats
and refreshed packaging
JOB015236_Rhodes_AnalystBook_SlidesTemplate – May 18, 2018 5:15 PM
RHODES FOOD GROUP INTERIM RESULTS 2018 40

BISTO
Bisto Corn Flour range introduced
New and innovative pack formats, and
flavours
JOB015236_Rhodes_AnalystBook_SlidesTemplate – May 18, 2018 5:15 PM
RHODES FOOD GROUP INTERIM RESULTS 2018 41
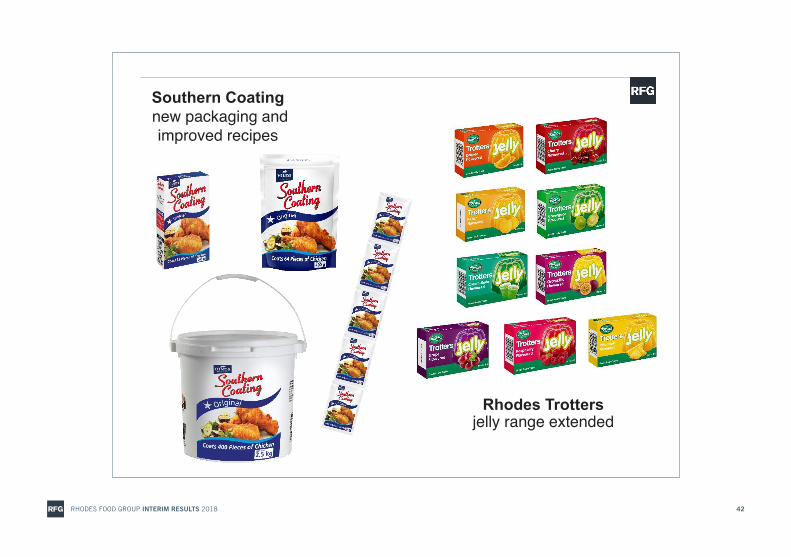
Southern Coatingnew packaging and improved recipes
Rhodes Trottersjelly range extended
JOB015236_Rhodes_AnalystBook_SlidesTemplate – May 18, 2018 5:15 PM
RHODES FOOD GROUP INTERIM RESULTS 2018 42
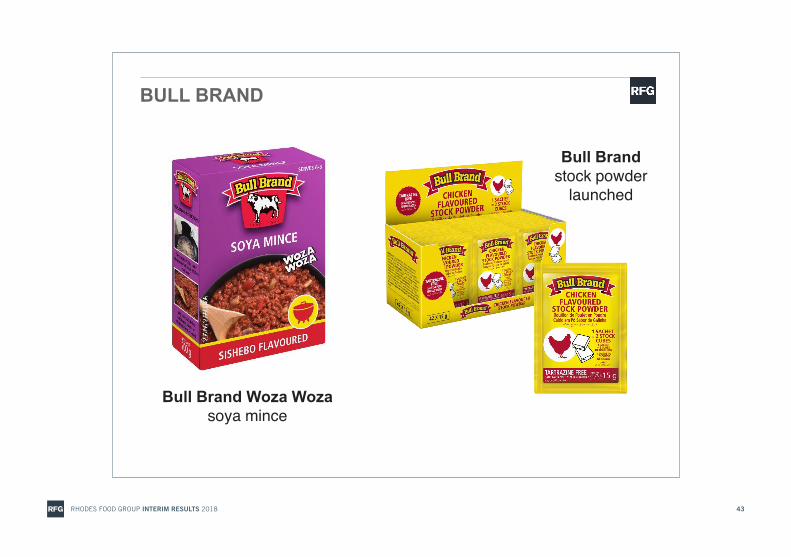
BULL BRAND
Bull Brand stock powder
launched
Bull Brand Woza Wozasoya mince
JOB015236_Rhodes_AnalystBook_SlidesTemplate – May 18, 2018 5:15 PM
RHODES FOOD GROUP INTERIM RESULTS 2018 43
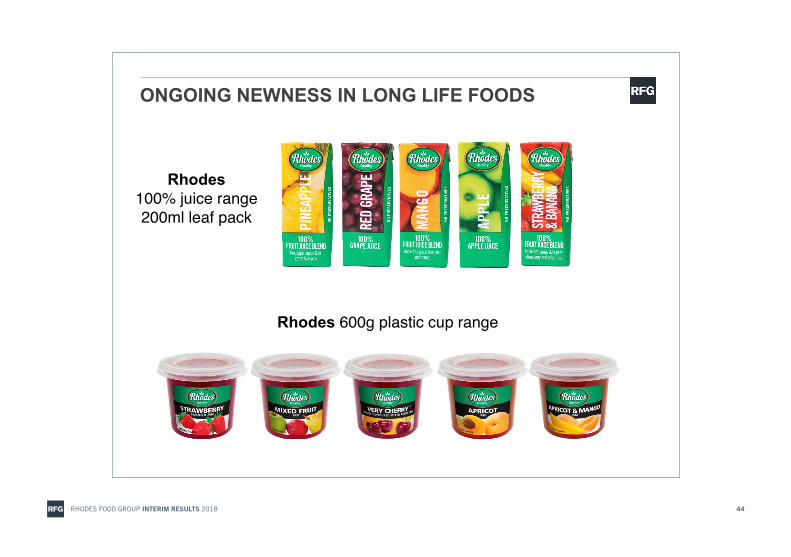
ONGOING NEWNESS IN LONG LIFE FOODS
Rhodes 600g plastic cup range
Rhodes 100% juice range200ml leaf pack
JOB015236_Rhodes_AnalystBook_SlidesTemplate – May 18, 2018 5:15 PM
RHODES FOOD GROUP INTERIM RESULTS 2018 44
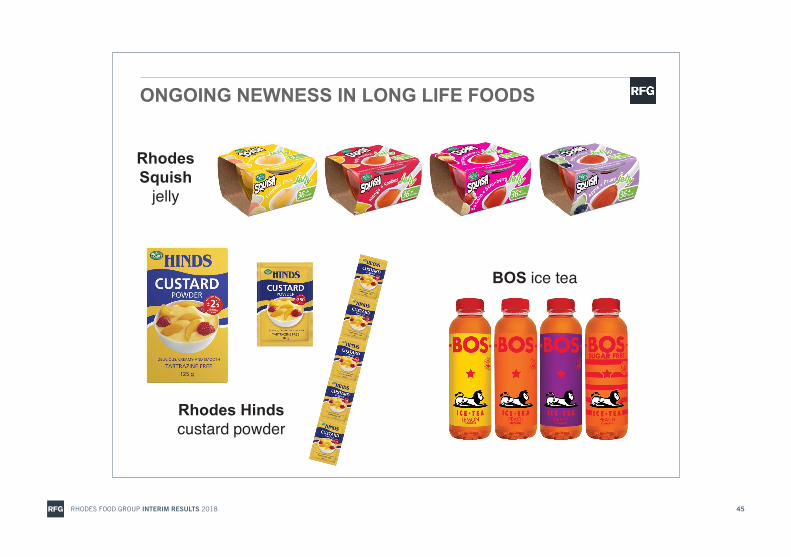
ONGOING NEWNESS IN LONG LIFE FOODS
BOS ice tea
RhodesSquish
jelly
Rhodes Hindscustard powder
JOB015236_Rhodes_AnalystBook_SlidesTemplate – May 18, 2018 5:15 PM
RHODES FOOD GROUP INTERIM RESULTS 2018 45
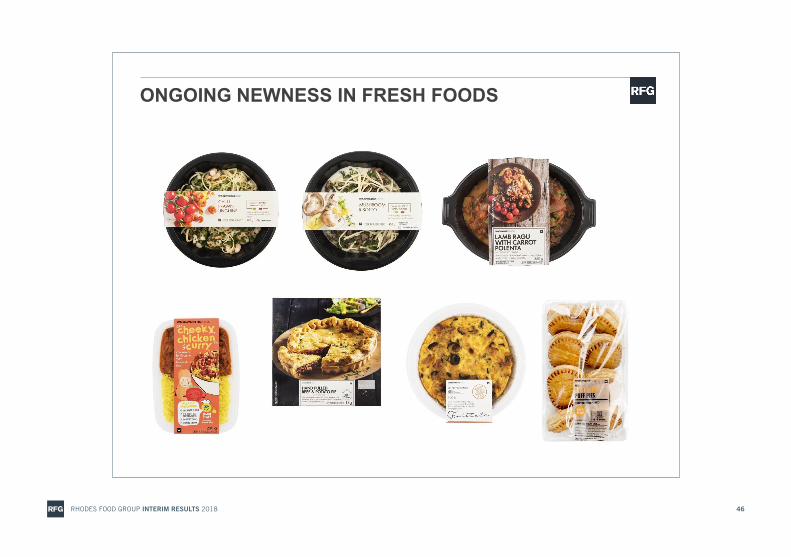
ONGOING NEWNESS IN FRESH FOODS
JOB015236_Rhodes_AnalystBook_SlidesTemplate – May 18, 2018 5:15 PM
RHODES FOOD GROUP INTERIM RESULTS 2018 46

OUTLOOK
JOB015236_Rhodes_AnalystBook_SlidesTemplate – May 18, 2018 5:15 PM
RHODES FOOD GROUP INTERIM RESULTS 2018 47
OUTLOOK
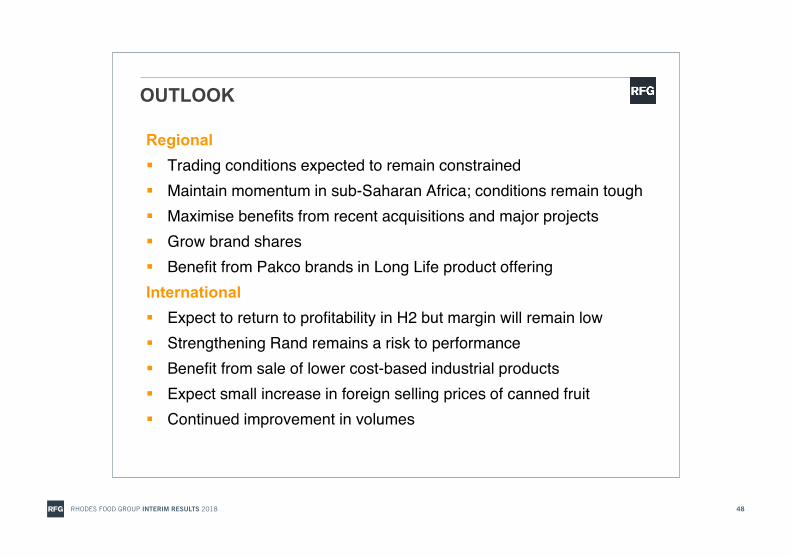
Regional▪ Trading conditions expected to remain constrained▪ Maintain momentum in sub-Saharan Africa; conditions remain tough▪ Maximise benefits from recent acquisitions and major projects▪ Grow brand shares▪ Benefit from Pakco brands in Long Life product offeringInternational▪ Expect to return to profitability in H2 but margin will remain low▪ Strengthening Rand remains a risk to performance▪ Benefit from sale of lower cost-based industrial products▪ Expect small increase in foreign selling prices of canned fruit▪ Continued improvement in volumes
JOB015236_Rhodes_AnalystBook_SlidesTemplate – May 18, 2018 5:15 PM
RHODES FOOD GROUP INTERIM RESULTS 2018 48

OUTLOOK
▪ RFG investment case remains robust despite headwinds in international business
▪ Ma Baker now profitable and expected to contribute to H2 earnings, although at a lower level than originally anticipated
▪ Working capital management a priority to reduce interest costs
▪ Capital investment of R115 million committed for second half
▪ Focus on completing current capital investment programme to generate returns for shareholders into 2019
▪ Committed to medium-term targets
▪ Gross profit margin over 30%
▪ Operating margin 10% - 12%
JOB015236_Rhodes_AnalystBook_SlidesTemplate – May 18, 2018 5:15 PM
RHODES FOOD GROUP INTERIM RESULTS 2018 49

THANK YOU
JOB015236_Rhodes_AnalystBook_SlidesTemplate – May 18, 2018 5:15 PM
RHODES FOOD GROUP INTERIM RESULTS 2018 50
DISCLAIMER
Rhodes Food Group Holdings Limited (“RFG” or “the company”) has acted in good faith and has made every reasonable effort to ensure the accuracy and completeness of the information contained in this presentation, including all information that may be defined as 'forward-looking statements' within the meaning of United States securities legislation.Forward-looking statements may be identified by words such as 'believe', 'anticipate', 'expect', 'plan', 'estimate', 'intend', 'project', 'target', 'predict' and 'hope'.Forward-looking statements are not statements of fact, but statements by the management of RFG based on its current estimates, projections, expectations, beliefs and assumptions regarding the group's future performance. No assurance can be given that forward-looking statements will prove to be correct and undue reliance should not be placed on such statements.The risks and uncertainties inherent in the forward-looking statements contained in this presentation include, but are not limited to: changes to IFRS and the interpretations, applications and practices subject thereto as they apply to past, present and future periods; domestic and international business and market conditions; changes in the regulatory and legislative environments; changes to operational, social, economic and political risks; and the effects of both current and future litigation.RFG does not undertake to update any forward-looking statements contained in this presentation and does not assume responsibility for any loss or damage whatsoever and howsoever arising as a result of the reliance by any party thereon, including, but not limited to, loss of earnings, profits, or consequential loss or damage.
JOB015236_Rhodes_AnalystBook_SlidesTemplate – May 18, 2018 5:15 PM
RHODES FOOD GROUP INTERIM RESULTS 2018 51

INVESTOR RELATIONS CONTACTS
Bruce Henderson CEO [email protected]
Tiaan Schoombie CFO [email protected]
Graeme Lillie IR [email protected]
www.rfg.com
JOB015236_Rhodes_AnalystBook_SlidesTemplate – May 18, 2018 5:15 PM
RHODES FOOD GROUP INTERIM RESULTS 2018 52

CO
NSO
LIDATE
D IN
TER
IM
FINAN
CIA
L STATE
MEN
TSFO
R TH
E S
IX MO
NTH
S E
ND
ED
1 A
PR
IL
2018

GROUP TU
RNOVER
(R’m
illion)
2014 2015
2016 2017
2018
1 1521 295
2 1512 507
1 988
CAGR* 21.5%
*Compound annual grow
th rate.
Long Life FoodsFresh Foods
International
16%
34%
50%
REGIONAL
INTERNATIONALREVENU
E CON
TRIBUTION
BY SEGM
ENT
KEY FEATURES FOR THE SIX MONTHS
GR
OU
P TU
RN
OVER
UP16.6%
HEA
DLIN
E EAR
NIN
GS
34.8%LOW
ER
ON
WEA
K IN
TERN
ATION
AL R
ESULTS
DILU
TED H
EPS
38.9%DOW
N
TO 31.4 C
ENTS
REG
ION
AL TU
RN
OVER
UP19.5%
INTER
NATIO
NA
L TUR
NO
VERUP3.6%

COMM
ENTARY
PROFILE R
hodes Food Group is a leading producer of fresh, frozen and long life convenience m
eal solutions for customers and consum
ers across South A
frica, sub-Saharan A
frica and in major global m
arkets. The growing portfolio of m
arket leading brands, which
includes Rhodes, B
ull Brand, M
agpie, Squish, Bisto, H
inds and Pakco, is com
plemented by private label product ranges packed
for major South A
frican retailers and international customers.
TRADING AN
D FINAN
CIAL PERFORMAN
CEG
roup turnover for the six months increased by 16.6%
to R2.5 billion, w
ith organic growth of 6.9%
.
Turnover in the regional segment (South A
frica and the rest of Africa) increased by 19.5%
, with organic grow
th of 7.6%.
The regional segment accounted for 8
4% (2017: 82%
) of total revenue.
• Fresh Foods sales increased by 22.7% (9.3%
organic growth) w
ith a strong performance from
the bakery category driven by product innovation and continued good grow
th in pies, snacking and ready meals.
• Long Life Foods increased turnover by 17.4% (6.5%
organic growth) w
ith the fruit juice category again performing w
ell in a highly com
petitive environment. The group’s brands continued to gain m
arket share across core product categories. Grow
th in the rest of A
frica has slowed as the im
pact of the stronger Rand in certain m
ajor African m
arkets has made the group’s products less
price competitive.
The acquisitions of Pakco and M
a Baker, w
hich were not included in the com
parable prior period, contributed combined turnover
of R20
9 million. P
akco has performed ahead of expectations in its first full year in the group w
hile some initial challenges w
ere experienced at M
a Baker. These have been addressed and the integration has been bedded dow
n.
International turnover increased by 3.6%. W
hile export volumes have recovered the business has been im
pacted by the increased costs of canned fruit due to the ongoing drought in the W
estern Cape and the strengthening of the R
and against the group’s trading currencies.
The reporting period comprises 26 trading w
eeks compared to 27 w
eeks in the prior period.
The group’s gross profit margin w
as lower at 25.3%
(2017: 27.1%) ow
ing mainly to increased costs and the adverse currency
impact in the International business. The regional gross profit m
argin was im
pacted negatively by lower m
argins in the Ma B
aker business. The gross profit m
argin of the Long Life component of the regional business w
as maintained at last year’s levels.
Operating costs, excluding the im
pact of the two acquisitions, grew
by 9.2%. D
epreciation and amortisation increased by
R19 m
illion owing to the higher level of capital expenditure in the past tw
o years and the acquisitions of Pakco and M
a Baker at
the end of the prior period. Once-off costs relating to the M
a Baker integration and the relocation of the snacking plant (form
erly A
libaba Foods) to the Groot D
rakenstein production facility also contributed to the increase.
The group operating margin declined from
9.7% to 6.5%
. The regional operating margin reduced from
9.2% to 7.8%
owing to the
dilution caused by the Ma B
aker business and the once-off costs referred to above. The regional margin on a com
parable basis w
as in line with the prior period. The w
eak market for industrial purees, increased canned fruit costs and strengthening currency
contributed to the international segment posting a loss for the first half.
Interest payments w
ere R17.4 m
illion higher at R51.9 m
illion due to the increased capital investment program
me and funding for
the Ma B
aker acquisition.
Profit after tax declined by 35.1%
to R8
0.9 million w
ith headline earnings 34.8%
lower at R
82.4 million. D
iluted headline earnings per share decreased by 38.9%
to 31.4 cents, in line with the group’s trading statem
ent issued on 20 March 2018. The w
eighted average num
ber of shares in issue has increased by 15.9 million or 6.7%
over the prior six-month period.
RH
OD
ES
FOO
D G
RO
UP
INTE
RIM
RE
SU
LTS 2
01
8
1

RH
OD
ES
FOO
D G
RO
UP
INTE
GR
ATED
RE
PO
RT 2
01
72
COMM
ENTARY continued
The ongoing focus on efficient working capital m
anagement is reflected in the increase in net w
orking capital being contained to 7.2%
.
Cash generated from
operations of R135.8 m
illion was R
42.3 million higher than the prior period due to the low
er investment in
working capital. The group’s net debt to equity ratio increased to 6
0.4% (2017: 45.2%
) owing to the higher level of funding for the
capital investment program
me.
The group invested R26
8 million (2017: R
233 m
illion) in capital projects in the first half. Major projects include capacity expansion
at the Gauteng pie and bakery facilities, com
missioning a new
baked bean production facility, upgrading facilities at Pakco and M
a B
aker, and the installation of a clear juice concentrate plant at the Groot D
rakenstein production hub to further vertically integrate the fruit juice operation.
OUTLOOK
Driving organic grow
th, increasing brand shares and extracting benefits from the recent acquisitions and m
ajor projects will be
the focus areas in the regional business. The group will look to m
aintain mom
entum in sub
-Saharan Africa and benefit from
the addition of the P
akco brands to the Long Life product offering.
The Pakco brand portfolio w
as relaunched in March w
ith extensive product innovation, new pack form
ats and refreshed packaging designs across the B
isto, Hinds, P
akco and Southern Coating brands.
After reporting a loss for the first half, M
a Baker has returned to profitability and is expected to be earnings accretive in the
second half.
The international business should benefit in the second half from the sale of low
er cost-based industrial products from the
2018 season coming onto the m
arket as well as a sm
all uplift in foreign selling prices of canned fruit and continued improvem
ent in volum
es. How
ever, the operating margin for the international segm
ent will rem
ain low and a strengthening R
and remains a risk
to performance.
The group plans a further R115 m
illion capital investment in the second half of the year. The com
pletion of the current production capacity expansion and upgrade progam
me is a priority to ensure that these projects start generating returns to enhance the
group’s earnings. Working capital m
anagement rem
ains a focus area to reduce interest costs.
Trading conditions are expected to remain constrained over the rem
ainder of the financial year. While the im
proving consum
er confidence in the country is positive for growth, it is too early to expect any m
arked improvem
ent in the regional trading environm
ent.
Any reference to future perform
ance included in this announcement has not been review
ed or reported on by the auditors.
Bruce Henderson
Tiaan Schoombie
Chief Executive Officer
Chief Financial Officer
Groot D
rakenstein22 M
ay 2018
R
HO
DE
S FO
OD
GR
OU
P IN
TER
IM R
ES
ULTS
20
18
2

CONDENSED CONSOLIDATED STATEMENT
OF FINANCIAL POSITION
Reviewed
Review
ed
Six-month
Six-month
Audited
period endedperiod ended
Year ended
1 April
2 April
1 October
20182017
2017
Notes
R’000R
’00
0R
’00
0
ASSETS
N
on-current assets
2 333 8151 914 124
2 145 186
Property, plant and equipm
ent4
1 658 5741 272 0
391 4
60 493
Intangible assets
202 49016
4 138
207 282G
oodwill
4
44 857
46
8 984
457 183
Investment in associate
55 740
––
Biological assets
10 760
8 96
310 6
64
Deferred taxation asset
2 688
–9 2
94
Loans receivable
8 706–
270
Current assets
2 259 7952 102 4
38
1 96
4 90
3
Inventory6
1 393 4911 320 301
1 144 0
80
Accounts receivable
779 390
702 041
767 679B
iological assets
10 55318 742
10 553
Loan receivable
4 1233 307
6 170Taxation receivable
40 80
410 0
84
32 193Foreign exchange contract asset
14 237
8 021–
Bank balances and cash on hand
17 197
39 942
4 228
Total assets
4 593 6104 016 5
624 110 0
89
EQUITY AN
D LIABILITIES
Capital and reserves
2 239 771
2 122 7162 235 8
65
Share capital
1 565 5091 5
65 50
91 5
65 50
9Equity-settled em
ployee benefits reserve
13 1895 776
8 779A
ccumulated profit
652 025
541 74
4652 326
Equity attributable to owners of the com
pany
2 230 7232 113 02
92 226 614
Non-controlling interest
9 0
489 6
879 251
Non-current liabilities
8
47 1356
45 618877 8
83
Long-term loans
650 635
50
9 37470
0 407
Deferred taxation liability
180 928
126 38
3161 711
Employee benefit liability
15 572
9 861
15 765
Current liabilities
1 506 704
1 248 228
99
6 341
Accounts payable and accruals
737 597
68
3 482
53
4 590
Employee benefits accrual
50 134
75 70775 324
Current portion of long-term
loans
237 32715
0 117218 8
31Taxation payable
258
–2 732
Bank overdraft
481 388
33
8 92215
8 077Foreign exchange contract liability
–
–6 787
Total equity and liabilities
4 593 610
4 016 562
4 110 08
9
as at 1 April 2018
RH
OD
ES
FOO
D G
RO
UP
INTE
RIM
RE
SU
LTS 2
01
8
3

CONDENSED CONSOLIDATED STATEMENT OF PROFIT
OR LOSS AND OTHER COMPREHENSIVE INCOM
E
Reviewed
Review
ed
Six-month
Six-month
Audited
period endedperiod ended
Year ended
1 April
2 April
1 October
20182017
2017
R’000
R’0
00
R’0
00
Revenue
2 507 3752 15
0 7374 593 317
Cost of goods sold
(1 873 723)
(1 567 317)
(3 355 146)
Gross profit
633 6525
83 420
1 238 171
Other incom
e
36 27541 017
54 4
80
Operating costs
(507 193)
(416 735)(8
85 8
44)
Profit before interest and taxation
162 734
207 7024
06 8
07Interest paid
(51 855)
(34 4
62)(8
4 836)
Interest received
9322
38
6
Profit before taxation
110 972173 262
322 357Taxation
(30 107)
(48 616)
(87 56
6)
Profit for the period
80 865124 6
46
234 791
Profit attributable to:
O
wners of the com
pany
81 068123 931
234 512
Non-controlling interest
(203)
715279
80 865124 6
46
234 791
Other comprehensive incom
e
Item
s that will not be reclassified subsequently to profit or loss
–
–1
Rem
easurement of em
ployee benefit liability
––
2D
eferred taxation effect
––
(1)
Total comprehensive incom
e for the period
80 865124 6
46
234 792
Total comprehensive incom
e attributable to:
O
wners of the com
pany
81 068123 931
234 513
Non-controlling interest
(203)
715279
80 865124 6
46
234 792
Earnings per share
(cents)32.1
52.495.9
Diluted earnings per share
(cents)30.9
50.4
92.4
for the six-month period ended 1 April 2018
R
HO
DE
S FO
OD
GR
OU
P IN
TER
IM R
ES
ULTS
20
18
4
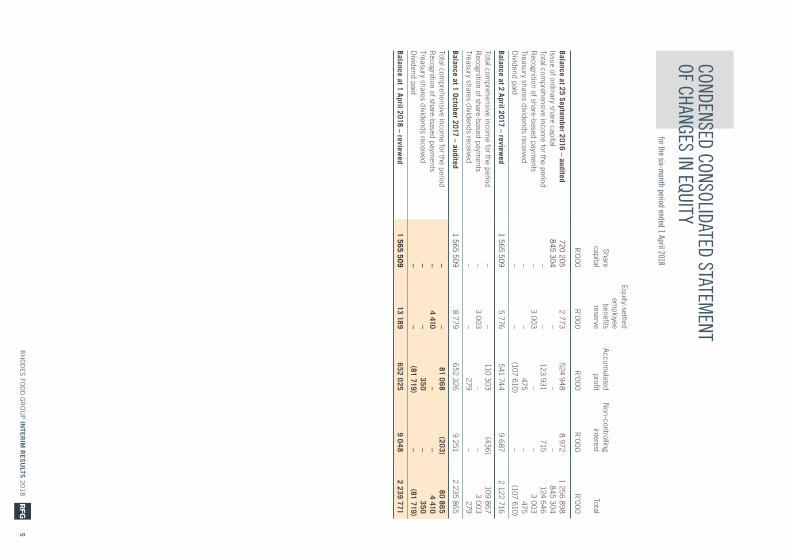
CONDENSED CONSOLIDATED STATEMENT
OF CHANGES IN EQUITY
Equity-settled
Share
employee
benefits A
ccumulated
Non-controlling
capitalreserve
profitinterest
Total
R’0
00
R’0
00
R’0
00
R’0
00
R’0
00
Balance at 25 September 2016 – audited
720 2052 773
524 94
88 972
1 256 8
98Issue of ordinary share capital
845 30
4–
––
845 30
4Total com
prehensive income for the period
––
123 931715
124 64
6R
ecognition of share-based payments
–3 0
03
––
3 00
3Treasury shares dividends received
––
475–
475D
ividend paid–
–(107 610)
–(107 610)
Balance at 2 April 2017 – reviewed
1 565 5
09
5 7765
41 744
9 687
2 122 716
Total comprehensive incom
e for the period–
–110 30
3(4
36)10
9 867
Recognition of share-based paym
ents–
3 00
3–
–3 0
03
Treasury shares dividends received–
–279
–279
Balance at 1 October 2017 – audited1 5
65 50
98 779
652 3269 251
2 235 865
Total comprehensive incom
e for the period–
–81 068
(203)80 865
Recognition of share-based paym
ents–
4 410–
–4 410
Treasury shares dividends received–
–350
–350
Dividend paid
––
(81 719)–
(81 719)
Balance at 1 April 2018 – reviewed
1 565 50913 189
652 0259 0
482 239 771
for the six-month period ended 1 April 2018
RH
OD
ES
FOO
D G
RO
UP
INTE
RIM
RE
SU
LTS 2
01
8
5

CONDENSED CONSOLIDATED STATEMENT
OF CASH FLOWS
Review
ed R
eviewed
Six-month
Six-month
Audited
period ended
period endedYear ended
1 April
2 April
1 October
2018
20172017
R’000
R’0
00
R’0
00
Cash flows from
operating activities
Operating cash flow
s before working capital changes
239 732257 5
675
32 420W
orking capital changes(103 978)
(164 122)
(185 30
6)
Cash generated from operations
135 754
93 445
347 114
Net interest paid
(51 766)(37 010)
(86 15
0)Taxation paid
(16 348)(10
0 43
8)(139 023)
Net cash inflow
/(outflow) from
operating activities67 6
40(4
4 00
3)121 9
41
Cash flows from
investing activities
Purchase of property, plant and equipm
ent(268 475)
(233 25
8)(4
86 9
46)
Proceeds on disposal of property, plant and equipm
ent4 865
2691 478
Acquisition of subsidiaries and businesses less net cash acquired
–(18
0 477)(207 2
97)Loan receivable advanced
(3 273)(307)
(3 732)Loans receivable repaid
246–
1 471D
ividend paid(81 719)
(107 610)(107 610)
Treasury shares dividend received–
475475
Net cash outflow
from investing activities
(348 356)(520 9
08)
(802 161)
Cash flows from
financing activities
Issue of ordinary share capital–
64
8 304
64
8 304
Loans raised75 589
300 0
00
621 00
0Loans repaid
(105 215)(495 492)
(556 742)
Governm
ent grant received–
2 7423 4
32
Net cash (outflow
)/inflow from
financing activities(29 626)
455 554
715 99
4
Net (decrease)/increase in cash and cash equivalents
(310 342)(10
9 357)35 774
Cash and cash equivalents at beginning of the period
(153 849)
(189 623)
(189 623)
Cash and cash equivalents at end of the period(46
4 191)(2
98 980)
(153 8
49)
for the six-month period ended 1 April 2018
R
HO
DE
S FO
OD
GR
OU
P IN
TER
IM R
ES
ULTS
20
18
6
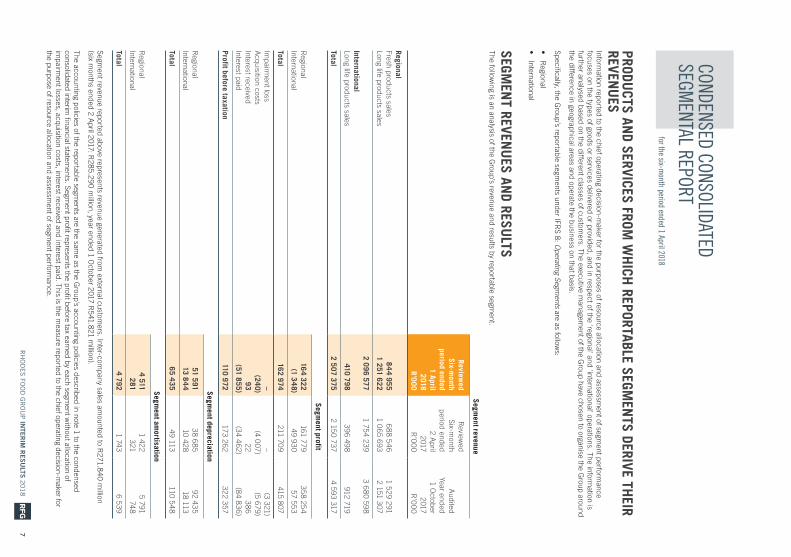
CONDENSED CONSOLIDATED SEGM
ENTAL REPORT
PRODUCTS AN
D SERVICES FROM W
HICH
REPORTABLE SEGMEN
TS DERIVE THEIR
REVENU
ESInform
ation reported to the chief operating decision-maker for the purposes of resource allocation and assessm
ent of segment perform
ance focuses on the types of goods or services delivered or provided, and in respect of the 'regional' and 'international' operations. The inform
ation is further analysed based on the different classes of custom
ers. The executive managem
ent of the Group have chosen to organise the G
roup around the difference in geographical areas and operate the business on that basis.
Specifically, the Group’s reportable segm
ents under IFRS 8: O
perating Segments are as follow
s:
• Regional
• International
SEGMEN
T REVENU
ES AND RESU
LTSThe follow
ing is an analysis of the Group’s revenue and results by reportable segm
ent. Segm
ent revenue
Review
ed R
eviewed
Six-month
Six-month
Audited
period ended
period endedYear ended
1 April
2 April
1 October
2018
20172017
R’000
R’0
00
R’0
00
Regional
Fresh products sales8
44 955
68
8 54
61 52
9 291
Long life products sales1 251 622
1 065 693
2 151 307
2 096 577
1 754 239
3 68
0 598International
Long life products sales
410 79839
6 498912 719
Total 2 507 375
2 150 737
4 593 317
Segm
ent profit
Regional
164 322
161 77935
8 254
International(1 3
48)49 930
57 553
Total 162 974
211 709
415 807
Impairm
ent loss–
–(3 321)
Acquisition costs
(240)(4 0
07)(5 679)
Interest received93
223
86
Interest paid(51 855)
(34 4
62)(8
4 836)
Profit before taxation110 972
173 262322 357
Segm
ent depreciation
Regional
51 5913
8 68
592 4
35International
13 84
410 428
18 113
Total 65 435
49 113110 5
48
Segm
ent amortisation
Regional
4 5111 422
5 791International
281321
748
Total 4 792
1 743
6 539
Segment revenue reported above represents revenue generated from
external customers. Inter-com
pany sales amounted to R
271.84
0 million
(six months ended 2 A
pril 2017: R28
5.29
0 million, year ended 1 O
ctober 2017 R5
41.821 million).
The accounting policies of the reportable segments are the sam
e as the Group's accounting policies described in note 1 to the condensed
consolidated interim financial statem
ents. Segment profit represents the profit before tax earned by each segm
ent without allocation of
impairm
ent losses, acquisition costs, interest received and interest paid. This is the measure reported to the chief operating decision-m
aker for the purpose of resource allocation and assessm
ent of segment perform
ance.
for the six-month period ended 1 April 2018
RH
OD
ES
FOO
D G
RO
UP
INTE
RIM
RE
SU
LTS 2
01
8
7
for the six-month period ended 1 April 2018
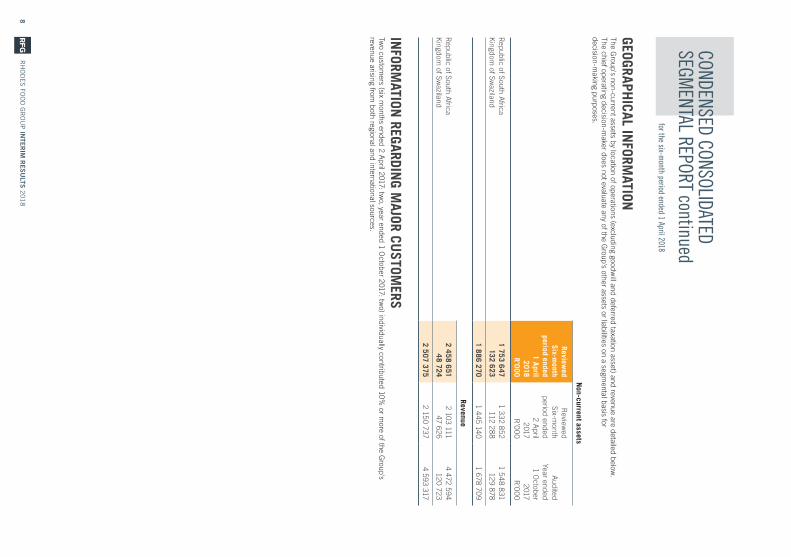
GEOGRAPHICAL IN
FORMATION
The Group's non-current assets by location of operations (excluding goodw
ill and deferred taxation asset) and revenue are detailed below.
The chief operating decision-maker does not evaluate any of the G
roup's other assets or liabilities on a segmental basis for
decision-making purposes.
N
on-current assets
Review
ed R
eviewed
Six-month
Six-month
Audited
period ended
period endedYear ended
1 April
2 April
1 October
2018
20172017
R’000
R’0
00
R’0
00
Republic of South A
frica1 753 6
471 3
32 852
1 54
8 831
Kingdom
of Swaziland
132 623112 28
812
9 878
1 886 270
1 445 14
01 678 70
9
Revenue
Republic of South A
frica2 458 651
2 103 111
4 472 594
Kingdom
of Swaziland
48 72447 626
120 723
2 507 375
2 150 737
4 593 317
INFORM
ATION REGARDIN
G MAJOR CU
STOMERS
Two custom
ers (six months ended 2 A
pril 2017: two, year ended 1 O
ctober 2017: two) individually contributed 10%
or more of the G
roup's revenue arising from
both regional and international sources.
CONDENSED CONSOLIDATED SEGM
ENTAL REPORT continued
R
HO
DE
S FO
OD
GR
OU
P IN
TER
IM R
ES
ULTS
20
18
8
for the six-month period ended 1 April 2018
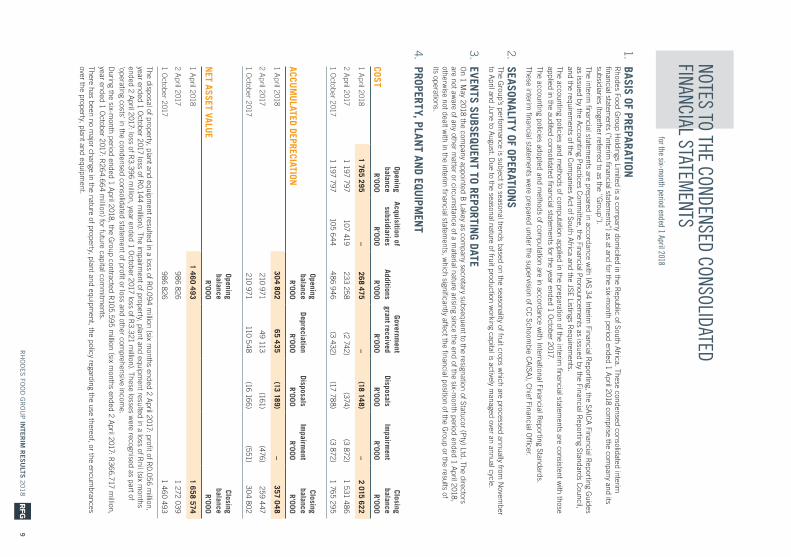
1.BASIS OF PREPARATION
Rhodes Food G
roup Holdings Lim
ited is a company dom
iciled in the Republic of South A
frica. These condensed consolidated interim
financial statements ("interim
financial statements") as at and for the six-m
onth period ended 1 April 2018 com
prise the company and its
subsidiaries (together referred to as the ''Group'').
The interim financial statem
ents are prepared in accordance with IA
S 34 Interim
Financial Reporting, the SA
ICA
Financial Reporting G
uides as issued by the A
ccounting Practices C
omm
ittee, the Financial Pronouncem
ents as issued by the Financial Reporting Standards C
ouncil, and the requirem
ents of the Com
panies Act of South A
frica and the JSE Listings Requirem
ents.
The accounting policies and m
ethods of computation applied in the preparation of the interim
financial statements are consistent w
ith those applied in the audited consolidated financial statem
ents for the year ended 1 October 2017.
The accounting policies adopted and m
ethods of computation are in accordance w
ith International Financial Reporting Standards.
These interim
financial statements w
ere prepared under the supervision of CC
Schoombie C
A(SA
), Chief Financial O
fficer.
2.SEASON
ALITY OF OPERATIONS
The G
roup’s performance is subject to seasonal trends based on the seasonality of fruit crops w
hich are processed annually from N
ovember
to April and June to A
ugust. Due to the seasonal nature of fruit production w
orking capital is actively managed over an annual cycle.
3.EVEN
TS SUBSEQU
ENT TO REPORTIN
G DATE
On 1 M
ay 2018 the company appointed B
Lakey as company secretary subsequent to the resignation of Statucor (P
ty) Ltd. The directors are not aw
are of any other matter or circum
stance of a material nature arising since the end of the six-m
onth period ended 1 April 2018,
otherwise not dealt w
ith in the interim financial statem
ents, which significantly affect the financial position of the G
roup or the results of its operations.
4.PROPERTY, PLAN
T AND EQUIPM
ENT
Opening
Acquisition of
Government
Closing
balancesubsidiaries
Additionsgrant received
DisposalsIm
pairment
balanceCOST
R’000R’000
R’000R’000
R’000R’000
R’000
1 April 2018
1 765 295–
268 475–
(18 148)–
2 015 622
2 April 2017
1 197 797107 419
233 25
8(2 742)
(374)(3 872)
1 531 4
86
1 October 2017
1 197 797105 6
44
48
6 94
6(3 4
32)(17 78
8)(3 872)
1 765 295
Opening
Closing
balance
DepreciationDisposals
Impairm
entbalance
ACCUM
ULATED DEPRECIATION
R’000R’000
R’000R’000
R’000
1 April 2018
304 802
65 435(13 189)
–357 0
48
2 April 2017
210 97149 113
(161)(476)
259 447
1 October 2017
210 971110 5
48
(16 166)
(551)30
4 802
Opening
Closing
balance
balance
NET ASSET VALU
ER’000
R’000
1 April 2018
1 460 493
1 658 574
2 April 2017
986 826
1 272 0
39
1 October 2017
986 826
1 4
60 493
The disposal of property, plant and equipment resulted in a loss of R
0.09
4 million (six m
onths ended 2 April 2017: profit of R
0.056 m
illion, year ended 1 O
ctober 2017 loss of R0.14
4 million). The im
pairment of property, plant and equipm
ent resulted in a loss of Rnil (six m
onths ended 2 A
pril 2017: loss of R3.39
6 million, year ended 1 O
ctober 2017 loss of R3.321 m
illion). These losses were recognised as part of
'operating costs' in the condensed consolidated statement of profit or loss and other com
prehensive income.
D
uring the six-month period ended 1 A
pril 2018, the Group contracted R
105.595 million (six m
onths ended 2 April 2017: R
366.717 m
illion, year ended 1 O
ctober 2017: R26
4.66
4 million) for future capital com
mitm
ents.
There has been no m
ajor change in the nature of property, plant and equipment, the policy regarding the use thereof, or the encum
brances over the property, plant and equipm
ent.
NOTES TO THE CONDENSED CONSOLIDATED FINANCIAL STATEM
ENTS
RH
OD
ES
FOO
D G
RO
UP
INTE
RIM
RE
SU
LTS 2
01
8
9

NOTES TO THE CONDENSED CONSOLIDATED FINANCIAL STATEM
ENTS continuedfor the six-m
onth period ended 1 April 2018
5.IN
VESTMEN
T IN ASSOCIATE
The Group entered into a sale of share agreem
ent during October 2017 to dispose of 5
0.83%
of the shares in Ma B
aker Xpress Proprietary
Limited for a consideration of R
6.100 m
illion. On the date of disposal M
a Baker Xpress P
roprietary Limited ceased to be a subsidiary. From
that date it w
as accounted for as an investment in an associate, using the equity accounting m
ethod, at a value of R5.9
00 m
illion.
During the six m
onths ended 1 April 2018 the loss from
the investment in the associate recognised in 'operating costs' w
as R0.16
0 million.
6.IN
VENTORY
A
provision of R13.49
0 million for the six m
onths ended 1 April 2018 (six m
onths ended 2 April 2017: R
6.06
6 million, year ended 1 O
ctober 2017: R
13.38
0 million) w
as raised in order to recognise inventory at the lower of cost or net realisable value.
Reviewed
Review
ed
Six-month
Six-month
Audited
period endedperiod ended
Year ended
1 April
2 April
1 October
20182017
2017
R’000
R’0
00
R’0
00
7.EARNIN
GS PER SHARE
7.1
HEADLIN
E EARNIN
GS PER SHARE
Reconciliation betw
een profit attributable to owners of the com
pany and headline earnings:
Profit attributable to ow
ners of the company
81 068123 931
234 512
Adjustm
ents to profit attributable to owners of the com
pany
1 284
2 405
2 495
Loss/(profit) on disposal of property, plant and equipment
9
4(5
6)14
4
Im
pairment of property, plant and equipm
ent
–3 39
63 321
Loss on sale of subsidiary
1 216–
–
Taxation effect
(26)(935)
(970)
Headline earnings
82 352
126 336
237 007
Headline earnings per share
(cents) 32.6
53.4
96.9
7.2
DILUTED H
EADLINE EARN
INGS PER SH
ARE
D
iluted headline earnings per share (cents)
31.451.4
93.4
7.3
WEIGH
TED AVERAGE NU
MBER OF SH
ARES IN ISSU
E
Ordinary shares in issue at beginning of the period
253 762 018221 0
00 0
00
221 00
0 00
0
W
eighted number of shares issued during the period
–16 8
53 874
24 657 869
Treasury shares
(1 125 000)(1 125 0
00)
(1 125 00
0)
Weighted average num
ber of shares in issue
252 637 018236 728 874
244 5
32 869
Effect of convertible preference shares
9 000 0009 0
00 0
00
9 00
0 00
0
Effect of share options
403 093
175 82818
9 081
Weighted average num
ber of dilutive shares in issue
262 040 111
245 90
4 70225
3 721 950
8.CON
TINGEN
T LIABILITIES
The Group has entered into guarantees in favour of South A
frican Revenue Service, for im
port and export activities as well as various
municipalities for operational activities. The guarantees from
import and operational activities outstanding as at 1 A
pril 2018 are R
6.56
0 million (six m
onths ended 2 April 2017: R
5.070 million, year ended 1 O
ctober 2017: R6.5
60 m
illion). There were no other changes in
the contingent liabilities from the prior period as disclosed in the audited annual financial statem
ents for the year ended 1 October 2017.
R
HO
DE
S FO
OD
GR
OU
P IN
TER
IM R
ES
ULTS
20
18
10
9.RECLASSIFICATION
OF PRIOR PERIOD DISCLOSURE
R18.742 m
illion of the non-current biological assets balance in the Condensed C
onsolidated Statement of Financial P
osition for the period ended 2 A
pril 2017 was reclassified to the current portion of biological assets, as this is a better representation of the expected lifespan of
the asset.
10.RELATED PARTY TRANSACTION
S
The Group generated sales from
Peaty M
ills Plc of R
86.122 m
illion (six months ended 2 A
pril 2017: R76.30
0 million, year ended 1 O
ctober 2017: R
182.48
3 million). Included in accounts receivable are am
ounts due from P
eaty Mills P
lc of R3
4.96
0 million (six m
onths ended 2 April
2017: R28.718 m
illion, year ended 1 October 2017: R
43.14
3 million). There w
ere no other significant related party transactions during the period under review
.
11.DIVIDEND
On 15 January 2018, a dividend of 31.1 cents per share, total dividend R
81.719 million (16 January 2017, a dividend of 42.2 cents per share,
total dividend R107.610 m
illion) was paid.
12.SIX-MON
TH PERIOD EN
D
The Group's financial year ends in Septem
ber which reflects 52 w
eeks of trading, and as a result the reporting date may differ year on year.
The 2017 financial year, however, included a 5
3rd week of trading. R
eferences to an interim financial period are to the 26
/27 weeks ended
on or about 31 March. A
s a result the interim financial statem
ents were prepared for the 26 w
eek period ended 1 April 2018 (27 w
eek period ended 2 A
pril 2017).
13.REVIEW REPORT
The directors have elected to engage the G
roup’s auditors, Deloitte &
Touche, to conduct a voluntary review of the condensed consolidated
interim financial statem
ents.
The G
roup’s auditors have issued an unmodified review
report on the condensed consolidated interim financial statem
ents. Any reference to
the Group’s outlook included in this announcem
ent has not been reviewed or reported on by the G
roup’s auditors.
INDEPEN
DENT AU
DITOR’S REVIEWReport on the condensed consolidated financial statem
ents
To the shareholders of Rhodes Food Group Holdings Lim
ited
We have review
ed the condensed consolidated financial statements of R
hodes Food Group H
oldings Limited, contained in the accom
panying consolidated interim
financial statements, w
hich comprise the condensed consolidated statem
ent of financial position as at 1 April 2018 and
the condensed consolidated statement of com
prehensive income, changes in equity and cash flow
s for the period then ended, and selected explanatory notes.
Directors’ responsibility for the condensed consolidated financial statements
The directors are responsible for the preparation and presentation of these condensed consolidated financial statements in accordance
with International Financial R
eporting Standard (IAS) 3
4, Interim Financial R
eporting, the SAIC
A Financial R
eporting Guides, as issued
by the Accounting P
ractices Com
mittee and Financial P
ronouncements as issued by the Financial R
eporting Standards Council and the
requirements of the C
ompanies A
ct of South Africa, and for such internal control as the directors determ
ine is necessary to enable the preparation of interim
financial statements that are free from
material m
isstatement, w
hether due to fraud or error.
Auditor’s responsibility
Our responsibility is to express a conclusion on these interim
financial statements. W
e conducted our review in accordance w
ith International Standard on R
eview Engagem
ents (ISRE) 2410, R
eview of Interim
Financial Information Perform
ed by the Independent Auditor of the Entity. ISR
E 2410 requires us to conclude whether anything has com
e to our attention that causes us to believe that the condensed consolidated financial statem
ents are not prepared in all material respects in accordance w
ith the applicable financial reporting framew
ork. This standard also requires us to com
ply with relevant ethical requirem
ents.
A review
of condensed consolidated financial statements in accordance w
ith ISRE 2410 is a lim
ited assurance engagement. W
e perform
procedures, primarily consisting of m
aking inquiries of managem
ent and others within the entity, as appropriate, and applying analytical
procedures, and evaluate the evidence obtained.
The procedures performed in a review
are substantially less than and differ in nature from those perform
ed in an audit conducted in accordance w
ith International Standards on Auditing. A
ccordingly, we do not express an audit opinion on these condensed consolidated
financial statements.
RH
OD
ES
FOO
D G
RO
UP
INTE
RIM
RE
SU
LTS 2
01
8
1
1

NOTES TO THE CONDENSED CONSOLIDATED FINANCIAL STATEM
ENTS continuedfor the six-m
onth period ended 1 April 2018
Conclusion
Based on our review
, nothing has come to our attention that causes us to believe that the accom
panying condensed consolidated financial statem
ents of Rhodes Food G
roup Holdings Lim
ited for the six month period ended 1 A
pril 2018 are not prepared, in all material respects,
in accordance with IA
S 34, Interim
Financial Reporting, the SA
ICA
Financial Reporting G
uides as issued by the Accounting P
ractices C
omm
ittee and Financial Pronouncem
ents as issued by Financial Reporting Standards C
ouncil and the requirements of the C
ompanies A
ct of South A
frica.
Deloitte & Touche
Registered Auditor
Per: PJ Schneider
Partner
1st Floor The Square, C
ape Quarter, 27 Som
erset Road, G
reen Point, 8
005, W
estern Cape, D
ocex 5 C
laremont
22 May 2018
National Executive: *LL B
am C
hief Executive O
fficer *TMM
Jordan Deputy C
hief Executive O
fficer, Clients &
Industries *MJ Jarvis C
hief O
perating Officer A
F Mackie A
udit & A
ssurance *N Sing R
isk Advisory *N
B K
ader Africa Tax &
Legal TP P
illay Consulting S G
wala B
PS
*JK M
azzocco Talent and Transformation M
G D
icks Risk Independence &
Legal *TJ Brow
n Chairm
an of the Board
Regional leader: MN
Alberts
*Partner and Registered Auditor
A full list of partners and directors is available on request.B-BBEE rating: Level 1 contribution in term
s of the DTI Generic Scorecard as per the amended Codes of Good Practice
Associate of D
eloitte Africa, a M
ember of D
eloitte Touche Tohmatsu Lim
ited
INDEPEN
DENT AU
DITOR’S REVIEW continued
R
HO
DE
S FO
OD
GR
OU
P IN
TER
IM R
ES
ULTS
20
18
12
RHODES FOOD GROU
P HOLDIN
GS LIMITED
(Incorporated in the Republic of South A
frica)R
egistration number 2012
/074392
/06
JSE share code: RFG
ISIN: Z
AE0
00191979
Registered addressP
niel Road, G
root Drakenstein, 76
80
P
rivate Bag X30
40, P
aarl, 7620
Directors
Dr YG
Muthien* (C
hairperson)
MR
Bow
er*
BA
S Henderson (C
hief Executive O
fficer)
TP Leeuw
*
LA M
akenete*
B N
jobe*
CC
Schoombie (C
hief Financial Officer)
C
L Smart**
G
JH W
illis**
* Independent non-executive
** Non-executive
Company secretary
B Lakey
Transfer secretariesC
omputershare Investor Services P
roprietary Limited
SponsorR
and Merchant B
ank, a division of FirstRand B
ank Limited
AuditorsD
eloitte & Touche
CORPORATE INFORMATION
RH
OD
ES
FOO
D G
RO
UP
INTE
RIM
RE
SU
LTS 2
01
8

www.rfg.com