interim results for the six months to 30 june 2019 (unaudited)
TRANSCRIPT

Registered address: Pearson Plc, 80 Strand, London WC2R ORL Registered in England 53723
1
Interim results for the six months to 30th June 2019 (unaudited) 26 July 2019 Good progress in the first half of the year, continued momentum in our structural growth
opportunities.
Highlights Underlying revenue up 2% with growth across all three segments • North America up 1%, Core up 6% and Growth up 2%. • Continued momentum in our structural growth opportunities and stabilisation in other
parts of our business more than offsets expected declines in US Higher Education Courseware and US Student Assessment.
• Strong performance in our structural growth opportunities driven by good enrolment growth in Online Program Management (OPM) and Connections Academy, a continuing ramp-up of contracts in our Professional Certification business (VUE) and strong test volumes in Pearson Test of English Academic.
• Pearson’s sales decreased by 2% in headline terms largely due to disposals of non core businesses.
• As in previous years, Pearson’s sales and profits are weighted towards the second half of the year.
Adjusted operating profit up 30% in underlying terms • Reflecting sales growth and savings from the 2017-2019 restructuring programme,
partially offset by cost inflation and other operational factors. Strong balance sheet with H1 net debt at £726m (H1 2018: £775m) pre IFRS 161 • On a post IFRS 16 basis net debt at the end of H1 2019 was £1,376m. • Interim dividend 6.0p (H1 2018: 5.5p). Statutory results • Statutory operating profit from continuing operations was £37m in the first half of 2019
(H1 2018: £233m). The decrease in 2019 is largely due to the lower profit on disposal of businesses and higher restructuring charges in 2019, partly offset by improved trading and additional restructuring savings.
• Statutory EPS 6.1p (H1 2018: 24.1p) reflects lower profit on disposal of businesses. Simplification on track to deliver over £330m annualised cost savings by end of 2019 • Incremental cost savings of £60m delivered in the first half. • Completed our Enterprise Resource Planning (ERP) implementation in the US with over
75% of the company by revenue now operating on a single ERP system. • On track to launch the Global Learning Platform (GLP) and a suite of new digital products
over the coming months. FY 2019 adjusted operating profit guidance unchanged; adjusted EPS upgraded • We continue to expect Pearson to deliver underlying profit growth and stabilise revenue
in 2019, and for revenue to grow in 2020. • For 2019 we are upgrading our adjusted earnings per share guidance to be between
57.5p to 63.0p reflecting improvements in the finance charge and taxation at exchange rates prevailing on 31st December 2018.
John Fallon, Chief Executive said: “We've had a good first half, with underlying growth across all divisions, as we start to benefit from accelerating our shift to digital. We are on track to at least stabilise revenue this year and return the company to top line growth from 2020. We are excited by the new digital products and platforms we're now launching, and our ability to help millions more people prepare for, develop in, and change careers through a lifetime of learning.”

2
Financial summary
£m H1 2019 H1 2018 Headline
growth CER growth Underlying
growth Business performance
Sales 1,829 1,865 (2)% (6)% 2% Adjusted operating profit 144 107 35% 26% 30% Operating cash flow (129) (202) Adjusted earnings per share (basic)
13.2p 8.2p
Dividend per share 6.0p 5.5p Net debt (1,376) (775) Statutory results
Sales 1,829 1,865 Operating profit 37 233 Cash generated from operations
(117) (131)
Basic earnings per share 6.1p 24.1p
Throughout this announcement: a) Growth rates are stated on an underlying basis unless otherwise stated. Underlying growth rates exclude currency movements, portfolio changes and changes related to the adoption of IFRS16. b) The ‘business performance’ measures are non-GAAP measures and reconciliations to the equivalent statutory heading under IFRS are included in notes to the attached condensed consolidated financial statements 2, 3, 4, 5, 7, and 17.

3
Continuing good progress on our strategic priorities. During the first half of 2019 we continued to make good progress on our strategic priorities of digital transformation, investing in structural growth and simplification, making us a leaner, more agile and more sustainable business.
Digital transformation
• We recently announced that all future releases of Pearson’s 1,500 active US Higher Education Courseware titles will be “digital first” and updated on an ongoing basis. This drives benefits in content delivery, speed and cost, and further facilitates our move from ownership to subscription based access models. It also allows the communication of a simpler and more transparent marketing strategy for pricing.
• We continue to make good progress with our strategy of shifting from ownership to subscription based access models, signing 84 new institutions in Inclusive Access in the first half of the year. This takes the total number of institutions that have signed to 781 representing c.16% of US Higher Education Courseware revenue, up over 40% from H1 2018. We will continue to expand our access based models adding a further 200 titles in our Partner Print Rental programme resulting in over 330 titles this Fall with a further 80 titles available in digital format only.
• US Higher Education Courseware digital revenue grew moderately on a like for like basis, while registrations, including ebooks, declined 1%. Good registration growth in Revel, up 22% was offset by continued market pressure in Developmental Mathematics and the planned retirement and deprioritisation of long tail products in advance of our launch of GLP and the digital first model. We expect this to continue during the transition to the digital first and GLP enabled model, before growth in registrations resumes in 2021.
• US Student Assessment declined 5% in online tests to K12 students, due to contract exits and reductions in scope. TestNav8, our digital testing platform, operated with 100% up-time across all customers with a peak load of 1.3m students in a single day.
• Our Core Assessment business benefited from the delivery of a new contract in Egypt to run the national high school assessment programme. This will deliver 125m digital tests over a four year lifecycle making it Pearson’s biggest assessment contract by volume.
Invest in structural growth markets
• In Online Program Management (OPM) revenue grew well with enrolment growth of 13% on a global basis and the launch of new programs.
• In Connections Academy, our K12 virtual school business, enrolment growth of 11% across existing schools and new schools led to strong revenue growth.
• Both OPM and Connections continue to benefit from strong pipelines underpinning revenue growth going forward.
• In Professional Certification, revenue grew well as we continued to benefit from the ramp-up of new contracts and the renewal of existing contracts. Pearson’s Professional Certification business partners with more than 450 credential owners across the globe.
• Pearson Test of English Academic grew global test volumes by 18% with a strong performance in Australia, India and China.
Simpler and more efficient
• We completed the sale of our US K12 Courseware business in March 2019. • We are on track to deliver incremental cost savings under our transformation plan of
more than £330m per annum, with the full benefits accruing from the end of 2019 onwards2.
• In the first half of the year, we achieved incremental cost savings of £60m, closing two offices and completing 80% of our headcount reduction as well as the implementation of our new ERP system in the US.
• During the second half of the year we expect to deliver further incremental savings of £70m and an additional £55m or more in 2020. Restructuring costs in the first half were £64m.
4
2019 outlook Our guidance for 2019 adjusted operating profit remains unchanged and we continue to expect to deliver adjusted operating profit of between £590m to £640m. We continue to expect to stabilise revenue in 2019 and to return to top line growth in 2020. Our guidance for US Higher Education Courseware remains unchanged with net sales expected to be flat to down 5% for the full year, driven by ongoing underlying market pressures. For the full year, we are updating our guidance for improvements in the finance charge and taxation. We now expect our finance charge to be £45m for the full year due to favourable interest outcomes from settlements of historical tax positions. We expect our tax rate to be in the range of 17% - 19% following further review of detailed regulations published regarding US tax reform. The impact of these changes increases our adjusted earnings per share to be between 57.5p to 63.0p at exchange rates prevailing on 31st December 2018. We calculate that a 5c move in the US Dollar exchange rate to Sterling would impact adjusted EPS by around 2.0p to 2.5p.
Contacts Investor Relations Jo Russell, Tom Waldron, Anjali Kotak +44 (0) 207 010 2310 Media Tom Steiner, Gemma Terry +44 (0) 207 010 2310 Brunswick Charles Pretzlik, Nick Cosgrove, Simone Selzer +44 (0) 207 404 5959 Webcast details Pearson’s results presentation for investors and analysts will be audiocast live today
from 0830 (BST) via www.pearson.com. Dial in details: United Kingdom Toll-Free: 08003589473 United Kingdom Toll: +44 3333000804 PIN: 45472957# Audience URL: http://pear.sn/Y1aL30pdcvV
Forward looking statements: Except for the historical information contained herein, the matters discussed in this statement include forward-looking statements. In particular, all statements that express forecasts, expectations and projections with respect to future matters, including trends in results of operations, margins, growth rates, overall market trends, the impact of interest or exchange rates, the availability of financing, anticipated cost savings and synergies and the execution of Pearson’s strategy, are forward-looking statements. By their nature, forward-looking statements involve risks and uncertainties because they relate to events and depend on circumstances that will occur in future. They are based on numerous assumptions regarding Pearson’s present and future business strategies and the environment in which it will operate in the future. There are a number of factors which could cause actual results and developments to differ materially from those expressed or implied by these forward-looking statements, including a number of factors outside Pearson’s control. These include international, national and local conditions, as well as competition. They also include other risks detailed from time to time in Pearson’s publicly-filed documents and you are advised to read, in particular, the risk factors set out in Pearson’s latest annual report and accounts, which can be found on its website (www.pearson.com/corporate/investors.html). Any forward-looking statements speak only as of the date they are made, and Pearson gives no undertaking to update forward-looking statements to reflect any changes in its expectations with regard thereto or any changes to events, conditions or circumstances on which any such statement is based. Readers are cautioned not to place undue reliance on such forward-looking statements.

5
Financial overview
Profit & loss statement. Pearson’s sales decreased by 2% in headline terms to £1,829m (H1 2018: £1,865m) with portfolio adjustments reducing sales by £141m, and currency movements increasing revenue by £69m. Stripping out the impact of portfolio changes and currency movements, revenue was up 2% in underlying terms due to 1% growth in our North America segment, a 6% increase in our Core segment and a 2% increase in our Growth segment. The 2019 adjusted operating profit of £144m (H1 2018: £107m) reflects sales growth and savings from the ongoing transformation plan, the impact of FX and a modest benefit from the adoption of IFRS 16, partially offset by cost inflation, other operational factors and disposals. Excluding the impact of FX, IFRS 16 and portfolio items, underlying adjusted operating profit grew 30%. Net interest payable to 30 June 2019 was £18m, (H1 2018: £26m). The decrease is primarily due to lower levels of net debt together with favourable movements in interest on tax and the absence of one off costs relating to the redemption of bonds in the first half of 2018 which were more than enough to offset the impact of net interest payable on leases. The increase in interest on leases is due to the adoption of IFRS 16 which resulted in an additional £16m of net interest payable in H1 2019. Our adjusted tax charge was £23m (H1 2018: £16m). Adjusted earnings for the period were £102m (H1 2018: £64m) and adjusted earnings per share were 13.2p (H1 2018: 8.2p). Cash generation. Net cash used in operations was £117m compared to £131m in 2018 reflecting an increase in restructuring spend of £27m to £60m in the first half of 2019. Operating cash outflow decreased by £73m from £202m in 2018 to £129m. This decrease includes the impact of the adoption of IFRS 16 and the divestment of our US K12 Courseware business in March 2019 which would have seen a seasonal cash outflow in the first half. Statutory results. Our statutory operating profit of £37m in H1 2019 compares to a profit of £233m in H1 2018 which included the profit on disposals of WSE and Utel. Capital allocation. Our disciplined approach to capital allocation and to maintaining a strong balance sheet will play a major part in driving long-term growth. We will create further value through investing in the business, delivering a sustainable and progressive dividend and will return any surplus cash to our shareholders. Balance sheet. H1 net debt of £726m (H1 2018: £775m) on a pre IFRS 16 basis. Post IFRS 16, net debt at the end of H1 2019 was £1,376m. Dividend. In line with our policy, the Board is proposing an interim dividend of 6.0p (2018: 5.5p) payable on 13 September 2019.
Notes: 1 IFRS 16 – Leases is the new accounting standard which has replaced IAS 17 and is applicable for financial years commencing on or after 1 January 2019, and which the Group adopted on the 1 January 2019. The standard results in the operating lease expense being replaced by finance costs and depreciation which will reflect the corresponding lease liabilities and right of use assets which will now be recognised on the balance sheet. 2 Based on December 2018 exchange rates, a significant part of costs and savings from the restructuring programme are US Dollar denominated and in other non-Sterling currencies and are therefore subject to exchange rate movements over the implementation timeframe.

6
Operational review – Geography
£ millions H1 2019 H1 2018 Headline
growth CER
growth Underlying
growth Sales North America 1,209 1,223 (1)% (7)% 1% Core 403 383 5% 5% 6% Growth 217 259 (16)% (15)% 2% Total sales 1,829 1,865 (2)% (6)% 2% Adjusted operating profit North America 79 64 23% 13% 11% Core 31 10 210% 200% 190% Growth 9 11 (18)% (18)% 50% Penguin Random House 25 22 14% 9% 9% Total adjusted operating profit 144 107 35% 26% 30%
See note 2 in the consolidated financial statements for the reconciliation to the equivalent statutory measures.
North America (66% of revenue) Underlying revenue rose 1% reflecting good growth in OPM, Connections Academy and Professional Certification, more than offsetting expected modest declines in US Higher Education Courseware and Student Assessment. In headline terms, revenue declined 1% as the factors above and currency benefits were more than offset by a reduction in revenue related to the US K12 Courseware disposal. Adjusted operating profit grew 11% in underlying terms due primarily to the benefits of the restructuring programme. In headline terms adjusted operating profit rose 23% due to the benefits of the restructuring programme, currency benefits and a positive impact from changes related to the adoption of IFRS 16.
Courseware In School Courseware, the US K12 Courseware business contributed £53m of revenue in the first quarter before it was sold at the end of March. In Higher Education Courseware, we continue to reshape the business, breaking away from the traditional education publishing model built around three year edition cycles towards a “digital first” product model, allowing us to accelerate the shift from ownership to access. This will enable simpler and more affordable pricing for students and allow us to regain share from the secondary market and drive up our average revenue per course enrolment over time. During the first half of the year, Higher Education Courseware net revenue was down in line with the middle of our full year guidance range, against a strong comparative in H1 2018, which benefited from the absence of the additional returns provision we took in H1 2017. This performance was consistent with our expectations and we continue to expect revenue in this segment in 2019 to be in line with our previous forecast of flat to down 5%. Total US College Spring enrolments fell 1.4%, similar to the decline in Fall 2018, with combined two-year public and four-year for-profit enrolments declining 5.8%, affected by rising employment rates, regulatory change impacting the for-profit and developmental learning sectors, and by the transfer of a large college from the For Profit sector to Private Not For Profit. US Higher Education Courseware digital revenue grew moderately on a like for like basis while registrations, including ebooks, declined 1%. Good registration growth in Revel, up 22%, was offset by continued market pressure in Developmental Mathematics and the planned retirement and deprioritisation of long tail products in advance of our launch of GLP and the digital first model. We expect this to continue during the transition to the digital first and GLP enabled model, before growth resumes in 2021.

7
Our GLP development and digital roadmap are on track to deliver new digital products with greater personalisation and enhanced engagement. We are launching 18 Revel titles on the GLP in the second half of this year with the remaining 300 titles migrating by the end of 2020 underpinning expected registration growth in Revel for the next two years. We continue to make good progress with our strategy of shifting from ownership to access, signing 84 new institutions in Inclusive Access in the first half of the year. This takes the total number of institutions that have signed to 781 representing c.16% of US Higher Education Courseware revenue, up over 40% from H1 2018. We will continue to expand our access based models adding a further 200 titles in our Partner Print Rental programme resulting in over 330 titles this Fall with a further 80 titles available in digital format only.
Assessment In Student Assessment, revenue declined as expected due to the contraction in revenue associated with contracts exits, the loss of a contract in Indiana for assessment in grades 3-8 and reductions in scope. In Kentucky, Maryland, and New Jersey, states where we were the existing testing vendor, we won new, competitively bid contracts. In addition, we won a new contract to deliver assessments in Tennessee and were awarded the contract to administer the federal National Center for Educational Statistics (NCES) National Assessment of Educational Progress (NAEP) in 2019. We delivered 20.7 million standardised online tests to K12 students, a decrease of 5% from the same period in 2018 due to contract exits and reductions in scope. Paper-based standardised test volumes fell 12% to 8.0 million. Digital tests on Pearson’s TestNav platform accounted for 72% of our testing volumes (H1 2018: 70%). In Professional Certification, revenue grew well benefiting from growth in IT certification and nursing and the continued ramp-up of new contracts in networking, online retail and teaching. In total Pearson VUE signed 17 new agreements in the period and renewed 30 existing contracts. Our renewal rate on existing contracts continues to be over 90%. Global test volumes increased 8% to 8.7m. Pearson VUE partners with more than 450 credential owners across the globe. Clinical Assessment sales declined on the phasing of new product releases which are weighted to the second half. Q-Interactive, Pearson’s digital solution for Clinical Assessment administration, saw continued strong growth in licence sales with sub-test administrations up over 30% over the same period last year.
Services Revenue in Connections Academy, our K12 online school business, grew strongly. Connections Academy served 70,000 Full Time Equivalent (FTE) students through 37 continuing full-time virtual partner schools in 28 states, up 11% on last year. Total FTE virtual school students declined 3% to 73,000 as expected due to contract exits at Commonwealth Charter Academy in Pennsylvania and Florida Virtual School in 2018. Six new full-time online, state-wide partner schools will open in the 2019-20 school year. Combined with a contract exit in North Carolina this will bring the total partner schools to 42 in 28 states. Additionally, the online private school, International Connections Academy continues to serve students across the globe. The Connections Academy Parent Satisfaction Survey continues to show strong support for the schools with 2019 results showing 94% of families with enrolled students stating they would recommend the virtual schools to others and 95% agreeing that the curriculum is of high quality. In Pearson Online Services, revenue increased on good growth in OPM enrolment with only a small drag from Learning Studio revenue, a learning management system, which will be fully retired in 2019. In our OPM business, course enrolments grew 11% to over 216,000. Our programs increased to 335 with 33 new programs launched, and 23 programs discontinued.
8
We continue to build our pipeline of future program launches and during the first half, we signed 10 new programs and renewed seven programs. We are continuing to refine our portfolio and focus on programs linked to employability and expect to continue to launch new programs as well as discontinue non-strategic programs over the next 12 months. Our comprehensive employer-education business, Accelerated Pathways, continues to add more corporate partners offering foundational education, GED and online degree programs to employees across the US. In July, ManpowerGroup (NYSE: MAN), the leading global workforce solutions company, announced the launch of its MyPath™ General Education Developmental (GED) Program in partnership with Pearson. The GED program is an extension of Manpower’s MyPath™ offering that helps actively assigned US associates earn their high school equivalency diploma and future-proof their careers through accelerated learning programs, on-the-job training and certification.
Core (22% of revenue)
Revenue rose 6% in underlying terms and 5% in headline terms, primarily due to growth in OPM, Pearson Test of English Academic (PTEA), Professional Certification and growth helped by phasing in UK Student Assessment and Qualifications, School and Higher Education Courseware and the delivery of a new digital assessment contract in Egypt. Adjusted operating profit was up £19m in underlying terms and £21m in headline terms primarily due to trading and the benefits of restructuring.
Courseware Courseware revenue was up moderately with timing of orders helping Higher Education Courseware in the UK and Australia.
Assessment In Student Assessment and Qualifications, revenue grew, helped by phasing, with good growth in GCSEs, A-levels, BTEC Firsts and Higher Nationals and the delivery of a new digital assessment contract in Egypt. This was partially offset by continued declines in Apprenticeships which will continue to impact the business in the second half of the year. We successfully delivered the National Curriculum Test for 2019, marking 3.8 million scripts, up slightly from 2018. We will continue to administer the NCT test until September 2019. In Professional Certification business, revenue was up due to good volume growth in the DVSA test in the UK, higher IT test volumes in Australia and good volume growth in the MOI (French driving test) which launched in late 2017. PTEA saw continued strong growth in test volumes in Australia during the first half, up 18% from 2018. This was driven primarily by its use to support visa applications to the Australian Department of Home Affairs as well as good growth in New Zealand.
Services In Higher Education Services, our OPM revenue grew strongly with 41% growth in course enrolments across eight university partners and 29 programs in Australia and the UK.
Growth (12% of revenue)
In Growth, revenue grew 2% in underlying terms primarily due to good performance in School Courseware in the Middle East and growth in PTEA and Professional Certification. Revenue declined 16% in headline terms primarily due to the disposal of WSE.

9
Adjusted operating profit grew £2m in underlying terms primarily reflecting the benefits of restructuring and declined 18% in headline terms due to disposals partially offset by a positive impact from changes related to the adoption of IFRS 16.
Courseware Courseware revenue grew slightly with growth in School Courseware due to timing of orders in the Middle East.
Assessment PTEA saw strong growth in revenue with over 16% test volume growth in India and China. Professional Certification grew well due to IT infrastructure and accounting certification contracts.
Services Services revenue was flat with a slight increase in Higher Education Services due to changes in prices at Pearson Institute of Higher Education offset by slight declines in English Services due to later phasing of franchise campaigns in our English Language Schools in Brazil.
Penguin Random House
Pearson owns 25% of Penguin Random House, the first truly global consumer book publishing company. Penguin Random House performed in line with our expectations with revenue growth on an underlying basis due to a rise in print and audio sales, which were partially offset by lower ebook sales. The business benefited from bestsellers by Michelle Obama, Delia Owen, Tara Westover, E L James, Jeff Kinney, and Dr. Seuss. Our stake in Penguin Random House contributed £25m to our adjusted operating profit, up 9% in underlying terms.

10
Financial Review Operating result Due to seasonal bias in some of the Group’s businesses, Pearson makes a higher proportion of its sales and the majority of its profits in the second half of the year. Operating cash flow at the half year is a cash outflow reflecting the seasonal increase in working capital. Sales for the six months to 30 June 2019 decreased on a headline basis by £36m or 2% from £1,865m for the six months to 30 June 2018 to £1,829m for the same period in 2019 and adjusted operating profit increased by £37m or 35% from £107m in the first half of 2018 to £144m in the first half of 2019 (for a reconciliation of this measure see note 2 to the condensed consolidated financial statements). The headline basis simply compares the reported results for the six months to 30 June 2019 with those for the equivalent period in the prior year. We also present sales and profits on an underlying basis which exclude the effects of exchange, the effect of portfolio changes arising from acquisitions and disposals and the impact of adopting new accounting standards that are not retrospectively applied. Our portfolio change is calculated by taking account of the contribution from acquisitions and by excluding sales and profits made by businesses disposed in either 2018 or 2019. Portfolio changes mainly relate to the sale of our K12 school courseware business in the US in 2019 and the sale of our Wall Street English language teaching business in the first half of 2018. Acquisitions were not significant in either 2018 or 2019. In 2019, our underlying basis excludes the impact on adjusted operating profit of IFRS 16 ‘Leases’. This new standard was adopted on 1 January 2019 but the comparative figures for 2018 have not been restated. The impact in the first six months of 2019 was to increase adjusted operating profit by £13m (see also note 1b to the condensed consolidated financial statements). On an underlying basis, sales increased by 2% in the first six months of 2019 compared to the equivalent period in 2018 and adjusted operating profit increased by 30%. Currency movements increased sales by £69m and adjusted operating profit by £9m. Portfolio changes decreased sales by £141m and, together with the impact of IFRS 16 (as noted above), decreased adjusted operating profit by £2m. Adjusted operating profit includes the results from discontinued operations when relevant but excludes intangible charges for amortisation and impairment, acquisition related costs, gains and losses arising from acquisitions and disposals and the cost of major restructuring. In 2018, we also excluded the impact of adjustments arising from clarification of guaranteed minimum pension (GMP) equalisation legislation in the UK which impacted the post-retirement benefit charge in the second half of 2018 and is not expected to recur. A summary of these adjustments is included below and in more detail in note 2 to the condensed consolidated financial statements. all figures in £ millions 2019 2018 2018 half year half year full year Operating profit 37 233 553 Add back: Cost of major restructuring 64 24 102 Add back: Intangible charges 49 57 113 Add back: Other net gains and losses (6) (207) (230) Add back: UK pension GMP equalisation - - 8 Adjusted operating profit 144 107 546 In May 2017, we announced a restructuring programme, to run between 2017 and 2019, to drive significant cost savings. This programme began in the second half of 2017 and costs incurred relate to delivery of cost efficiencies in our enabling functions and US higher education courseware business together with further rationalisation of the property and supplier portfolio. The restructuring costs in 2019 relate predominantly to staff redundancies whilst the restructuring costs in 2018 relate predominantly to staff redundancies and the net cost of property rationalisation including the net impact of the consolidation of our property footprint in London. Intangible amortisation charges to the end of June 2019 were £49m compared to a charge of £57m in the equivalent period in 2018 as acquisition activity has reduced in recent years. Other net gains (before tax) of £6m in 2019 is the profit on sale of the K12 business. Other net gains (before tax) of £207m in 2018 relate to
11
the sale of the Wall Street English language teaching business (WSE), a gain of £184m, the disposal of our equity interest in UTEL, the online University partnership in Mexico, a gain of £19m, and various other smaller disposal items for a net gain of £4m. The statutory operating profit from continuing operations of £37m in the first half of 2019 compares to a profit of £233m in the first half of 2018. The decrease in 2019 is largely due to the lower profit on disposal of businesses and higher restructuring charges in 2019, partly offset by improved trading, additional restructuring savings and reduced intangible amortisation charges. Net finance costs Net interest payable to 30 June 2019 was £18m, compared to £26m in the first half of 2018. The decrease is primarily due to lower levels of net debt together with favourable movements in interest on tax and the absence of one-off costs relating to the redemption of bonds in the first half of 2018 which were more than enough to offset the impact of net interest payable on leases. The increase in interest on leases is due to the adoption of IFRS 16 which resulted in an additional £16m of net interest payable in the first half of 2019. Finance income relating to retirement benefits has been excluded from our adjusted earnings as we believe the income statement presentation does not reflect the economic substance of the underlying assets and liabilities. Also included in the statutory definition of net finance costs (but not in our adjusted measure) are interest costs relating to acquisition consideration, foreign exchange and other gains and losses on derivatives. Interest relating to acquisition consideration is excluded from adjusted earnings as it is considered to be part of the acquisition cost rather than being reflective of the underlying financing costs of the Group. Foreign exchange and other gains and losses are excluded from adjusted earnings as they represent short-term fluctuations in market value and are subject to significant volatility. Other gains and losses may not be realised in due course as it is normally the intention to hold the related instruments to maturity (for more information see note 3 to the condensed consolidated financial statements). In the period to 30 June 2019, the total of these items excluded from adjusted earnings was a charge of £6m compared to a charge of £5m in the first half of 2018. Finance income relating to retirement benefits increased from £5m in the first half of 2018 to £7m in 2019 reflecting the comparative funding position of the plans at the beginning of each year. This increase was offset by increased losses on derivatives although foreign exchange losses on unhedged cash and cash equivalents reduced in the first half of 2019 compared to the first half of 2018. For a reconciliation of the adjusted measure see note 3 to the condensed consolidated financial statements. Taxation Taxes on income in the period are accrued using the expected tax rates that would be applicable to forecast annual earnings. The reported tax on statutory earnings for the six months to 30 June 2019 was a benefit of £35m compared to a charge of £13m in the period to 30 June 2018. The benefit in 2019 includes a £37m credit relating to the sale of the K12 business with the remaining charge reflecting the overall mix of profits projected for the full year and the tax rates expected to apply to those statutory profits. The effective tax rate on adjusted earnings for the period to June 2019 was 18% compared to an effective rate of 20% in the first half of 2018. This rate is lower than the average statutory rate applicable to the countries we operate in as it includes the benefit of tax deductions attributable to amortisation of goodwill and other intangibles. This benefit more accurately aligns the adjusted tax charge with the expected rate of cash tax payment. For a reconciliation of the adjusted measure see notes 4 and 5 to the condensed consolidated financial statements. Tax paid of £8m in the six months to 30 June 2019 was consistent with the amounts paid in the same period in 2018. In the first half of both 2018 and 2019, there were refunds in respect of prior years. The Group adopted IFRIC 23 ‘Uncertainty over Income Tax Treatments’ on 1 January 2019 resulting in a reduction of £5m in provisions for uncertain tax positions. The cumulative effect of applying this adjustment has been applied to retained earnings at 1 January 2019 (see also note 1c to the condensed consolidated financial statements). The impact of adopting IFRIC 23 on the income statement for the first half of 2019 was not material. Other comprehensive income Included in other comprehensive income are the net exchange differences on translation of foreign operations. The gain on translation of £25m at 30 June 2019 compares to a loss at 30 June 2018 of £15m. The gain in 2019 arises from an overall strengthening of the currencies to which the Group is exposed even though the Sterling to US dollar exchange rate remained fairly constant through the period. A significant

12
proportion of the Group’s operations are based in the US and the US dollar closing rate at 30 June 2019 was the same as the opening rate of £1:$1.27 At the end of June 2018, the US dollar had strengthened slightly from an opening rate of £1:$1.35 to a closing rate of £1:$1.32 and this movement was offset by the weakness in other currencies to which the Group is exposed causing the small loss in the first half of 2018. Also included in other comprehensive income at 30 June 2019 is an actuarial loss of £141m in relation to retirement benefit obligations. The loss arises from the unfavourable impact of changes in the assumptions used to value the liabilities in the plans and in particular movements in the discount rate. The value of assets was also impacted following the UK plan’s purchase of insurance buy-in policies in the first half of 2019. The loss in 2019 compares to an actuarial gain at 30 June 2018 of £122m. Cash flows Our operating cash flow measure is used to align cash flows with our adjusted profit measures (see note 17 to the condensed consolidated financial statements). Operating cash outflow decreased on a headline basis by £73m from £202m in the first half of 2018 to £129m in the first half of 2019. The decrease includes the impact of the adoption of IFRS 16 in conjunction with the property rationalisation programme as part of the Group’s transformation and the absence of the K12 business which would have seen a seasonal cash outflow in the first half. The equivalent statutory measure, net cash used in operations, was £117m in 2019 compared to £131m in 2018. Compared to operating cash flow, this measure includes restructuring costs but does not include regular dividends from associates or capital expenditure on property, plant, equipment and software. Restructuring costs paid increased from £27m in the first half of 2018 to £60m in the first half of 2019. The adoption of IFRS 16 has resulted in a change in the classification of lease related cash flows in the cash flow statement although there is no impact on the total movement in cash and cash equivalents. The Group’s net debt increased from £143m at the end of 2018 to £1,376m at the end of June 2019. The adoption of IFRS 16 added £688m of debt on transition with the remainder of the increase principally due to the seasonal operating cash outflow, interest, tax and dividend payments, treasury share purchases, additional capital invested in PRH and outflows from the K12 disposal transaction. Post-retirement benefits Pearson operates a variety of pension and post-retirement plans. Our UK Group pension plan has by far the largest defined benefit section. We have some smaller defined benefit sections in the US and Canada but, outside the UK, most of our companies operate defined contribution plans. The charge to profit in respect of worldwide pensions and retirement benefits amounted to £27m in the period to 30 June 2019 (30 June 2018: £25m) of which a charge of £34m (30 June 2018: £30m) was reported in adjusted operating profit and income of £7m (30 June 2018: £5m) was reported against other net finance costs. The increase in the charge in 2019 is largely explained by the absence of past service credits which in the first half of 2018 amounted to £11m and related to changes in the US post-retirement medical plan. The overall surplus on UK Group pension plans of £571m at the end of 2018 has decreased to a surplus of £433m at the end of June 2019. The decrease has arisen principally due to the actuarial loss noted above in the other comprehensive income section. In total, our worldwide net position in respect of pensions and other post-retirement benefits decreased from a net asset of £471m at the end of 2018 to a net asset of £337m at the end of June 2019. Adoption of new accounting standards and interpretations in 2019 The adoption of IFRS 16 ‘Leases’ has impacted both the income statement as described above and has had an impact on certain lines in the balance sheet. The lease liability (classified as financial liabilities - borrowings) brought onto the balance sheet at transition was £904m with the corresponding right-of-use asset (classified within property, plant and equipment) valued at £435m. In addition, certain subleases have been reclassified as finance leases resulting in an additional lease receivable (classified as other receivables) of £216m being brought on balance sheet. The net impact on the balance sheet is a reduction of net assets of £86m after taking into account existing liabilities relating to onerous lease provisions (reducing provisions for other liabilities and charges by £101m), lease incentives, adjustments to tax and the net impact on associates. The full impact of the adoption of this standard is outlined in note 1b to the condensed consolidated financial statements. The impact of adopting IFRIC 23 ‘Uncertainty over Income Tax Treatments’ had a small impact on the current tax balance but has not materially impacted the income statement (see note 1c to the condensed consolidated financial statements).

13
Dividends The dividend accounted for in the six months to 30 June 2019 is the final dividend in respect of 2018 of 13.0p. An interim dividend for 2019 of 6.0p was approved by the Board in July 2019 and will be accounted for in the second half of 2019. Businesses disposed Following the decision in 2017 to sell the K12 school courseware business in the US, the assets and liabilities of that business were classified as held for sale on the balance sheet at 30 June 2018 and at 31 December 2018. In March 2019, the Group completed the sale of its K12 business resulting in a pre-tax profit on sale of £6m. Total gross proceeds were £192m including £172m of deferred proceeds which include the fair value of an unconditional vendor note for $225m and an entitlement to 20% of future cash flows to equity holders and 20% of net proceeds in the event of a subsequent sale. The cash outflow in the period relating to the disposal was £100m mainly reflecting this deferral of proceeds and the seasonal level of cash held in the business at the disposal date. Tax on the disposal is estimated to be a benefit of £37m. The benefit arises as the transaction gives rise to a loss for tax purposes mainly due to the differing treatment of deferred revenue disposed in the tax computation. Further details relating to this transaction can be found in notes 10, 14 and 16 to the condensed consolidated financial statements. Principal risks and uncertainties The principal risks and uncertainties have not changed materially from those detailed in the 2018 Annual Report and are summarised below. Business transformation and change
The accelerated pace and scope of our transformation initiatives increase our risk to execution timelines and to business adoption of change. The risk is that benefits may not be fully realised, costs may increase or that our business as usual activities are adversely impacted. Products and services
Failure to successfully invest in, develop and deliver (to time and quality) innovative, market leading global products and services that will have the biggest impact on learners and drive growth, ensuring Pearson: Responds to market needs, as well as threats from both traditional competitors as well as disruptive innovation; Offers products to market in line with our strategy, at the right price and with a deal structure that remains competitive. Talent
Failure to maximise our talent – Risk that we are unable to attract the talent we need and to create the conditions in which our people can perform to the best of their ability. Political and regulatory risk
Changes in policy and/or regulations have the potential to impact business models and/or decisions across all markets. Testing failure
Failure to deliver tests and assessments and other related contractual requirements because of operational or technology issues, resulting in negative publicity impacting our brand and reputation. Safety and security
Risk to the safety and security of our people and learners arising from either the risk of injury and illness; our failure to adequately protect children and learners; or due to increasing local and global threats. Customer experience
Failure of either our current operations, supply chain or customer support to deliver an acceptable service level at any point in the end-to-end journey; or to accelerate Pearson’s lifelong learner strategy and transformation.

14
Business resilience
Failure to plan for, recover, test or prevent incidents at any of our businesses or locations. Incident management and technology disaster recovery (DR) plans may not be comprehensive across the enterprise. Harnessing the power of our data
Failure to: 1) Maximise our use of data to enhance the quality and scope of current products and services in order to improve learning outcomes while managing associated risks. 2) Maintain data quality, accuracy and integrity to enable informed decision-making and reduce the risk of non-compliance with legal and regulatory requirements. Tax
Legislative change caused by the OECD Base Erosion and Profit Shifting (BEPS) initiative, the UK exit from the EU or other domestic government initiatives, including in response to the European Commission State Aid decision regarding the UK CFC exemption, results in a significant change to the effective tax rate, cash tax payments, double taxation and/or negative reputational impact. Information security and data privacy
Risk of a data privacy incident or other failure to comply with data privacy regulations and standards and/or a weakness in information security, including a failure to prevent or detect a malicious attack on our systems, could result in a major data privacy or confidentiality breach causing damage to the customer experience and our reputational damage, a breach of regulations and financial loss. Intellectual property (including piracy)
Failure to adequately manage, procure, register or protect intellectual property rights (including trademarks, patents, trade secrets and copyright) in our brands, content and technology may (1) prevent us from enforcing our rights and (2) enable bad actors to illegally access and duplicate our content (print and digital counterfeit, digital piracy), which will reduce our sales and/or erode our revenues. Compliance including anti-bribery and corruption (ABC) and sanctions
Failure to effectively manage risks associated with compliance (global and local legislation), including failure to vet third-parties, resulting in reputational harm, ABC liability or sanctions violations. Competition law
Failure to comply with anti-trust and competition legislation could result in costly legal proceedings and/or adversely impact our reputation.

15
CONDENSED CONSOLIDATED INCOME STATEMENT for the period ended 30 June 2019 all figures in £ millions note 2019 2018 2018 half year half year full year Continuing operations Sales 2 1,829 1,865 4,129 Cost of goods sold (904) (912) (1,943) Gross profit 925 953 2,186 Operating expenses (912) (942) (1,907) Other net gains and losses 2 6 207 230 Share of results of joint ventures and associates 18 15 44 Operating profit 2 37 233 553 Finance costs 3 (46) (63) (91) Finance income 3 22 32 36 Profit before tax 4 13 202 498 Income tax 5 35 (13) 92 Profit for the period 48 189 590 Attributable to: Equity holders of the company 47 188 588 Non-controlling interest 1 1 2 Earnings per share (in pence per share) Basic 6 6.1p 24.1p 75.6p Diluted 6 6.1p 24.1p 75.5p
The accompanying notes to the condensed consolidated financial statements form an integral part of the financial information.

16
CONDENSED CONSOLIDATED STATEMENT OF COMPREHENSIVE INCOME for the period ended 30 June 2019
all figures in £ millions 2019 2018 2018 half year half year full year Profit for the period 48 189 590 Items that may be reclassified to the income statement Net exchange differences on translation of foreign operations 25 (15) 90 Currency translation adjustment on disposals 4 (4) (4) Attributable tax (1) (2) (4) Items that are not reclassified to the income statement Fair value gain on other financial assets 18 2 8 Attributable tax (3) (1) - Remeasurement of retirement benefit obligations (141) 122 25 Attributable tax 23 (25) 9 Other comprehensive (expense) / income for the period (75) 77 124 Total comprehensive (expense) / income for the period (27) 266 714 Attributable to: Equity holders of the company (28) 265 712 Non-controlling interest 1 1 2
17
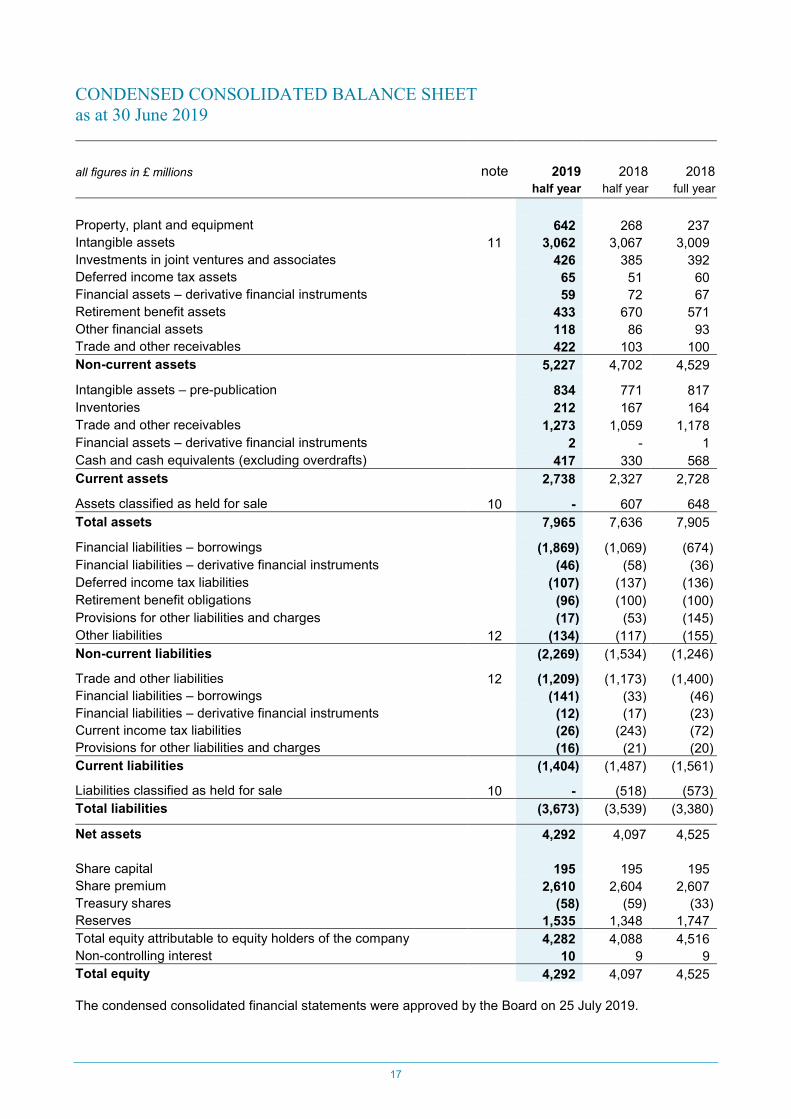
CONDENSED CONSOLIDATED BALANCE SHEET as at 30 June 2019
all figures in £ millions note 2019 2018 2018 half year half year full year
Property, plant and equipment 642 268 237 Intangible assets 11 3,062 3,067 3,009 Investments in joint ventures and associates 426 385 392 Deferred income tax assets 65 51 60 Financial assets – derivative financial instruments 59 72 67 Retirement benefit assets 433 670 571 Other financial assets 118 86 93 Trade and other receivables 422 103 100 Non-current assets 5,227 4,702 4,529 Intangible assets – pre-publication 834 771 817 Inventories 212 167 164 Trade and other receivables 1,273 1,059 1,178 Financial assets – derivative financial instruments 2 - 1 Cash and cash equivalents (excluding overdrafts) 417 330 568 Current assets 2,738 2,327 2,728 Assets classified as held for sale 10 - 607 648 Total assets 7,965 7,636 7,905 Financial liabilities – borrowings (1,869) (1,069) (674) Financial liabilities – derivative financial instruments (46) (58) (36) Deferred income tax liabilities (107) (137) (136) Retirement benefit obligations (96) (100) (100) Provisions for other liabilities and charges (17) (53) (145) Other liabilities 12 (134) (117) (155) Non-current liabilities (2,269) (1,534) (1,246) Trade and other liabilities 12 (1,209) (1,173) (1,400) Financial liabilities – borrowings (141) (33) (46) Financial liabilities – derivative financial instruments (12) (17) (23) Current income tax liabilities (26) (243) (72) Provisions for other liabilities and charges (16) (21) (20) Current liabilities (1,404) (1,487) (1,561) Liabilities classified as held for sale 10 - (518) (573) Total liabilities (3,673) (3,539) (3,380) Net assets 4,292 4,097 4,525 Share capital 195 195 195 Share premium 2,610 2,604 2,607 Treasury shares (58) (59) (33) Reserves 1,535 1,348 1,747 Total equity attributable to equity holders of the company 4,282 4,088 4,516 Non-controlling interest 10 9 9 Total equity 4,292 4,097 4,525 The condensed consolidated financial statements were approved by the Board on 25 July 2019.

18
CONDENSED CONSOLIDATED STATEMENT OF CHANGES IN EQUITY for the period ended 30 June 2019
Equity attributable to equity holders of the company
all figures in £ millions
Share capital
Share premium
Treasury shares
Capital redem
ption reserve
Fair value reserve
Translation reserve
Retained earnings
Total
Non-controlling interest
Total equity
2019 half year
At 1 January 2019 195 2,607 (33) 11 19 678 1,039 4,516 9 4,525 Adjustment on initial application of IFRS 16 net of tax (see note 1b) - - - - - - (86) (86) - (86)
Adjustment on initial application of IFRIC 23 (see note 1c) - - - - - - 5 5 - 5 At 1 January 2019 (restated) 195 2,607 (33) 11 19 678 958 4,435 9 4,444 Profit for the period - - - - - - 47 47 1 48 Other comprehensive income / (expense) - - - - 18 29 (122) (75) - (75) Total comprehensive income / (expense) - - - - 18 29 (75) (28) 1 (27) Equity-settled transactions - - - - - - 14 14 - 14 Tax on equity settled transactions - - - - - - (1) (1) - (1) Issue of ordinary shares under share option schemes - 3 - - - - - 3 - 3 Buyback of equity - - - - - - - - - - Purchase of treasury shares - - (40) - - - - (40) - (40) Release of treasury shares - - 15 - - - (15) - - - Transfer of gain on disposal of FVOCI investment - - - - - - - - - - Dividends - - - - - - (101) (101) - (101) At 30 June 2019 195 2,610 (58) 11 37 707 780 4,282 10 4,292

19
CONDENSED CONSOLIDATED STATEMENT OF CHANGES IN EQUITY for the period ended 30 June 2019
Equity attributable to equity holders of the company
all figures in £ millions
Share capital
Share premium
Treasury shares
Capital redem
ption reserve
Fair value reserve
Translation reserve
Retained earnings
Total
Non-controlling interest
Total equity
2018 half year
At 1 January 2018 200 2,602 (61) 5 13 592 544 3,895 8 3,903 Profit for the period - - - - - - 188 188 1 189
Other comprehensive income / (expense) - - - - 2 (19) 94 77 - 77
Total comprehensive income / (expense) - - - - 2 (19) 282 265 1 266 Equity-settled transactions - - - - - - 19 19 - 19 Issue of ordinary shares under share option schemes 1 2 - - - - - 3 - 3 Buyback of equity (6) - - 6 - - (1) (1) - (1) Purchase of treasury shares - - - - - - - - - - Release of treasury shares - - 2 - - - (2) - - - Dividends - - - - - - (93) (93) - (93) At 30 June 2018 195 2,604 (59) 11 15 573 749 4,088 9 4,097

20
CONDENSED CONSOLIDATED STATEMENT OF CHANGES IN EQUITY for the period ended 30 June 2019
Equity attributable to equity holders of the company
all figures in £ millions
Share capital
Share premium
Treasury shares
Capital redem
ption reserve
Fair value reserve
Translation reserve
Retained earnings
Total
Non-controlling interest
Total equity
2018 full year
At 1 January 2018 200 2,602 (61) 5 13 592 544 3,895 8 3,903 Profit for the period - - - - - - 588 588 2 590 Other comprehensive income - - - - 8 86 30 124 - 124
Total comprehensive income - - - - 8 86 618 712 2 714 Equity-settled transactions - - - - - - 37 37 - 37 Tax on equity settled transactions - - - - - - 4 4 - 4 Issue of ordinary shares under share option schemes 1 5 - - - - - 6 - 6 Buyback of equity (6) - - 6 - - (2) (2) - (2) Purchase of treasury shares - - - - - - - - - - Release of treasury shares - - 28 - - - (28) - - - Transfer of gain on disposal of FVOCI investment - - - - (2) - 2 - - - Dividends - - - - - - (136) (136) (1) (137) At 31 December 2018 195 2,607 (33) 11 19 678 1,039 4,516 9 4,525
21
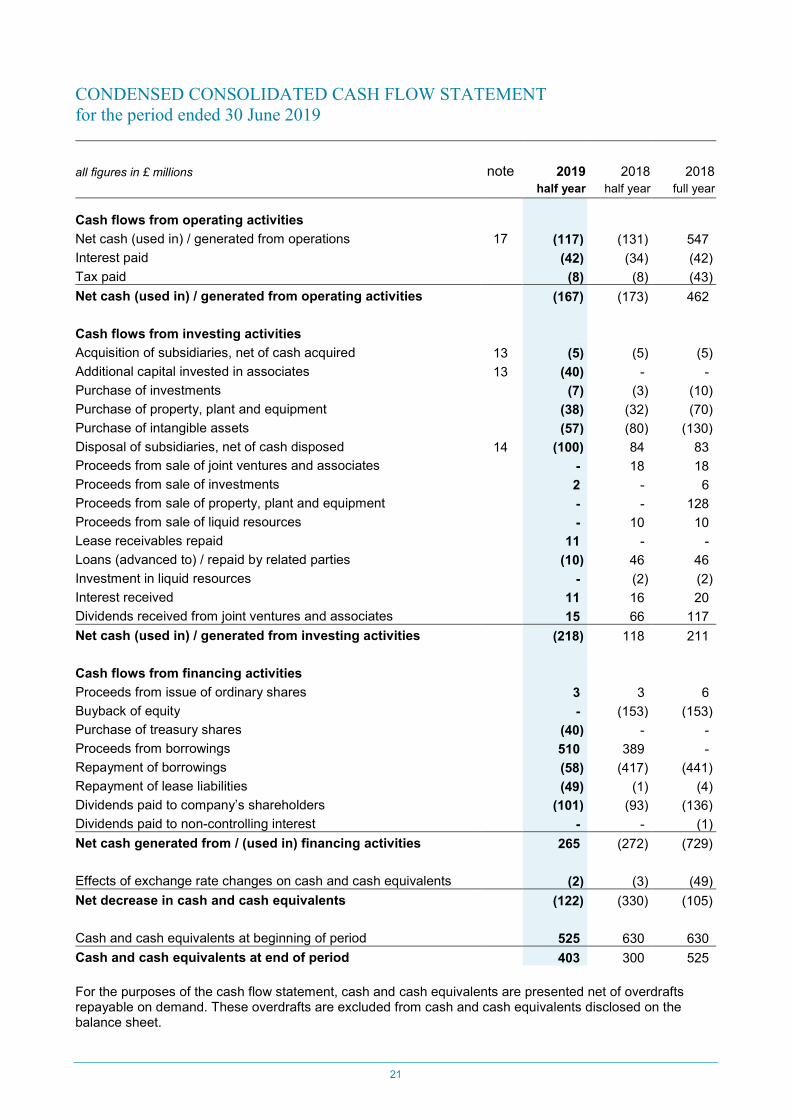
CONDENSED CONSOLIDATED CASH FLOW STATEMENT for the period ended 30 June 2019 all figures in £ millions note 2019 2018 2018 half year half year full year Cash flows from operating activities Net cash (used in) / generated from operations 17 (117) (131) 547 Interest paid (42) (34) (42) Tax paid (8) (8) (43) Net cash (used in) / generated from operating activities (167) (173) 462 Cash flows from investing activities Acquisition of subsidiaries, net of cash acquired 13 (5) (5) (5) Additional capital invested in associates 13 (40) - - Purchase of investments (7) (3) (10) Purchase of property, plant and equipment (38) (32) (70) Purchase of intangible assets (57) (80) (130) Disposal of subsidiaries, net of cash disposed 14 (100) 84 83 Proceeds from sale of joint ventures and associates - 18 18 Proceeds from sale of investments 2 - 6 Proceeds from sale of property, plant and equipment - - 128 Proceeds from sale of liquid resources - 10 10 Lease receivables repaid 11 - - Loans (advanced to) / repaid by related parties (10) 46 46 Investment in liquid resources - (2) (2) Interest received 11 16 20 Dividends received from joint ventures and associates 15 66 117 Net cash (used in) / generated from investing activities (218) 118 211 Cash flows from financing activities Proceeds from issue of ordinary shares 3 3 6 Buyback of equity - (153) (153) Purchase of treasury shares (40) - - Proceeds from borrowings 510 389 - Repayment of borrowings (58) (417) (441) Repayment of lease liabilities (49) (1) (4) Dividends paid to company’s shareholders (101) (93) (136) Dividends paid to non-controlling interest - - (1) Net cash generated from / (used in) financing activities 265 (272) (729) Effects of exchange rate changes on cash and cash equivalents (2) (3) (49) Net decrease in cash and cash equivalents (122) (330) (105) Cash and cash equivalents at beginning of period 525 630 630 Cash and cash equivalents at end of period 403 300 525 For the purposes of the cash flow statement, cash and cash equivalents are presented net of overdrafts repayable on demand. These overdrafts are excluded from cash and cash equivalents disclosed on the balance sheet.

22
NOTES TO THE CONDENSED CONSOLIDATED FINANCIAL STATEMENTS for the period ended 30 June 2019 1a. Basis of preparation The condensed consolidated financial statements have been prepared in accordance with the Disclosure and Transparency Rules of the Financial Conduct Authority and in accordance with IAS 34 ‘Interim Financial Reporting’ as adopted by the European Union (EU). The condensed consolidated financial statements should be read in conjunction with the annual financial statements for the year ended 31 December 2018 which have been prepared in accordance with International Financial Reporting Standards (IFRS) and IFRS Interpretations Committee interpretations as adopted by the EU. In respect of accounting standards applicable to the Group in the current period, there is no difference between EU-adopted IFRS and International Accounting Standards Board (IASB)-adopted IFRS. The condensed consolidated financial statements have also been prepared in accordance with the accounting policies set out in the 2018 Annual Report, except as outlined in note 1b and note 1c below, and have been prepared under the historical cost convention as modified by the revaluation of certain financial assets and liabilities (including derivative financial instruments) at fair value. The 2018 Annual Report refers to new standards that the Group will adopt in future years but that are not yet effective in 2019. The Group does not expect these to have a material impact. The Group's forecasts and projections, taking account of reasonably possible changes in trading performance, seasonal working capital requirements and potential acquisition activity, show that the Group should be able to operate within the level of its current committed borrowing facilities. The directors have confirmed that they have a reasonable expectation that the Group has adequate resources to continue in operational existence. The condensed consolidated financial statements have therefore been prepared on a going concern basis. The preparation of condensed consolidated financial statements requires the use of certain critical accounting assumptions. It also requires management to exercise its judgement in the process of applying the Group’s accounting policies. The areas requiring a higher degree of judgement or complexity, or areas where assumptions and estimates are significant to the condensed consolidated financial statements, have been set out in the 2018 Annual Report. In 2019, both the IFRS 16 transition and the valuation of receivables relating to the sale of the K12 business require the use of assumptions and estimates as set out in notes 1b and 16 respectively to the condensed consolidated financial statements. The financial information for the year ended 31 December 2018 does not constitute statutory accounts as defined in section 434 of the Companies Act 2006. A copy of the statutory accounts for that year has been delivered to the Registrar of Companies. The independent auditors' report on the full financial statements for the year ended 31 December 2018 was unqualified and did not contain an emphasis of matter paragraph or any statement under section 498 of the Companies Act 2006. The condensed consolidated financial statements and related notes for the six months to 30 June 2019 are unaudited but have been reviewed by the auditors and their review opinion is included at the end of these statements.

23
NOTES TO THE CONDENSED CONSOLIDATED FINANCIAL STATEMENTS for the period ended 30 June 2019 1b. Change of accounting policy: IFRS 16 The Group has adopted IFRS 16 ’Leases’ at 1 January 2019 and applied the modified retrospective approach. Comparatives for 2018 have not been restated and the cumulative impact of adoption has been recognised as a decrease to net assets with a corresponding decrease in retained earnings at 1 January 2019 as follows: all figures in £ millions 2019 1 January Non-current assets Property, plant and equipment (right-of-use assets) 435 Investment in joint ventures and associates (8) Deferred income tax assets 4 Trade and other receivables 186 Current assets Trade and other receivables 30 Non-current liabilities Financial liabilities – borrowings (792) Deferred income tax liabilities 13 Provisions for other liabilities and charges 101 Other liabilities 47 Current liabilities Financial liabilities – borrowings (112) Trade and other liabilities 10 Total decrease in retained earnings at 1 January 2019 (86) The Group’s lease portfolio consists of approximately 750 property leases together with a number of vehicle and equipment leases. The lease liability has been measured at the present value of the remaining lease payments, discounted using the incremental borrowing rate at transition. The right-of-use asset has been measured at the carrying amount as if the standard had been applied since the commencement of the lease, discounted using the incremental borrowing rate at transition. Where data was not available to enable this measurement to be made, the right-of-use asset has been measured at an amount equal to the lease liability. On transition the Group elected not to reassess whether a contract is, or contains, a lease, instead relying on the assessment already made applying IAS 17 ‘Leases’ and IFRIC 4 ‘Determining whether and Arrangement contains a Lease’. In addition, the Group applied the available practical expedients as follows:
• Relied on its assessment of whether leases are onerous immediately prior to the date of initial application.
• Applied the short-term leases exemptions to leases with a lease term ending within 12 months at the date of the initial application.
• Excluded the initial direct costs from the measurement of the right-of-use asset at the date of initial application.
• Used hindsight in determining the lease term where the contract contains options to extend or terminate the lease.

24
NOTES TO THE CONDENSED CONSOLIDATED FINANCIAL STATEMENTS for the period ended 30 June 2019 1b. Change of accounting policy: IFRS 16 continued Adoption of the new standard has a material impact on the Group. The lease liability brought onto the balance sheet at transition was £904m with the corresponding right-of-use asset valued at £435m. In addition, certain subleases have been reclassified as finance leases resulting in an additional lease receivable of £216m being brought on balance sheet. The net impact on the balance sheet is a reduction of net assets of £86m after taking into account existing liabilities relating to onerous lease provisions, lease incentives, adjustments to tax and the net impact on associates. There were no leases relating to held for sale assets at 1 January 2019. The impact on the income statement for the full year in 2019 is expected to reduce profit before tax by approximately £5m (increasing both adjusted and statutory operating profit by approximately £25m and increasing net finance costs by approximately £30m). In the first half of 2019, the impact is a reduction in profit before tax of £3m (increasing both adjusted and statutory operating profit by £13m and increasing net finance costs by £16m). The operating lease expense recognised under the previous accounting standards is now replaced by depreciation and net finance costs. The impact on the Group’s share of joint venture and associate profit is not material. There is no overall impact on the Group’s cash and cash equivalents although there is a change to the classification of cash flows in the cash flow statement with lease payments and finance lease receipts previously categorised as net cash used in operations now being split between the principal element (categorised in financing activities for payments and investing activities for receipts) and the interest element (categorised as interest paid in operating activities or interest received in investing activities). In the period to 30 June 2019 there were £49m of lease payments classified as financing cash flows, £11m of lease receipts classified as investing cash flows, £21m of lease interest payments and £5m of lease interest receipts. The Group has also included the lease liability and investment in finance lease as part of its net debt which impacts the calculation of the Group’s non-GAAP measures for operating cash flow and free cash flow (see also note 15 and 17). The lease liabilities at 1 January 2019 can be reconciled to the operating lease commitments at 31 December 2018 as follows: all figures in £ millions 2019 1 January Operating lease commitments disclosed at 31 December 2018 1,175 Discounted using the lessee’s incremental borrowing rate at the date of initial application (267) (Less): commitments relating to short-term leases (7) Add: adjustments relating to the different treatment of extension and termination options 3 Additional lease liability recognised at 1 January 2019 904 Analysed as: Current lease liabilities 112 Non-current lease liabilities 792 In addition to the lease liabilities transitioned above, the Group had £5m of lease liabilities that were accounted for as finance leases at 31 December 2018. The weighted average incremental borrowing rate applied to the lease liabilities on 1 January 2019 was 5.2%.

25
NOTES TO THE CONDENSED CONSOLIDATED FINANCIAL STATEMENTS for the period ended 30 June 2019 1b. Change of accounting policy: IFRS 16 continued From 1 January 2019, the Group’s lease policy is summarised as follows: The Group recognises a right-of-use asset and a lease liability at the lease commencement date. The right-of-use asset is initially measured at cost, comprising the initial amount of the lease liability plus any initial direct costs incurred and an estimate of costs to restore the underlying asset, less any lease incentives received. The right-of-use asset is subsequently depreciated using the straight-line method from the commencement date to the earlier of the end of the useful life of the asset or the end of the lease term. The lease liability is initially measured at the present value of the lease payments that are not paid at the commencement date, discounted using the incremental borrowing rate. The lease liability is measured at amortised cost using the effective interest method. It is remeasured when there is a change in future lease payments arising from a change in an index or a rate or a change in the Group’s assessment of whether it will exercise an extension or termination option. When the lease liability is remeasured, a corresponding adjustment is made to the right-of-use asset. 1c. Change of accounting policy: IFRIC 23 The Group has adopted IFRIC 23 ‘Uncertainty over Income Tax Treatments’ effective 1 January 2019. The interpretation clarifies the application of the recognition and measurement requirements in IAS 12 ‘Income taxes’ where there is uncertainty over income tax treatments. The interpretation provides guidance to determine whether uncertain tax positions should be considered separately or together, and that measurement should be whether the single most likely outcome or the probability weighted sum of a range of outcomes, whichever better predicts the resolution. The reassessment of current tax liabilities resulted in a decrease in liabilities of £5m but does not have a material impact on the income statement.

26
NOTES TO THE CONDENSED CONSOLIDATED FINANCIAL STATEMENTS for the period ended 30 June 2019 2. Segment information The primary segments for management and reporting are geographies (North America, Core and Growth). In addition, the Group separately discloses the results from the Penguin Random House associate (PRH). all figures in £ millions 2019 2018 2018 half year half year full year Sales by geography North America 1,209 1,223 2,784 Core 403 383 806 Growth 217 259 539 Total sales 1,829 1,865 4,129 Adjusted operating profit by geography North America 79 64 362 Core 31 10 57 Growth 9 11 59 PRH 25 22 68 Total adjusted operating profit 144 107 546 There were no material inter-segment sales. The Group derived revenue from the transfer of goods and services over time and at a point in time in the following major product lines: all figures in £ millions North Core Growth Total America
2019 half year Courseware Products transferred at a point in time (sale or return) 133 110 76 319 Products transferred at a point in time (other) - - 16 16 Products and services transferred over time 335 9 21 365 468 119 113 700 Assessments Products transferred at a point in time 53 22 2 77 Products and services transferred over time 400 240 44 684 453 262 46 761 Services Products transferred at a point in time - 11 - 11 Products and services transferred over time 288 11 58 357 288 22 58 368 Total sales 1,209 403 217 1,829

27
NOTES TO THE CONDENSED CONSOLIDATED FINANCIAL STATEMENTS for the period ended 30 June 2019 2. Segment information continued
all figures in £ millions North Core Growth Total America
2018 half year Courseware Products transferred at a point in time (sale or return) 276 81 105 462 Products transferred at a point in time (other) - - 15 15 Products and services transferred over time 265 25 8 298 541 106 128 775 Assessments* Products transferred at a point in time 49 26 - 75 Products and services transferred over time 376 228 29 633 425 254 29 708 Services Products transferred at a point in time - 13 13 26 Products and services transferred over time 257 10 89 356 257 23 102 382 Total sales 1,223 383 259 1,865
2018 full year Courseware Products transferred at a point in time (sale or return) 718 313 197 1,228 Products transferred at a point in time (other) - - 35 35 Products and services transferred over time 718 4 54 776 1,436 317 286 2,039 Assessments* Products transferred at a point in time 106 52 - 158 Products and services transferred over time 710 390 87 1,187 816 442 87 1,345 Services Products transferred at a point in time - 26 38 64 Products and services transferred over time 532 21 128 681 532 47 166 745 Total sales 2,784 806 539 4,129 * The analysis of Assessment revenues for 2018 has been re-presented to better reflect the nature of sales. Adjusted operating profit is one of the Group’s key business performance measures. The measure includes the operating profit from the total business including the results of discontinued operations when relevant and excludes intangible charges for amortisation and impairment, acquisition related costs, gains and losses arising from acquisitions and disposals and the cost of major restructuring. In 2018, the Group also excluded the impact of adjustments arising from clarification of guaranteed minimum pension (GMP) equalisation legislation in the UK. In May 2017, the Group announced a restructuring programme, to run between 2017 and 2019, to drive further significant cost savings. This programme began in the second half of 2017 and costs incurred to date relate to delivery of cost efficiencies in the US higher education courseware business and enabling functions together with further rationalisation of the property and supplier portfolio. The restructuring costs in the first half of 2019 of £64m and in the first half of 2018 of £24m mainly relate to staff redundancies.

28
NOTES TO THE CONDENSED CONSOLIDATED FINANCIAL STATEMENTS for the period ended 30 June 2019 2. Segment information continued
Charges relating to acquired intangibles, acquisition costs and movements in contingent acquisition and disposal consideration are also excluded from adjusted operating profit when relevant as these items reflect past acquisition activity and do not necessarily reflect the current year performance of the Group. Intangible amortisation charges to the end of June 2019 were £49m compared to a charge of £57m in the equivalent period in 2018. Other net gains of £6m in 2019 relate to the sale of the K12 school courseware business in the US. Other net gains of £230m in 2018, most of which occurred in the first half, relate to the sale of the Wall Street English language teaching business (£207m) and the disposal of our associate interest in UTEL, the online University partnership in Mexico (£19m), together with other small net gains totalling £4m. The GMP equalisation charge in 2018 arose from the ruling in the Lloyds Bank High Court case in October 2018 that provided clarity on how pension plans should equalise GMP between males and females. The case ruling resulted in an income statement charge, an additional liability and the potential requirement to make back payments to pensioners who may have been retired for some years. The Group excluded this charge from adjusted operating profit as it related to historic circumstances. The following table reconciles adjusted operating profit to operating profit for each of our primary segments.
all figures in £ millions North
America Core Growth PRH Total
2019 half year
Adjusted operating profit 79 31 9 25 144 Cost of major restructuring (52) (7) (4) (1) (64) Intangible charges (31) (3) (9) (6) (49) Other net gains and losses 6 - - - 6 UK pension GMP equalisation - - - - - Operating profit 2 21 (4) 18 37
2018 half year Adjusted operating profit 64 10 11 22 107 Cost of major restructuring (18) (4) (2) - (24) Intangible charges (35) (4) (11) (7) (57) Other net gains and losses 4 - 203 - 207 UK pension GMP equalisation - - - - - Operating profit 15 2 201 15 233
2018 full year Adjusted operating profit 362 57 59 68 546 Cost of major restructuring (78) (16) - (8) (102) Intangible charges (72) (8) (19) (14) (113) Other net gains and losses 4 - 226 - 230 UK pension GMP equalisation - (8) - - (8) Operating profit 216 25 266 46 553 Corporate costs are allocated to business segments on an appropriate basis depending on the nature of the cost and therefore the total segment result is equal to the Group operating profit.

29
NOTES TO THE CONDENSED CONSOLIDATED FINANCIAL STATEMENTS for the period ended 30 June 2019 3. Net finance costs all figures in £ millions 2019 2018 2018 half year half year full year Net interest payable (18) (26) (24) Net finance income in respect of retirement benefits 7 5 11 Finance costs associated with transactions - (1) (1) Net foreign exchange losses (3) (13) (36) Derivatives in a hedge relationship - - (4) Derivatives not in a hedge relationship (10) 4 (1) Net finance costs (24) (31) (55) Analysed as: Finance costs (46) (63) (91) Finance income 22 32 36 Net finance costs (24) (31) (55) Analysed as: Net interest payable reflected in adjusted earnings (18) (26) (24) Other net finance costs (6) (5) (31) Net finance costs (24) (31) (55) Net interest payable is the finance cost measure used in calculating adjusted earnings. Net finance costs classified as other net finance costs are excluded in the calculation of the Group’s adjusted earnings. Net finance income relating to retirement benefits is excluded as it is considered that the presentation does not reflect the economic substance of the underlying assets and liabilities. The Group excludes finance costs relating to acquisition and disposal transactions as these relate to future earn-outs or acquisition expenses and are not part of the underlying financing. Foreign exchange and other gains and losses are also excluded as they represent short-term fluctuations in market value and are subject to significant volatility. Other gains and losses may not be realised in due course as it is normally the intention to hold the related instruments to maturity. In 2019 and 2018, the foreign exchange gains and losses largely relate to foreign exchange differences on unhedged US dollar and Euro loans, cash and cash equivalents.

30
NOTES TO THE CONDENSED CONSOLIDATED FINANCIAL STATEMENTS for the period ended 30 June 2019 4. Profit before tax all figures in £ millions note 2019 2018 2018 half year half year full year
Profit before tax 13 202 498 Cost of major restructuring 2 64 24 102 Other net gains and losses 2 (6) (207) (230) Intangible charges 2 49 57 113 Other net finance costs 3 6 5 31 UK pension GMP equalisation 2 - - 8 Adjusted profit before tax 126 81 522 5. Income tax
all figures in £ millions 2019 2018 2018 half year half year full year
Income tax benefit / (charge) 35 (13) 92 Tax benefit on cost of major restructuring (13) (6) (37) Tax (benefit) / charge on other net gains and losses (37) 15 (31) Tax benefit on intangible charges (12) (14) (18) Tax benefit on other net finance costs (1) (1) (6) Tax benefit on UK pension GMP equalisation - - (2) Tax amortisation benefit on goodwill and intangibles 5 3 29 Adjusted income tax (charge) / benefit (23) (16) 27 Tax rate reflected in statutory earnings (269.2)% 6.4% (18.5)% Tax rate reflected in adjusted earnings 18.0% 20.0% (5.2)% The adjusted income tax charge excludes the tax benefit or charge on items that are excluded from the profit or loss before tax (see note 4). The tax benefit from tax deductible goodwill and intangibles is added to the adjusted income tax charge as this benefit more accurately aligns the adjusted tax charge with the expected rate of cash tax payments.
31
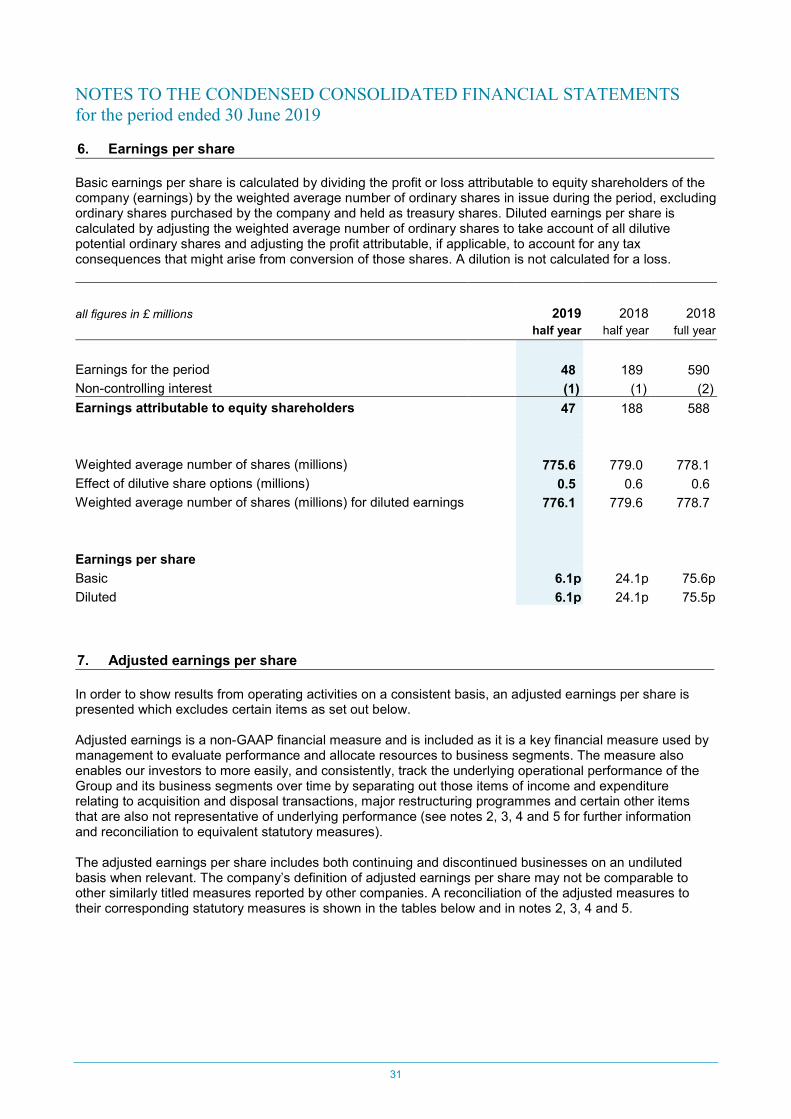
NOTES TO THE CONDENSED CONSOLIDATED FINANCIAL STATEMENTS for the period ended 30 June 2019 6. Earnings per share Basic earnings per share is calculated by dividing the profit or loss attributable to equity shareholders of the company (earnings) by the weighted average number of ordinary shares in issue during the period, excluding ordinary shares purchased by the company and held as treasury shares. Diluted earnings per share is calculated by adjusting the weighted average number of ordinary shares to take account of all dilutive potential ordinary shares and adjusting the profit attributable, if applicable, to account for any tax consequences that might arise from conversion of those shares. A dilution is not calculated for a loss.
all figures in £ millions 2019 2018 2018
half year half year full year
Earnings for the period 48 189 590 Non-controlling interest (1) (1) (2) Earnings attributable to equity shareholders 47 188 588 Weighted average number of shares (millions) 775.6 779.0 778.1 Effect of dilutive share options (millions) 0.5 0.6 0.6 Weighted average number of shares (millions) for diluted earnings 776.1 779.6 778.7 Earnings per share Basic 6.1p 24.1p 75.6p Diluted 6.1p 24.1p 75.5p 7. Adjusted earnings per share In order to show results from operating activities on a consistent basis, an adjusted earnings per share is presented which excludes certain items as set out below. Adjusted earnings is a non-GAAP financial measure and is included as it is a key financial measure used by management to evaluate performance and allocate resources to business segments. The measure also enables our investors to more easily, and consistently, track the underlying operational performance of the Group and its business segments over time by separating out those items of income and expenditure relating to acquisition and disposal transactions, major restructuring programmes and certain other items that are also not representative of underlying performance (see notes 2, 3, 4 and 5 for further information and reconciliation to equivalent statutory measures). The adjusted earnings per share includes both continuing and discontinued businesses on an undiluted basis when relevant. The company’s definition of adjusted earnings per share may not be comparable to other similarly titled measures reported by other companies. A reconciliation of the adjusted measures to their corresponding statutory measures is shown in the tables below and in notes 2, 3, 4 and 5.

32
NOTES TO THE CONDENSED CONSOLIDATED FINANCIAL STATEMENTS for the period ended 30 June 2019 7. Adjusted earnings per share continued
all figures in £ millions note
Statutory income statem
ent
Cost of m
ajor restructuring
Other net gains and losses
Intangible charges
Other net finance costs
Impact of G
MP equalisation
Tax amortisation benefit
Adjusted income statem
ent
2019 half year
Operating profit 2 37 64 (6) 49 - - - 144
Net finance costs 3 (24) - - - 6 - - (18)
Profit before tax 4 13 64 (6) 49 6 - - 126
Income tax 5 35 (13) (37) (12) (1) - 5 (23)
Profit for the period 48 51 (43) 37 5 - 5 103
Non-controlling interest (1) - - - - - - (1)
Earnings 47 51 (43) 37 5 - 5 102
Weighted average number of shares (millions) 775.6
Weighted average number of shares (millions) for diluted earnings 776.1
Adjusted earnings per share (basic) 13.2p
Adjusted earnings per share (diluted) 13.1p

33
NOTES TO THE CONDENSED CONSOLIDATED FINANCIAL STATEMENTS for the period ended 30 June 2019 7. Adjusted earnings per share continued
all figures in £ millions note
Statutory income statem
ent
Cost of m
ajor restructuring
Other net gains and losses
Intangible charges
Other net finance costs
Impact of G
MP equalisation
Tax amortisation benefit
Adjusted income statem
ent
2018 half year
Operating profit 2 233 24 (207) 57 - - - 107
Net finance costs 3 (31) - - - 5 - - (26)
Profit before tax 4 202 24 (207) 57 5 - - 81
Income tax 5 (13) (6) 15 (14) (1) - 3 (16)
Profit for the period 189 18 (192) 43 4 - 3 65
Non-controlling interest (1) - - - - - - (1)
Earnings 188 18 (192) 43 4 - 3 64
Weighted average number of shares (millions) 779.0
Weighted average number of shares (millions) for diluted earnings 779.6
Adjusted earnings per share (basic) 8.2p
Adjusted earnings per share (diluted) 8.2p

34
NOTES TO THE CONDENSED CONSOLIDATED FINANCIAL STATEMENTS for the period ended 30 June 2019 7. Adjusted earnings per share continued
all figures in £ millions note
Statutory income statem
ent
Cost of m
ajor restructuring
Other net gains and losses
Intangible charges
Other net finance costs
Impact of G
MP equalisation
Tax amortisation benefit
Adjusted income statem
ent
2018 full year
Operating profit 2 553 102 (230) 113 - 8 - 546
Net finance costs 3 (55) - - - 31 - - (24)
Profit before tax 4 498 102 (230) 113 31 8 - 522
Income tax 5 92 (37) (31) (18) (6) (2) 29 27
Profit for the period 590 65 (261) 95 25 6 29 549
Non-controlling interest (2) - - - - - - (2)
Earnings 588 65 (261) 95 25 6 29 547
Weighted average number of shares (millions) 778.1
Weighted average number of shares (millions) for diluted earnings 778.7
Adjusted earnings per share (basic) 70.3p
Adjusted earnings per share (diluted) 70.2p

35
NOTES TO THE CONDENSED CONSOLIDATED FINANCIAL STATEMENTS for the period ended 30 June 2019 8. Dividends
all figures in £ millions 2019 2018 2018
half year half year full year
Amounts recognised as distributions to equity shareholders in the period
101 93 136
The directors are proposing an interim dividend of 6.0p per equity share, payable on 13 September 2019 to shareholders on the register at the close of business on 16 August 2019. This interim dividend, which will absorb an estimated £47m of shareholders’ funds, has not been included as a liability at 30 June 2019. 9. Exchange rates Pearson earns a significant proportion of its sales and profits in overseas currencies, the most important being the US dollar. The relevant rates are as follows:
2019 2018 2018
half year half year full year
Average rate for profits 1.29 1.38 1.34 Period end rate 1.27 1.32 1.27

36
NOTES TO THE CONDENSED CONSOLIDATED FINANCIAL STATEMENTS for the period ended 30 June 2019 10. Assets and liabilities classified as held for sale Held for sale assets and liabilities in 2018 relate to the K12 school courseware business in the US (K12) prior to their disposal in 2019. The held for sale balances are analysed as follows:
all figures in £ millions 2019 2018 2018
half year half year full year
Intangible assets - 72 168 Deferred income tax assets - 86 98 Trade and other receivables - 33 25 Non-current assets - 191 291 Intangible assets – pre-publication - 239 242 Inventories - 58 55 Trade and other receivables - 119 60 Current assets - 416 357 Total assets - 607 648 Other liabilities - (335) (371) Non-current liabilities - (335) (371) Trade and other liabilities - (183) (202) Current liabilities - (183) (202) Total liabilities - (518) (573) Net assets - 89 75 Goodwill is allocated to the held for sale businesses on a relative fair value basis where these businesses form part of a larger cash generating unit (CGU). The goodwill allocated to the K12 business was reassessed at 31 December 2018 and at the date of disposal.

37
NOTES TO THE CONDENSED CONSOLIDATED FINANCIAL STATEMENTS for the period ended 30 June 2019 11. Non-current intangible assets
all figures in £ millions 2019 2018 2018
half year half year full year
Goodwill 2,189 2,156 2,111 Other intangibles 873 911 898 Non-current intangible assets 3,062 3,067 3,009 There were no impairments to goodwill or other intangibles in either 2019 or 2018. 12. Trade and other liabilities
all figures in £ millions 2019 2018 2018
half year half year full year
Trade payables (234) (205) (311) Sales return liability (90) (122) (173) Accruals (356) (375) (397) Deferred income (398) (304) (387) Other liabilities (265) (284) (287) Trade and other liabilities (1,343) (1,290) (1,555)
Analysed as: Trade and other liabilities – current (1,209) (1,173) (1,400) Other liabilities – non-current (134) (117) (155) Total trade and other liabilities (1,343) (1,290) (1,555) The deferred income balance comprises contract liabilities in respect of advance payments in assessment, testing and training businesses; subscription income in school and college businesses; and obligations to deliver digital content in future periods.
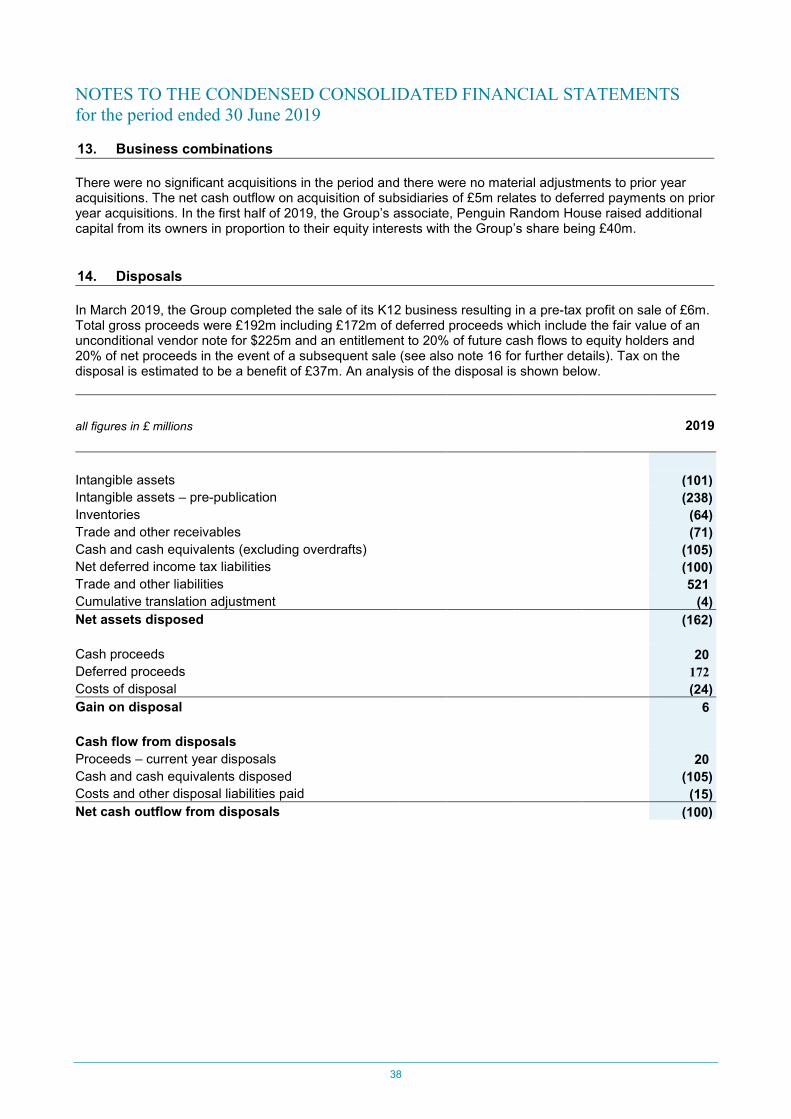
38
NOTES TO THE CONDENSED CONSOLIDATED FINANCIAL STATEMENTS for the period ended 30 June 2019 13. Business combinations There were no significant acquisitions in the period and there were no material adjustments to prior year acquisitions. The net cash outflow on acquisition of subsidiaries of £5m relates to deferred payments on prior year acquisitions. In the first half of 2019, the Group’s associate, Penguin Random House raised additional capital from its owners in proportion to their equity interests with the Group’s share being £40m. 14. Disposals In March 2019, the Group completed the sale of its K12 business resulting in a pre-tax profit on sale of £6m. Total gross proceeds were £192m including £172m of deferred proceeds which include the fair value of an unconditional vendor note for $225m and an entitlement to 20% of future cash flows to equity holders and 20% of net proceeds in the event of a subsequent sale (see also note 16 for further details). Tax on the disposal is estimated to be a benefit of £37m. An analysis of the disposal is shown below.
all figures in £ millions 2019
Intangible assets (101) Intangible assets – pre-publication (238) Inventories (64) Trade and other receivables (71) Cash and cash equivalents (excluding overdrafts) (105) Net deferred income tax liabilities (100) Trade and other liabilities 521 Cumulative translation adjustment (4) Net assets disposed (162) Cash proceeds 20 Deferred proceeds 172 Costs of disposal (24) Gain on disposal 6 Cash flow from disposals Proceeds – current year disposals 20 Cash and cash equivalents disposed (105) Costs and other disposal liabilities paid (15) Net cash outflow from disposals (100)

39
NOTES TO THE CONDENSED CONSOLIDATED FINANCIAL STATEMENTS for the period ended 30 June 2019 15. Net debt
all figures in £ millions note 2019 2018 2018
half year half year full year
Non-current assets Derivative financial instruments 59 72 67 Trade and other receivables – investment in finance lease 184 - - Current assets Derivative financial instruments 2 - 1 Trade and other receivables – investment in finance lease 30 - - Cash and cash equivalents (excluding overdrafts) 417 330 568 Non-current liabilities Borrowings (1,869) (1,069) (674) Derivative financial instruments (46) (58) (36) Current liabilities Borrowings (141) (33) (46) Derivative financial instruments (12) (17) (23) Net debt (1,376) (775) (143) Included within borrowings at 30 June 2019 is £862m (non-current £736m, current £126m) relating to lease liabilities that were brought on balance sheet at 1 January 2019 following the transition to IFRS 16. Also, under IFRS 16, the Group has recognised investments in finance leases in relation to some of its sub-let properties as separately disclosed above (see also note 1b). After excluding lease liabilities (including those previously recognised as finance leases) and the investment in finance leases, the Group’s net debt was £726m. In March 2019, the Group executed market tenders to repurchase €55m of its €500m 1.875% notes due 2021 of which €250m were outstanding at 31 December 2018. In addition, the Group also announced the refinancing of its bank facility, reducing its size to $1.19bn and extending its maturity date to February 2024.

40
NOTES TO THE CONDENSED CONSOLIDATED FINANCIAL STATEMENTS for the period ended 30 June 2019 16. Classification of assets and liabilities measured at fair value Level 2 ---Level 3--- Total fair value
all figures in £ millions D
erivatives
FVOC
I investm
ents
FVTPL - Other
receivables
2019 half year Investments in unlisted securities - 118 - 118 Other receivables - - 181 181 Derivative financial instruments 61 - - 61 Total financial assets held at fair value 61 118 181 360 Derivative financial instruments (58) - - (58) Total financial liabilities held at fair value (58) - - (58)
2018 half year Investments in unlisted securities - 86 - 86 Other receivables - - - - Derivative financial instruments 72 - - 72 Total financial assets held at fair value 72 86 - 158 Derivative financial instruments (75) - - (75) Total financial liabilities held at fair value (75) - - (75)
2018 full year Investments in unlisted securities - 93 - 93 Other receivables - - - - Derivative financial instruments 68 - - 68 Total financial assets held at fair value 68 93 - 161 Derivative financial instruments (59) - - (59) Total financial liabilities held at fair value (59) - - (59) FVTPL - Other receivables relate to amounts due following the sale of the K12 business comprising an unconditional vendor note for $225m (repayable after 7 years or earlier based on the performance of the K12 business) and an entitlement to 20% of future cash flows to equity holders and 20% of net proceeds in the event of a subsequent sale within the next 15 years.

41
NOTES TO THE CONDENSED CONSOLIDATED FINANCIAL STATEMENTS for the period ended 30 June 2019 16. Classification of assets and liabilities measured at fair value continued The fair values of level 2 assets and liabilities are determined by reference to market data and established estimation techniques such as discounted cash flow and option valuation models. Within level 3 assets and liabilities, the fair value of FVOCI investments is determined by reference to the financial performance of the underlying asset and amounts realised on the sale of similar assets, while the fair value of other liabilities represents the present value of the estimated future liability. The fair value of FVTPL - Other receivables is determined using present value techniques whereby the expected value of future cash flows is discounted using a rate which is representative of the creditworthiness of the K12 business. The key inputs used in the present value calculations are forecast sales, discount rate and the expected date of a subsequent sale of the K12 business. If the forecast sales used in the calculations were increased / decreased by 5%, the value of the receivable would increase / decrease by £23m. If the discount rate used in the calculations was increased / decreased by 1%, the value of the receivable would decrease / increase by £5m. The calculations are not materially sensitive to reasonable changes in the expected date of a subsequent sale of the K12 business. There have been no transfers in classification during the year. The market value of the Group’s bonds is £627m (2018 half year: £656m, 2018 full year: £661m) compared to their carrying value of £623m (2018 half year: £655m, 2018 full year: £672m). For all other financial assets and liabilities, fair value is not materially different to carrying value. Movements in fair values of level 3 assets and liabilities for investments in unlisted securities are shown in the table below:
all figures in £ millions 2019 2018 2018
half year half year full year
Investments in unlisted securities At beginning of year 93 77 77 Exchange differences - OCI - 2 3 Additions 7 5 13 Fair value movements - OCI 18 2 8 Disposals - - (8) At end of period 118 86 93 Since inception, the only movements in FVTPL – Other receivables relate to foreign exchange movements which arise on consolidation.

42
NOTES TO THE CONDENSED CONSOLIDATED FINANCIAL STATEMENTS for the period ended 30 June 2019 17. Cash flows
all figures in £ millions 2019 2018 2018
half year half year full year
Reconciliation of profit for the period to net cash used in / generated from operations Profit for the period 48 189 590 Income tax (35) 13 (92) Depreciation, amortisation and impairment charges 158 123 253 Net profit on disposal of businesses (6) (207) (230) Charges relating to GMP equalisation - - 8 Net loss / (profit) on disposal of fixed assets 2 6 (85) Disposal of right of use assets held under leases (12) - - Net finance costs 24 31 55 Share of results of joint ventures and associates (18) (15) (44) Net foreign exchange adjustment 4 8 28 Share-based payment costs 14 19 37 Pre-publication (24) (13) (37) Inventories (58) (19) (10) Trade and other receivables 1 (16) (15) Trade and other liabilities (227) (241) 35 Retirement benefit obligations 2 (4) (9) Provisions for other liabilities and charges 10 (5) 63 Net cash (used in) / generated from operations (117) (131) 547

43
NOTES TO THE CONDENSED CONSOLIDATED FINANCIAL STATEMENTS for the period ended 30 June 2019 17. Cash flows continued
all figures in £ millions note 2019 2018 2018
half year half year full year
Reconciliation of net cash used in / generated from operations to closing net debt Net cash (used in) / generated from operations (117) (131) 547 Dividends from joint ventures and associates 15 66 117 Less: re-capitalisation dividends from PRH - (51) (50) Purchase of PPE (38) (33) (74) Acquisition of new right-of-use lease assets (6) - - Proceeds from sale of PPE - - 128 Disposal of right-of-use lease assets 14 - - Purchase of intangible assets (57) (80) (130) Add back: net costs paid for / (proceeds from) major restructuring 60 27 (25) Operating cash flow (129) (202) 513 Operating tax paid (8) (8) (43) Net operating finance costs paid (31) (18) (22) Operating free cash flow (168) (228) 448 Net (cost paid for) / proceeds from major restructuring (60) (27) 25 Free cash flow (228) (255) 473 Dividends paid (including to non-controlling interest) (101) (93) (137) Net movement of funds from operations (329) (348) 336 Acquisitions and disposals (150) 94 92 Re-capitalisation dividends from PRH - 51 50 Loans (advanced) / repaid (10) 46 46 New equity 3 3 6 Buyback of equity - (153) (153) Purchase of treasury shares (40) - - Other movements on financial instruments (10) 1 (6) Net movement of funds (536) (306) 371 Exchange movements on net debt (9) (37) (82) Movement in net debt (545) (343) 289 Opening net debt (143) (432) (432) Adjustment on initial application of IFRS 16 (688) - - Closing net debt 15 (1,376) (775) (143) Operating cash flow and free cash flow are non-GAAP measures and have been disclosed as they are part of the Group’s corporate and operating measures. These measures are presented in order to align the cash flows with corresponding adjusted profit measures. Following transition to IFRS 16, the Group has included the new lease liabilities and investment in finance lease as part of its net debt. As a result, the Group’s operating cash flow (and free cash flow) now includes the acquisition and modification of new right-of-use lease assets and the disposal of right-of-use lease assets as these transactions result in a movement in overall net debt (see also note 1b). Re-capitalisation dividends from PRH in 2018 were part of the transaction that included the sale of 22% of our equity interest in the venture in 2017.

44
NOTES TO THE CONDENSED CONSOLIDATED FINANCIAL STATEMENTS for the period ended 30 June 2019 18. Contingencies There are contingent Group liabilities that arise in the normal course of business in respect of indemnities, warranties and guarantees in relation to former subsidiaries and in respect of guarantees in relation to subsidiaries, joint ventures and associates. In addition, there are contingent liabilities of the Group in respect of unsettled or disputed tax liabilities, legal claims, contract disputes, royalties, copyright fees, permissions and other rights. None of these claims are expected to result in a material gain or loss to the Group. On 25 April 2019, the European Commission published the full decision that the United Kingdom controlled foreign company group financing partial exemption (“FCPE”) partially constitutes State Aid. The Group has lodged an appeal. The Group has benefited from the FCPE in 2018 and prior years by approximately £116m. At present, the Group believes no provision is required in respect of this issue. In the first half of 2019 the Group received an assessment from the Brazilian tax authorities challenging the deduction for tax purposes of goodwill amortisation for the years 2013 to 2015. Similar assessments may be raised for other years. Potential total exposure could be up to £122 million up to 30 June 2019. Such assessments are common in Brazil. The Group believes that the likelihood that the tax authorities will ultimately prevail is low, and that our position is strong. At present the Group believes no provision is required. 19. Related parties At 30 June 2019, the Group had loans to Penguin Random House (PRH) of £10m (2018 half year: £nil, 2018 full year: £nil) which were unsecured with interest calculated based on market rates. The loans are provided under a working capital facility and fluctuate during the year. At 30 June 2019, the Group also had a current asset receivable from PRH of £9m (2018 half year: £13m, 2018 full year: £17m) mainly arising from PRH’s management of accounts receivable balances on Pearson’s behalf. Service fee income from PRH was £1m in the first half of 2019 (2018 half year: £1m, 2018 full year: £3m). During the period, the Group received dividends of £15m (2018 half year: £66m, 2018 full year: £117m) from PRH. In 2018, dividends from PRH included amounts relating to the re-capitalisation of the venture following the Group’s disposal of part of its share in 2017. Apart from transactions with the Group’s associates and joint ventures noted above, there were no other material related party transactions and no guarantees have been provided to related parties in the period. 20. Events after the balance sheet date There were no significant post balance sheet events.

45
STATEMENT OF DIRECTORS’ RESPONSIBILITIES The directors confirm that these condensed consolidated financial statements have been prepared in accordance with International Accounting Standard 34, ‘Interim Financial Reporting’, as adopted by the European Union and that the interim management report includes a fair review of the information required by DTR 4.2.7 and DTR 4.2.8 namely:
• An indication of important events that have occurred during the first six months and their impact on the condensed consolidated financial statements, and a description of the principal risks and uncertainties for the remaining six months of the financial year; and
• Material related party transactions in the first six months and any material changes in related party transactions described in the 2018 Annual Report.
The directors of Pearson plc are listed in the 2018 Annual Report. There have been the following changes to the Board since the publication of the Annual Report. Sherry Coutu – appointed 1 May 2019 Graeme Pitkethly – appointed 1 May 2019 A list of current directors is maintained on the Pearson plc website: www.pearson.com. By order of the Board John Fallon Chief Executive 25 July 2019 Coram Williams Chief Financial Officer 25 July 2019

46
INDEPENDENT REVIEW REPORT TO PEARSON PLC Report on the condensed consolidated financial statements Our conclusion We have reviewed Pearson plc’s condensed consolidated financial statements (the ‘interim financial statements’) in the Interim Financial Report of Pearson plc for the six month period ended 30 June 2019. Based on our review, nothing has come to our attention that causes us to believe that the interim financial statements are not prepared, in all material respects, in accordance with International Accounting Standard 34 ‘Interim Financial Reporting’ as adopted by the European Union and the Disclosure Guidance and Transparency Rules sourcebook of the United Kingdom’s Financial Conduct Authority. What we have reviewed The interim financial statements comprise:
• the condensed consolidated balance sheet at 30 June 2019;
• the condensed consolidated income statement and condensed consolidated statement of comprehensive income for the period then ended;
• the condensed consolidated cash flow statement for the period then ended;
• the condensed consolidated statement of changes in equity for the period then ended; and
• the explanatory notes to the condensed consolidated financial statements.
The interim financial statements included in the Interim Financial Report have been prepared in accordance with International Accounting Standard 34 ‘Interim Financial Reporting’ as adopted by the European Union and the Disclosure Guidance and Transparency Rules sourcebook of the United Kingdom’s Financial Conduct Authority. As disclosed in note 1a to the interim financial statements, the financial reporting framework that has been applied in the preparation of the full annual financial statements of the Group is applicable law and International Financial Reporting Standards (IFRSs) as adopted by the European Union. Responsibilities for the interim financial statements and the review Our responsibilities and those of the directors The Interim Financial Report, including the interim financial statements, is the responsibility of, and has been approved by, the directors. The directors are responsible for preparing the Interim Financial Report in accordance with the Disclosure Guidance and Transparency Rules sourcebook of the United Kingdom’s Financial Conduct Authority. Our responsibility is to express a conclusion on the interim financial statements in the Interim Financial Report based on our review. This report, including the conclusion, has been prepared for and only for the company for the purpose of complying with the Disclosure Guidance and Transparency Rules sourcebook of the United Kingdom’s Financial Conduct Authority and for no other purpose. We do not, in giving this conclusion, accept or assume responsibility for any other purpose or to any other person to whom this report is shown or into whose hands it may come save where expressly agreed by our prior consent in writing.

47
INDEPENDENT REVIEW REPORT TO PEARSON PLC continued What a review of condensed consolidated financial statements involves We conducted our review in accordance with International Standard on Review Engagements (UK and Ireland) 2410 ‘Review of Interim Financial Information Performed by the Independent Auditor of the Entity’ issued by the Auditing Practices Board for use in the United Kingdom. A review of interim financial information consists of making enquiries, primarily of persons responsible for financial and accounting matters, and applying analytical and other review procedures. A review is substantially less in scope than an audit conducted in accordance with International Standards on Auditing (UK) and, consequently, does not enable us to obtain assurance that we would become aware of all significant matters that might be identified in an audit. Accordingly, we do not express an audit opinion. We have read the other information contained in the Interim Financial Report and considered whether it contains any apparent misstatements or material inconsistencies with the information in the interim financial statements. PricewaterhouseCoopers LLP
Chartered Accountants
London
25 July 2019