interim report the half year ended - boku.com · mix effect of lower average take rates being...
TRANSCRIPT

Interim Report and Accounts for the half year ended 30 June 2018Boku, Inc.
Stock code: BOKU

Boku is the world’s largest independent Carrier Commerce company.Boku technology connects more than 160 carriers in more than 50 countries. It is capable of processing more than 600 transactions per second. We support payment, bundling and identity solutions. Merchants like Apple, Sony, Spotify, Google, Microsoft, Netflix and Facebook rely on Boku to recruit and retain the right users. With more than 5 billion mobile phones in the world, Boku can reach more customers than Facebook or Visa.
Customers
We maintain a corporate website containing a wide range of information of interest to investors and stakeholders: www.boku.com
Boku Inc Interim Report and Accounts for the half year ended 30 June 2018 www.boku.com01

Highlights Contents
CEO Report 03
CFO Report 05
Financial InformationConsolidated Statement of Comprehensive Income 08
Consolidated Statement of Financial Position 09
Consolidated Condensed Statement of Cash Flows 10
Notes to the Consolidated Financial Information 11
Financial Highlights
• Revenues increased 66% to $16.9 million (H1 2017: $10.2 million)
• Positive Adjusted EBITDA* for the Period of $2.5 million (compared with $2.8 million loss in H1 2017)
Operational Highlights
• Total Payment Volume (“TPV”) grew 153% reaching $1.5 billion (H1 2017: $0.6 billion)
• Increase in Monthly Active Users (“MAUs”) to 10.3 million, an increase of 117% vs H1 2017. TPV to August 2018 reached $2.2 billion while MAU reached 11.3 million.
• Boku Account connections, for major customers such as Apple, Microsoft and Spotify, now total 127
Boku Inc Interim Report and Accounts for the half year ended 30 June 2018 www.boku.com02

Chief Executive Officer’s Report
Jon Prideaux
StrategyThere are more than five billion mobile phones in the world, making up potentially the world’s largest community. Whilst it’s easy to make a call or send a text to any mobile anywhere, accessing other operator facilities has been nigh on impossible; billing and identity capabilities sit fragmented behind any number of unstandardised network operator back office systems. Boku took on the challenge of providing a simple interface to these systems. We assembled the largest team of engineers working on connecting mobile network operators and have delivered a high quality, super high capacity (now more than 600 transactions / second) network reaching most of the big ones. Together with our merchants we have started to unlock this network’s potential.
If we’ve had any success at Boku it is because we’ve really listened to our customers. I mean really listened. Superficially the function that we perform is that of moving money, but, dig beneath the surface and you can see that the real job that our merchants hire us to do is to help them recruit and retain the right users.
This is a big problem for merchants. Reportedly, it costs Netflix $40-$45 to acquire a new user outside the US. Boku’s super simple one-tap-to-register technology helps our merchants to maximise the number of paying users they yield for any given marketing spend by removing attrition during the enrolment process.
Acquiring and retaining more high-quality users is what drives our product development efforts. In our Mobile Billing business, we’re building new products that not only reduce Customer Acquisition Costs (“CAC”), but also increase Life Time Value (“LTV”), for our merchants. With our scale, we can see which strategies work and which don’t and use it to increase the average spend per user for our merchants. It’s the same in our Mobile Identity business: there’s no benefit to acquiring new users if they’re free riders looking to abuse an introductory offer or commit fraud. Whereas our Mobile Billing offering works best with digital content (and is used by the world’s largest digital companies such as Apple, Google, Facebook, Microsoft, Netflix, Sony and Spotify), the Mobile Identity offering can address an even wider customer set, including merchants where payment uses more conventional means such as cards or bank transfers.
Highlights from H1 2018By any measure the first half of 2018 has been a successful one for Boku. TPV is up 153% to $1.5 billion and the number of MAUs on our platform is up by 117% on a year earlier at 10.3 million. This has driven improved business results with revenues up 66%. Impressively, this growth has been achieved with the cost of regular operations staying stable and the only cost increases coming from new investment in growth areas, especially Mobile Identity. For the first time we can report positive Adjusted EBITDA of $2.5m.
These significant volumes and strong growth have allowed us to cement our position as the scale player in our industry. Scale allows us to invest in our platform whilst still having the lowest unit cost. We see high function and low cost as a killer combination.
Boku Inc Interim Report and Accounts for the half year ended 30 June 2018 www.boku.com03

Chief Executive’s Statement
Current trading and outlookWe’re delighted with the growth we’ve achieved: there is real momentum in our business, as investments from previous years continue to feed through. Having really pushed on in the second half of last year the momentum has been maintained in the first half of 2018. Current trading to the end of August 2018 is also encouraging with TPV reaching $2.2 billion (+140% vs August 2017) and MAU increasing to 11.3 million (+105% vs August 2017). Tougher comparables and the law of large numbers will inevitably mean that some of the percentage growth figures will attenuate somewhat, but the momentum behind our business is strong and sustained. We expect to meet recently upgraded full year market expectations.
Jon PrideauxChief Executive Officer 03 September 2018
“We see high function and low
cost as a killer combination.”
Boku Inc Interim Report and Accounts for the half year ended 30 June 2018 www.boku.com04

Chief Financial Officer’s Report
Our first set of interim financials demonstrate continued growth in leading metrics which are reflected in improved profitability.
It’s my pleasure to report the following unaudited financials for the first half of 2018 beginning with some highlights:
Positive Adjusted EBITDA* for the Period of $2.5 million
(compared with $2.8 million loss in H1 2017)
Closing cash balances of $30.7 million** as at 30 June 2018, while average daily cash balances grew to $23.1 million from $19.2
million in 31 December 2017
Revenues increased 66% to $16.9 million (2017: $10.2 million) Total debt remained low at $2.2 million
Gross Profit Margin up to 92.4% from 90.7% (average for 2017)
Active Users of the Boku platform increased to more than 10.3 million in June 2018
from 4.7 million one year ago
Net Loss for H1 2018 $0.7 million vs Net Loss of $6.6 million for H1 2017
Total Processed Volume (TPV) rose to $1.5 billion from $0.6 billion (+153%)
*Adjusted EBITDA (Earnings before interest, taxation, depreciation and amortization): adjusted, stock option expenses, forex gains\losses and exceptional items (which include IPO Costs). ** Cash balances include $1.1 million restricted cash.
EBITDA turning into cash We are able to report positive Adjusted EBITDA of $2.5 million for the first half of 2018, continuing the trend of improving financial performance seen in 2017 ($2.8 million negative EBITDA in H1 2017, $0.5 million positive in H2 2017). Interest charges of $0.5 million are the only notable cash expense below Adjusted EBITDA. EBITDA less interest expense is therefore a good indicator for cash generation in the business – which in H1 2018 was $2.0 million.
Leading IndicatorsWe are proud to report that over the first half of 2018 we have introduced over 2.3 million new paying users to our customers.
These new users, combined with 8 million returning users, have helped to generate +153% growth in the value of transactions (in $ terms) processed over the Boku platform (TPV). In fact, TPV of $1.5 billion in H1 2018 was 91% the TPV reported for the whole of 2017. Another illustration of the growth we have been able to deliver.
Revenue and Gross MarginOne direct benefit of having a mixed portfolio of customers is that blended average take rates have remained buoyant across H1 2018. Our higher margin Settlement business (whereby Boku is directly involved in the settlement of funds, including currency conversion) has had a strong H1, thus slowing the mix effect of lower average take rates being created by rapidly
Boku Inc Interim Report and Accounts for the half year ended 30 June 2018 www.boku.com05

Chief Financial Officer’s Report
growing (App Store) Transaction model business. Average take rates were expected to decline, however the mix impact of the above has now largely washed through. Take rates for H1 2018 averaged out at 1.1% compared with 1.7% for the same period in 2017; also marginally better than we had expected.
The reported 66% growth in H1 2018 Revenue (compared with the same period in 2017) is flattered a little by the comparable period in 2017 which excludes the benefits of some key contract renegotiations.
Operating ExpenditureAdjusted Operating Expenditure of $13.1 million for H1 2018 is 10% higher than the same period in 2017 as we have begun to invest in new products and services that are expected to deliver revenues from 2019 and beyond.
The underlying costs for the Direct Carrier Billing business are just $0.6 million (5%) higher than H1 2017, the increase in spend being driven by investment in optimization of data storage and processing on the platform. We have now successfully tested the platform at volumes of up to 600 transactions per second, providing us with plenty of room for growth over the coming years. $0.6 million has been invested over the Period in Boku Labs and our first new business line, Boku Mobile Identity. Just $0.1 million of development expenditure was capitalized in H1 18.
Operating PerformanceReported operating losses were reduced to $0.6 million in H1 2018, down from $6.6 million in H1 2017, this improvement can be broken down as follows:
• Adjusted EBITDA improved strongly in H1 2018 to $2.5 million, reversing a $2.8 million EBITDA loss in H1 2017
• Depreciation & Amortisation were broadly flat ($1.4 million compared with $1.5 million).
• Foreign Exchange (FX) movements during the Period created a charge of $0.3 million (equivalent to 0.02% of TPV). The Company operates forward FX contracts to hedge foreign currency exposure and also factors the costs of currency conversion into fees (booked through Revenue).
• Exceptional costs of $0.2 million, down from $0.7 million in H1 2017 (2017 costs included costs relating to the IPO).
• Share Option expenses of $0.7 million were up on $0.5 million in 2017
Financing ExpensesFinancing costs of $0.5 million for H1 2018 include the cost of an early exit from a factoring facility within Boku AG. Removing this facility will be cost-effective for the Company going forward.
The Company reduced the draw down on its working capital facility from $2.4 million to $2.2 million within the Period. Combined with the exit from the previously mentioned factoring arrangements, total debt has therefore been reduced from c$25 million*** to $2.2 million since the IPO.
*** includes convertible notes, working capital loan and factoring facility
Balance Sheet and CashflowCash balances remained strong throughout H1 2018 as the Company was cash generative. Closing cash balances of $30.7 million are flattered by the timing of payment cycles within the Settlement business – more Receivables turned into cash at the end of the Period. A fairer representation of underlying cash is the average daily cash balance which was $23.1 million in June 2018, up from $19.2 million in December 2017.
MNO Receivables and Merchant Payables fell in the Period, however, as previously mentioned, these are also impacted by the cut off timing of month end receipts and payments.
The value of Intangible Assets reduced on our balance sheet by $1.7 million between December 2017 and June 2018 through amortisation.
Stuart Neal
Boku Inc Interim Report and Accounts for the half year ended 30 June 2018 www.boku.com06

Chief Financial Officer’s Report
Looking Ahead The Company expects to continue its strong growth rate in H2 2018, albeit in % terms this will slow a little as comparatives increase. The mix of business will lean more towards the transaction model following the industry trend towards concentrated distribution of digital content via App Stores. We will continue to make sensible investments in both our existing product lines and in developing entirely new revenue opportunities, without sacrificing meeting our EBITDA targets for the year.
Stuart NealChief Financial Officer 3 September 2018
“We are pleased to report positive Adjusted EBITDA of $2.5 million
for the first half of 2018”
Boku Inc Interim Report and Accounts for the half year ended 30 June 2018 www.boku.com07

Consolidated Statement of Comprehensive Income
Note
(Unaudited)Period ended
30-Jun2018
$’000
(Unaudited)Period ended
30 -Jun2017
$’000Revenue 3 16,906 10,207Cost of sales (1,279) (1,050)Gross profit 15,627 9,157Administrative expenses (15,681) (14,361)
Operating loss analysed as:Adjusted EBITDA* 2,546 (2,758)Depreciation and amortisation (1,397) (1,452)Share Option expense (667) (474)Foreign exchange (losses)\gains (293) 135Exceptional items (included in administrative expenses) (243) (655)
Operating loss (54) (5,204)Finance income 4 23 8Finance expense 4 (527) (1,220)Loss before tax (558) (6,416)Tax expense (122) (146)Net loss for the period attributable to equity holders of the parent company (680) (6,562)
Other comprehensive income\(losses) net of taxItems that will or may be reclassified to profit or lossForeign currency translation (loss)\ gain (521) 1,383Net increase\(decrease) in fair value of cash flow hedge derivatives 23 (83)Total comprehensive gain\(loss) for the period (498) 1,300Total comprehensive loss for the period attributable to equity holders of the parent company (1,179) (5,262)
Loss per share for loss attributable to the owners of the parent during the year Basic and fully diluted ($) (0.003) (0.047)
*Earnings before interest, tax, depreciation, amortisation, share-based payment, foreign exchange gains/(losses), and exceptional items (which includes IPO costs).
Boku Inc Interim Report and Accounts for the half year ended 30 June 2018 www.boku.com08
Financials
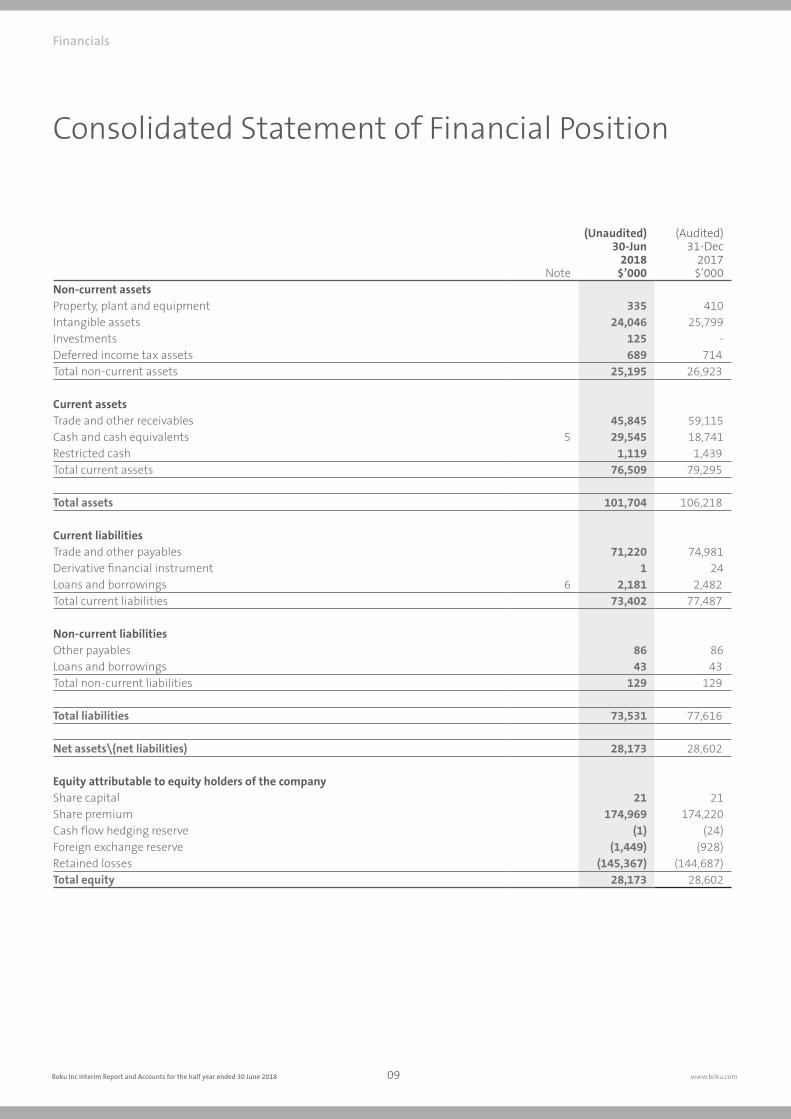
Consolidated Statement of Financial Position
Note
(Unaudited)30-Jun
2018$’000
(Audited)31-Dec
2017$’000
Non-current assetsProperty, plant and equipment 335 410Intangible assets 24,046 25,799Investments 125 -Deferred income tax assets 689 714Total non-current assets 25,195 26,923
Current assetsTrade and other receivables 45,845 59,115Cash and cash equivalents 5 29,545 18,741Restricted cash 1,119 1,439Total current assets 76,509 79,295
Total assets 101,704 106,218
Current liabilitiesTrade and other payables 71,220 74,981Derivative financial instrument 1 24Loans and borrowings 6 2,181 2,482Total current liabilities 73,402 77,487
Non-current liabilitiesOther payables 86 86Loans and borrowings 43 43Total non-current liabilities 129 129
Total liabilities 73,531 77,616
Net assets\(net liabilities) 28,173 28,602
Equity attributable to equity holders of the companyShare capital 21 21Share premium 174,969 174,220Cash flow hedging reserve (1) (24)Foreign exchange reserve (1,449) (928)Retained losses (145,367) (144,687)Total equity 28,173 28,602
Boku Inc Interim Report and Accounts for the half year ended 30 June 2018 www.boku.com09
Financials

Consolidated Condensed Statement of Cash Flows
Note
(Unaudited)Year ended
30-Jun2018
$’000
(Unaudited)Year ended
30-Jun2017
$’000Cash from\ (used in) in operations 11,633 (4,792)Income taxes paid - -Net cash from\ (used in) operating activities 11,633 (4,792)Investing activitiesPurchase of property, plant and equipment (37) (52)Purchased of software development (86) (96)Restricted cash (net) 320 30Investment (125) -Changes in hedge liability 23 -Interest received 23 8Net cash from\ used in investing activities 118 (110)Financing activitiesPayments to finance lease creditors (51) (57)Issue of common stock 81 24Interest paid (527) (196)Proceeds from line of credit - 1,435Repayment of line of credit (250) (739)Repurchase of common stock - -Net cash (used in) \ from financing activities (747) 467
Net increase\ (decrease) in cash and cash equivalents 11,004 (4,435)Effect of foreign currency translation on cash and cash equivalent (201) 254Cash and cash equivalents at beginning of period 18,741 11,322Cash and cash equivalents at end of period 29,545 7,133
Boku Inc Interim Report and Accounts for the half year ended 30 June 2018 www.boku.com10
Financials

Notes to the Consolidated Financial Information For the six months to 30 June 2018
1. Corporate InformationThe consolidated financial information represents the results of Boku Inc. (“the Company”) and its subsidiaries (together referred to as “the Group”).
Boku Inc. is a company incorporated and domiciled in the United States of America. The registered office of the Company is located at 735 Battery St., 2nd Floor, and San Francisco, CA 94111, United States.
On 20th November 2017, the Company’s shares were listed on the Alternative Investment Market of the London Stock Exchange (“AIM”).
The principal business of the Group is the provision of mobile billing and payment solutions for mobile network operators and mer-chants. These solutions enable consumers to make online payments using their mobile devices.
The Board of Directors approved this interim financial information on 3rd September 2018.
2. Basis of preparation and accounting policiesThe financial information has been prepared using the historical cost convention, as modified by the revaluation of certain derivative financial instruments, as stated in the accounting policies below. These policies have been consistently applied to all periods present-ed, unless otherwise stated.
This interim consolidated financial information has been prepared using accounting policies based on the International Financial Reporting Standards (IFRS and IFRIC interpretations) issued by the International Accounting standards Board (“IASB”). They do not include all disclosures that would otherwise be required in a complete set of financial statements and should be read in conjunction with the 31 December 2017 Annual Report. The financial information for the half years ended 30 June 2018 and 30 June 2017 does not constitute statutory accounts within the meaning of Section 434(3) of the Companies Act 2006 and both periods are unaudited.
The annual financial statements of Boku Inc. (“the group”) are prepared in accordance with IFRS, as issued by the International Ac-counting Standards Board. The comparative financial information for the year ended 31 December 207 included within this report does not constitute the full statutory Annual Report for that period. The statutory Annual Report and Financial Statements for 2017 have been published on the 9th April 2018. The Independent Auditors’ Report on the Annual Report and Financial statements for the year ended 31 December 2017 was unqualified, did not draw attention to any matters by way of emphasis and did not contain a statement under 498(2) – 3 of the Companies Act 2006.
Changes in accounting policies and disclosures(a) New and amended standards adopted by the Group
The Group has applied the same accounting policies and methods of computation in its interim consolidated financial statements as in its 2017 annual financial statements, except for those that relate to new standards and interpretations effective for the first time for periods beginning on (or after) 1 January 2018, and will be adopted in the 2018 financial statements. New standards impacting the Group that will be adopted in the annual financial statements for the year ended 31 December 2018, and which have given rise to changes in the Group’s accounting policies are:
• IFRS 9 Financial Instruments; and• IFRS 15 Revenue from Contracts with Customers
Details of the impact of these two standards are given below. Other new and amended standards and interpretations issued by the IASB that will apply for the first time in the next annual financial statements are not expected to have a material impact on the Group.
Boku Inc Interim Report and Accounts for the half year ended 30 June 2018 www.boku.com11
Financials

IFRS 9 Financial Instruments
IFRS 9 has replaced IAS 39 Financial Instruments: Recognition and Measurement, and has had an effect on the Group in the following areas:
The impairment provision on financial assets measured at amortised costs (such as trade and other receivables) have been calculated in accordance with IFRS 9’s simplified approach, using the lifetime expected credit losses, which differs from the incurred loss model previously required by IAS 39. During this process the probability of the non-payment of the trade receivables was assessed. This probability was then multiplied by the amount of the expected loss arising from default to determine the lifetime expected credit loss for the trade receivables. For trade receivables such provisions are recorded in a separate provision account with the loss being recognised within cost of sales in the consolidated statement of comprehensive income. On confirmation that the trade receivable will not be collectable, the gross carrying value of the asset is written off against the associated provision. IFRS 9 allows the use of a simplified “provision matrix” for calculating expected losses as a practical expedient (e.g., for trade receivables), if consistent with the general principles for measuring expected losses. The provision matrix used is based on each individual entity’s historical default rates over the expected life of the trade receivables and is adjusted for forward-looking estimates. It has not resulted in a change to the impairment provision calculation at 1 January 2018 or 30 June 2018 but it has increased the provision by 1% of trade receivables in comparison with the provision at 31 December 2018.
IFRS 15 Revenue from Contracts with Customers
IFRS 15 has replaced IAS 18 Revenue and IAS 11 Construction Contracts as well as various interpretations previously issued by the IFRS Interpretations committee. The core principle is that an entity should recognise revenue to depict the transfer of promised goods or services to customers in an amount that reflects the consideration to which the entity expects to be entitled in exchange for those goods or services. The Group has adopted the modified retrospective approach. There is no material impact on any revenue stream for the Group, noting the following as it relates to the Group’s revenue streams:
The Group’s revenue is principally its service fees. These fees are received or receivable:
1. Settlement Model: when it acts as an agent between a merchant and mobile network operators (MNOs) or an aggregator (a middleman between the Group and the MNO). The service fee recognised is the difference between amounts collected from the MNOs or the aggregator and the amounts remitted to merchants. The Group recognises accrued income when mobile device us-ers purchase virtual goods and digital goods through the Company’s payment platform. Once the Group receives confirmation of payment information from the Aggregator or the MNO, it reverses the accrued income and records the invoiced amount as trade receivable. The period from when the mobile device user purchases the virtual goods or digital goods to when the Group receives payment from Aggregators, or MNO, ranges from less than one month to six months or more. On receipt of this payment, the amount is paid to the merchant for the virtual goods or digital goods sold. When an amount due to a merchant is still outstand-ing, the Group recognises and includes this as part of trade payables.
2. Transactional Model: from larger virtual and digital merchants who receive the sale collections directly and pay a service fee to the Group.
3. Other revenue: from special merchant integrations, subscription services and early settlement of funds. The revenue earned rom special merchant integrations is recognised as deferred revenue when the integration has been completed and amortized over the life of the contract. The revenue earned from subscription services and early settlement of funds is recognized in the month when the subscription is billed for or the early settlement is made.
Notes
Boku Inc Interim Report and Accounts for the half year ended 30 June 2018 www.boku.com12
Financials

(b) New, amended standards, interpretations not yet effective
There are a number of standards and interpretations which have been issued by the International Accounting Standards board that are effective for periods beginning after to 31 December 2018 (the date on which the Group’s next annual financial statements will be prepared up to) that the Group has decided not to adopt early. The most significant of these is IFRS 16 Leases (mandatory for periods beginning on or after 1 January 2019) and replaces the previous leases Standard, IAS 17 Leases, and related Interpretations.
Adoption of IFRS 16 will result in the Group recognising the right use of assets and lease liabilities for all contracts that are, or con-tain, a lease. For leases currently classified as operating leases, under current accounting requirements the group does not recognise related assets or liabilities, disclosing instead the total commitment in its annual financial statements. At 31 December 2017 the commitment disclosed was $3.0m, which is not materially different to the position at 30 June 2018 or the amount which is expected to be disclosed at 31 December 2018. Assuming the group’s lease commitments remain at this level, the effect of discounting those commitments might be expected to result in the right-of-use assets and lease liabilities of approximately $2.9m being recognized on 1 January 2019. Instead of recognising an operating expense for its operating lease payments, the group will instead recognize interest on its lease liabilities and amortisation on its right of use assets. This will increase the reported EBITDA by the amount of its current operating lease costs (which for 6 months ended June 2018 was $0.5m).
Since the Group last reported, the Board has decided to apply the modified retrospective method when the standard is first adopted in its financial statements for the year ended 31 December 2019. Therefore, there will be no impact on any comparative accounting period (interim or annual) up to and including 31 December 2018, with any leases recognised on balance sheet on the date of initial application of IFRS 16 (1 January 2019). In applying the modifying retrospective approach, the Board has further decided to measure the right of use assets by reference to the amount at which lease liabilities are measure on 1 January 2019. Therefore, there will be no immediate impact on net assets as a result of adopting the standard on that date
The Group’s revenue and operating costs are predominantly denominated in US Dollars and accordingly the Group’s financial state-ments have been presented in US Dollars.
Going concernThe Directors have prepared a cash flow forecast covering a period extending beyond 12 months from the date of this financial in-formation.
After considering the forecasts and the risks, the Directors have a reasonable expectation that the Group has adequate resources to continue in operational existence for the foreseeable future. For these reasons, they continue to adopt the going concern basis of accounting in preparing the interim financial information.
Notes
Boku Inc Interim Report and Accounts for the half year ended 30 June 2018 www.boku.com13
Financials

3. Segmental analysis
(a) Revenue from operations
(Unaudited)30-Jun
2018$’000
(Unaudited)30-Jun
2017$’000
Revenue arises from:Provision of services 16,906 10,207
(b) Operating segment
For executive management purposes, the Group has one reportable segment – provision of a payment platform for the payment processing of virtual goods and digital goods purchases and categorizes all revenue from operations to this segment.
Operating segment information under the primary reporting format is disclosed below:
(Unaudited)30-Jun
2018$’000
(Unaudited)30-Jun
2017$’000
Revenue 16,906 10,207
Depreciation (201) (96)Amortisation (1,196) (1,356)
Segment loss before exceptional items (190) (4,549)Segment loss – exceptional items (243) (655)Segment loss (54) (5,204)Finance income 23 8Finance expense (527) (1,220)Group loss before tax (558) (6,416)
Notes
Boku Inc Interim Report and Accounts for the half year ended 30 June 2018 www.boku.com14
Financials

Notes
4. Finance income and expenses(Unaudited)
30-Jun2018
$’000
(Unaudited)30-Jun
2017$’000
Finance incomeInterest income from bank deposits 23 8Total 23 8
Finance expensesInterest on bank loans & overdrafts 156 197Interest on finance leases and hire purchase contracts 5 12Other interest payable (including interest paid for factoring) 366 175Amortisation of debt discount - 45Interest on convertible loan notes - 791Total 527 1,220
Net finance expenses 504 1,212
The interest payable includes a $266k one off costs associated with early termination of the factoring agreement.
5. Cash and cash equivalents and restricted cash(Unaudited)
30-Jun2018
$’000
(Audited)31-Dec
2017$’000
Cash and cash equivalents 29,545 18,741
Restricted cash 1,119 1,439Total cash 30,664 20,180
The restricted cash primarily includes e-money received but not yet paid to merchants (in transit), cash held in the form of a letter of credit to secure a lease agreement for the Company’s San Francisco office facility and a certificate of deposit held at a financial institution to collateralise Company credit cards.
Boku Inc Interim Report and Accounts for the half year ended 30 June 2018 www.boku.com15
Financials

Notes
6. Loans and borrowings(Unaudited)
30-Jun2018
$’000
(Audited)31-Dec
2017$’000
CurrentBank loans (secured) 2,150 2,400Obligations under finance lease and hire purchase contracts 31 82Total 2,181 2,482
Non-currentObligations under finance lease and hire purchase 43 43Total 43 43
Principal terms and the debt repayment schedule of the Group’s loan and borrowings are as follows:
In November 2013, the Group entered into a Loan and Security Agreement (the Agreement) with a financial institution that allows for borrowings of up to $15,000,000 under a revolving line of credit through to February 2015. This was ex-tended first, through to March 2017 and subsequently through to March 2019. However, the amounts borrowed under this Agreement were partially repaid after the IPO; the balance outstanding at 30 June 2018 was $2,150,000 (December 2017: $2,400,000).
7. Post balance sheet eventsThere have been no material post balance sheet events.
8. Cautionary Statement Boku has made forward-looking statements in this press release, including statements about the market for and ben-efits of its products and services; financial results; product development plans; the potential benefits of business rela-tionships with third parties and business strategies. The Group considers any statements that are not historical facts as “forward-looking statements”. They relate to events and trends that are subject to risk and uncertainty that may cause actual results and the financial performance of the Group to differ materially from those contained in any forward-look-ing statement. These statements are made by the directors in good faith based on the information available to them and such statements should be treated with caution due to the inherent uncertainties, including both economic and business risk factors underlying any such forward-looking information.
Boku Inc Interim Report and Accounts for the half year ended 30 June 2018 www.boku.com16
Financials
