interim report second quarter 2017 - cisionmb.cision.com/main/13374/2313453/702083.pdf · interim...
TRANSCRIPT

Ahlsell AB (publ) interim report January–June 2017
1 (24)
Interim report second quarter 2017 Net sales increased by 7 percent to SEK 6,818 (6,344) million. Organic growth was 8 (7) percent and acquisitions
contributed 3 percentage points. Fewer trading days in the quarter had a negative effect of 6 percentage points on sales.
Operating profit (EBIT) declined by 1 percent to SEK 471 (476) million. Fewer trading days in the quarter had a negative effect of approximately SEK 100 million on gross profit.
Profit (EBITA) amounted to SEK 558 (560) million, with an EBITA margin of 8.2 (8.8) percent. EBITA includes costs affecting comparability of SEK 11.5 million attributable to the restructuring of the Finnish management and sales organisation. Adjusted EBITA increased by 2 percent to SEK 570 (560) million, with an adjusted EBITA margin of 8.4 (8.8) percent.
Profit after tax was SEK 308 (155) million.
Basic and diluted earnings per share were SEK 0.71 (0.55).
Two acquisitions were made, with a combined annual turnover of approximately SEK 100 million.
During the quarter, an agreement was signed with Saferoad Holding on the acquisition of their Swedish Water & Sewer business ViaCon VA, with an annual turnover of approximately SEK 320 million. The transaction is subject to approval by the Swedish Competition Authority and closing is scheduled for September 2017.
Interim period January - June
Net sales increased by 13 percent to SEK 13,387 (11,824) million. Organic growth was 8 (6) percent.
Operating profit (EBIT) increased by 16 percent to SEK 913 (790) million.
Profit (EBITA) increased by 14 percent to SEK 1,088 (957) million, with an EBITA margin of 8.1 (8.1) percent. Adjusted EBITA increased by 15 percent to SEK 1,099 (957) million, with an adjusted EBITA margin of 8.2 (8.1) percent.
Profit after tax was SEK 643 (128) million.
Basic and diluted earnings per share were SEK 1.47 (0.46).
Three acquisitions were made, with a combined annual turnover of approximately SEK 220 million.
Financial summary
2017 2016 2017 2016 Rolling Full year
Apr-Jun Apr-Jun change Jan-Jun Jan-Jun change 12 months 2016
Net sales, SEK million 6,818 6,344 7% 13,387 11,824 13% 26,169 24,606
Organic growth, % 8% 7% 8% 6% 7%
Operating profit (EBIT), SEK million 471 476 -1% 913 790 16% 1,842 1,719
Profit (EBITA), SEK million 558 560 0% 1,088 957 14% 2,189 2,058
Adjusted EBITA, SEK million 570 560 2% 1,099 957 15% 2,273 2,131
EBITA margin, % 8.2% 8.8% 8.1% 8.1% 8.4% 8.4%
Adjusted EBITA margin, % 8.4% 8.8% 8.2% 8.1% 8.7% 8.7%
Profit after tax (profit for the period), SEK million 308 155 99% 643 128 400% 856 342
Basic earnings per share, SEK 0.71 0.55 1.47 0.46 2.22 1.11
Diluted earnings per share, SEK 0.71 0.55 1.47 0.46 2.22 1.11
Operating cash flow, SEK million 309 546 -43% 735 610 20% 2,125 2,000
Operating cash flow/EBITDA (Cash conversion), % 90% 90%
External net debt/Adjusted EBITDA, times 3.0 3.3 Organic growth, EBITA, Adjusted EBITA, EBITA margin, Adjusted EBITA margin are alternative performance measures, for which detailed calculations are presented on page 23.

Ahlsell AB (publ) interim report January–June 2017
2 (24)
Statement from the CEO
Strong growth and continued good profitability
Sales increased by 7 percent during the quarter, reflecting a strong first six months period, both in terms of revenue growth and earnings. All markets contributed to the performance and we see continuing good economic growth in our main markets. Gross profit for the quarter was adversely affected by Easter and fewer trading days.
Sales increased by 13 percent during the first half of the year. The solid increase was primarily attributable to organic growth and acquisitions. Our focus on an extended product range, full-range branches and strategic growth initiatives, together with completed acquisitions, has made us more attractive in the market. The positive development is reflected in the fact that we have entered into a number of new agreements with strategically important customers, and have renewed and extended existing agreements with many of our customers. We are increasingly seeing our customer-specific e-commerce solutions, in which efficient and environmentally-optimised logistics are integrated into the service, being well-received by large nationwide customers, irrespective of the market.
Looking at results, we succeeded in converting increased sales into improved earnings. To increase sales by SEK 1.6 billion in comparison with the first six months last year means a strong increase in operating activity. It is a mark of strength, then, that we have been able to increase adjusted EBITA by 15 percent, while making significant investments in Norway and Finland.
In terms of the individual markets, Ahlsell Sweden continues to deliver both strong sales growth and improved earnings. Operations showed organic growth of 10 percent during the quarter, and we both renewed and extended several nationwide agreements, notably in Construction, Electrical and Water & Sewers. The proportion of large projects continues to grow and we are delivering to most major construction and infrastructure projects in progress around Sweden. Acquisitions in recent years have strengthened Ahlsell’s construction and civil engineering business and made us an even more attractive partner. Internally, we have continued the extensive capacity expansion of the central warehouse in Hallsberg. We have also successfully driven improvement work with a focus on sales efficiency and developing the branch network during the period.
Ahlsell Norway achieved organic growth of 6 percent in the quarter. Gross profit was negatively affected by fewer trading days and the Easter effect, which meant that the result for the quarter was unchanged. We saw the strongest development in the Electrical product segment, where we entered into important agreements with electricity grid customers and large installation companies. Sales of Water & Sewer products grew significantly and Ahlsell Norway has successfully aligned itself with municipal operations, resulting in several new transactions. Operations have also continued to focus on strengthening the position in HVAC & Plumbing and increasing cross-selling. The strategy lays the foundation for increased awareness of Ahlsell as a strong
integrated supplier with the market’s most extensive range. Development of the branch network is an important part of the position movement and during the quarter we established a new full-range branch and co-located a further two branches. Development of the branch network remains a priority in 2017.
Ahlsell Finland still has a relatively unfavourable market situation and organic growth was 4 percent, despite high operational activity. The focus has been on strengthening the market position in HVAC & Plumbing and continuing the growth in Electrical and Tools & Supplies. Work on changing the management and sales organisation for the Finnish operations began during the quarter. The change is expected to bring a clearer focus on Ahlsell’s offering as an integrated supplier, while increasing the organisation’s efficiency. About 30 positions are affected. Extensive work is also in progress in Finland, aimed at developing and strengthening the branch network, with a focus on location, an extended range and Ahlsell’s branch concept.
Acquisition opportunities are still favourable
Acquisitions are a key element of Ahlsell's business model and growth strategy and there are major synergies inherent in both complementary and strategic acquisitions. With this in mind it is very positive that we presently have a significant pipeline of potential acquisition candidates in all our main markets. During the second quarter, our acquisition efforts resulted in two completed acquisitions and an agreement on the acquisition of ViaCon’s Swedish Water & Sewer opera-tions with an annual turnover of SEK 320 million. The agreement with ViaCon also includes an attractive co-operation agreement for the distribution of their geotechnical products and road signage systems. The acquisition of ViaCon is subject to approval by the Swedish Competition Authority and we expect closing in September. In the year to date, we have made acquisitions, or signed agreements for acquisitions, with a combined annual turnover of approximately SEK 540 million.
Outlook I do not expect any major change in the demand situation; in fact, the outlook for the next six months currently appears good, particularly in Sweden, with a construction market that remains strong and positive development in the industrial sector. In the rest of the Nordic region, the outlook also appears positive in, for example, the construction and industrial sector in Norway and we can expect a gradual recovery in Finland.
Johan Nilsson
President and CEO
Ahlsell is the Nordic region’s leading distributor of installation products, tools and supplies for installers, construction companies, facility managers, industrial and power companies and the public sector. Our unique offer covers more than one million individual products and solutions. We generate sales of approximately SEK 26 billion, and 97 percent of revenue is generated in our three main markets of Sweden, Norway and Finland. With over 5,000 employees, more than 200 branches and three central warehouses, we are committed every day to our promise to customers:
Ahlsell makes it easier to be professional!

Ahlsell AB (publ) interim report January–June 2017
3 (24)
Net sales
Second quarter
External net sales for the quarter increased by 7 percent to SEK 6,818 (6,344) million. Organic growth was 8 percent. Together, organic growth and acquisitions accounted for 12 percent growth, with the acquired entities estimated to have contributed 3 percentage points, corresponding to approximately SEK 190 million. Fewer trading days, partly due to the entire Easter holiday falling in the second quarter this year, resulted in a reduction of -6 percentage points in sales, corresponding to SEK 361 million. Translation effects, mainly related to the Norwegian and Finnish operations, had a positive impact of 1 percent on net sales during the quarter, corresponding to SEK 94 million.
Market conditions remained good in all main markets, which contributed to positive sales growth in all product segments. The Easter effect* reduced organic growth early in the quarter, but growth recovered quickly in the strong market. The segments Denmark and Other, which together account for about 3 percent of the Group’s sales, have shown more varied trends, with Estonia and Poland in particular experiencing strong growth and Russia showing weaker development.
Interim period January – June (6 months)
External net sales for the interim period increased by 13 percent to SEK 13,387 (11,824) million. Organic growth was 8 percent. Revenue from acquired entities is estimated to have contributed approximately SEK 346 million, equivalent to 3 percentage points of net sales growth. Together, organic growth and acquisitions accounted for 11 percent growth. Number of trading days had a marginal impact on sales. Translation effects had a positive effect of 2 percent on net sales in the interim period, corresponding to SEK 218 million. * The Easter effect means that Ahlsell’s sales are lower on the trading days during Easter week. Sales are adversely affected as there is a decline in market activity on these days. The Easter effect varies in severity from country to country, and is strongest in Norway and weakest in Finland. Ahlsell estimates that the Easter effect represents the loss of about one trading day for the Group.
Net sales by segment rolling 12 months Net sales by product segment rolling 12 months
Net sales per quarter and rolling 12 months
Organic sales growth per quarter
65%
20%
12%
1%2%
Sweden
Norway
Finland
Denmark
Other
47%
29%
24% HVAC and plumbing
Electrical
Tools and supplies
14 000
16 000
18 000
20 000
22 000
24 000
26 000
28 000
30 000
0
1 000
2 000
3 000
4 000
5 000
6 000
7 000
8 000
Q1 Q2 Q3 Q4 Q1 Q2 Q3 Q4 Q1 Q2 Q3 Q4 Q1 Q2
2014 2015 2016 2017
Net sales per quarter, MSEK Net sales RTM, MSEK
-2%
0%
2%
4%
6%
8%
10%
Q1 Q2 Q3 Q4 Q1 Q2 Q3 Q4 Q1 Q2 Q3 Q4 Q1 Q2
2014 2015 2016 2017
Organic sales growth, %

Ahlsell AB (publ) interim report January–June 2017
4 (24)
Earnings
Second quarter
The Group’s EBITA for the second quarter was SEK 558 (560) million, with an EBITA margin of 8.2 (8.8) percent. Adjusted EBITA increased by 2 percent to SEK 570 (560) million, with an adjusted EBITA margin of 8.4 (8.8) percent. The gross margin was 26.8 (27.0) percent, a slight decline compared with the same period the previous year. Fewer trading days compared with the previous year had a negative effect of approximately SEK 100 million on gross profit.
Profit before tax for the period was SEK 409 (244) million. Profit for the period amounted to SEK 308 (155) million.
Interim period January – June (6 months)
The Group’s EBITA for the interim period was SEK 1,088 (957) million, corresponding to an increase of 14 percent and an EBITA margin of 8.1 (8.1) percent. Adjusted EBITA increased by 15 percent to SEK 1,099 (957) million, with an adjusted EBITA margin of 8.2 (8.1) percent. The gross margin was 27.0 (27.2) percent, a slight decline compared with the same period the previous year.
Profit before tax for the period was SEK 837 (256) million. Profit for the period amounted to SEK 643 (128) million.
EBITA per quarter and rolling 12 months Adjusted EBITA margin per quarter
Net sales and EBITA margin per quarter
Earnings per share per quarter, and rolling 12 months
0
500
1 000
1 500
2 000
2 500
3 000
0
100
200
300
400
500
600
Q1 Q2 Q3 Q4 Q1 Q2 Q3 Q4 Q1 Q2 Q3 Q4 Q1 Q2
2014 2015 2016 2017
EBITA per quarter, MSEK EBITA RTM, MSEK
0%
2%
4%
6%
8%
10%
12%
Q1 Q2 Q3 Q4 Q1 Q2 Q3 Q4 Q1 Q2 Q3 Q4 Q1 Q2
2014 2015 2016 2017
Adjusted EBITA margin per quarter
0%
2%
4%
6%
8%
10%
12%
14%
16%
0
1 000
2 000
3 000
4 000
5 000
6 000
7 000
8 000
Q1 Q2 Q3 Q4 Q1 Q2 Q3 Q4 Q1 Q2 Q3 Q4 Q1 Q2
2014 2015 2016 2017
Net sales per quarter, MSEK EBITA margin-3
-2
0
2
3
5
6
8
9
-0,3
-0,2
0,0
0,2
0,3
0,5
0,6
0,8
0,9
Q1 Q2 Q3 Q4 Q1 Q2 Q3 Q4 Q1 Q2
2015 2016 2017
Earnings per share per quarter, SEK Earnings per share RTM, SEK
SEK/quarter SEK/LTM
Ahlsell AB (publ) interim report January–June 2017
5 (24)
Segment
SWEDEN
Sweden 2017 2016 2017 2016 Rolling Full year
Apr-Jun Apr-Jun change Jan-Jun Jan-Jun change 12 months 2016
External net sales, SEK million 4,484 4,102 9% 8,745 7,674 14% 16,945 15,874
Organic growth, % 10% 8% 9% 7% 8%
Profit (EBITA), SEK million 537 522 3% 1,047 913 15% 2,071 1,936
Adjusted EBITA, SEK million 537 522 3% 1,047 913 15% 2,071 1,936
EBITA margin, % 12.0% 12.7% 12.0% 11.9% 12.2% 12.2%
Adjusted EBITA margin, % 12.0% 12.7% 12.0% 11.9% 12.2% 12.2%
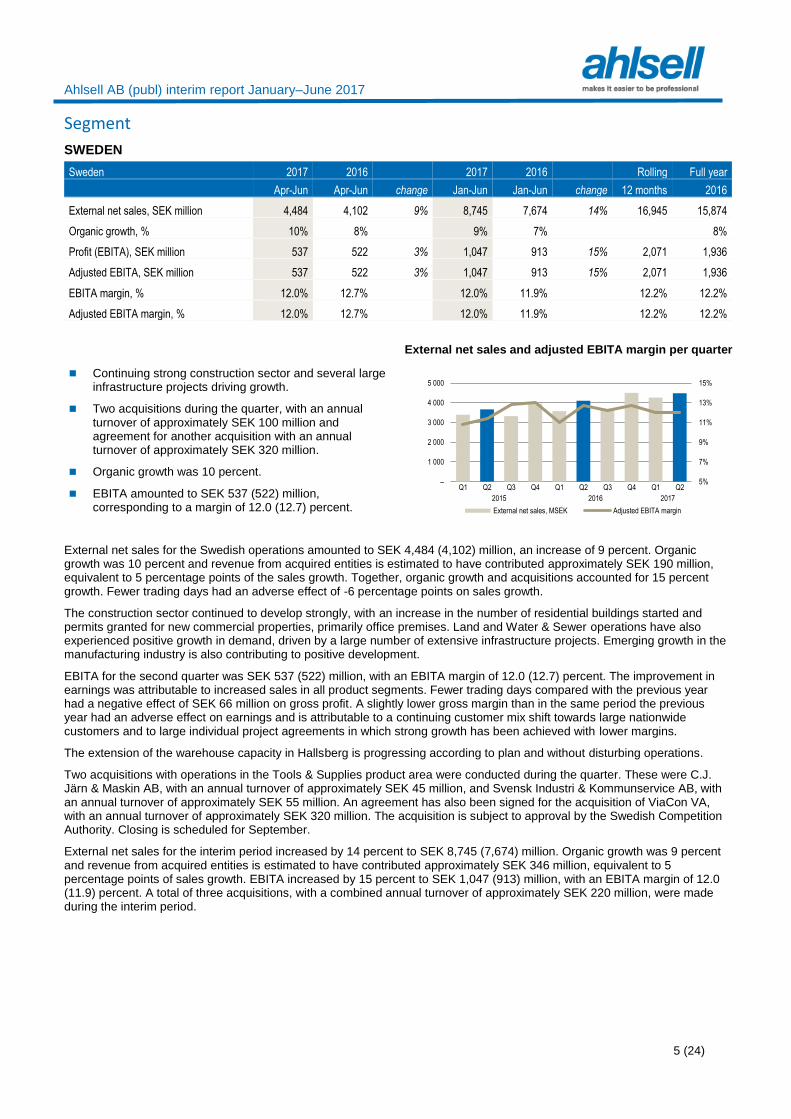
Continuing strong construction sector and several large infrastructure projects driving growth.
Two acquisitions during the quarter, with an annual turnover of approximately SEK 100 million and agreement for another acquisition with an annual turnover of approximately SEK 320 million.
Organic growth was 10 percent.
EBITA amounted to SEK 537 (522) million, corresponding to a margin of 12.0 (12.7) percent.
External net sales and adjusted EBITA margin per quarter
External net sales for the Swedish operations amounted to SEK 4,484 (4,102) million, an increase of 9 percent. Organic growth was 10 percent and revenue from acquired entities is estimated to have contributed approximately SEK 190 million, equivalent to 5 percentage points of the sales growth. Together, organic growth and acquisitions accounted for 15 percent growth. Fewer trading days had an adverse effect of -6 percentage points on sales growth.
The construction sector continued to develop strongly, with an increase in the number of residential buildings started and permits granted for new commercial properties, primarily office premises. Land and Water & Sewer operations have also experienced positive growth in demand, driven by a large number of extensive infrastructure projects. Emerging growth in the manufacturing industry is also contributing to positive development.
EBITA for the second quarter was SEK 537 (522) million, with an EBITA margin of 12.0 (12.7) percent. The improvement in earnings was attributable to increased sales in all product segments. Fewer trading days compared with the previous year had a negative effect of SEK 66 million on gross profit. A slightly lower gross margin than in the same period the previous year had an adverse effect on earnings and is attributable to a continuing customer mix shift towards large nationwide customers and to large individual project agreements in which strong growth has been achieved with lower margins.
The extension of the warehouse capacity in Hallsberg is progressing according to plan and without disturbing operations.
Two acquisitions with operations in the Tools & Supplies product area were conducted during the quarter. These were C.J. Järn & Maskin AB, with an annual turnover of approximately SEK 45 million, and Svensk Industri & Kommunservice AB, with an annual turnover of approximately SEK 55 million. An agreement has also been signed for the acquisition of ViaCon VA, with an annual turnover of approximately SEK 320 million. The acquisition is subject to approval by the Swedish Competition Authority. Closing is scheduled for September.
External net sales for the interim period increased by 14 percent to SEK 8,745 (7,674) million. Organic growth was 9 percent and revenue from acquired entities is estimated to have contributed approximately SEK 346 million, equivalent to 5 percentage points of sales growth. EBITA increased by 15 percent to SEK 1,047 (913) million, with an EBITA margin of 12.0 (11.9) percent. A total of three acquisitions, with a combined annual turnover of approximately SEK 220 million, were made during the interim period.
5%
7%
9%
11%
13%
15%
–
1 000
2 000
3 000
4 000
5 000
Q1 Q2 Q3 Q4 Q1 Q2 Q3 Q4 Q1 Q2
2015 2016 2017
External net sales, MSEK Adjusted EBITA margin

Ahlsell AB (publ) interim report January–June 2017
6 (24)
NORWAY
Norway 2017 2016 2017 2016 Rolling Full year
Apr-Jun Apr-Jun change Jan-Jun Jan-Jun change 12 months 2016
External net sales, SEK million 1,312 1,267 4% 2,702 2,349 15% 5,261 4,909
Organic growth, % 6% 6% 9% 6% 7%
Profit (EBITA), SEK million 26 25 3% 65 38 71% 169 142
Adjusted EBITA, SEK million 26 25 3% 65 38 71% 176 149
EBITA margin, % 2.0% 2.0% 2.4% 1.6% 3.2% 2.9%
Adjusted EBITA margin, % 2.0% 2.0% 2.4% 1.6% 3.4% 3.0%
Good market conditions in the construction and civil engineering sector.
Continuing work on extending the offering and rolling out strategic market initiatives.
Branch network initiatives continue. A new branch was opened in the Oslo area, and several re-location and co-location projects conducted in the branch network.
Organic growth, which was adversely affected by the Easter effect, was 6 percent.
EBITA amounted to SEK 26 (25) million, corresponding to a margin of 2.0 (2.0) percent.
External net sales and adjusted EBITA margin per quarter
External net sales for the Norwegian operations amounted to SEK 1,312 (1,267) million, an increase of 4 percent. Organic growth was 6 percent and was hampered by the Easter effect to a greater extent than other segments. Fewer trading days had an adverse effect of -7 percentage points on sales growth. Translation effects had a positive impact of 4 percent, corresponding to SEK 51 million. The sales growth in the quarter is mainly attributable to the product segment Electrical, which increased its sales to installation and electricity grid customers. The product segment HVAC & Plumbing also showed positive development, primarily driven by increased sales to large installation and water & sewer customers.
EBITA for the second quarter was SEK 26 (25) million, with an EBITA margin of 2.0 (2.0) percent. Gross profit was adversely affected by fewer trading days, corresponding to a loss in earnings of SEK 22 million. The gross margin for the quarter was slightly higher than in the same quarter the previous year. Work on several of the previously launched initiatives is proceeding according to plan. Examples include initiatives aimed at facility management, electricity grid and aquaculture customers, and the strengthening of the regional sales force within personal protective equipment. The branch network has also been strengthened both through co-location and the opening of new branches.
External net sales for the interim period increased by 15 percent to SEK 2,702 (2,349) million. Organic growth was 9 percent. Translation effects had a positive impact of 6 percent, corresponding to SEK 152 million. EBITA increased by 71 percent to SEK 65 (38) million, with an EBITA margin of 2.4 (1.6) percent.
0%
1%
2%
3%
4%
5%
6%
–
300
600
900
1 200
1 500
1 800
Q1 Q2 Q3 Q4 Q1 Q2 Q3 Q4 Q1 Q2
2015 2016 2017
External net sales, MSEK Adjusted EBITA margin

Ahlsell AB (publ) interim report January–June 2017
7 (24)
FINLAND
Finland 2017 2016 2017 2016 Rolling Full year
Apr-Jun Apr-Jun change Jan-Jun Jan-Jun change 12 months 2016
External net sales, SEK million 813 787 3% 1,540 1,438 7% 3,152 3,050
Organic growth, % 4% 8% 4% 5% 7%
Profit (EBITA), SEK million 21 34 -37% 35 44 -19% 106 114
Adjusted EBITA, SEK million 33 34 -4% 47 44 7% 117 114
EBITA margin, % 2.6% 4.3% 2.3% 3.0% 3.3% 3.7%
Adjusted EBITA margin, % 4.0% 4.3% 3.0% 3.0% 3.7% 3.7%
Positive development in the construction sector, both for residential and commercial buildings.
High activity in the organisation aimed at developing the branch network and market offering.
Costs affecting comparability of SEK 11.5 million related to the restructuring of the management and sales organisation.
Organic growth was 4 percent.
Adjusted EBITA amounted to SEK 33 (34) million, corresponding to an adjusted margin of 4.0 (4.3) percent.
External net sales and adjusted EBITA margin per quarter
External net sales for the Finnish operations amounted to SEK 813 (787) million, an increase of 3 percent. Organic sales growth was 4 percent. Fewer trading days had an adverse effect of -5 percentage points on sales growth. Translation effects had a positive impact of 4 percent, corresponding to SEK 33 million. The sales growth is primarily driven by good growth in the HVAC & Plumbing area and a strong construction sector, particularly in new apartment and commercial buildings.
EBITA for the second quarter was SEK 21 (34) million, with an EBITA margin of 2.6 (4.3) percent. Adjusted EBITA amounted to SEK 33 (34) million, with an adjusted EBITA margin of 4.0 (4.3) percent. Gross profit was adversely affected by fewer trading days compared with the same period the previous year, corresponding to SEK 8 million. The development and strengthening of both the branch network and the sales force have been priority activities. This applies both in the Helsinki region and other growth areas, and in interesting customer and product areas with growth potential.
During the quarter, negotiations on restructuring the management and sales organisation, which affects about 30 positions, were completed. Costs affecting comparability attributable to the restructuring had an adverse effect of SEK 11.5 million on earnings for the second quarter. The measures are expected to have a positive effect on the cost level already in the next quarter, with an annual effect of about SEK 20 million.
External net sales for the interim period increased by 7 percent to SEK 1,540 (1,438) million. Organic growth was 4 percent. Translation effects had a positive impact of 3 percent, corresponding to SEK 47 million. Profit (EBITA) amounted to SEK 35 (44) million, with an EBITA margin of 2.3 (3.0) percent. Adjusted EBITA increased by 7 percent to SEK 47 (44) million, with an adjusted EBITA margin of 3.0 (3.0) percent.
0%
2%
4%
6%
8%
10%
–
200
400
600
800
1 000
Q1 Q2 Q3 Q4 Q1 Q2 Q3 Q4 Q1 Q2
2015 2016 2017
External net sales per quarter, MSEK Adjusted EBITA margin per quarter

Ahlsell AB (publ) interim report January–June 2017
8 (24)
DENMARK
Denmark 2017 2016 2017 2016 Rolling Full year
Apr-Jun Apr-Jun change Jan-Jun Jan-Jun change 12 months 2016
External net sales, SEK million 100 95 5% 195 188 4% 372 364
Organic growth, % 6% -1% 0% 1% -1%
Profit (EBITA), SEK million 10 9 15% 19 16 15% 35 33
Adjusted EBITA, SEK million 10 9 15% 19 16 15% 35 33
EBITA margin, % 10.3% 9.4% 9.6% 8.7% 9.5% 9.1%
Adjusted EBITA margin, % 10.3% 9.4% 9.6% 8.7% 9.5% 9.1%
Organic growth was 6 percent.
Gross margin strengthened.
EBITA amounted to SEK 10 (9) million, corresponding to a margin of 10.3 (9.4) percent.
External net sales and adjusted EBITA margin per quarter
External net sales for the Danish operations amounted to SEK 100 (95) million, an increase of 5 percent. Organic growth was 6 percent, while fewer trading days had an adverse effect of -5 percentage points on net sales. Translation effects had a positive impact of 4 percent, corresponding to SEK 4 million. Market conditions for the Danish operations remained challenging in the DIY segment, where Ahlsell’s gross margins were affected by strong competition and a changed product mix. The Danish refrigeration operation showed improved gross margins, despite weak market conditions.
EBITA for the second quarter was SEK 10 (9) million, with an EBITA margin of 10.3 (9.4) percent.
External net sales for the interim period increased by 4 percent to SEK 195 (188) million. Organic growth was 0 percent and an increased number of trading days affected sales by 1 percentage point. Translation effects had a positive impact of 3 percent, corresponding to SEK 6 million. EBITA increased by 15 percent to SEK 19 (16) million, with an EBITA margin of 9.6 (8.7) percent.
OTHER
Other (Estonia, Russia, Poland) 2017 2016 2017 2016 Rolling Full year
Apr-Jun Apr-Jun change Jan-Jun Jan-Jun change 12 months 2016
External net sales, SEK million 110 93 18% 204 175 17% 439 410
Organic growth 12% -14% 8% -12% -7%
Profit (EBITA), SEK million 3 2 45% 4 3 34% 10 9
Adjusted EBITA, SEK million 3 2 45% 4 3 34% 10 9
EBITA margin, % 2.3% 1.9% 1.8% 1.5% 2.3% 2.2%
Adjusted EBITA margin, % 2.3% 1.9% 1.8% 1.5% 2.3% 2.2%
0%
3%
6%
9%
12%
15%
–
20
40
60
80
100
Q1 Q2 Q3 Q4 Q1 Q2 Q3 Q4 Q1 Q2
2015 2016 2017
External net sales, MSEK Adjusted EBITA margin

Ahlsell AB (publ) interim report January–June 2017
9 (24)
Positive growth for Estonia and Poland.
Weak growth for Russia.
Organic growth was 12 percent.
EBITA amounted to SEK 3 (2) million, corresponding to a margin of 2.3 (1.9) percent.
External net sales and adjusted EBITA margin per quarter
External net sales for Other amounted to SEK 110 (93) million, an increase of 18 percent. Organic sales growth was 12 percent, and fewer trading days had an adverse effect of -2 percentage points. Translation effects had a positive impact of 8 percent, corresponding to SEK 7 million. The organic sales growth is driven by strong growth in the Estonian and Polish operations, while the Russian operations showed considerably weaker growth.
EBITA for the second quarter was SEK 3 (2) million, with an EBITA margin of 2.3 (1.9) percent.
External net sales for the interim period increased by 17 percent to SEK 204 (175) million. Organic growth was 8 percent and an increased number of trading days affected sales by 1 percentage point. Translation effects had a positive impact of 8 percent, corresponding to SEK 12 million. EBITA increased by 34 percent to SEK 4 (3) million, with an EBITA margin of 1.8 (1.5) percent.
Acquisitions Three acquisitions were made during the interim period, with a combined annual turnover of approximately SEK 220 million. The acquisitions were all conducted by the Swedish operations in the Tools & Supplies product area.
The total purchase consideration was SEK 128 million, with a cash flow effect of SEK -111 million. The acquired companies have reported net assets of SEK 49 million. Intangible surplus values were allocated as follows: SEK 14 million to customer relationships and SEK 68 million to goodwill. Goodwill is attributable to the synergies that are expected to arise.
C.J. Järn & Maskin AB and Svensk Industri & Kommunservice AB were acquired in the second quarter.
C.J. Järn & Maskin offers an extensive range of tools, machinery, personal protective equipment and industrial supplies for the professional market. Its operations are based in Vårgårda. C.J. Järn & Maskin has a strong position in the region, with customers mainly in the industrial sector. The company had an annual turnover of approximately SEK 45 million and 18 employees on the acquisition date. The acquisition of C.J. Järn & Maskin brings interesting customers, while also strengthening Ahlsell’s position in the region.
Svensk Industri & Kommunservice AB, which is known in the market under the brand name Sikab, is one of Gothenburg’s leading companies within professional workwear and footwear. The company has a 1,200 square metre store on Hisingen near the Tingstad Tunnel, where approximately 5,000 warehouse articles are offered to municipalities and small and medium-sized entrepreneurs. The acquisition of Sikab extends and strengthens Ahlsell’s offering in professional workwear and footwear in the Gothenburg region, and there are considered to be good opportunities for cross-selling, notably in personal protective equipment. The company had an annual turnover of approximately SEK 55 million and 13 employees on the acquisition date.
As the acquired businesses were integrated into Ahlsell’s existing operations after the acquisition date, it is not possible to present information about their contribution to consolidated net sales and earnings. Ahlsell considers the analysis of the acquired net assets to be provisional, and subsequent fair value adjustments may therefore be made.
Closing Acquisition Country Product area Annual sales SEK milliona Number of employeesb
28 Feb 2017 G-ESS Yrkeskläder AB Sweden Tools & Supplies 120 37
2 May 2017 C.J. Järn & Maskin AB Sweden Tools & Supplies 46 18
1 June 2017 Svensk Industri & Kommunservice AB Sweden Tools & Supplies 55 13
Total 221 68
a Estimated sales for the last 12 months on date of closing b On acquisition date
Ahlsell has also entered into an agreement with Saferoad Holding on the acquisition of their Swedish water & sewers business ViaCon VA, with an annual turnover of approximately SEK 320 million. The agreement includes the takeover of inventories, equipment and intangible assets belonging to the Water & Sewer operations, and covers stock-keeping and distribution of Water & Sewer products. The business has 81 employees based in 11 locations in Sweden. The acquisition adds valuable expertise and strengthens Ahlsell’s focus on attractive customer segments in construction and infrastructure.
-2%
0%
2%
4%
6%
8%
–
30
60
90
120
150
Q1 Q2 Q3 Q4 Q1 Q2 Q3 Q4 Q1 Q2
2015 2016 2017
External net sales per quarter, MSEK Adjusted EBITA margin per quarter

Ahlsell AB (publ) interim report January–June 2017
10 (24)
The purchase consideration for the Water & Sewer operations, including inventories, is approximately SEK 90 million and is dependent on the size of working capital on the date of closing. The transaction is subject to approval by the Swedish Competition Authority and closing is scheduled for September 2017.
Net financial items The Group’s net financial items for the second quarter amounted to SEK -62 (-232) million. The improvement is largely due to the full repayment of shareholder loans in October 2016, which now no longer affect net financial items, and new financing in the fourth quarter of 2016, which was arranged at better interest terms than the previous financing. Net interest expense was SEK -48 (-331) million. Interest expense related to the shareholder loans that were fully repaid in October 2016 had an impact of approximately SEK -160 million on net interest expense for the comparative period. Currency effects had an impact of SEK -36 (-38) million on net financial items, while revaluation of derivatives had an impact of SEK 26 (155) million on net financial items.
The Group’s net financial items for the period January-June amounted to SEK -76 (-534) million. The improvement for the interim period is largely due to the full repayment of shareholder loans in October 2016, which now no longer affect net financial items, and the new financing arranged in the fourth quarter of 2016. Net interest expense was SEK -95 (-666) million. Interest expense related to the shareholder loans that were fully repaid in October 2016 had an impact of approximately SEK -325 million on net interest expense for the comparative period. Currency effects had an impact of SEK -42 (-64) million on net financial items, while revaluation of derivatives had an impact of SEK 67 (223) million on net financial items.
Tax Tax on profit for the second quarter amounted to SEK -101 (-89) million. Tax on profit for the period January-June amounted to SEK -195 (-127) million. The higher tax cost for the year is due to the higher level of profit compared with the previous year. The effective tax rate for the interim period was 23%.
Financial position and liquidity The Group’s cash and cash equivalents at 30 June were SEK 957 (2,017) million, a decline of SEK 252 million since the beginning of the year. There are also unused credit facilities of SEK 1,923 million.
External net debt at 30 June amounted to SEK 7,251 (7,713) million, a decline of SEK 462 million since 30 June last year. External net debt/adjusted EBITDA was 3.0 (3.6) times.
The Group’s equity at 30 June was SEK 8,568 (888) million, an increase of SEK 479 million since the beginning of the year.
Cash flow and investments Operating cash flow for the second quarter was SEK 309 (546) million. The decline compared with the previous year is mainly related to changes in working capital. Cash flow from changes in working capital was SEK -231 (8) million. Cash flow from investing activities was SEK -132 (-60) million. The cash flow from investing activities was adversely affected by expenses associated with the central warehouse extension in Hallsberg. On completion, some of the expenses will be rebilled to the lessor. These expenses amounted to SEK 28 million in the second quarter. Investments in property, plant and equipment and intangible assets during the second quarter amounted to SEK -56 (-44) million. Cash flow from financing activities for the second quarter amounted to SEK -559 (-555) million and was affected by repayments and the dividend to shareholders. Cash flow for the period amounted to SEK -419 (-297) million.
Operating cash flow for the period January-June was SEK 735 (610) million. The increase compared with the previous year is mainly be due to the higher level of profit. Cash flow from changes in working capital was SEK -334 (-383) million. Cash flow from investing activities, including acquisitions, was SEK -256 (-20) million. In the previous year, the sale of a property had a positive impact of about SEK 70 million on investing activities. The period’s cash flow from investing activities was adversely affected by expenses associated with the central warehouse extension in Hallsberg. On completion, some of the expenses will be rebilled to the lessor. These expenses amounted during the period January-June to SEK 52 million. Investments in property, plant and equipment and intangible assets during the period January-June amounted to SEK -92 (-5) million. Cash flow from financing activities was SEK -559 (-555) million. Tax liabilities of approximately SEK 60 million attributable to prior years were settled in the interim period. Cash flow for the period amounted to SEK -254 (-345) million.
Operating cash flow/EBITDA (Cash conversion) was 90 (96) percent for the last twelve months.
Personnel The number of employees at the end of the period was 5,206 (4,952). The average number of employees in the period January-June was 5,140 (4,847). Acquisitions since the beginning of the year have increased the number of employees by 68. Acquisitions in 2016, after the end of the comparative period, increased the number of employees by about 130.
The Group’s share-savings programme costs for the second quarter were SEK 13 million. SEK 9 million of this amount was credited to equity and SEK 4 million was reserved for social security contributions. The Group’s share-savings programme costs for the period January-June were SEK 26 million. SEK 19 million of this amount was credited to equity and SEK 7 million was reserved for social security contributions. The costs are reported in the Central segment.
Parent Company Ahlsell AB (publ), corp. ID 556882-8916, is the Parent Company of the Group. The Parent Company’s net sales for the second quarter were SEK 113 (0) million. Profit before tax amounted to SEK 172 (-36) million. The Parent Company’s net

Ahlsell AB (publ) interim report January–June 2017
11 (24)
sales for the period January-June were SEK 223 (0) million. Profit before tax amounted to SEK 374 (-46) million. The Parent Company’s cash and cash equivalents amounted to SEK 2 (0) million at the end of the period. The Company is financed via the Group’s cash pool.
Significant events after the end of the interim period There were no significant events after the end of the interim period.
Related-party transactions The Luxembourg-based company, Keravel S.a.r.l., owns 40.1 % of Ahlsell AB (publ), corp. ID 556882-8916 (registered in Sweden with registered office in Stockholm). Ahlsell’s shares were admitted to trading on Nasdaq Stockholm on 28 October 2016. Prior to the listing on Nasdaq Stockholm, the Ahlsell Group was invoiced a monitoring fee of SEK 2 million by CVC Capital Partners Advisory Company S.a r.l. for the period January-June 2016. No monitoring fee will be invoiced for 2017.
Risks and uncertainties The Group and the Parent Company are exposed to a number of risks relating to both operating and financing activities. The risks that Ahlsell considers to be the most significant to its business are listed below. Activity in the building sector, comprising new construction projects, service and repairs, and renovation, maintenance
and improvement (RMI), is the single most important driving force for Ahlsell’s sales development.
Acquisitions are a key part of Ahlsell’s growth strategy. The acquisition process can be subject to difficulties, such as identifying acquisition objects, integrating acquired businesses and achieving expected synergies. Ahlsell’s acquisitions mean that intangible assets constitute a large part of Ahlsell’s total assets. Ahlsell’s intangible assets consist primarily of customer relationships, trademarks and goodwill.
If Ahlsell’s own warehouse and distribution operations were disrupted or shut down for some reason or if the distribution companies contracted by Ahlsell had insufficient distribution capacity to meet requirements, Ahlsell’s ability to deliver its products to the market would be adversely affected.
Ahlsell is greatly dependent on IT systems for the day-to-day operation of its business and the performance of its financial reporting. External suppliers are responsible for the administration and maintenance of all of Ahlsell’s central IT systems.
Upholding Ahlsell’s reputation is key to the success of its business. Ahlsell’s customers are placing ever greater demands on Ahlsell and on the sustainability and accountability of Ahlsell’s suppliers. If Ahlsell is found wanting in its sustainability performance and in the control of its suppliers’ sustainability practices, there is a risk that this will adversely impact sales.
Due to the nature and financial effects of its business activities, Ahlsell is exposed to risks relating to fluctuations in currency exchange rates.
Ahlsell has outstanding debts at variable interest rates. An unfavourable development in interest rates can have an adverse impact on Ahlsell’s business activities and financial position.
Accounting policies This interim report has been prepared under International Financial Reporting Standards (IFRS), in accordance with IAS 34 Interim Financial Reporting. The accounting policies and methods of calculation used in the preparation of the latest annual report have been applied, with the exception of new and amended standards and interpretations effective on 1 January 2017. The IASB has issued amendments to standards effective on 1 January 2017. These standards have not had a material impact on the consolidated financial statements.
The interim report for the Parent Company has been prepared in accordance with the Swedish Annual Accounts Act and the Swedish Securities Market Act, which is in compliance with RFR 2 Accounting for Legal Entities, issued by the Swedish Financial Reporting Board. The IASB has issued amendments to standards effective on or after 1 January 2017. These standards have not had a material impact on the Parent Company’s financial statements.
The figures that are reported have been rounded in some cases, which means that tables and calculations do not always add up exactly.
Future events and reporting dates Event/report Date
Q3, Interim report July-Sept 20 October 2017
Q4, Year-End Report 2017, January-December 26 January 2018
Stockholm, 19 July 2017 Ahlsell AB (publ) Johan Nilsson President and CEO This report has not been reviewed by the Company’s auditors.

Ahlsell AB (publ) interim report January–June 2017
12 (24)
Consolidated accounts
As the reported figures have been rounded in some cases, tables and calculations do not always add up exactly.
CONDENSED INCOME STATEMENT
2017 2016 2017 2016 Rolling Full year
SEK millions Note Apr-Jun Apr-Jun Jan-Jun Jan-Jun 12 months 2016
Net sales 1 6,818 6,344 13,387 11,824 26,169 24,606
Cost of goods sold -4,994 -4,631 -9,778 -8,606 -19,088 -17,916
Gross profit 1,825 1,713 3,608 3,217 7,081 6,690
Selling expenses -1,257 -1,147 -2,493 -2,251 -4,802 -4,559
Administration expenses -107 -92 -220 -184 -479 -443
Other operating income and expenses 10 2 19 8 42 31
Operating profit, EBIT 1.2 471 476 913 790 1,842 1,719
Net financial items -62 -232 -76 -534 -681 -1,140
Profit before tax 409 244 837 256 1,161 579
Income tax -101 -89 -195 -127 -305 -237
Profit/loss for the period 308 155 643 128 856 342
Attributable to
Owners of the parent company 308 155 643 128 856 342
Non-controlling interests – – – – – –
Basic earnings per share, SEK 6 0.71 0.55 1.47 0.46 2.22 1.11
Diluted earnings per share, SEK 6 0.71 0.55 1.47 0.46 2.22 1.11
CONDENSED STATEMENT OF COMPREHENSIVE INCOME
2017 2016 2017 2016 Rolling Full year
SEK millions Apr-Jun Apr-Jun Jan-Jun Jan-Jun 12 months 2016
Profit/loss for the period 308 155 643 128 856 342
Other comprehensive income for the period
Items that will be reclassified to profit or loss for the period
Translation differences -7 5 -22 18 -100 -60
Change in hedging reserve -1 – -2 – -5 -4
Tax attributable to components of other comprehensive income -4 18 -7 29 36 72
Items that will not be reclassified to profit or loss for the period
Actuarial gains and losses 0 0 0 1 -3 -2
Tax attributable to actuarial gains and losses 0 0 0 0 0 1
Comprehensive income for the period 297 179 613 177 784 348
Attributable to
Owners of the parent company 297 -2 613 177 784 348
Non-controlling interests – – – – – –

Ahlsell AB (publ) interim report January–June 2017
13 (24)
CONDENSED BALANCE SHEET
2017 2016 2016
SEK millions Note 30 June 30 June 31 Dec
ASSETS
Customer relationships 3,086 3,236 3,249
Trademark 3,837 3,767 3,837
Goodwill 7,064 6,730 7,028
Other intangible assets 131 130 123
Property, plant and equipment 797 737 781
Financial assets 4 78 156 8
Deferred tax assets 7 9 7
Total non-current assets 15,002 14,765 15,033
Inventories 3,360 3,054 3,287
Trade receivables 4 3,600 3,312 3,054
Other receivables 4 1,143 997 1,091
Cash and cash equivalents 4 957 2,017 1,209
Total current assets 9,060 9,381 8,641
TOTAL ASSETS 24,061 24,146 23,674
EQUITY AND LIABILITIES
Equity 8,568 888 8,089
Non-current interest-bearing liabilities 4 7,930 16,191 7,930
Provisions 56 56 55
Deferred tax liabilities 1,392 1,314 1,426
Other non-current liabilities 27 – 25
Total non-current liabilities 9,405 17,561 9,436
Current interest-bearing liabilities 4 328 322 724
Trade payables 4 4,780 4,325 4,599
Provisions 19 7 19
Other current liabilities 961 1,044 807
Total current liabilities 6,088 5,697 6,148
TOTAL EQUITY AND LIABILITIES 24,061 24,146 23,674

Ahlsell AB (publ) interim report January–June 2017
14 (24)
CONDENSED CASH FLOW STATEMENT
2017 2016 2017 2016 Rolling Full year
SEK millions Apr-Jun Apr-Jun Jan-Jun Jan-Jun 12 months 2016
Profit after financial items 409 244 837 256 1,161 579
Adjustments for non-cash items 158 142 266 441 825 1,001
- of which depreciation and impairment of assets 128 129 255 249 510 505
- capitalised and accrued interest 1 185 16 320 154 459
- other 29 -172 -5 -129 161 37
Tax paid -64 -77 -209 -84 -370 -245
Cash flow from operating activities before changes in working capital 503 309 894 613 1,616 1,335
Change in inventories -130 40 -58 -57 -166 -165
Change in operating receivables -231 -603 -598 -819 -333 -554
Change in operating liabilities 129 571 322 493 459 630
Cash flow from changes in working capital -231 8 -334 -383 -40 -89
Cash flow from operating activities 271 317 560 230 1,576 1,246
Cash flow from acquisition of assets, liabilities and operations -48 -15 -111 -15 -547 -451
Other cash flow from investing activities -84 -45 -144 -5 -218 -79
Cash flow from investing activities -132 -60 -256 -20 -765 -530
Cash flow before financing activities 139 257 305 210 811 716
Dividend paid -153 – -153 – -153 –
Disposal of derivatives – – – – 455 455
Issued warrants – – – – 3 3
Proceeds from borrowings – – – – 8,651 8,651
Amortisation of borrowings -406 -555 -406 -555 -10,830 -10,979
Cash flow from financing activities -559 -555 -559 -555 -1,875 -1,871
CASH FLOW FOR THE PERIOD -419 -297 -254 -345 -1,064 -1,155
Cash and cash equivalents at beginning of period 1,375 2,313 1,209 2,360 2,017 2,360
Exchange differences 1 1 2 2 4 4
Cash and cash equivalents at end of period 957 2,017 957 2,017 957 1,209
Additional information
Interest received 4 4 9 8 20 19
Interest paid -43 -188 -70 -291 -354 -575
CONDENSED STATEMENT OF CHANGES IN EQUITY
2017 2016 2016
SEK millions Jan-Jun Jan-Jun Jan-Dec
Opening equity 8,089 711 711
Comprehensive income for the period 613 177 348
Total recognised income and expenses 613 177 348
Issued warrants – – 3
Offset issue – – 7,020
Long-term share-saving programme 19 – 7
Dividend -153 – –
Total shareholder transactions -134 – 7,030
Closing equity 8,568 888 8,089

Ahlsell AB (publ) interim report January–June 2017
15 (24)
Condensed Parent Company statements
CONDENSED INCOME STATEMENT -– PARENT COMPANY
2017 2016 2017 2016 Rolling Full year
SEK millions Apr-Jun Apr-Jun Jan-Jun Jan-Jun 12 months 2016
Net sales 113 – 223 – 224 1
Gross profit 113 0 223 0 224 1
Administration expenses -29 0 -64 0 -131 -67
Operating profit/loss 84 0 159 0 93 -66
Interest and similar income 110 126 239 277 509 547
Interest and similar expense -22 -161 -24 -323 -269 -567
Profit after financial items 172 -36 374 -46 333 -86
Appropriations – – – – -112 -112
Profit before tax 172 -36 374 -46 222 -198
Income tax -37 – -81 – -154 -74
Profit/loss for the period 135 -36 293 -46 67 -272
CONDENSED STATEMENT OF COMPREHENSIVE INCOME – PARENT COMPANY
2017 2016 2017 2016 Rolling Full year
SEK millions Apr-Jun Apr-Jun Jan-Jun Jan-Jun 12 months 2016
Profit/loss for the period 135 -36 293 -46 67 -272
Change in hedging reserve -1 – -2 – -5 -4
Tax attributable to components of other comprehensive income 0 – 0 – 1 1
Other comprehensive income for the period -1 0 -1 0 -4 -3
Comprehensive income for the period 134 -36 292 -46 63 -275
Attributable to:
Owners of the parent company 134 -36 292 -46 63 -275

Ahlsell AB (publ) interim report January–June 2017
16 (24)
CONDENSED BALANCE SHEET – PARENT COMPANY
2017 2016 2016
SEK millions 30 June 30 June 31 Dec
Intangible assets 3 – –
Property, plant and equipment 0 – –
Shares in Group companies 3,032 2,930 3,032
Financial investments 1 – –
Receivables from Group companies 12,601 5,302 12,845
Deferred tax assets 3 – 1
Total non-current assets 15,639 8,232 15,877
Other receivables 82 – 7
Cash and cash equivalents 2 – 0
Total current assets 84 0 8
TOTAL ASSETS 15,724 8,232 15,885
Equity 7,335 377 7,176
Untaxed reserves 112 – 112
Non-current liabilities 7,653 7,854 7,651
Current liabilities 624 0 946
TOTAL EQUITY AND LIABILITIES 15,724 8,232 15,885

Ahlsell AB (publ) interim report January–June 2017
17 (24)
Notes
Disclosures in accordance with IAS 34.16A are presented in the financial statements and related notes, and also in other sections of the interim report.
NOTE 1. INFORMATION BY SEGMENT
External net sales by segment
2017 2016 2017 2016 Rolling Full year
SEK millions Apr-Jun Apr-Jun Jan-Jun Jan-Jun 12 months 2016
Sweden 4,484 4,102 8,745 7,674 16,945 15,874
Norway 1,312 1,267 2,702 2,349 5,261 4,909
Finland 813 787 1,540 1,438 3,152 3,050
Denmark 100 95 195 188 372 364
Other 110 93 204 175 439 410
Central – – – – – –
Group 6,818 6,344 13,387 11,824 26,169 24,606
EBITA by segment
2017 2016 2017 2016 Rolling Full year
SEK millions Apr-Jun Apr-Jun Jan-Jun Jan-Jun 12 months 2016
Sweden 537 522 1,047 913 2,071 1,936
Norway 26 25 65 38 169 142
Finland 21 34 35 44 106 114
Denmark 10 9 19 16 35 33
Other 3 2 4 3 10 9
Central -39 -32 -82 -56 -201 -176
Eliminations – – – – – –
Group 558 560 1,088 957 2,189 2,058
EBITA margin by segment
2017 2016 2017 2016 Rolling Full year
SEK millions Apr-Jun Apr-Jun Jan-Jun Jan-Jun 12 months 2016
Sweden 12.0% 12.7% 12.0% 11.9% 12.2% 12.2%
Norway 2.0% 2.0% 2.4% 1.6% 3.2% 2.9%
Finland 2.6% 4.3% 2.3% 3.0% 3.3% 3.7%
Denmark 10.3% 9.4% 9.6% 8.7% 9.5% 9.1%
Other 2.3% 1.9% 1.8% 1.5% 2.3% 2.2%
Central – – – – – –
Group 8.2% 8.8% 8.1% 8.1% 8.4% 8.4%

Ahlsell AB (publ) interim report January–June 2017
18 (24)
Adjusted EBITA by segment
2017 2016 2017 2016 Rolling Full year
SEK millions Apr-Jun Apr-Jun Jan-Jun Jan-Jun 12 months 2016
Sweden 537 522 1,047 913 2,071 1,936
Norway 26 25 65 38 176 149
Finland 33 34 47 44 117 114
Denmark 10 9 19 16 35 33
Other 3 2 4 3 10 9
Central -39 -32 -82 -56 -136 -111
Eliminations – – – – – –
Group 570 560 1,099 957 2,273 2,131
Adjusted EBITA margin by segment
2017 2016 2017 2016 Rolling Full year
SEK millions Apr-Jun Apr-Jun Jan-Jun Jan-Jun 12 months 2016
Sweden 12.0% 12.7% 12.0% 11.9% 12.2% 12.2%
Norway 2.0% 2.0% 2.4% 1.6% 3.4% 3.0%
Finland 4.0% 4.3% 3.0% 3.0% 3.7% 3.7%
Denmark 10.3% 9.4% 9.6% 8.7% 9.5% 9.1%
Other 2.3% 1.9% 1.8% 1.5% 2.3% 2.2%
Central – – – – – –
Group 8.4% 8.8% 8.2% 8.1% 8.7% 8.7%
Quarterly figures External net sales per segment/quarter
Year 2017 2016 2015
Quarter Q2 Q1 Q4 Q3 Q2 Q1 Q4 Q3 Q2 Q1
Sweden 4,484 4,261 4,501 3,699 4,102 3,572 3,944 3,326 3,667 3,392
Norway 1,312 1,390 1,375 1,185 1,267 1,082 1,189 1,100 1,241 1,161
Finland 813 727 824 789 787 651 710 727 689 642
Denmark 100 96 88 88 95 93 83 93 90 93
Other 110 95 115 120 93 82 110 123 112 95
Central – – – – – – – – – –
Group 6,818 6,568 6,902 5,880 6,344 5,480 6,036 5,369 5,798 5,383

Ahlsell AB (publ) interim report January–June 2017
19 (24)
EBITA per segment and quarter
Year 2017 2016 2015
Quarter Q2 Q1 Q4 Q3 Q2 Q1 Q4 Q3 Q2 Q1
Sweden 537 510 573 451 522 391 515 426 411 368
Norway 26 39 51 53 25 13 31 41 -16 22
Finland 21 14 25 45 34 10 22 37 22 9
Denmark 10 8 6 10 9 7 7 11 6 9
Other 3 1 2 4 2 1 1 5 5 0
Central -39 -43 -95 -25 -32 -24 -30 -20 -25 -22
Eliminations – – – – – – – – – –
Group 558 530 563 538 560 397 546 501 404 386
EBITA margin per segment and quarter
Year 2017 2016 2015
Quarter Q2 Q1 Q4 Q3 Q2 Q1 Q4 Q3 Q2 Q1
Sweden 12.0% 12.0% 12.7% 12.2% 12.7% 10.9% 13.0% 12.8% 11.2% 10.8%
Norway 2.0% 2.8% 3.7% 4.5% 2.0% 1.2% 2.6% 3.7% -1.3% 1.9%
Finland 2.6% 1.9% 3.1% 5.7% 4.3% 1.5% 3.2% 5.1% 3.2% 1.4%
Denmark 10.3% 8.8% 7.3% 11.6% 9.4% 7.9% 8.3% 11.5% 6.6% 9.7%
Other 2.3% 1.1% 1.8% 3.7% 1.9% 1.1% 1.2% 4.3% 4.4% 0.0%
Central – – – – – – – – – –
Group 8.2% 8.1% 8.2% 9.2% 8.8% 7.3% 9.0% 9.3% 7.0% 7.2%
Adjusted EBITA per segment and quarter
Year 2017 2016 2015
Quarter Q2 Q1 Q4 Q3 Q2 Q1 Q4 Q3 Q2 Q1
Sweden 537 510 573 451 522 391 515 426 419 368
Norway 26 39 51 60 25 13 33 41 5 22
Finland 33 14 25 45 34 10 22 37 22 9
Denmark 10 8 6 10 9 7 7 11 6 9
Other 3 1 2 4 2 1 1 5 5 0
Central -39 -43 -30 -25 -32 -24 -20 -20 -25 -22
Eliminations – – – – – – – – – –
Group 570 530 628 545 560 397 559 501 432 386
Adjusted EBITA margin per segment and quarter
Year 2017 2016 2015
Quarter Q2 Q1 Q4 Q3 Q2 Q1 Q4 Q3 Q2 Q1
Sweden 12.0% 12.0% 12.7% 12.2% 12.7% 10.9% 13.1% 12.8% 11.4% 10.8%
Norway 2.0% 2.8% 3.7% 5.1% 2.0% 1.2% 2.8% 3.7% 0.4% 1.9%
Finland 4.0% 1.9% 3.1% 5.7% 4.3% 1.5% 3.2% 5.1% 3.2% 1.4%
Denmark 10.3% 8.8% 7.3% 11.6% 9.4% 7.9% 8.3% 11.5% 6.6% 9.7%
Other 2.3% 1.1% 1.8% 3.7% 1.9% 1.1% 1.2% 4.3% 4.4% 0.0%
Central – – – – – – – – – –
Group 8.4% 8.1% 9.1% 9.3% 8.8% 7.3% 9.3% 9.3% 7.4% 7.2%

Ahlsell AB (publ) interim report January–June 2017
20 (24)
NOTE 2. DEPRECIATION/AMORTISATION
2017 2016 2017 2016 Rolling Full year
SEK millions Apr-Jun Apr-Jun Jan-Jun Jan-Jun 12 months 2016
Amortisation of intangible assets -88 -84 -175 -167 -347 -340
Impairment of intangible assets – – – – – –
Depreciation of property, plant and equipment -40 -37 -80 -74 -163 -156
Impairment of property, plant and equipment – – – – – –
NOTE 3. CONDENSED OPERATING CASH FLOW
In addition to the cash flow statement prepared in accordance with IAS 7, Ahlsell prepares a cash flow based on business operations, excluding financial transactions, taxes, and acquisitions and disposals of operations. This cash flow measure is used by management to monitor business performance.
2017 2016 2017 2016 Rolling Full year
SEK millions Apr-Jun Apr-Jun Jan-Jun Jan-Jun 12 months 2016
Operating profit/loss 471 476 913 790 1,842 1,719
Adjustments for non-cash items 126 107 247 208 489 449
Cash flows from changes in working capital -231 8 -334 -383 -40 -89
Operating cash flows before investments 365 591 827 615 2,290 2,079
Acquisition of intangible assets -14 -10 -20 -17 -33 -30
Acquisition of property, plant and equipment -43 -36 -73 -60 -140 -127
Sale of property, plant and equipment 0 1 1 72 7 77
Cash flow from operating investments -56 -44 -92 -5 -166 -79
Operating cash flows after investments 309 546 735 610 2,125 2,000
NOTE 4. FAIR VALUE OF FINANCIAL INSTRUMENTS
2017 2017 2016 2016 2016 2016
SEK millions 30 June 30 June 30 June 30 June 31 Dec 31 Dec
Recognised Fair Carrying Fair Carrying Fair
Financial assets value value value value value value
Financial assets held for trading measured at fair value 39 39 153 153 0 0
Loans and receivables 4,632 4,632 5,333 5,333 4,267 4,267
Available-for-sale financial assets 3 3 3 3 3 3
Total 4,674 4,674 5,489 5,489 4,271 4,271
Financial liabilities
Financial liabilities held for trading measured at fair value 8 8 30 30 8 8
Other financial liabilities 13,058 13,058 20,807 21,357 13,285 13,285
Total 13,065 13,065 20,837 21,387 13,293 13,293
Financial instruments measured at fair value in the balance sheet relate to equity swaps, currency swaps and interest rate swaps. These are measured using valuation techniques that only use observable market inputs at level two according to the fair value hierarchy.
For borrowing, there is no material difference between the carrying amount and fair value, as the Group’s borrowings are at variable interest rates. Nor does the Group have any other financial assets or liabilities off the balance sheet.

Ahlsell AB (publ) interim report January–June 2017
21 (24)
NOTE 5. ITEMS AFFECTING COMPARABILITY
To achieve better comparability between years, EBITA is presented in the interim report net of items affecting comparability. Items affecting comparability are large non-recurring items which have an effect on EBITA and which seldom occur, and should therefore be taken into consideration when analysing the underlying business.
2017 2016 2017 2016 Rolling Full year
SEK millions Apr-Jun Apr-Jun Jan-Jun Jan-Jun 12 months 2016
Type of cost/revenue Segment
Restructuring costs Finland -11 – -11 – -11 –
IPO costs Central – – – – -65 -65
Restructuring costs Norway – – – – -7 -7
Total items affecting comparability -11 0 -11 0 -84 -72
NOTE 6. EARNINGS PER SHARE
2017 2016 2017 2016 Rolling Full year
SEK millions Apr-Jun Apr-Jun Jan-Jun Jan-Jun 12 months 2016
Earnings per share Profit attributable to owners of the parent company (SEK million) 308 155 643 128 856 342
Weighted average number of basic ordinary shares outstanding (millions) 436.3 280.6 436.3 280.6 386.0 308.4
Basic earnings per share, SEK 0.71 0.55 1.47 0.46 2.22 1.11
Diluted earnings per share
The Ahlsell Group’s two long-term incentive programmes could potentially lead to future dilution of the number of shares. It will only be possible to calculate the dilutive effect of the share-savings programme after the first measurement period has ended (2018). There is currently a slight dilutive effect for the warrants programme.
There is no other dilution associated with ordinary shares.
Weighted average number of diluted ordinary shares outstanding (millions) 436.4 280.6 436.3 280.6 386.0 308.4
Diluted earnings per share, SEK 0.71 0.55 1.47 0.46 2.22 1.11

Ahlsell AB (publ) interim report January–June 2017
22 (24)
KEY PERFORMANCE MEASURES
2017 2016 2017 2016 Rolling Full year
SEK millions unless otherwise stated Apr-Jun Apr-Jun Jan-Jun Jan-Jun 12 months 2016
Sales measures
Net sales 6,818 6,344 13,387 11,824 26,169 24,606
Growth, % 7% 9% 13% 6% 9%
Organic growth, % 8% 7% 8% 6% 7%
Performance measures
Operating profit (EBIT) 471 476 913 790 1,842 1,719
EBITA 558 560 1,088 957 2,189 2,058
Adjusted EBITA 570 560 1,099 957 2,273 2,131
EBITDA 599 597 1,168 1,031 2,352 2,215
Adjusted EBITDA 610 597 1,180 1,031 2,436 2,287
Margin measures
EBIT margin, % 6.9% 7.5% 6.8% 6.7% 7.0% 7.0%
EBITA margin, % 8.2% 8.8% 8.1% 8.1% 8.4% 8.4%
Adjusted EBITA margin, % 8.4% 8.8% 8.2% 8.1% 8.7% 8.7%
Cash flow measures
Cash flow for the period -419 -297 -254 -345 -1,064 -1,155
Operating cash flow 309 546 735 610 2,125 2,000
Operating cash flow/EBITDA 90% 90%
Capital structure
Cash 957 2,017 957 2,017 957 1,209
External net debt 7,251 7,713 7,251 7,713 7,251 7,486
External net debt/Adjusted EBITDA 3.0 3.3
Debt/equity ratio, times 0.8 16.3 0.8 0.9
Equity/assets ratio, % 36% 4% 36% 34%
Working capital (average) 2,268 2,224 2,193 2,082 2,295 2,189
Working capital at end of period 2,393 2,241 2,393 2,241 2,393 2,042
Operating capital (average) 15,748 15,452 15,688 15,294 15,747 15,529
Operating capital, excluding intangible assets (average) 3,129 3,145 3,050 2,988 3,148 3,058
Returns
Return on operating capital, % 12% 11%
Return on operating capital (excluding intangible assets), % 70% 67%
Return on equity, % 16% 15%
Return on working capital % 95% 94%
Shares
Weighted average number of basic shares outstanding (thousands) 436,302 317,522 436,302 317,522 397,912 338,733
Weighted average number of diluted shares outstanding (thousands) 436,374 317,522 436,349 317,522 397,935 338,733
Number of ordinary shares at end of period (thousands) 436,302 280,606 436,302 280,606 436,302 436,302
Number of shares at end of period (thousands) 436,302 317,522 436,302 317,522 436,302 436,302
Basic earnings per share, SEK 0.71 0.55 1.47 0.46 2.22 1.11
Diluted earnings per share, SEK 0.71 0.55 1.47 0.46 2.22 1.11
Other
Number of employees at end of period 5,206 4,952 5,206 5,090

Ahlsell AB (publ) interim report January–June 2017
23 (24)
ALTERNATIVE PERFORMANCE MEASURES
Organic growth, EBITA, Adjusted EBITA, EBITA margin and Adjusted EBITA margin are alternative performance measures, for which detailed calculations are presented below. The APMs are used by management to monitor business performance.
Organic growth
Jan-Jun Group Sweden Norway Finland Denmark Other
Growth, % 13% 14% 15% 7% 4% 17%
Acquisitions, % -3% -5% 0% 0% 0% 0%
Currency, % -2% 0% -6% -3% -3% -8%
Difference in number of trading days, % 0% 0% 0% 0% -1% -1%
Organic growth, % 8% 9% 9% 4% 0% 8%
Number of trading days Jan-Jun 2017 123 123 124 123
Number of trading days Jan-Jun 2016 123 123 124 122
Apr-Jun Group Sweden Norway Finland Denmark Other
Growth, % 7% 9% 4% 3% 5% 18%
Acquisitions, % -3% -5% 0% 0% 0% 0%
Currency, % -1% 0% -4% -4% -4% -8%
Difference in number of trading days, % 6% 6% 7% 5% 5% 2%
Organic growth, % 8% 10% 6% 4% 6% 12%
Number of trading days Apr-Jun 2017 59 58 60 58
Number of trading days Apr-Jun 2016 62 62 63 61
EBITA/Adjusted EBITA
Jan-Jun, SEK millions Group Sweden Norway Finland Denmark Other Central
EBIT 913 923 40 13 16 4 -82
Amortisation and impairment of intangible assets 175 124 25 22 3 0 0
Profit (EBITA) 1,088 1,047 65 35 19 4 -82
Items affecting comparability 11 – – 11 – – –
Adjusted EBITA 1,099 1,047 65 47 19 4 -82
Apr-Jun, SEK millions Group Sweden Norway Finland Denmark Other Central
EBIT 471 475 14 10 9 2 -39
Amortisation and impairment of intangible assets 88 62 12 11 1 0 0
Profit (EBITA) 558 537 26 21 10 3 -39
Items affecting comparability 11 – – 11 – – –
Adjusted EBITA 570 537 26 33 10 3 -39

Ahlsell AB (publ) interim report January–June 2017
24 (24)
EBITA margin/Adjusted EBITA margin
Jan-Jun Group Sweden Norway Finland Denmark Other
EBIT margin, % 6.8% 10.6% 1.5% 0.9% 8.0% 1.7%
Amortisation and impairment of intangible assets, % 1.3% 1.4% 0.9% 1.4% 1.5% 0.0%
Profit (EBITA) margin, % 8.1% 12.0% 2.4% 2.3% 9.6% 1.8%
Items affecting comparability, % 0.1% - - 0.7% - -
Adjusted EBITA margin, % 8.2% 12.0% 2.4% 3.0% 9.6% 1.8%
Apr-Jun Group Sweden Norway Finland Denmark Other
EBIT margin, % 6.9% 10.6% 1.1% 1.3% 8.8% 2.3%
Amortisation and impairment of intangible assets, % 1.3% 1.4% 0.9% 1.4% 1.5% 0.0%
Profit (EBITA) margin, % 8.2% 12.0% 2.0% 2.6% 10.3% 2.3%
Items affecting comparability, % 0.2% - - 1.4% - -
Adjusted EBITA margin, % 8.4% 12.0% 2.0% 4.0% 10.3% 2.3%
Definitions of key performance measures Definitions of key performance measures can be found in the Annual Report.
Address
Ahlsell AB SE-117 98 Stockholm Visiting address: Rosterigränd 12 Phone: +46 8 685 70 00 E-mail: [email protected]