interim report q4 2017 - the leading nordic corporate … · also challenged by the abundance of...
TRANSCRIPT

SEB Annual Accounts 2017
Annual Accounts 2017
STOCKHOLM 31 JANUARY 2018
SEB Annual Accounts 2017 2
Annual Accounts 2017
The fourth quarter result included several items affecting comparability that are described on page 9. In order to simplify the reporting and analysis of SEB’s result, the net of operating income and operating expenses is presented in a new line in the income statement – Operating
profit before items affecting comparability. Below this line, another new line is presented – Items affecting comparability.
Full year 2017
(Compared with the full year 2016)
Operating income SEK 45.6bn (43.3), operating expenses SEK 21.9bn (21.8), operating profit before
items affecting comparability SEK 22.7bn (20.3) and net profit SEK 16.2bn (10.6).
Net credit losses SEK 808m (993) with a credit loss level of 0.05 per cent (0.07).
Return on equity 11.5 per cent (7.8), return on equity excluding items affecting comparability 12.7 per
cent (11.3) and earnings per share SEK 7.49 (4.88).
Fourth quarter 2017
(Compared with the third quarter 2017)
Operating income SEK 11.9bn (11.1), operating expenses SEK 5.6bn (5.4), operating profit before items
affecting comparability SEK 6.1bn (5.4) and net profit SEK 3.2bn (4.2).
Net credit losses SEK 105m (284) with a credit loss level of 0.03 per cent (0.07).
Return on equity 8.8 per cent (12.1), return on equity excluding items affecting comparability 13.5 per
cent (12.1) and earnings per share SEK 1.47 (1.96).
Dividend
The Board of Directors proposes a dividend to the shareholders of SEK 5.75 per share (5.50).
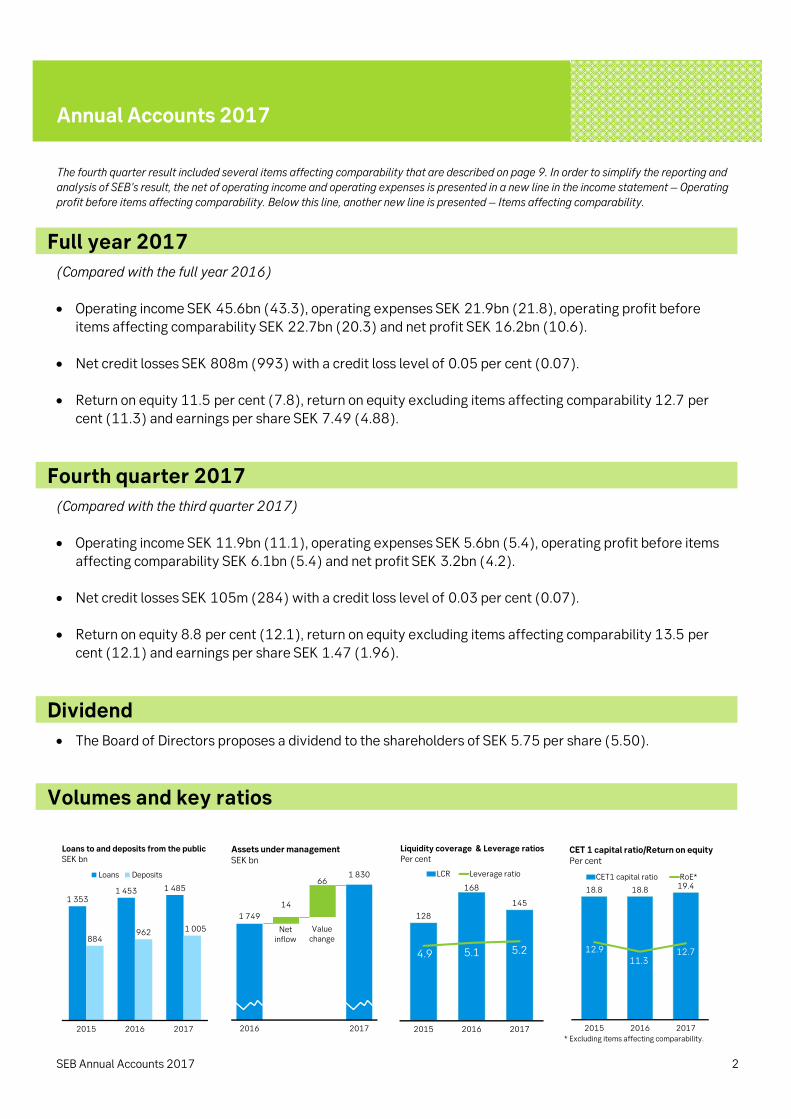
Volumes and key ratios
1 3531 453 1 485
884962 1 005
2015 2016 2017
Loans Deposits
Loans to and deposits from the publicSEK bn
*
1 749
1 830
14
66
2016 2017
Assets under managementSEK bn
Net inflow
Value change
*
128
168
145
4.9 5.1 5.2
2015 2016 2017
LCR Leverage ratio
Liquidity coverage & Leverage ratiosPer cent
*
18.8 18.8 19.4
12.9
11.312.7
2015 2016 2017
CET1 capital ratio RoE*
CET 1 capital ratio/Return on equityPer cent
* Excluding items affecting comparability.
SEB Annual Accounts 2017 3
President’s comment
As we close the books on 2017 we can conclude that the macroeconomic sentiment – and thereby business sentiment – has grown more positive. Spurred by more jobs, higher asset prices and higher investment levels as well as increased trade, the world economy is gearing up
despite heightened geopolitical uncertainty. The Eurozone as well as Sweden have now experienced negative rates for more than three years. Global equity markets have risen by more than 50 per cent in the past two years while market volatility has remained low. At the
same time, long-term trends such as the demographic shift with ageing populations and technology change seem to affect the global economic environment towards an extended period of increased savings and low interest rates. Central banks have a difficult balancing act
to return to a more conventional monetary policy going forward.
High customer activity and diverse business mix generate robust profit growth SEB has set the strategic aspiration to be the leading Nordic bank for corporations and
institutions and the top universal bank in Sweden and the Baltic countries. During the year, all customer segments increased their activity levels. Large corporate clients benefitted from favourable financing conditions and improved growth prospects. IPO and M&A activity picked
up and debt capital markets saw high activity, albeit demand for traditional bank financing was subdued. Financial institution customers continued to enjoy strong equity markets but were also challenged by the abundance of liquidity and diverging bond markets. Financial institutions
face an increasingly complex regulatory environment and here we have been able to support them through our broad custody offering including also administrative and back office services. In the more positive business sentiment, small and medium-sized corporate customers in
Sweden and the Baltic countries increased their demand for lending. As part of the implementation of the new MiFID regulation, we enhanced our offering to private banking customers. Assets under management increased by SEK 80bn to SEK 1,830bn. The Swedish
housing market seem to be stabilising and SEB grew the mortgage portfolio below market pace. All in all, operating income grew by 5 per cent, while underlying operating expenses were
stable at below SEK 22bn. Asset quality remained very high and operating profit before items
affecting comparability grew by 12 per cent. This means that with the Common Equity Tier 1 capital ratio at 19.4 per cent, return on equity reached 12.7 per cent.
Growing SEB’s core business and stepping up the transformation agenda
Since the start of our business plan for 2016-2018, we have grown corporate lending by 6 per cent, FX-adjusted. In the LC&FI division, new clients account for 15 per cent of client income. In Sweden we have broadened our corporate foothold with 16 500 more SME customers. In the
private segment, we see that digital on-boarding is appreciated by customers. Close to one third of all digital mortgage applications are converted into loans. We have stepped up our transformation agenda by increasingly focusing on areas where we have scale and can add
value as well as simplifying processes and increasing customer convenience and accessibility. In an environment of rapid technological development but also more complexity, speed,
agility and transparency are increasingly important. Two weeks ago, we communicated the
impact of new accounting principles, impairment of IT assets and restructuring costs for the transformation of our German business into a branch with full focus on German corporate and financial institution customers. In December, we signed an agreement with Danica (a subsidiary
to Danske Bank) to divest SEB Pension in Denmark – a business that we have developed considerably over the past ten years. The regulatory approval is pending. The divestment creates further flexibility to continue to grow and invest in our core customer segments.
We are well positioned to continue to deliver solid customer value and profit growth as we are now starting the work to set the direction for the next phase from 2019 and onwards for our Vision 2025. However, first we want to continue to deliver on the last year of our current
business plan and financial targets including our cost cap of SEK 22bn. The whole SEB team is deeply committed to deliver world-class service in everything we do so that we can be the preferred choice over the long-term in the eyes of our customers.

SEB Annual Accounts 2017 4
The Group
The full year 2017Operating profit before items affecting comparability increased by 12 per cent and amounted to SEK 22,702m (20,296). Net profit (after tax) amounted to SEK 16,244m (10,618). Operating income Total operating income increased by 5 per cent to
SEK 45,609m (43,251). Net interest income amounted to SEK 19,893m
representing an increase of 6 per cent year-on-year (18,738). Both the Swedish repo rate and the ECB euro refinancing interest rate remained unchanged, at -0.5 and zero per cent, respectively.
Change
SEK m 2017 2016 %
Customer-driven NII 21 794 20 464 6
NII from other activities -1 901 -1 726 10
Total 19 893 18 738 6
Jan–Dec
Year-on-year, customer-driven net interest income
increased by SEK 1,330m. Lending volumes and lending margins contributed positively in roughly equal parts. Deposit margins were down due to effects from the
negative interest rates that were not reflected in customer pricing. The deposit volume effect on the change in net interest income was negligible.
Net interest income from other activities decreased by SEK 175m, year-on-year. Regulatory fees, including resolution fund and deposit guarantee fees were SEK 436m higher than 2016 and amounted to SEK 1,798m (1,362). In 2016, a resolution fund fee of 4.5 basis points applied to the adjusted balance sheet volumes was charged, versus 9 basis points for the year 2017. In 2018, the fee will be 12.5 basis points. The resolution fund fee beyond 2018 is outlined on page 10.
Net fee and commission income increased by 7 per cent and amounted to SEK 17,725m (16,628). Corporate customers were active in the capital markets taking advantage of the low interest rate levels. The gross related fees from the issue of securities and advisory fees increased by SEK 367m year-on-year. Corporate demand for new traditional lending was lower, especially among large corporations, and gross
lending fees were down by 11 per cent compared to 2016. The stock market values increased during the year. Both market values and new business volumes combined led to an increase in gross fee income related to custody and mutual funds in the amount of SEK 776m to SEK 8,040m. Out of this amount, total performance and transaction fees increased by SEK 81m to SEK 356m (275). Net payments and card fees increased by 6 per cent, SEK 191m, year-on-year. Gross life insurance commissions related to the unit-linked insurance business increased by SEK 54m.
Net financial income decreased by 3 per cent to SEK 6,880m (7,056). High volatility and market activity characterised the beginning of 2017, but this subsided to a low level for the rest of the year. The market conditions affected credit spreads which in turn led to a positive change in the fair value credit adjustment1).
Compared to 2016, this adjustment increased by SEK 429m to SEK 210m (-219).
Net other income increased by 34 per cent to SEK 1,112m (829). Realised capital gains as well as unrealised valuation and hedge accounting effects were included in this line item. Operating expenses Total operating expenses were stable at SEK 21,936m
(21,812). A 3 per cent decrease in staff costs was offset by an increase in other expenses. The average number of full time equivalents decreased by 333
compared to 2016, to 14,946. SEB’s cost cap remains unchanged at SEK 22bn for 2018. Net credit losses and provisions Net credit losses were low at SEK 808m (993). The credit loss level was 5 basis points (7).
Items affecting comparability The net total of items affecting comparability, was an expense of SEK -1,896m (-5,429). See page 9 for
detailed information.
1) Valuation of counterparty risk (CVA) and own credit risk in derivatives (DVA) as well as own credit risk for issued bonds at fair value (OCA).
Comparative numbers (in parenthesis): The result for the full year 2017 is compared to the full year 2016. The fourth quarter 2017 result is compared to the third quarter 2017. Business volumes are compared to year-end 2016, unless otherwise stated.

SEB Annual Accounts 2017 5
Q4 Q3 Q4
SEK m 2017 2017 2016
Customer-driven NII 5 487 5 481 5 424
NII from other activities -303 -401 -626
Total 5 184 5 080 4 798
Income tax expense Income tax expense increased by 7 per cent and amounted to SEK 4,562m (4,249). The effective tax rate for the year was 22 per cent. In both 2017 and 2016, there were tax effects from the items affecting comparability (see page 9). In 2017, new legislation was introduced in Sweden, which discontinued the tax deductibility of interest expenses on subordinated debt that qualifies as Tier 1 or Tier 2 capital. This increased income tax expenses by SEK 362m.
A dividend from the subsidiary in Estonia in the first quarter 2017 was taxed at the time of pay-out to the parent company. The tax amounted to SEK 72m.
Return on equity Return on equity for the full year was 11.5 per cent (7.8). Excluding items affecting comparability return on equity was 12.7 per cent (11.3). Other comprehensive income Other comprehensive income amounted to SEK -1,036m (-946).
The value of the pension plan assets exceeds the defined benefit obligations. The discount rate used for the pension obligation in Sweden was 2.2 per cent (2.4 at year-end 2016). The net value of the defined benefit pension plan assets and liabilities increased since year-end leading to other comprehensive income of SEK 784m (-1,875).
The net effect from the valuation of balance sheet items that may subsequently be reclassified to the income statement, i.e. the total of cash-flow hedges, available-for-sale financial assets and translation of foreign operations, was negative and amounted to SEK -1,820m (929). A dividend in the amount of SEK 494m was received from Visa Sweden and was reported as an item affecting comparability (see page 9). The dividend reduced the valuation of the holdings in Visa Sweden, which was recognised in the line item available-for-sale.
The fourth quarter 2017 Operating profit before items affecting comparability increased by 14 per cent compared with the third quarter to SEK 6,112m (5,380). Compared with the fourth quarter 2016, operating profit before items affecting comparability increased by 10 per cent. Net profit (after tax) decreased by 25 per cent to SEK 3,184m (4,243). Operating income Total operating income increased by 6 per cent to SEK 11,858m compared with the third quarter
(11,141) and increased by 2 per cent from SEK 11,618m in the fourth quarter 2016.
Net interest income, which amounted to SEK 5,184m, increased by 2 per cent compared with the previous quarter (5,080) and increased by 8 per cent year-on-year. Both the Swedish repo rate and the ECB euro refinancing interest rate were unchanged, at -0.5 and zero per cent respectively.
Customer-driven net interest income was virtually unchanged compared with the third quarter 2017. Both lending volumes and margins contributed positively at an equal degree to the net interest income, but this contribution was offset by a negative deposit margin effect.
Net interest income from other activities improved by SEK 98m compared to the third quarter 2017. Resolution fund and deposit guarantee fees combined decreased by SEK 64m to SEK 389m (453) since the actual deposit guarantee fee debited for the year was lower than expected. Compared with the fourth quarter 2016, the resolution fund and deposit guarantee fees increased by SEK 58m.
Net fee and commission income increased by 18 per cent to SEK 4,739m (4,026) and increased by 3 per cent compared with the fourth quarter 2016.
The seasonal slowdown in customer activity noted in the third quarter reversed and corporate activity both in capital markets and customer demand for traditional lending increased. Gross fees from the issue of securities and advisory fees increased by SEK 180m compared to the third quarter and by SEK 86m year-on-year while gross lending fees were up by SEK 83m in the quarter.
SEB Annual Accounts 2017 6
Average stock market values increased during the quarter and gross fee income from custody and mutual funds at SEK 2,210m increased by 14 per cent, SEK 268m. Total performance and transaction fees increased by SEK 186m and amounted to SEK 225m (39). Net payments and card fees increased by 8 per cent, while net commissions relating to the unit-linked life insurance business were almost flat.
Net financial income decreased by 6 per cent to SEK 1,630m (1,726) and was down by 20 per cent compared to the fourth quarter 2016. The fair value credit adjustment1) decreased by SEK 230m in the fourth quarter and amounted to SEK 61m (291). The financial markets were calm with low volatility and activity levels. Institutional customers had a limited need to reallocate their portfolios or adjust their hedging solutions. The net financial income relating mainly to the traditional life insurance operations in Sweden and Denmark decreased by SEK 65m to SEK 429m (494).
Net other income was virtually unchanged at SEK 305m (308) in the fourth quarter and increased by 76 per cent compared to the fourth quarter 2016. Realised capital gains and unrealised valuation as well as hedge accounting effects were included in this line item.
Operating expenses Total operating expenses increased by 3 per cent to SEK 5,605m (5,423). There was a seasonal increase in staff costs in the amount of SEK 145m.
Net credit losses and provisions Net credit losses decreased by 63 per cent to SEK 105m (284). The credit loss level was 3 basis points (7). Items affecting comparability The net total of items affecting comparability was an expense of SEK 1,896m (0). See page 9 for detailed
information. Income tax expense Total income tax expense decreased by 9 per cent to SEK 1,032m (1,138). The effective tax rate for the fourth quarter was 24 per cent (21).
1) Valuation of counterparty risk (CVA) and own credit risk in derivatives (DVA) as well as own credit risk for issued bonds at fair value (OCA).
Return on equity Return on equity for the fourth quarter was 8.8 per cent (12.1). Excluding items affecting comparability, the return on equity was 13.5 per cent (12.1). Other comprehensive income The other comprehensive income amounted to SEK -1,688m (-75).
The value of the pension plan assets exceeds the defined benefit obligations. The discount rate for the pension obligation in Sweden at 2.2 per cent was unchanged in the quarter. In Germany, the discount rate was unchanged at 1.9 per cent. The defined benefit obligation decreased while the market value of the pension assets was virtually unchanged. The net effect from the net defined benefit obligation on other comprehensive income was SEK -927m (266).
The net effect from the valuation of balance sheet items that may subsequently be reclassified to the income statement, i.e. the total of cash-flow hedges, available-for-sale financial assets and translation of foreign operations, was negative in the amount of SEK -760m (-340). A dividend in the amount of SEK 494m was received from Visa Sweden and was reported as an item affecting comparability (see page 9). The dividend reduced the valuation recognised in the line item available-for-sale with the same amount.

SEB Annual Accounts 2017 7
Dec Dec
SEK bn 2017 2016
General governments 17 35
Households 300 277
Corporates 645 605
Repos 6 1
Other 37 44
Deposits and borrowings from the public 1 005 962
Business volumes Total assets at the end of the year were SEK 2,560bn, which was a decrease by SEK 61bn during the year (2,621). Loans
Dec Dec
SEK bn 2017 2016
General governments 34 28
Households 576 549
Corporates 805 786
Repos 42 63
Debt securities 13 15
Other 14 12
Loans to the public 1 485 1 453 Loans to the public (on the balance sheet) amounted to SEK 1,485bn, an increase of SEK 32bn during the year. The credit portfolio (in which loans, commitments and derivatives are included), excluding banks, increased by SEK 25bn to SEK 2,061bn (2,036).
The credit portfolio increased mainly due to growth in Swedish and Baltic household mortgage lending in the amount of SEK 22bn and Swedish housing cooperative associations by SEK 7bn. The real estate management credit portfolio decreased by SEK 8bn year-on-year, while the corporate credit portfolio remained stable.
Deposits
Deposits and borrowings from the public amounted to SEK 1,005bn. Corporate deposits increased by SEK 40bn during the year. Household deposits increased by SEK 23bn.
Assets under management and custody Total assets under management amounted to SEK 1,830bn (1,749). The net inflow of assets during the year was SEK 14bn and the market value increased by SEK 66bn.
Assets under custody increased partly reflecting the increased stock market values since year-end and amounted to SEK 8,046m (6,859).
Risk and capital Market risk SEB’s business model is driven by customer demand. Value-at-Risk (VaR) in the trading operations averaged SEK 91m in 2017 (112). On average, the Group does not expect to lose more than this amount during a period of ten trading days, with 99 per cent probability.
VaR was relatively stable during the year as the volatility across all asset classes continued to be limited while exposure from equity options was reduced. In the fourth quarter, tighter credit spreads and smaller FX exposures also contributed to lower VaR. Liquidity and long-term funding Short-term funding in the form of commercial paper and certificates of deposit decreased by SEK 44bn from year-end 2016.
SEK 87bn of long-term funding matured during 2017 (of which SEK 47bn covered bonds, SEK 28bn senior debt and SEK 12bn subordinated debt). During the year new issues amounted to SEK 80bn (of which SEK 55bn constituted covered bonds, SEK 20bn senior debt and SEK 5bn additional tier 1 subordinated debt). SEB’s inaugural own green bond in the amount of EUR 500m was part of the senior funding raised.
The liquidity reserve, as defined by the Swedish Bankers’ Association, amounted to SEK 340bn at the end of the year (427).
The Liquidity Coverage Ratio (LCR), according to the rules adapted for Sweden by the Swedish Financial Supervisory Authority (SFSA), must be at least 100 per cent in total and in EUR and USD, respectively. At the end of the period, the LCR was 145 per cent (168). The USD and EUR LCRs were 284 and 217 per cent, respectively.
The Bank is committed to a stable funding base. SEB’s internal structural liquidity measure, which measures the proportion of stable funding in relation to illiquid assets, Core Gap, was 108 per cent (114). Rating Moody's rates SEB’s long-term senior unsecured debt at Aa3 with a stable outlook due to SEB’s asset quality, earnings stability and diversification as well as increased efficiency.
Fitch rates SEB’s long-term senior unsecured debt at AA- with a stable outlook. The outlook is based on SEB’s long-term strategy, earnings stability and diversification.
S&P rates SEB’s long-term senior unsecured debt at A+ with a stable outlook. The outlook is based on the bank’s strong capital and well diversified earnings in terms of geography and business areas.

SEB Annual Accounts 2017 8
Capital position SEB’s Common Equity Tier 1 (CET1) capital ratio was 19.4 per cent. SEB's estimate of the full pillar 1 and 2 CET1 capital requirements – where the pillar 2
requirements were calculated according to the methods set by the SFSA – was 17.2 per cent per year-end 2017. In the first quarter, the SFSA increased the
countercyclical buffer requirement by 0.5 percentage points to 2.0 per cent. The Bank aims to have a buffer of around 150 basis points above the capital requirement.
SEB’s application to use a revised internal model for corporate exposure risk-weights is under consideration by the SFSA. If approved, the risk exposure amount (REA) is expected to increase. However, the temporary pillar 2 capital buffer requirement, which currently is 0.5 per cent, will be discontinued.
On 7 December 2017, the Group of Governors and Heads of Supervision agreed a package to complete the revisions to Basel III standards (“Basel IV”). The standards cover the standardised and internal ratings based approaches to credit risk, operational risk, and the application of an output floor. The output floor was set at 72.5 per cent based on the standardised approaches with a gradual phase-in starting in 2022 with full application in 2027.
SEB has a solid capital position as well as capital generation which, combined with the long phase-in period, provides the bank with a strong basis to comply with the finalised Basel III standards and the current dividend policy can be maintained. There are, however, still large uncertainties regarding the final calibration of the proposals and possible implications for SEB. These uncertainties mainly consist of how the standards might be revised when implemented into EU legislation and to what degree the SFSA might change the calibration of the current Swedish capital requirements.
The following table shows the REA and capital ratios according to Basel III:
Dec Dec
Own funds requirement, Basel III 2017 2016
Risk exposure amount, SEK bn 611 610
Common Equity Tier 1 capital ratio, % 19.4 18.8
Tier 1 capital ratio, % 21.6 21.2
Total capital ratio, % 24.2 24.8
Leverage ratio, % 5.2 5.1 Total REA remained unchanged over the year. The increase in credit volumes led to higher credit risk REA, which however was largely offset by foreign exchange movements and improved asset quality. Market risk REA decreased by SEK 4bn.
The total capital ratio decreased when issued Tier 2 subordinated debt in the amount of EUR 750m was repaid in September. SEB also called subordinated debt in the amount of EUR 500m in December. The capital base reflected this event already as of 30 September, since SEB had applied for approval from the SFSA to call the capital.
The effects from the items affecting comparability are included in the CET1 ratio for 2017. The effects from IFRS 9 and 15 will be included in the first quarter 2018. Long-term financial targets SEB’s long-term financial targets are: - to pay a yearly dividend that is 40 per cent or above
of the earnings per share,
- to maintain a Common Equity Tier 1 capital ratio of around 150 bps above the current requirement from the SFSA, and
- to generate a return on equity that is competitive with peers.
In the long term, SEB aspires to reach a sustainable return on equity of 15 per cent. Dividend The Board proposes to the Annual General Meeting a
dividend of SEK 5.75 per Class A and Class C share, which corresponds to a pay-out ratio of 77 per cent. Excluding items affecting comparability the pay-out
ratio was 70 per cent. The total dividend amounts to SEK 12.5bn (11.9), calculated on the total number of issued shares as per 31 December 2017, excluding own
shares held. The proposal shall be seen with reference to the dividend policy, the outlook for the economic environment, the Group’s earnings generation and
capital situation. The SEB share will be traded ex-dividend on
27 March 2018. The proposed record date for the
dividend is 28 March 2018 and dividend payments will be disbursed on 4 April 2018.
SEB Annual Accounts 2017 9
Other information On 19 January 2018, SEB communicated the financial impact of items affecting comparability and changes in accounting policies. Items affecting comparability In order to facilitate the comparison of SEB’s underlying operating profit between time periods, SEB has moved items affecting comparability to be presented as a separate line in the income statement.
For a summary and an analysis of which lines in the income statement that would have been impacted without the presentation change, see table Items affecting comparability on page 27. Items affecting comparability 2017 The total expense in the income statement from Items affecting comparability was SEK 1,896m before tax and SEK 1,681m after tax.
In total, the items affecting comparability, including the effect on other comprehensive income of SEK 494m, decreased equity by SEK 2,175m. Visa Sweden The settlement of the acquisition of Visa Europe by Visa
Inc. consists of a combination of cash and shares to be paid to the different Visa Europe members. In Sweden, SEB is an indirect member. In the fourth quarter a
dividend of SEK 494m was received after an agreement was reached regarding the allocation of the settlement between the members. There was no tax effect.
The holdings in Visa have been classified as an Available-for-sale asset where the change in value was recognised in Other comprehensive income. The dividend received has reduced the amount in Other comprehensive income by SEK 494m.
SEB’s German business In line with previous communication, the core business in Germany was transferred from SEB AG to the German branch of the parent company, Skandinaviska Enskilda
Banken AB, as per 2 January 2018. The purpose of the change is to simplify the reporting and administration of the German operations. The non-core business that was
not transferred to the branch from SEB AG will be dismantled over time.
The provisions related to redundancy and excess
premises amounting to a total of SEK 521m were recognised in the fourth quarter. In addition, SEB entered into an agreement to transfer the pension
obligations under the defined benefit plan in SEB AG to Versicherungsverein des Bankgewerbes a.G (BVV) at a cost of SEK 891m in the fourth quarter. The transfer will
take place in the second quarter 2018.
Impairment and derecognition of intangible IT assets In the fourth quarter, an impairment and a derecognition of intangible IT assets led to an expense in an amount of SEK 978m. The positive tax effect was SEK 215m. Items affecting comparability 2016 The total effect of Items affecting comparability in 2016 was a cost in the amount of SEK 5,429m before tax and SEK 5,352m after tax. Visa Baltic The settlement of the transaction of SEB’s Baltic holdings in Visa Europe resulted in a gain of SEK 520m in the second quarter 2016. The gain generated a tax
expense of SEK 24m. Reorganisation and restructuring SEB implemented a new customer-oriented organisation
which resulted in an impairment of goodwill in the amount of SEK 5,334m in the first quarter 2016. This expense was not tax deductible.
There were financial effects from restructuring activities in the Baltic and German businesses as well as an impairment and derecognition of intangible IT assets
no longer in use. The total amount was SEK 615m and there was a positive tax effect amounting to SEK 101m in the first quarter 2016.
Changes in accounting policies in 2018 As of 1 January 2018, IFRS 9 Financial Instruments and IFRS 15 Revenue from Contracts with Customers came into force. IFRS 9 replaced IAS 39 Financial Instruments: Recognition and Measurement and IFRS 15 replaced IAS 18 Revenue.
The impact from IFRS 9 will be recognised as an
adjustment to retained earnings at 1 January 2018. The impact from IFRS 15 will be recognised as an adjustment of retained earnings at 1 January 2017. The
adjustments will reduce retained earnings by SEK 5 967m.
IFRS 9 Financial Instruments IFRS 9 introduces new requirements in mainly three areas that are described below. The total effect will reduce the 2018 opening retained earnings balance by SEK 3,281m.

SEB Annual Accounts 2017 10
1. Classification and measurement The requirements imply a smaller change in the classification and measurement of financial assets. The Available-for-sale category under IAS 39, where market
valuations were reported in Other comprehensive income, will cease and valuations of fair value will going forward be reported in Net financial income. Certain
holdings in Treasury that were classified as Available-for-sale will now be measured at amortised cost. As a result, the positive fair value in the amount of SEK 264m
will be derecognised. Regarding the classification and measurement of
financial liabilities the rules entail a change of reporting
own credit risk adjustment (OCA). Under IAS 39, the change in OCA was reported in Net financial income but will going forward be reported in Other comprehensive
income. The classification of bonds issued by SEB AG maturing beyond the year 2020 will be changed to fair value through profit or loss from amortised cost. This
will reduce opening balance of retained earnings by SEK 1,847m. 2. Impairment of credit losses The impairment model for credit losses was changed from an incurred loss model to an expected loss model. The increase in the credit loss reserves is driven by three main factors: Firstly, all items in scope are each assigned a reserve. Secondly, an increase of credit reserves on the retail portfolios. Thirdly, the incorporation of a negative scenario in the calculation of the expected losses.
The change will lead to an increase of the credit reserves at an amount of SEK 1,578m. The net effect after tax will be a SEK 1,170m reduction of retained earnings. Going forward the application of the IFRS 9 requirements will probably increase volatility in profit and loss. 3. Hedge accounting The new hedge accounting rules do not yet cover macro hedge accounting. There is an option to remain with IAS 39 accounting standards which SEB has chosen to utilise.
IFRS 15 Revenue from Contracts with Customers As communicated in the third quarter interim report, the main effect from IFRS 15 on SEB is that the treatment of contract costs for investment contracts within Life will change so that a smaller part of deferred acquisition costs (DAC) is recognised as an asset. The change will result in a decrease of the deferred acquisition cost in the balance sheet of SEK 2,640m. The effect will be recognised in the first quarter 2018, as a reduction of the opening balance of retained earnings as per 1 January 2017. Similarly, net fees and commissions in the 2017 income statement will be restated reducing income by SEK 47m. Changes in resolution fund fee requirements Swedish authorities have decided that the resolution fund fee for 2018 shall be 0.125 per cent applied to the adjusted 2016 balance sheet volumes. The fee will be reduced to 0.09 per cent for 2019 and to 0.05 per cent from 2020 until the fund target is met. The fund target level, which is proposed to be 3 per cent of guaranteed deposits, is expected to be reached by the year 2025. Divestment of SEB Pension Denmark On 14 December 2017 SEB signed an agreement to sell all shares in SEB Pensionsforsikring A/S and SEB Administration A/S (SEB Pension) to Danica Pension livsforsikringsaktieselskab (Danica, a subsidiary to Danske Bank) for total proceeds of DKK 6.5bn, consisting of a cash consideration of DKK 5.0bn and a pre-closing dividend of DKK 1.5bn. The pre-closing dividend will be in addition to the dividend of DKK 1.1bn which SEB received in the first six months of 2017.
As per year-end 2017, assets under management by SEB Pension amounted to DKK 101bn, and the net profit contribution was DKK 490m for the year. The effect on key financial ratios, on a pro forma basis will be limited. The Common Equity Tier 1 ratio will improve by approximately 0.60 percentage points and earnings per share will see a limited negative impact. The divestment reduces SEB's exposure to market risk.

SEB Annual Accounts 2017 11
The completion of the sale is among other things conditional upon regulatory approvals and certain preparations for separation and is currently expected to occur during the summer of 2018.
There was no profit or loss effect from the transaction in 2017, but the assets and liabilities pertaining to SEB Pension were reclassified to Assets
and liabilities held for sale as of the fourth quarter. Risks and uncertainties SEB assumes credit, market, liquidity, IT and operational as well as life insurance risks. The risk composition of the Group, as well as the related risk, liquidity and capital management, are described in SEB’s Annual Report for 2016 (see page 40-45 and notes 17, 19 and 20), in the Capital Adequacy and Risk Management Report for 2016 and the quarterly additional Pillar 3 disclosures for 2017. Further information is presented in the Fact Book on a quarterly basis.
The outlook for the world economy is increasingly positive and risks are less prominent. However, large global economic imbalances remain and the potential
reduction of liquidity support to financial markets from central banks world-wide may create direct and indirect effects that are difficult to assess. There are signs that the Swedish central bank may not further cut interest rates and may introduce a hike during the autumn 2018. Geopolitical uncertainty has increased. The process forward for Brexit has added to the uncertainty. Recently there have been signs of a slow-down in the residential Swedish real estate market.
The German Federal Ministry of Finance issued a circular on 17 July 2017 with administrative guidance in relation to withholding taxes on dividends in connection with certain cross-border securities lending and derivative transactions. The circular states an intention to examine transactions executed prior to the change in tax legislation that was enacted 1 January 2016. Following a review, SEB is of the opinion that the cross-border securities lending and derivative trans-actions of SEB up until 1 January 2016 were conducted in compliance with then prevailing rules. It can nevertheless not be ruled out that a change in policy of German authorities may have financial effects on SEB.

SEB Annual Accounts 2017 12
Stockholm, 31 January 2018 The President declares that the Annual Accounts for the year 2017 provide a fair overview of the Parent Company’s and the Group’s operations, their financial position and results and describe material risks and uncertainties facing the Parent Company and the Group.
Johan Torgeby President and Chief Executive Officer
Press conference and webcasts The press conference at 9.30 CET on 31 January 2018,
at Kungsträdgårdsgatan 8 with the President and CEO Johan Torgeby can be followed live in Swedish on sebgroup.com/sv/ir. A simultaneous translation into
English will be available on sebgroup.com/ir. A replay will be available afterwards. Access to telephone conference The telephone conference at 13.00 CET 31 January 2018 with the President and CEO, Johan Torgeby, the CFO Jan Erik Back and the Head of Investor Relations,
Jonas Söderberg, can be accessed by telephone, +44(0)1452 541 003. Please quote conference id: 9890317 and call at least 10 minutes in advance. A
replay of the conference call will be available on sebgroup.com/ir.
Further information is available from: Jan Erik Back, Chief Financial Officer
Tel: +46 8 22 19 00 Jonas Söderberg, Head of Investor Relations Tel: +46 8 763 83 19, +46 73 521 02 66
Viveka Hirdman-Ryrberg, Head of Corporate Communications Tel: +46 70 550 35 00
Skandinaviska Enskilda Banken AB (publ.) SE-106 40 Stockholm, Sweden
Telephone: +46 771 62 10 00 sebgroup.com Corporate organisation number: 502032-9081
Further financial information is available in SEB’s Fact Book and in the additional Pillar 3 disclosures which are published quarterly on sebgroup.com/ir.
Financial information calendar 2018 5 March Annual Report 2017 published on sebgroup.com
26 March Annual General Meeting 30 April Interim Report January-March The silent period starts 10 April 17 July Interim Report January-June The silent period starts 7 July
25 October Interim Report January-September The silent period starts 8 October
The financial information calendar for 2019 will be published in conjunction with the Interim Report for January-September 2018.

SEB Annual Accounts 2017 13
Accounting policiesThis Interim Report is presented in accordance with IAS 34 Interim Financial Reporting. The Group’s consolidated accounts have been prepared in accordance with the
International Financial Reporting Standards (IFRS) and interpretations of these standards as adopted by the European Commission. The accounting also follows the
Annual Accounts Act for Credit Institutions and Securities Companies (1995:1559) and the regulation and general guidelines issued by the Swedish Financial Supervisory
Authority: Annual Reports in Credit Institutions and Securities Companies (FFFS 2008:25). In addition, the Supplementary Accounting Rules for Groups (RFR 1) from
the Swedish Financial Reporting Board have been applied. The Parent Company has prepared its accounts in accordance with Swedish Annual Act for Credit
Institutions and Securities Companies, the Swedish Financial Supervisory Authority’s Regulations and General Guidelines (FFFS 2008:25) on Annual Reports in
Credit Institutions and Securities Companies and the Supplementary Accounting Rules for Legal Entities (RFR 2) issued by the Swedish Financial Reporting Board.
As of 1 January 2017 there are clarifications of several IFRS standards. IAS 12 Income Taxes has been amended regarding recognition of deferred tax assets
for unrealised losses. IAS 7 Statements of Cash Flows has been amended and IFRS 12 Disclosure of Interests in
Other Entities has been clarified. These amendments were applicable as of 1 January 2017. The EU has endorsed the amendment to IAS 12 and IAS 7, but not
yet the amendment of IFRS 12. The changes have not had a material effect on the financial statements of the Group or on capital adequacy and large exposures.
See page 9, Changes in accounting policies in 2018, for information on the impact from IFRS 9 Financial Instruments and IFRS 15 Revenue from Contracts with
Customers. The Group changed the presentation of the income
statement in the fourth quarter 2017 by adding a line, Items affecting comparability. The Group also added a line with the net of operating income and operating expenses, Operating profit before items affecting
comparability. See page 42 for a definition of items affecting comparability.The purpose of the change is to simplify reporting and facilitate the comparison of
operating profit between time periods. The change applies as of 1 January 2017 and comparative numbers have been changed.
In all other material aspects, the Group’s and the Parent Company’s accounting policies, basis for calculations and presentations are unchanged in
comparison with the 2016 Annual Report.
Review reportWe have reviewed this interim report for the period 1 January 2017 to 31 December 2017 for Skandinaviska Enskilda Banken AB (publ.). The Board of Directors and the CEO are responsible for the preparation and presentation of this interim report in accordance with IAS 34 and the Swedish Annual Accounts Act for Credit institutions and Securities
Companies. Our responsibility is to express a conclusion on this interim report based on our review. We conducted our review in accordance with the International Standard on Review Engagements, ISRE 2410, Review
of Interim Report Performed by the Independent Auditor of the Entity. A review consists of making inquiries, primarily of persons responsible for financial and accounting matters, and applying analytical and other review procedures. A review is substantially less in scope than an audit conducted in accordance with International Standards on Auditing, ISA, and other generally accepted auditing standards in Sweden. The procedures performed in a review do not enable us to obtain assurance that we would become aware of all significant matters that might be identified in an audit. Accordingly, we do not express an audit opinion.
Based on our review, nothing has come to our attention that causes us to believe that the interim report is not prepared, in all material respects, in accordance with IAS 34 and the Swedish Annual Accounts Act for Credit institutions and Securities Companies regarding the Group, and with the Swedish Annual Accounts Act for Credit institutions and Securities Companies, regarding the Parent Company. Stockholm 31 January 2018
PricewaterhouseCoopers AB
Peter Nyllinge Martin By Authorised Public Accountant Authorised Public Accountant Partner in charge

SEB Annual Accounts 2017 14
The SEB Group
Income statement – SEB Group
Q4 Q3 Q4
SEK m 2017 2017 % 2016 % 2017 20161) %
Net interest income 5 184 5 080 2 4 798 8 19 893 18 738 6Net fee and commission income 4 739 4 026 18 4 609 3 17 725 16 628 7
Net financial income 1 630 1 726 -6 2 038 -20 6 880 7 056 -3Net other income 305 308 -1 173 76 1 112 829 34Total operating income 11 858 11 141 6 11 618 2 45 609 43 251 5
Staff costs -3 523 -3 378 4 -3 774 -7 -14 025 -14 422 -3Other expenses -1 830 -1 719 6 -1 727 6 -6 947 -6 619 5
Depreciation, amortisation and
impairment of tangible and intangible
assets - 252 - 325 -23 - 208 21 - 964 - 771 25Total operating expenses -5 605 -5 423 3 -5 709 -2 -21 936 -21 812 1
Profit before credit losses 6 253 5 719 9 5 909 6 23 672 21 439 10
Gains less losses from tangible and
intangible assets - 37 - 54 -32 - 67 -45 - 162 - 150 8
Net credit losses - 105 - 284 -63 - 284 -63 - 808 - 993 -19
Operating profit before
items affecting comparability 6 112 5 380 14 5 558 10 22 702 20 296 12
Items affecting comparability -1 896 -1 896 -5 429
Operating profit 4 216 5 380 -22 5 558 -24 20 806 14 867 40
Income tax expense -1 032 -1 138 -9 -1 314 -21 -4 562 -4 249 7
Net profit 3 184 4 243 -25 4 244 -25 16 244 10 618 53
Attributable to shareholders 3 184 4 243 -25 4 244 -25 16 244 10 618
Basic earnings per share, SEK 1.47 1.96 1.96 7.49 4.88
Diluted earnings per share, SEK 1.46 1.95 1.95 7.46 4.85
Jan–Dec
1) Items affectecting comparability reclassified.
Statement of comprehensive income – SEB Group
Q4 Q3 Q4
SEK m 2017 2017 % 2016 % 2017 2016 %
Net profit 3 184 4 243 -25 4 244 -25 16 244 10 618 53
Items that may subsequently be reclassified to the income statement:
Available-for-sale financial assets - 729 - 84 - 91 - 909 990
Cash flow hedges - 261 - 286 -9 - 473 -45 -1 207 - 811 49
Translation of foreign operations 230 30 - 94 296 750 -61
Items that will not be reclassified to the income statement:
Defined benefit plans - 927 266 1 883 784 -1 875
Other comprehensive income
(net of tax) - 1 688 - 75 1 225 - 1 036 - 946 10
Total comprehensive income 1 495 4 168 -64 5 469 -73 15 208 9 672 57
Attributable to shareholders 1 495 4 168 -64 5 469 -73 15 208 9 672 57
Jan–Dec

SEB Annual Accounts 2017 15
Balance sheet – SEB Group
31 Dec 31 Dec
SEK m 2017 2016
Cash and cash balances with central banks 177 222 151 078
Other lending to central banks 12 778 66 730
Loans to credit institutions1) 34 715 50 527
Loans to the public 1 484 803 1 453 019
Financial assets at fair value through profit or loss 2)575 955 785 026
Fair value changes of hedged items in a portfolio hedge 93 111
Available-for-sale financial assets2)27 776 35 747
Investments in subsidiaries and associates 1 314 1 238
Tangible and intangible assets 12 052 20 158
Other assets 48 877 56 425
Non-current assets and disposal groups classified as held for sale 184 011 587
Total assets 2 559 596 2 620 646
Deposits from central banks and credit institutions3)
89 076 119 864
Deposits and borrowing from the public3)
1 004 721 962 028
Liabilities to policyholders 303 202 403 831
Debt securities issued 614 033 668 880
Financial liabilities at fair value through profit or loss 114 313 213 496
Fair value changes of hedged items in a portfolio hedge 1 046 1 537
Other liabilities 75 170 67 082
Provisions 3 009 2 233
Subordinated liabilities 32 390 40 719
Liabilities of disposal groups classified as held for sale 178 710
Total equity 143 925 140 976
Total liabilities and equity 2 559 596 2 620 646
2) Whereof bonds and other interest bearing securities. 162 827 252 421
3) Deposits covered by deposit guarantees. 285 439 252 815
1) Loans to credit institutions and liquidity placements with other direct participants in interbank fund
transfer systems.
A more detailed balance sheet is included in the Fact Book.
Pledged assets, contingent liabilities and commitments – SEB Group
31 Dec 31 Dec
SEK m 2017 2016
Pledged assets for own liabilities1)
477 220 478 998
Pledged assets for liabilities to insurance policyholders 436 890 403 831
Other pledged assets2)
136 998 154 518
Pledged assets 1 051 109 1 037 347
Contingent liabilities3)
122 896 120 231
Commitments 563 181 655 350
Contingent liabilities and commitments 686 077 775 581
2) Of which securities lending SEK 59,443m (61,498) and pledged but unencumbered bonds SEK 57,390m
(80,718).
1) Of which collateralised for covered bonds SEK 355,587m (346,585).
3) Of which credit guarantees SEK 11,419m (14,309).

SEB Annual Accounts 2017 16
Key figures – SEB Group
Q4 Q3 Q4
2017 2017 2016 2017 2016
Return on equity, % 8.83 12.13 12.28 11.53 7.80
Return on equity excluding items affecting
comparability1)
, % 13.45 12.13 11.75 12.67 11.30
Return on total assets, % 0.45 0.59 0.60 0.57 0.37
Return on risk exposure amount, % 2.08 2.76 2.76 2.65 1.80
Cost/income ratio 0.47 0.49 0.49 0.48 0.50
Basic earnings per share, SEK 1.47 1.96 1.96 7.49 4.88
Weighted average number of shares2), millions 2 168 2 168 2 168 2 168 2 178
Diluted earnings per share, SEK 1.46 1.95 1.95 7.46 4.85
Weighted average number of diluted shares3)
, 2 179 2 179 2 178 2 178 2 188
Net worth per share, SEK 74.84 73.91 73.00 74.84 73.00
Equity per share, SEK 66.42 65.80 65.00 66.42 65.00
Average shareholders' equity, SEK, billion 144.2 139.9 138.2 140.9 136.2
Credit loss level, % 0.03 0.07 0.08 0.05 0.07
Liquidity Coverage Ratio (LCR)4), % 145 120 168 145 168
Own funds requirement, Basel III
Risk exposure amount, SEK m 610 819 614 619 609 959 610 819 609 959
Expressed as own funds requirement, SEK m 48 866 49 169 48 797 48 866 48 797
Common Equity Tier 1 capital ratio, % 19.4 19.2 18.8 19.4 18.8
Tier 1 capital ratio, % 21.6 21.5 21.2 21.6 21.2
Total capital ratio, % 24.2 24.0 24.8 24.2 24.8
Leverage ratio, % 5.2 4.7 5.1 5.2 5.1
Number of full time equivalents5)14 951 14 752 15 087 14 946 15 279
Assets under custody, SEK bn 8 046 7 801 6 859 8 046 6 859
Assets under management6), SEK bn 1 830 1 850 1 749 1 830 1 749
5) Quarterly numbers are for end of quarter. Accumulated numbers are average for the period.
1) Impairment of goodwill and restructuring effects in Q1 2016. Sale of shares in VISA Europe in the Baltic region in Q2
2016. Settlement of sale of shares in VISA Europe in Sweden, transformation of SEB's German business and impairments
and derecognitions of intangible IT assets in Q4 2017.
6) Adjusted definition implemented Q1 2017, comparatives 2016 calculated pro forma.
Jan–Dec
2) The number of issued shares was 2,194,171,802. SEB owned 25,177,693 Class A shares for the equity based
programmes at year-end 2016. During 2017 SEB has purchased 6,986,000 shares and 5,037,770 shares have been
sold. Thus, at 31 December 2017 SEB owned 27,125,923 Class A-shares with a market value of SEK 2,612m.
3) Calculated dilution based on the estimated economic value of the long-term incentive programmes.
4) According to Swedish FSA regulations for respective period.
In SEB’s Fact Book, this table is available with nine quarters of history.

SEB Annual Accounts 2017 17
Income statement on quarterly basis - SEB Group Q4 Q3 Q2 Q1 Q4
SEK m 2017 2017 2017 2017 2016
Net interest income 5 184 5 080 4 913 4 716 4 798
Net fee and commission income 4 739 4 026 4 691 4 268 4 609
Net financial income 1 630 1 726 1 461 2 063 2 038
Net other income 305 308 341 157 173Total operating income 11 858 11 141 11 405 11 204 11 618
Staff costs -3 523 -3 378 -3 533 -3 590 -3 774
Other expenses -1 830 -1 719 -1 741 -1 657 -1 727
Depreciation, amortisation and impairment of
tangible and intangible assets - 252 - 325 - 199 - 189 - 208
Total operating expenses -5 605 -5 423 -5 473 -5 436 -5 709
Profit before credit losses 6 253 5 719 5 933 5 767 5 909
Gains less losses from tangible and intangible assets - 37 - 54 - 37 - 34 - 67
Net credit losses - 105 - 284 - 214 - 204 - 284
Operating profit before
items affecting comparability 6 112 5 380 5 681 5 529 5 558
Items affecting comparability -1 896
Operating profit 4 216 5 380 5 681 5 529 5 558
Income tax expense -1 032 -1 138 -1 153 -1 239 -1 314
Net profit 3 184 4 243 4 528 4 290 4 244
Attributable to shareholders 3 184 4 243 4 528 4 290 4 244
Basic earnings per share, SEK 1.47 1.96 2.09 1.98 1.96
Diluted earnings per share, SEK 1.46 1.95 2.08 1.97 1.95

SEB Annual Accounts 2017 18
Income statement by division – SEB Group
Jan-Dec 2017, SEK m
Large
Corporates
& Financial
Institutions
Corporate &
Private
Customers Baltic
Life &
Investment
Management Other1)
Eliminations SEB GroupNet interest income 8 043 9 442 2 373 - 90 76 48 19 893Net fee and commission income 6 236 5 678 1 320 4 519 27 - 54 17 725
Net financial income 3 465 441 231 1 674 1 008 60 6 880Net other income 573 87 - 10 17 448 - 4 1 112Total operating income 18 318 15 648 3 914 6 120 1 558 51 45 609
Staff costs -3 862 -3 298 - 724 -1 561 -4 616 35 -14 025
Other expenses -5 046 -3 872 - 965 - 963 3 984 - 85 -6 947
Depreciation, amortisation and
impairment of tangible and intangible
assets - 59 - 57 - 78 - 37 - 734 - 964
Total operating expenses -8 967 -7 226 -1 766 -2 561 -1 365 - 51 -21 936
Profit before credit losses 9 351 8 422 2 148 3 558 193 0 23 672
Gains less losses from tangible and
intangible assets 1 - 164 1 - 162
Net credit losses - 529 - 276 - 7 4 - 808
Operating profit before
items affecting comparability 8 823 8 146 1 977 3 558 198 0 22 702
Items affecting comparability -1 896 -1 896
Operating profit 8 823 8 146 1 977 3 558 -1 698 0 20 806
1) Other consists of business support units, treasury and staff units.

SEB Annual Accounts 2017 19
Large Corporates & Financial Institutions The division offers commercial and investment banking services to large corporate and institutional clients, in the Nordic region, Germany and the United Kingdom. Customers are also served through an international network in some 20 offices.
Income statement
Q4 Q3 Q4
SEK m 2017 2017 % 2016 % 2017 2016 %
Net interest income 1 972 1 971 0 2 202 - 10 8 043 8 307 - 3
Net fee and commission income 1 619 1 306 24 1 690 - 4 6 236 6 095 2
Net financial income 866 913 - 5 1 219 - 29 3 465 4 187 - 17
Net other income 205 137 50 137 50 573 389 47
Total operating income 4 662 4 327 8 5 248 - 11 18 318 18 978 - 3
Staff costs - 959 - 951 1 -1 032 - 7 -3 862 -3 922 - 2
Other expenses -1 265 -1 242 2 -1 208 5 -5 046 -4 972 1
Depreciation, amortisation and impairment of tangible
and intangible assets - 16 - 15 5 - 11 42 - 59 - 34 74
Total operating expenses -2 240 -2 208 1 -2 251 0 -8 967 -8 928 0
Profit before credit losses 2 422 2 119 14 2 997 - 19 9 351 10 050 - 7
Gains less losses from tangible and intangible assets 1
- 95 - 1 1 0 130
Net credit losses - 20 - 210 - 90 - 200 - 90 - 529 - 563 - 6
Operating profit before Items affecting comparability 2 402 1 910 26 2 796 - 14 8 823 9 487 - 7
Items affecting comparability 0 0 0 0 - 354
Operating profit 2 402 1 910 26 2 796 - 14 8 823 9 133 - 3
Cost/Income ratio 0,48 0,51 0,43 0,49 0,47
Business equity, SEK bn 64,9 66,0 64,9 65,8 62,4
Return on business equity, % 11,1 8,7 13,3 10,1 11,3
Number of full time equivalents1) 2 028 2 031 2 063 2 049 2 134
Jan — Dec
1) Quarterly numbers are for end of quarter. Accumulated numbers are average for the period.
Active primary markets, low volatility and subdued demand for traditional bank financing during the year
New regulatory rules dampened institutional activity but increased demand for custody-related services
Operating profit amounted to SEK 8,823m and return on business equity was 10.1 per cent
Comments on 2017Business sentiment improved during the year supported by a positive macroeconomic outlook in Europe as well as continued favourable capital markets and access to liquidity. Large Corporate clients were active during the year, benefitting from low interest rates, favourable financing conditions and improved growth prospects. Demand for traditional bank financing was subdued except within the private equity segment. However, debt capital markets saw high issuance volumes and there was a pick-up in M&A activity. As in 2016, equity capital market activity was high. Customers showed continued increased interest in sustainability matters and SEB’s role as advisor became even more important. Financial Institutions’ activity was in general dampened as a consequence of low volatility and adaptation to new regulations such as MiFID II and EMIR. However, in the active primary markets institutional clients played an important role participating in new issues. Excess liquidity challenged insurance and pension funds searching for high-yield
investments – a trend that was present throughout the year. The increasingly complex regulatory environment for financial institutions drove demand for administrative and back office services such as clearing, collateral management and reporting. These services are part of the custody offering – one of SEB’s focus areas. Assets under custody amounted to SEK 8,046bn (6,859).
SEB is continuously exploring new open banking related opportunities through the use of APIs. They are the basis for distributing products on new market platforms and allow third party developers to build applications and services on top of SEB’s infrastructure.
Net interest income decreased due to higher resolution fund fees. Net fee and commission income was higher as a result of corporate clients being more active. Net financial income decreased as a consequence of low market activity with investors in a wait-and-see mode. Operating expenses were stable. Credit losses were SEK 529m, corresponding to 8 basis points.

SEB Annual Accounts 2017 20
Corporate & Private Customers The division offers full banking and advisory services to private individuals and small and medium-sized corporate customers in Sweden, as well as card services in four Nordic countries. High net-worth individuals are offered leading
Nordic private banking services.
Income statement Q4 Q3 Q4
SEK m 2017 2017 % 2016 % 2017 2016 %
Net interest income 2 320 2 415 - 4 2 331 0 9 442 8 982 5
Net fee and commission income 1 472 1 342 10 1 425 3 5 678 5 414 5
Net financial income 113 98 16 111 2 441 394 12
Net other income 23 35 - 33 19 23 87 55 59
Total operating income 3 929 3 890 1 3 886 1 15 648 14 845 5
Staff costs - 827 - 804 3 - 850 - 3 -3 298 -3 339 - 1
Other expenses -1 017 - 944 8 -1 009 1 -3 872 -3 713 4
Depreciation, amortisation and impairment of
tangible and intangible assets - 13 - 14 - 2 - 18 - 25 - 57 - 69 - 18
Total operating expenses -1 857 -1 762 5 -1 877 - 1 -7 226 -7 121 1
Profit before credit losses 2 072 2 128 - 3 2 009 3 8 422 7 724 9
Gains less losses from tangible and intangible
assets 0 0 - 93 0 0 0
Net credit losses - 60 - 86 - 30 - 63 - 5 - 276 - 376 - 27
Operating profit before Items affecting comparabilit 2 012 2 042 - 1 1 946 3 8 146 7 348 11
Items affecting comparability 0 0 0 0 0
Operating profit 2 012 2 042 - 1 1 946 3 8 146 7 348 11
Cost/Income ratio 0.47 0.45 0.48 0.46 0.48
Business equity, SEK bn 40.7 40.4 38.7 40.6 37.3
Return on business equity, % 14.8 15.2 15.5 15.0 15.2
Number of full time equivalents1) 3 548 3 485 3 551 3 531 3 667
Jan — Dec
1) Quarterly numbers are for end of quarter. Accumulated numbers are average for the period.
All-time high usage of mobile services
Continued growth in both the private and corporate lending portfolios
Operating profit amounted to SEK 8,146m and return on business equity was 15 per cent
Comments on 2017Customer activity increased throughout the year, driven by positive market sentiment. Customers also
appreciated the proactive contacts from the bank and that service was more accessible through the continued digitalisation. Customers’ usage of mobile services
reached an all-time high as mobile interactions, measured as monthly average, increased by more than 25 per cent compared to last year. Open-banking based
functions are being developed and examples of this are the collaboration with Tink and on the card side, Fitbit.
In the private segment, the launch of an all-digital customer on-boarding process and the continued enhancement of a digital mortgage application process enabled 22,500 new private customers to on-board digitally and the rate of digital household mortgage applications to more than double. The growth rate in household mortgage lending was 4.5 per cent and total volumes amounted to SEK 468bn (449*).
In the corporate segment, SEB enhanced its value proposition through the launch of the service concept Greenhouse, targeting companies with growth
ambitions, where SEB provides both seminars and external partners. Corporate lending, partly driven by financing of residential properties, increased to SEK 221bn (210*) and the number of full-service corporate customers reached 175,000 (168,000).
Within the savings area, assets under management increased as a result of positive asset price development and new net inflows, mainly driven by Private Banking. Total deposit volumes from corporate and private customers amounted to SEK 385bn (371).
Year-on-year, operating profit increased by 11 per cent to SEK 8,146m, mainly driven by continued growth in net interest income which amounted to SEK 9,442m and net fee and commission income which reached SEK 5,678m. Operating expenses increased marginally to SEK 7,226m, while credit losses remained low at SEK 276m, corresponding to a credit loss level of 3 basis points. ________________________ * The real estate loan portfolio for the customer segment sole traders was reclassified in the division. As a result, the year-end 2016 reported corporate lending of SEK 224bn was adjusted to SEK 210bn and similarly the year-end 2016 reported mortgage balance of SEK 433bn was adjusted to SEK 449bn. The reclassification was already reflected on group level.
SEB Annual Accounts 2017 21
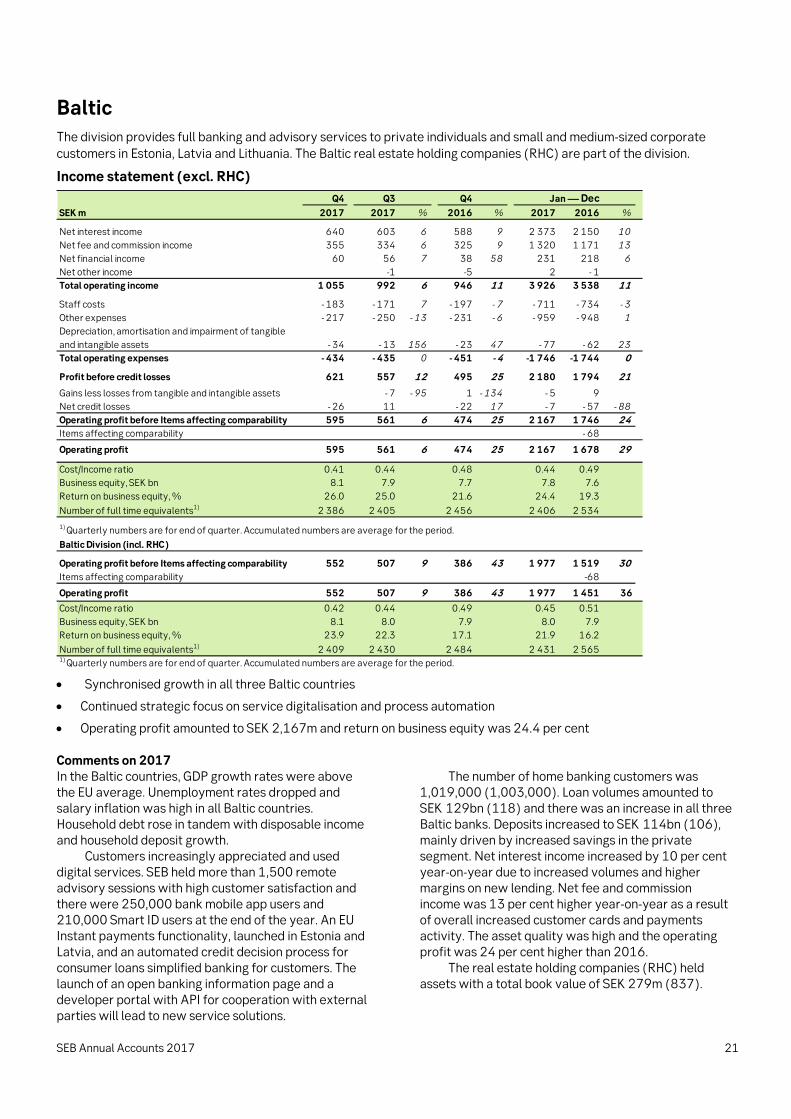
Baltic The division provides full banking and advisory services to private individuals and small and medium-sized corporate customers in Estonia, Latvia and Lithuania. The Baltic real estate holding companies (RHC) are part of the division.
Income statement (excl. RHC)
Q4 Q3 Q4
SEK m 2017 2017 % 2016 % 2017 2016 %
Net interest income 640 603 6 588 9 2 373 2 150 10
Net fee and commission income 355 334 6 325 9 1 320 1 171 13
Net financial income 60 56 7 38 58 231 218 6
Net other income 0 -1 - 102 -5 - 100 2 - 1
Total operating income 1 055 992 6 946 11 3 926 3 538 11
Staff costs - 183 - 171 7 - 197 - 7 - 711 - 734 - 3
Other expenses - 217 - 250 - 13 - 231 - 6 - 959 - 948 1
Depreciation, amortisation and impairment of tangible
and intangible assets - 34 - 13 156 - 23 47 - 77 - 62 23
Total operating expenses - 434 - 435 0 - 451 - 4 -1 746 -1 744 0
Profit before credit losses 621 557 12 495 25 2 180 1 794 21
Gains less losses from tangible and intangible assets 0 - 7 - 95 1 - 134 - 5 9 - 159
Net credit losses - 26 11 - 22 17 - 7 - 57 - 88
Operating profit before Items affecting comparability 595 561 6 474 25 2 167 1 746 24
Items affecting comparability 0 0 0 0 - 68
Operating profit 595 561 6 474 25 2 167 1 678 29
Cost/Income ratio 0.41 0.44 0.48 0.44 0.49
Business equity, SEK bn 8.1 7.9 7.7 7.8 7.6
Return on business equity, % 26.0 25.0 21.6 24.4 19.3
Number of full time equivalents1) 2 386 2 405 2 456 2 406 2 534
Baltic Division (incl. RHC)
Operating profit before Items affecting comparability 552 507 9 386 43 1 977 1 519 30
Items affecting comparability 0 0 0 0 -68 -100
Operating profit 552 507 9 386 43 1 977 1 451 36
Cost/Income ratio 0.42 0.44 0.49 0.45 0.51
Business equity, SEK bn 8.1 8.0 7.9 8.0 7.9
Return on business equity, % 23.9 22.3 17.1 21.9 16.2
Number of full time equivalents1) 2 409 2 430 2 484 2 431 2 565
Jan — Dec
1) Quarterly numbers are for end of quarter. Accumulated numbers are average for the period.
1) Quarterly numbers are for end of quarter. Accumulated numbers are average for the period. Synchronised growth in all three Baltic countries
Continued strategic focus on service digitalisation and process automation
Operating profit amounted to SEK 2,167m and return on business equity was 24.4 per cent
Comments on 2017In the Baltic countries, GDP growth rates were above the EU average. Unemployment rates dropped and salary inflation was high in all Baltic countries. Household debt rose in tandem with disposable income and household deposit growth.
Customers increasingly appreciated and used digital services. SEB held more than 1,500 remote advisory sessions with high customer satisfaction and there were 250,000 bank mobile app users and 210,000 Smart ID users at the end of the year. An EU Instant payments functionality, launched in Estonia and Latvia, and an automated credit decision process for consumer loans simplified banking for customers. The launch of an open banking information page and a developer portal with API for cooperation with external parties will lead to new service solutions.
The number of home banking customers was 1,019,000 (1,003,000). Loan volumes amounted to SEK 129bn (118) and there was an increase in all three Baltic banks. Deposits increased to SEK 114bn (106), mainly driven by increased savings in the private segment. Net interest income increased by 10 per cent year-on-year due to increased volumes and higher margins on new lending. Net fee and commission income was 13 per cent higher year-on-year as a result of overall increased customer cards and payments activity. The asset quality was high and the operating profit was 24 per cent higher than 2016.
The real estate holding companies (RHC) held assets with a total book value of SEK 279m (837).

SEB Annual Accounts 2017 22
Life & Investment Management The division offers life insurance and asset management solutions to private as well as corporate and institutional clients mainly in the Nordic and Baltic countries.
Income statement Q4 Q3 Q4
SEK m 2017 2017 % 2016 % 2017 2016 %
Net interest income - 24 - 24 1 - 17 42 - 90 - 60 50
Net fee and commission income 1 306 1 053 24 1 229 6 4 519 4 059 11
Net financial income 404 481 - 16 484 - 17 1 674 1 764 - 5
Net other income 5 0 - 82 - 106 17 - 17
Total operating income 1 691 1 509 12 1 614 5 6 120 5 746 7
Staff costs - 402 - 383 5 - 415 - 3 -1 561 -1 560 0
Other expenses - 264 - 243 9 - 243 9 - 963 - 984 - 2
Depreciation, amortisation and impairment of
tangible and intangible assets - 10 - 10 - 2 - 10 - 3 - 37 - 45 - 17
Total operating expenses - 676 - 636 6 - 668 1 -2 561 -2 589 - 1
Profit before credit losses 1 014 874 16 946 7 3 558 3 157 13g g
assets 0 0 0 0
Net credit losses 0 0 0 0
Operating profit before Items affecting comparabili 1 014 874 16 946 7 3 558 3 157 13
Items affecting comparability 0 0 #REF! ### 0 #REF!
Operating profit 1 014 874 16 946 7 3 558 3 157 13
Cost/Income ratio 0.40 0.42 0.41 0.42 0.45
Business equity, SEK bn 11.1 11.0 11.7 11.0 11.6
Return on business equity, % 31.5 27.4 27.9 27.8 23.5
Number of full time equivalents1) 1 491 1 451 1 491 1 478 1 468
Jan — Dec
1) Quarterly numbers are for end of quarter. Accumulated numbers are average for the period.
Strong demand for both insurance and asset management related products
SEB signed an agreement to divest SEB Pension to Danica
Operating profit amounted to SEK 3,558m and return on business equity was 27.8 per cent
Comments on 2017
Demand for insurance solutions remained on a high level throughout the year, at the same time as competition intensified. In this landscape, customers increasingly
appreciated SEB’s accessible offering. SEB increased insurance sales by 10 per cent and continued to attract assets under management.
Life: In Sweden, continued steps were taken within the digital agenda aiming at improving the accessibility for the corporate clients and as per 30 September the
annual new sales reached SEK 21bn, corresponding to a market share of 9.3 per cent. In Denmark, the strong portfolio management enabled SEB Pension to deliver
the highest return for savings products on the market. At the end of 2017, an agreement to divest all shares in SEB Pension was signed with Danica (see page 10).
In the Baltic region, new products were launched and the customer experience was strengthened within the pension area. In addition, efficiency in providing the full
service offering, covering both insurance products as well as banking products increased.
Investment Management: The fourth quarter
continued in line with the previous quarters of 2017 in terms of strong institutional inflow. The high demand spanned across several products. The strong
performance strengthened the institutional offering. The focus on sustainability continued throughout the year, in line with the increasing client interest for
products with an emphasis on climate and social responsibility.
Net fee and commission income increased by 11 per
cent due to higher asset values during the year. Operating expenses decreased by 1 per cent, thereby improving operating profit by 13 per cent to a record-
high SEK 3,558m. Total assets in the unit-linked insurance business increased by SEK 29bn to SEK 348bn from year-end 2016.
SEB Annual Accounts 2017 23
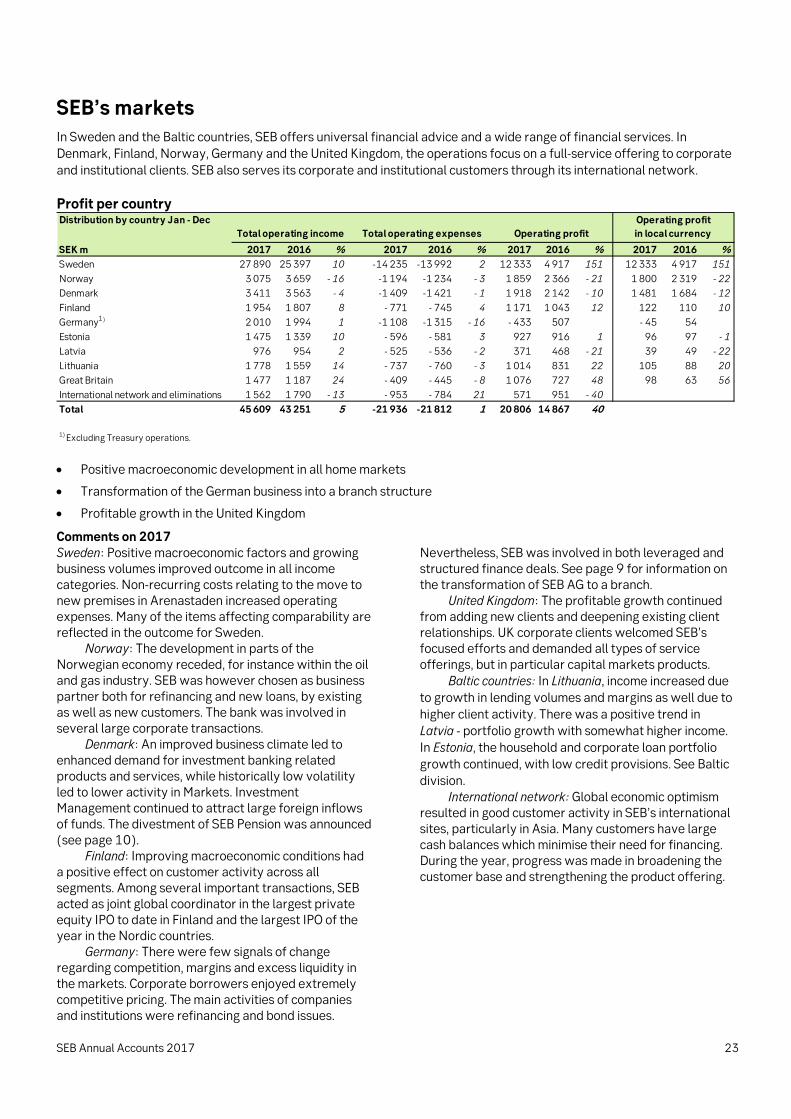
SEB’s markets In Sweden and the Baltic countries, SEB offers universal financial advice and a wide range of financial services. In Denmark, Finland, Norway, Germany and the United Kingdom, the operations focus on a full-service offering to corporate
and institutional clients. SEB also serves its corporate and institutional customers through its international network.
Profit per country Distribution by country Jan - Dec
SEK m 2017 2016 % 2017 2016 % 2017 2016 % 2017 2016 %
Sweden 27 890 25 397 10 -14 235 -13 992 2 12 333 4 917 151 12 333 4 917 151
Norway 3 075 3 659 - 16 -1 194 -1 234 - 3 1 859 2 366 - 21 1 800 2 319 - 22
Denmark 3 411 3 563 - 4 -1 409 -1 421 - 1 1 918 2 142 - 10 1 481 1 684 - 12
Finland 1 954 1 807 8 - 771 - 745 4 1 171 1 043 12 122 110 10
Germany1) 2 010 1 994 1 -1 108 -1 315 - 16 - 433 507 - 185 - 45 54
Estonia 1 475 1 339 10 - 596 - 581 3 927 916 1 96 97 - 1
Latvia 976 954 2 - 525 - 536 - 2 371 468 - 21 39 49 - 22
Lithuania 1 778 1 559 14 - 737 - 760 - 3 1 014 831 22 105 88 20
Great Britain 1 477 1 187 24 - 409 - 445 - 8 1 076 727 48 98 63 56
International network and eliminations 1 562 1 790 - 13 - 953 - 784 21 571 951 - 40
Total 45 609 43 251 5 -21 936 -21 812 1 20 806 14 867 40
1) Excluding Treasury operations.
Total operating income Total operating expenses Operating profit
Operating profit
in local currency
Positive macroeconomic development in all home markets
Transformation of the German business into a branch structure
Profitable growth in the United Kingdom
Comments on 2017 Sweden: Positive macroeconomic factors and growing business volumes improved outcome in all income categories. Non-recurring costs relating to the move to new premises in Arenastaden increased operating expenses. Many of the items affecting comparability are reflected in the outcome for Sweden.
Norway: The development in parts of the Norwegian economy receded, for instance within the oil and gas industry. SEB was however chosen as business partner both for refinancing and new loans, by existing as well as new customers. The bank was involved in several large corporate transactions.
Denmark: An improved business climate led to enhanced demand for investment banking related products and services, while historically low volatility led to lower activity in Markets. Investment Management continued to attract large foreign inflows of funds. The divestment of SEB Pension was announced (see page 10).
Finland: Improving macroeconomic conditions had a positive effect on customer activity across all segments. Among several important transactions, SEB acted as joint global coordinator in the largest private equity IPO to date in Finland and the largest IPO of the year in the Nordic countries.
Germany: There were few signals of change regarding competition, margins and excess liquidity in the markets. Corporate borrowers enjoyed extremely competitive pricing. The main activities of companies and institutions were refinancing and bond issues.
Nevertheless, SEB was involved in both leveraged and structured finance deals. See page 9 for information on the transformation of SEB AG to a branch.
United Kingdom: The profitable growth continued from adding new clients and deepening existing client relationships. UK corporate clients welcomed SEB’s focused efforts and demanded all types of service offerings, but in particular capital markets products.
Baltic countries: In Lithuania, income increased due
to growth in lending volumes and margins as well due to higher client activity. There was a positive trend in Latvia - portfolio growth with somewhat higher income.
In Estonia, the household and corporate loan portfolio growth continued, with low credit provisions. See Baltic division.
International network: Global economic optimism resulted in good customer activity in SEB’s international sites, particularly in Asia. Many customers have large cash balances which minimise their need for financing. During the year, progress was made in broadening the customer base and strengthening the product offering.

SEB Annual Accounts 2017 24
The SEB Group
Net interest income – SEB GroupQ4 Q3 Q4
SEK m 2017 2017 % 2016 % 2017 2016 %Interest income 9 185 9 161 0 8 860 4 36 472 35 202 4Interest expense -4 001 -4 080 - 2 -4 062 - 2 -16 580 -16 464 1Net interest income 5 184 5 080 2 4 798 8 19 893 18 738 6
Jan–Dec
Net fee and commission income – SEB Group Q4 Q3 Q4
SEK m 2017 2017 % 2016 % 2017 2016 %
Issue of securities and advisory 317 137 131 231 37 1 167 800 46
Secondary market and derivatives 561 547 2 842 - 33 2 565 3 353 - 24
Custody and mutual funds 2 210 1 942 14 1 950 13 8 040 7 264 11
Whereof performance and transaction fees 225 39 212 6 357 275 30
Payments, cards, lending, deposits,
guarantees and other 2 570 2 350 9 2 586 - 1 9 717 9 430 3
Whereof payments and card fees 1 429 1 366 5 1 356 5 5 460 5 203 5
Whereof lending 602 519 16 723 - 17 2 254 2 527 - 11
Life insurance commissions 429 424 1 438 - 2 1 707 1 653 3
Fee and commission income 6 087 5 400 13 6 047 1 23 196 22 500 3
Fee and commission expense -1 348 -1 373 - 2 -1 438 - 6 -5 472 -5 872 - 7
Net fee and commission income 4 739 4 026 18 4 609 3 17 725 16 628 7
Whereof Net securities commissions 2 356 1 986 19 2 308 2 8 889 8 378 6
Whereof Net payments and card fees 908 840 8 847 7 3 454 3 263 6
Whereof Net life insurance commissions 296 264 12 276 7 1 109 1 039 7
Jan–Dec
Net financial income – SEB Group Q4 Q3 Q4
SEK m 2017 2017 % 2016 % 2017 2016 %
Equity instruments and related derivatives - 32 473 456 1 410 1 173 20
Debt securities and related derivatives 170 - 7 - 68 - 369 228
Currency and related derivatives 1 049 740 42 1 114 - 6 4 023 3 699 9
Other life insurance income, net 429 494 -13 549 - 22 1 738 1 919 -9
Other 13 27 -50 - 13 78 37 111
Net financial income 1 630 1 726 -6 2 038 - 20 6 880 7 056 -3Whereof unrealized valuation changes from
counterparty risk and own credit standing in
derivatives and own issued securities. 61 291 -79 223 -73 210 - 219
The result within Net financial income is presented on different rows based on type of underlying financial instrument.
For the fourth quarter the effect from structured products offered to the public was approximately SEK 5m (Q3 2017: 205, Q4
2016: 535) in Equity related derivatives and a corresponding effect in Debt related derivatives SEK 110m (Q3 2017: -75, Q4
2016: -355).
Jan–Dec
SEB Annual Accounts 2017 25
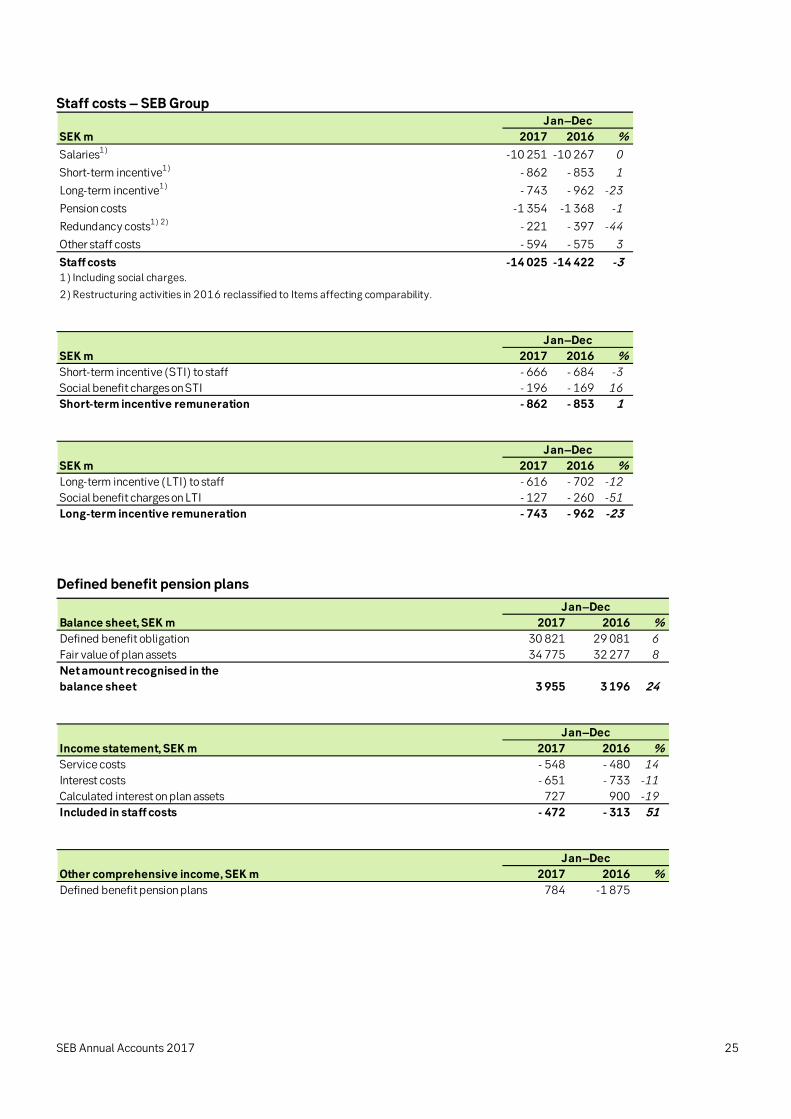
Staff costs – SEB Group
SEK m 2017 2016 %
Salaries1)
-10 251 -10 267 0
Short-term incentive1)
- 862 - 853 1
Long-term incentive1)
- 743 - 962 -23
Pension costs -1 354 -1 368 -1
Redundancy costs1) 2)
- 221 - 397 -44
Other staff costs - 594 - 575 3
Staff costs -14 025 -14 422 -31) Including social charges.
SEK m 2017 2016 %
Short-term incentive (STI) to staff - 666 - 684 -3
Social benefit charges on STI - 196 - 169 16
Short-term incentive remuneration - 862 - 853 1
SEK m 2017 2016 %
Long-term incentive (LTI) to staff - 616 - 702 -12
Social benefit charges on LTI - 127 - 260 -51
Long-term incentive remuneration - 743 - 962 -23
Jan–Dec
Jan–Dec
Jan–Dec
2) Restructuring activities in 2016 reclassified to Items affecting comparability.
Defined benefit pension plans
Balance sheet, SEK m 2017 2016 %
Defined benefit obligation 30 821 29 081 6
Fair value of plan assets 34 775 32 277 8
Net amount recognised in the
balance sheet 3 955 3 196 24
Income statement, SEK m 2017 2016 %
Service costs - 548 - 480 14
Interest costs - 651 - 733 -11
Calculated interest on plan assets 727 900 -19
Included in staff costs - 472 - 313 51
Other comprehensive income, SEK m 2017 2016 %
Defined benefit pension plans 784 -1 875
Jan–Dec
Jan–Dec
Jan–Dec
SEB Annual Accounts 2017 26
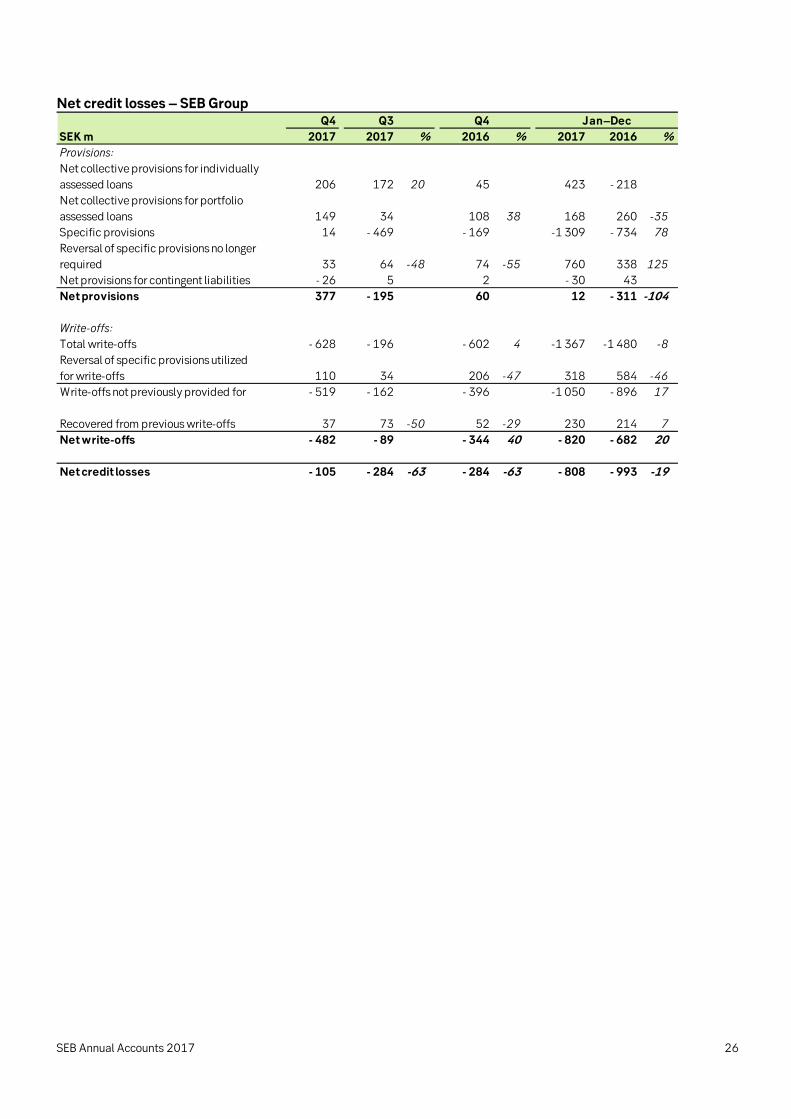
Net credit losses – SEB Group Q4 Q3 Q4
SEK m 2017 2017 % 2016 % 2017 2016 %
Provisions:
Net collective provisions for individually
assessed loans 206 172 20 45 423 - 218
Net collective provisions for portfolio
assessed loans 149 34 108 38 168 260 -35
Specific provisions 14 - 469 - 169 -1 309 - 734 78
Reversal of specific provisions no longer
required 33 64 -48 74 -55 760 338 125
Net provisions for contingent liabilities - 26 5 2 - 30 43
Net provisions 377 - 195 60 12 - 311 -104
Write-offs:
Total write-offs - 628 - 196 - 602 4 -1 367 -1 480 -8
Reversal of specific provisions utilized
for write-offs 110 34 206 -47 318 584 -46
Write-offs not previously provided for - 519 - 162 - 396 -1 050 - 896 17
Recovered from previous write-offs 37 73 -50 52 -29 230 214 7
Net write-offs - 482 - 89 - 344 40 - 820 - 682 20
Net credit losses - 105 - 284 -63 - 284 -63 - 808 - 993 -19
Jan–Dec

SEB Annual Accounts 2017 27
Items affecting comparability – SEB Group
Q4 Q3 Q4
SEK m 2017 2017 2016 2017 2016
Other income 494 494 520
Total operating income 494 0 0 494 520
Staff costs -1 320 -1 320 - 140
Other expenses - 92 - 92 - 84
Depreciation, amortisation and
impairment of tangible and intangible
assets - 978 - 978 -5 725
Total operating expenses -2 390 0 0 -2 390 -5 949
Items affecting comparability -1 896 0 0 -1 896 -5 429
Income tax on IAC 215 215 77
Items affecting comparability after tax -1 681 0 0 -1 681 -5 352
Items affecting comparability 2016
The total effect of Items affecting comparability in 2016 was a cost in the amount of SEK 5,429m before tax and SEK
5,352m after tax.
Visa Baltic (2016 Q2)
The settlement of the transaction of SEB’s Baltic holdings in Visa Europe resulted in a gain of SEK 520m. The gain
generated a tax expense of SEK 24m.
Reorganisation and restructuring (2016 Q1)
SEB implemented a new customer-oriented organisation which resulted in an impairment of goodwill in the amount of SEK
5,334m in the first quarter 2016. This expense was not tax deductible.
There were financial effects from restructuring activities in the Baltic and German businesses as well as an impairment
and derecognition of intangible IT assets no longer in use. The total amount was SEK 615m and there was a positive tax
effect amounting to SEK 101m in the first quarter 2016.
Jan–Dec
Visa Sweden (2017 Q4)
The settlement of the acquisition of Visa Europe by Visa Inc. consisted of a combination of cash and shares to be paid to
the different Visa Europe members. In Sweden, SEB was an indirect member. In the fourth quarter a dividend of
SEK 494m was received. There was no tax effect.
The holdings in Visa have been classified as Available-for-sale asset where the change in value is recognised in Other
comprehensive income. The dividend received has reduced the amount in Other comprehensive income by SEK 494m.
SEB’s German business (2017 Q4)
In line with previous communication, the operations in Germany were transformed and the core business was transferred
from SEB AG to the German branch of the parent company, Skandinaviska Enskilda Banken AB, as per 2 January 2018.
The purpose of the change is to simplify the reporting and administration of the German operations. The non-core business
that was not transferred to the branch from SEB AG will be dismantled over time.
The provisions related to redundancy and excess premises amounting to a total of SEK 521m were recognised in the fourth
quarter. In addition, SEB entered into an agreement to transfer the pension obligations under the defined benefit plan in
SEB AG to Versicherungsverein des Bankgewerbes a.G (BVV) at a total cost of SEK 891m in the fourth quarter. The
transfer will take place in the second quarter 2018.
Impairment and derecognition of intangible IT assets (2017 Q4)
In the fourth quarter, an impairment and a derecognition of intangible IT assets led to an expense in an amount of SEK
978m. The positive tax effect was SEK 215m.
Items affecting comparability 2017
The total expense in the income statement from Items affecting comparability was SEK 1,896m before tax and SEK
1,681m after tax.
In total, the items affecting comparability, including the effect on other comprehensive income of SEK 494m, decreased
equity by SEK 2,175m.

SEB Annual Accounts 2017 28
Statement of changes in equity – SEB Group
SEK m
Share
capital
Available-
for-sale
financial
assets
Cash flow
hedges
Translation
of foreign
operations
Defined
benefit
plans
Retained
earnings
Total Share-
holders'
equity
Minority
interests
Total
Equity
Jan-Dec 2017
Opening balance 21 942 1 638 2 399 -1 193 2 595 113 595 140 976 140 976
Net profit 16 244 16 244 16 244
Other comprehensive income (net of tax) -909 -1 207 296 784 -1 036 -1 036
Total comprehensive income -909 -1 207 296 784 16 244 15 208 15 208
Dividend to shareholders -11 935 -11 935 -11 935
Equity-based programmes3)
-246 -246 -246
Change in holdings of own shares -78 -78 -78
Closing balance 21 942 729 1 192 -897 3 379 117 581 143 925 143 925
Jan-Dec 2016
Opening balance 21 942 648 3 210 -1 943 4 470 114 471 142 798 142 798
Change in valuation of insurance contracts2)
-440 -440 -440
Adjusted opening balance 21 942 648 3 210 -1 943 4 470 114 031 142 358 142 358
Net profit 10 618 10 618 10 618
Other comprehensive income (net of tax) 990 -811 750 -1 875 -946 -946
Total comprehensive income 990 -811 750 -1 875 10 618 9 672 9 672
Dividend to shareholders -11 504 -11 504 -11 504
Equity-based programmes3)
433 433 433
Change in holdings of own shares 17 17 17
Closing balance 21 942 1 638 2 399 -1 193 2 595 113 595 140 976 140 976
2) The valuation methodology of insurance contracts in Denmark has migrated towards the Solvency II principles and the effect on Group as of 1st
of January 2016 is SEK -440m.
3) Number of shares owned by SEB:
Jan-Dec Jan-Dec
Number of shares owned by SEB, million 2017 2016
Opening balance 25.2 0.9
Repurchased shares for equity-based programmes 7.0 29.8
Sold/distributed shares -5.0 -5.5
Closing balance 27.1 25.2
Market value of shares owned by SEB, SEK m 2 612 2 406
Other reserves1)
1) Amounts under Other reserves may be reclassified in the future to the income statement under certain circumstances, e.g. if they are related to the sale of Available for sale
financial assets, dissolved Cash flow hedges or Translation of foreign operations when SEB ceases to consolidate a foreign operation. Amounts related to Defined benefit plans will
not be reclassified to the income statement.
In accordance with the decision by the Annual General Meeting, SEB holds own shares of Class A for the long-term equity-based programmes. The transactions may take place at
one or several occasions during the year. The acquisition cost for the purchase of own shares is deducted from shareholders' equity. The item includes changes in nominal amounts
of equity swaps used for hedging of equity-based programmes.

SEB Annual Accounts 2017 29
Cash flow statement – SEB Group
SEK m 2017 2016 %
Cash flow from operating activities 41 526 42 591 - 3
Cash flow from investment activities 7 964 852
Cash flow from financing activities - 20 030 - 2 198
Net increase in cash and cash equivalents 29 460 41 245 - 29
Cash and cash equivalents at the beginning of year 158 315 110 770 43
Exchange rate differences on cash and cash equivalents - 3 346 6 300
Net increase in cash and cash equivalents 29 460 41 245 - 29
Cash and cash equivalents at the end of period1)
184 429 158 315 16
Jan–Dec
1) Cash and cash equivalents at the end of period is defined as Cash and cash balances with central banks and Loans to
other credit institutions payable on demand.
Financial assets and liabilities – SEB Group
SEK m
Carrying
amount Fair value
Carrying
amount Fair value
Loans 1 694 524 1 698 735 1 704 291 1 715 801
Equity instruments 59 203 59 203 74 173 74 173
Debt securities 169 268 169 368 253 443 253 653
Derivative instruments 104 868 104 868 212 355 212 355
Financial assets–policyholders bearing the risk 283 420 283 420 295 908 295 908
Other 34 100 34 100 38 942 38 942
Financial assets 2 345 383 2 349 694 2 579 112 2 590 832
Deposits 1 093 798 1 098 491 1 045 056 1 046 864
Equity instruments 14 228 14 228 10 071 10 071
Debt securities issued 657 232 662 160 755 984 768 613
Derivative instruments 85 432 85 432 174 651 174 651
Liabilities to policyholders–investment contracts 284 291 284 291 296 618 296 618
Other 51 800 51 800 60 297 60 297
Financial liabilities 2 186 781 2 196 402 2 342 677 2 357 114
SEB has aggregated its financial instruments by class taking into account the characteristics of the instruments. The fair
value of each class of financial assets and liabilities are compared with its carrying amount. A description of the
characteristics of the classes can be found in note 39 in the Annual Report 2016.
31 Dec 2017 31 Dec 2016

SEB Annual Accounts 2017 30
Assets and liabilities measured at fair value – SEB Group SEK m
Assets
Quoted
prices in
active
markets
(Level 1)
Valuation
technique
using
observable
inputs
(Level 2)
Valuation
technique
using non-
observable
inputs
(Level 3) Total
Quoted
prices in
active
markets
(Level 1)
Valuation
technique
using
observable
inputs
(Level 2)
Valuation
technique
using non-
observable
inputs
(Level 3) Total
275 737 7 053 630 283 420 275 894 15 589 4 425 295 908
52 333 4 573 3 006 59 912 50 331 13 215 11 101 74 64771 626 84 041 571 156 238 102 894 133 664 1 779 238 337
Derivative instruments at fair value 1 250 102 930 688 104 868 2 593 201 621 8 141 212 355Investment properties 0 7 401 7 401Assets held for sale 89 229 63 657 29 550 182 436 587 587Total 490 175 262 254 34 445 786 874 431 712 364 676 32 847 829 235
Liabilities276 482 7 185 624 284 291 276 666 15 542 4 410 296 618
13 984 244 14 228 9 798 2 271 10 0716 206 28 991 35 197 7 027 33 514 40 541
Derivative instruments at fair value 910 83 723 799 85 432 2 808 168 207 3 636 174 651Other financial liabilities 3 842 3 842 19 225 19 225Liabilities held for sale 21 055 42 536 8 899 72 490 0Total 318 637 166 277 10 566 495 480 296 299 236 490 8 317 541 106
Fair value measurement
Level 1: Quoted market prices
Level 2: Valuation techniques with observable inputs
Level 3: Valuation techniques with significant unobservable inputs
Liabilities to policyholders - investment contracts
Examples of Level 2 financial instruments are most OTC derivatives such as options and interest rate swaps based on the Libor swap rate or a foreign-denominated yield curve.
Other examples are instruments for which SEB recently entered into transactions with third parties and instruments for which SEB interpolates between observable variables.
The Group has an established valuation process and control environment for the determination of fair values of financial instruments that includes a review, independent from the
business, of valuation models and prices. If the validation principles are not adhered to, the Head of Group Finance shall be informed. Exceptions of material and principal importance
require approval from the GRMC (Group Risk Measurement Committee) and the ARC (Accounting Reporting Committee).
Financial assets - policyholders bearing the risk
Equity instruments at fair value
In Level 2 valuation techniques, all significant inputs to the valuation models are observable either directly or indirectly. Level 2 valuation techniques include using discounted cash
flows, option pricing models, recent transactions and the price of another instrument that is substantially the same.
Examples of observable inputs are foreign currency exchange rates, binding securities price quotations, market interest rates (Stibor, Libor, etc.), volatilities implied from observable
option prices for the same term and actual transactions with one or more external counterparts executed by SEB. An input can transfer from being observable to being
unobservable during the holding period due to e.g. illiquidity of the instrument.
Examples of Level 1 financial instruments are listed equity securities, debt securities, and exchange-traded derivatives. Instruments traded in an active market for which one or
more market participants provide a binding price quotation on the balance sheet date are also examples of Level 1 financial instruments.
31 Dec 2016
An active market is one in which transactions occur with sufficient volume and frequency to provide pricing information on an ongoing basis. The objective is to arrive at a price at
which a transaction without modification or repackaging would occur in the principal market for the instrument.
If the fair value of financial instruments includes more than one unobservable input, the unobservable inputs are aggregated in order to determine the classification of the entire
instrument. The level in the fair value hierarchy within which a financial instrument is classified is determined on the basis of the lowest level of input that is significant to the fair
value in its entirety.
Valuations in Level 1 are determined by reference to unadjusted quoted market prices for identical instruments in active markets where the quoted prices are readily available and
the prices represent actual and regularly occurring market transactions on an arm’s length basis.
In order to arrive at the fair value of investment properties a market participant’s ability to generate economic benefit by using the asset in its highest and best use are taken into
account. The highest and best use takes into account the use of the asset that is physically possible, legally permissible and financially feasible. The current use of the investment
properties in SEB is in accordance with the highest and best use. The valuation of investment properties is described in the Accounting policies in Annual Report 2016. The valuation
of the investment properties is performed semi-annually, they are presented and approved by the board in each real estate company. The valuation principles used in all entities are
in accordance with regulations provided by the local Financial Supervisory Authorities (FSA) which is in accordance with international valuation principles and in accordance with
IFRS.
When valuing financial liabilities at fair value own credit standing is reflected.
The objective of fair value measurement is to arrive at the price at which an orderly transaction would take place between market participants at the measurement date under
current market conditions.
Equity instruments at fair value
Level 3 valuation techniques incorporate significant inputs that are unobservable. These techniques are generally based on extrapolating from observable inputs for similar
instruments, analysing historical data or other analytical techniques. Examples of Level 3 financial instruments are more complex OTC derivatives, long dated options for which the
volatility is extrapolated or derivatives that depend on an unobservable correlation. Other examples are instruments for which there is currently no active market or binding quotes,
such as unlisted equity instruments and private equity holdings and investment properties.
31 Dec 2017
In order to arrive at the fair value of a financial instrument SEB uses different methods; quoted prices in active markets, valuation techniques incorporating observable data and
valuation techniques based on internal models. For disclosure purposes, financial instruments carried at fair value are classified in a fair value hierarchy according to the level of
market observability of the inputs. Risk Control classifies and continuously reviews the classification of financial instruments in the fair value hierarchy. The valuation process is the
same for financial instruments in all levels.
Fair value is generally measured for individual financial instruments, in addition portfolio adjustments are made to cover the credit risk. To reflect counterparty risk and own credit
risk in OTC derivatives, adjustments are made based on the net exposure towards each counterpart. These adjustments are calculated on a counterparty level based on estimates
of exposure at default, probability of default and recovery rates. Probability of default and recovery rate information is generally sourced from the CDS markets. For counterparties
where this information is not available, or considered unreliable due to the nature of the exposure, alternative approaches are taken where the probability of default is based on
generic credit indices for specific industry and/or rating.
Debt instruments at fair value
Debt instruments at fair value
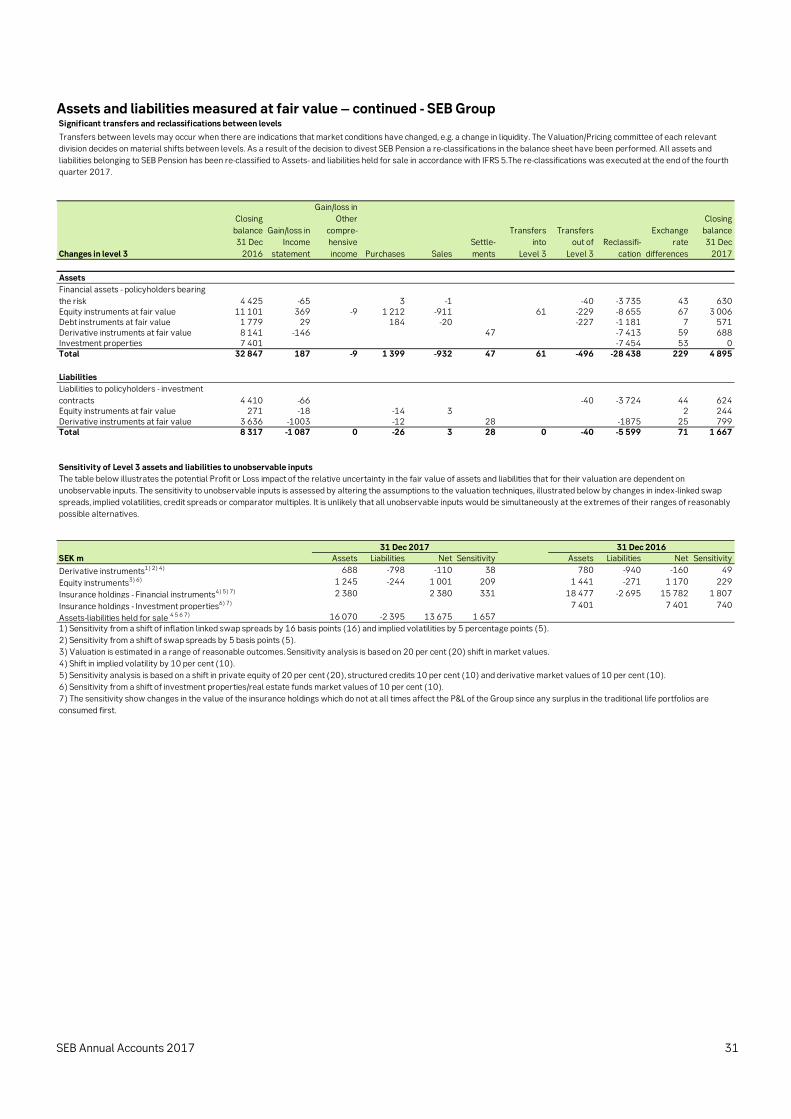
SEB Annual Accounts 2017 31
Assets and liabilities measured at fair value – continued - SEB Group Significant transfers and reclassifications between levels
Changes in level 3
Closing
balance
31 Dec
2016
Gain/loss in
Income
statement
Gain/loss in
Other
compre-
hensive
income Purchases Sales
Settle-
ments
Transfers
into
Level 3
Transfers
out of
Level 3
Reclassifi-
cation
Exchange
rate
differences
Closing
balance
31 Dec
2017
Assets
Financial assets - policyholders bearing
the risk 4 425 -65 3 -1 -40 -3 735 43 630Equity instruments at fair value 11 101 369 -9 1 212 -911 61 -229 -8 655 67 3 006Debt instruments at fair value 1 779 29 184 -20 -227 -1 181 7 571Derivative instruments at fair value 8 141 -146 47 -7 413 59 688Investment properties 7 401 -7 454 53 0Total 32 847 187 -9 1 399 -932 47 61 -496 -28 438 229 4 895
Liabilities
Liabilities to policyholders - investment
contracts 4 410 -66 -40 -3 724 44 624Equity instruments at fair value 271 -18 -14 3 2 244Derivative instruments at fair value 3 636 -1003 -12 28 -1875 25 799Total 8 317 -1 087 0 -26 3 28 0 -40 -5 599 71 1 667
Sensitivity of Level 3 assets and liabilities to unobservable inputs
SEK m Assets Liabilities Net Sensitivity Assets Liabilities Net Sensitivity
Derivative instruments1) 2) 4) 688 -798 -110 38 780 -940 -160 49
Equity instruments3) 6) 1 245 -244 1 001 209 1 441 -271 1 170 229
2 380 2 380 331 18 477 -2 695 15 782 1 807
7 401 7 401 740
16 070 -2 395 13 675 1 657
Transfers between levels may occur when there are indications that market conditions have changed, e.g. a change in liquidity. The Valuation/Pricing committee of each relevant
division decides on material shifts between levels. As a result of the decision to divest SEB Pension a re-classifications in the balance sheet have been performed. All assets and
liabilities belonging to SEB Pension has been re-classified to Assets- and liabilities held for sale in accordance with IFRS 5.The re-classifications was executed at the end of the fourth
quarter 2017.
31 Dec 2017 31 Dec 2016
The table below illustrates the potential Profit or Loss impact of the relative uncertainty in the fair value of assets and liabilities that for their valuation are dependent on
unobservable inputs. The sensitivity to unobservable inputs is assessed by altering the assumptions to the valuation techniques, illustrated below by changes in index-linked swap
spreads, implied volatilities, credit spreads or comparator multiples. It is unlikely that all unobservable inputs would be simultaneously at the extremes of their ranges of reasonably
possible alternatives.
Insurance holdings - Investment properties6) 7)
Insurance holdings - Financial instruments4) 5) 7)
5) Sensitivity analysis is based on a shift in private equity of 20 per cent (20), structured credits 10 per cent (10) and derivative market values of 10 per cent (10).
3) Valuation is estimated in a range of reasonable outcomes. Sensitivity analysis is based on 20 per cent (20) shift in market values.
4) Shift in implied volatility by 10 per cent (10).
1) Sensitivity from a shift of inflation linked swap spreads by 16 basis points (16) and implied volatilities by 5 percentage points (5).
2) Sensitivity from a shift of swap spreads by 5 basis points (5).
Assets-liabilities held for sale 4 5 6 7)
7) The sensitivity show changes in the value of the insurance holdings which do not at all times affect the P&L of the Group since any surplus in the traditional life portfolios are
consumed first.
6) Sensitivity from a shift of investment properties/real estate funds market values of 10 per cent (10).
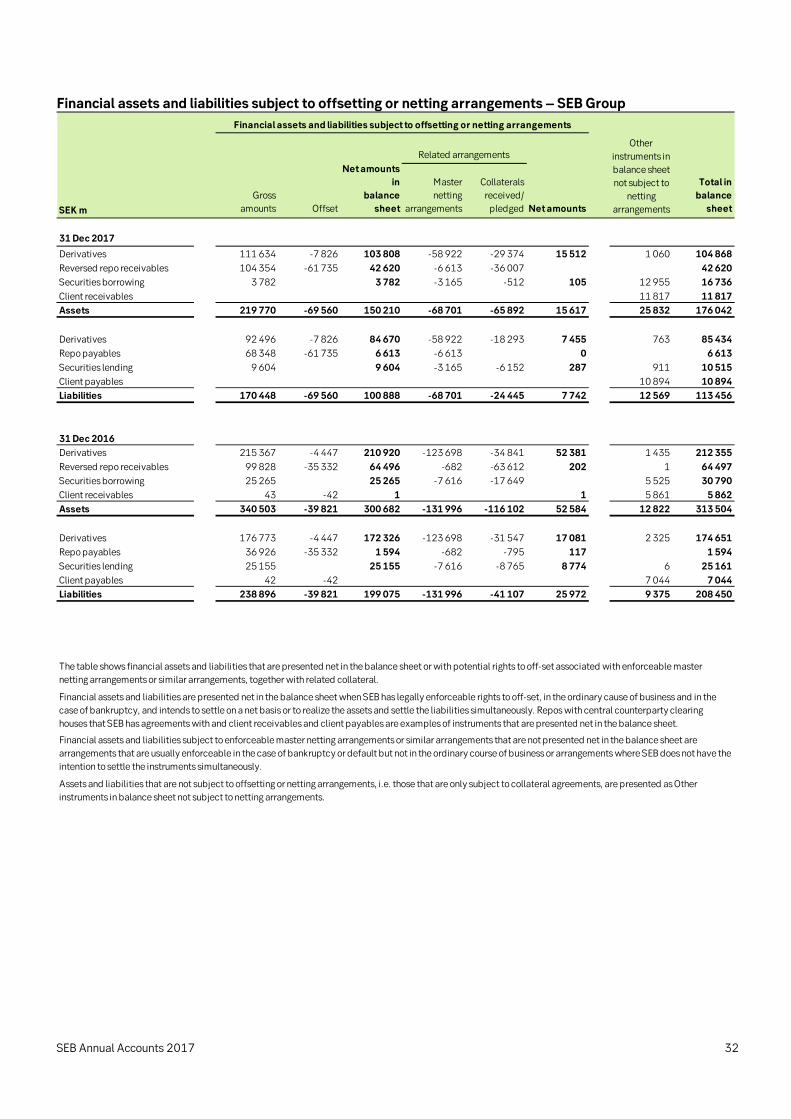
SEB Annual Accounts 2017 32
Financial assets and liabilities subject to offsetting or netting arrangements – SEB Group
SEK m
Gross
amounts Offset
Net amounts
in
balance
sheet
Master
netting
arrangements
Collaterals
received/
pledged Net amounts
Total in
balance
sheet
31 Dec 2017
Derivatives 111 634 -7 826 103 808 -58 922 -29 374 15 512 1 060 104 868
Reversed repo receivables 104 354 -61 735 42 620 -6 613 -36 007 42 620
Securities borrowing 3 782 3 782 -3 165 -512 105 12 955 16 736
Client receivables 11 817 11 817
Assets 219 770 -69 560 150 210 -68 701 -65 892 15 617 25 832 176 042
Derivatives 92 496 -7 826 84 670 -58 922 -18 293 7 455 763 85 434
Repo payables 68 348 -61 735 6 613 -6 613 0 6 613
Securities lending 9 604 9 604 -3 165 -6 152 287 911 10 515
Client payables 10 894 10 894
Liabilities 170 448 -69 560 100 888 -68 701 -24 445 7 742 12 569 113 456
31 Dec 2016
Derivatives 215 367 -4 447 210 920 -123 698 -34 841 52 381 1 435 212 355
Reversed repo receivables 99 828 -35 332 64 496 -682 -63 612 202 1 64 497
Securities borrowing 25 265 25 265 -7 616 -17 649 5 525 30 790
Client receivables 43 -42 1 1 5 861 5 862
Assets 340 503 -39 821 300 682 -131 996 -116 102 52 584 12 822 313 504
Derivatives 176 773 -4 447 172 326 -123 698 -31 547 17 081 2 325 174 651
Repo payables 36 926 -35 332 1 594 -682 -795 117 1 594
Securities lending 25 155 25 155 -7 616 -8 765 8 774 6 25 161
Client payables 42 -42 7 044 7 044
Liabilities 238 896 -39 821 199 075 -131 996 -41 107 25 972 9 375 208 450
Financial assets and liabilities are presented net in the balance sheet when SEB has legally enforceable rights to off-set, in the ordinary cause of business and in the
case of bankruptcy, and intends to settle on a net basis or to realize the assets and settle the liabilities simultaneously. Repos with central counterparty clearing
houses that SEB has agreements with and client receivables and client payables are examples of instruments that are presented net in the balance sheet.
Financial assets and liabilities subject to enforceable master netting arrangements or similar arrangements that are not presented net in the balance sheet are
arrangements that are usually enforceable in the case of bankruptcy or default but not in the ordinary course of business or arrangements where SEB does not have the
intention to settle the instruments simultaneously.
Assets and liabilities that are not subject to offsetting or netting arrangements, i.e. those that are only subject to collateral agreements, are presented as Other
instruments in balance sheet not subject to netting arrangements.
Related arrangementsOther
instruments in
balance sheet
not subject to
netting
arrangements
Financial assets and liabilities subject to offsetting or netting arrangements
The table shows financial assets and liabilities that are presented net in the balance sheet or with potential rights to off-set associated with enforceable master
netting arrangements or similar arrangements, together with related collateral.
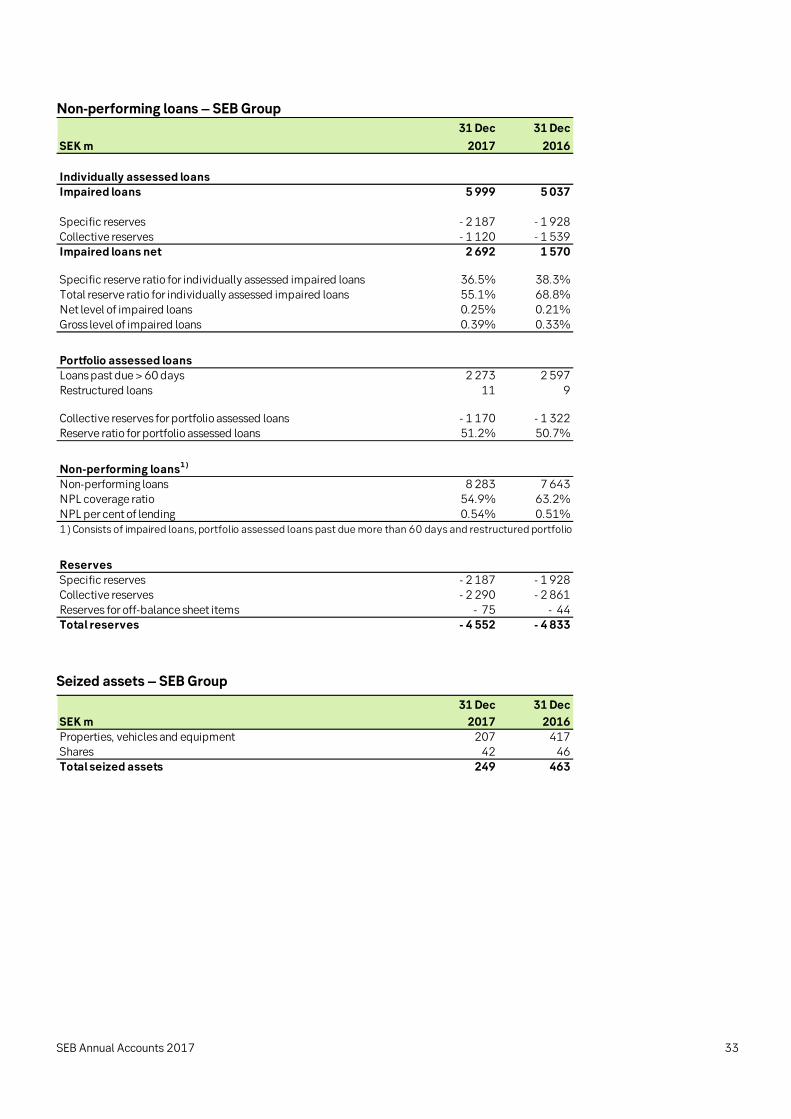
SEB Annual Accounts 2017 33
Non-performing loans – SEB Group
31 Dec 31 Dec
SEK m 2017 2016
Individually assessed loansImpaired loans 5 999 5 037
Specific reserves - 2 187 - 1 928
Collective reserves - 1 120 - 1 539Impaired loans net 2 692 1 570
Specific reserve ratio for individually assessed impaired loans 36.5% 38.3%
Total reserve ratio for individually assessed impaired loans 55.1% 68.8%Net level of impaired loans 0.25% 0.21%
Gross level of impaired loans 0.39% 0.33%
Portfolio assessed loansLoans past due > 60 days 2 273 2 597
Restructured loans 11 9
Collective reserves for portfolio assessed loans - 1 170 - 1 322Reserve ratio for portfolio assessed loans 51.2% 50.7%
Non-performing loans1)
Non-performing loans 8 283 7 643NPL coverage ratio 54.9% 63.2%
NPL per cent of lending 0.54% 0.51%1) Consists of impaired loans, portfolio assessed loans past due more than 60 days and restructured portfolio
Reserves
Specific reserves - 2 187 - 1 928Collective reserves - 2 290 - 2 861
Reserves for off-balance sheet items - 75 - 44Total reserves - 4 552 - 4 833
Seized assets – SEB Group
31 Dec 31 Dec
SEK m 2017 2016
Properties, vehicles and equipment 207 417Shares 42 46Total seized assets 249 463

SEB Annual Accounts 2017 34
Assets and liabilities held for sale – SEB Group
31 Dec 31 Dec
SEK m 2017 2016
Financial assets at fair value through profit or loss 175 506
Other assets 8 505 587
Non-current assets and disposal groups classified as held for sale 184 011 587
Liabilities to policyholders 133 688
Financial liabilities at fair value through profit or loss 34 469
Other liabilities 10 553
Liabilities of disposal groups classified as held for sale 178 710 0
The Baltic division has a divestment plan for investment properties. Through the continuation of the
plan, additional properties were reclassified as assets held for sale until the derecognition at concluded
sales agreement. The net amount of these activities during the fourth quarter was SEK -49m.
As announced on 14 December 2017, SEB has signed an agreement to sell all shares in SEB
Pensionsforsikring A/S and SEB Administration A/S (SEB Pension) to Danica Pension
Livsforsikringsaktieselskab (Danica, a subsidiary to Danske Bank). SEB Pension consists of a portfolio of
life and pension contracts and approximately 275 employees. The completion of the sale is among
other things conditional upon regulatory approvals and certain preparations for separation and is
currently expected to occur around the summer of 2018. In the consolidated balance sheet, assets and
liabilities relating to SEB Pension are separated from other assets and liabilities. SEB Pension is reported
in the Life & Investment Management division.
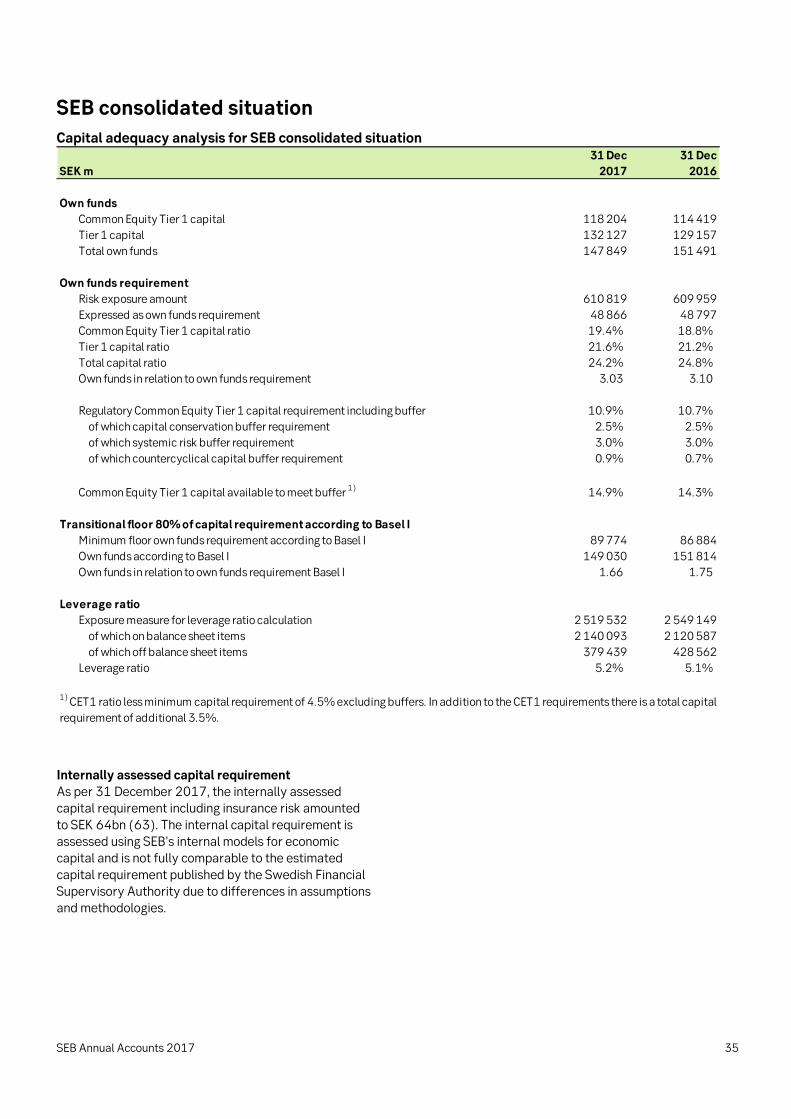
SEB Annual Accounts 2017 35
SEB consolidated situation
Capital adequacy analysis for SEB consolidated situation 31 Dec 31 Dec
SEK m 2017 2016
Own funds
Common Equity Tier 1 capital 118 204 114 419
Tier 1 capital 132 127 129 157
Total own funds 147 849 151 491
Own funds requirement
Risk exposure amount 610 819 609 959
Expressed as own funds requirement 48 866 48 797
Common Equity Tier 1 capital ratio 19.4% 18.8%
Tier 1 capital ratio 21.6% 21.2%
Total capital ratio 24.2% 24.8%
Own funds in relation to own funds requirement 3.03 3.10
Regulatory Common Equity Tier 1 capital requirement including buffer 10.9% 10.7%
of which capital conservation buffer requirement 2.5% 2.5%
of which systemic risk buffer requirement 3.0% 3.0%
of which countercyclical capital buffer requirement 0.9% 0.7%
Common Equity Tier 1 capital available to meet buffer 1)
14.9% 14.3%
Transitional floor 80% of capital requirement according to Basel I
Minimum floor own funds requirement according to Basel I 89 774 86 884
Own funds according to Basel I 149 030 151 814
Own funds in relation to own funds requirement Basel I 1.66 1.75
Leverage ratio
Exposure measure for leverage ratio calculation 2 519 532 2 549 149
of which on balance sheet items 2 140 093 2 120 587
of which off balance sheet items 379 439 428 562
Leverage ratio 5.2% 5.1%
1) CET1 ratio less minimum capital requirement of 4.5% excluding buffers. In addition to the CET1 requirements there is a total capital
requirement of additional 3.5%.
Internally assessed capital requirement As per 31 December 2017, the internally assessed capital requirement including insurance risk amounted
to SEK 64bn (63). The internal capital requirement is assessed using SEB’s internal models for economic capital and is not fully comparable to the estimated
capital requirement published by the Swedish Financial Supervisory Authority due to differences in assumptions and methodologies.

SEB Annual Accounts 2017 36
Own funds for SEB consolidated situation
31 Dec 31 Dec
SEK m 2017 2016
Shareholders equity according to balance sheet 1)
143 925 140 976
Deductions related to the consolidated situation and other foreseeable charges -14 357 -14 303
Common Equity Tier 1 capital before regulatory adjustments 2)
129 568 126 673
Additional value adjustments -663 -1 169
Intangible assets -6 225 -6 835
Deferred tax assets that rely on future profitability -75 -208
Fair value reserves related to gains or losses on cash flow hedges -1 192 -2 400
Negative amounts resulting from the calculation of expected loss amounts -1 307 -381
Gains or losses on liabilities valued at fair value resulting from changes in own credit standing 99 -115
Defined-benefit pension fund assets -1 807 -920
Direct and indirect holdings of own CET1 instruments -193 -191
Securitisation positions with 1,250% risk weight -35
Total regulatory adjustments to Common Equity Tier 1 -11 364 -12 254
Common Equity Tier 1 capital 118 204 114 419
Additional Tier 1 instruments 13 922 9 959
Grandfathered additional Tier 1 instruments 4 779
Tier 1 capital 132 127 129 157
Tier 2 instruments 18 171 24 851
Net provisioning amount for IRB-reported exposures 126 58
Holdings of Tier 2 instruments in financial sector entities -2 575 -2 575
Tier 2 capital 15 722 22 334
Total own funds 147 849 151 491
1) The Swedish Financial Supervisory Authority has approved SEB´s application to use the net profit in measuring own funds on condition that the
responsible auditors have reviewed the surplus, that the surplus is calculated in accordance with applicable accounting frameworks, that
predictable costs and dividends have been deducted in accordance with EU regulation No 575/2013 and that the calculation was made in
accordance with EU regulation No 241/2014.
2) The Common Equity Tier 1 capital is presented on a consolidated basis, and differs from total equity according to IFRS. The insurance business
contribution to equity is excluded and there is a dividend deduction calculated according to Regulation (EU) No 575/2013 (CRR).

SEB Annual Accounts 2017 37
Risk exposure amount for SEB consolidated situation
SEK m
Credit risk IRB approach
Risk exposure
amount
Own funds
requirement 1)
Risk exposure
amount
Own funds
requirement 1)
Exposures to central governments or central banks 9 319 745
Exposures to institutions 32 838 2 627 26 254 2 100
Exposures to corporates 326 317 26 105 335 413 26 833
Retail exposures 62 296 4 984 55 617 4 449
of which secured by immovable property 36 558 2 925 34 079 2 726
of which retail SME 7 033 563 4 723 378
of which other retail exposures 18 704 1 496 16 815 1 345
Securitisation positions 838 67 3 066 246
Total IRB approach 431 607 34 529 420 350 33 628
Credit risk standardised approach
Exposures to central governments or central banks 4 060 325 1 801 144
Exposures to regional governments or local authorities 51 4
Exposures to public sector entities 29 2
Exposures to institutions 844 68 1 316 105
Exposures to corporates 18 197 1 456 16 422 1 314
Retail exposures 12 084 967 16 186 1 295
Exposures secured by mortgages on immovable property 2 539 203 3 803 304
Exposures in default 112 9 384 31
Exposures associated with particularly high risk 866 69 1 477 118
Securitisation positions 222 18 216 17
Exposures in the form of collective investment undertakings (CIU) 41 3 66 5
Equity exposures 1 972 158 2 119 170
Other items 7 801 624 8 880 711
Total standardised approach 48 739 3 899 52 750 4 220
Market risk
Trading book exposures where internal models are applied 24 892 1 991 30 042 2 403
Trading book exposures applying standardised approaches 9 881 790 9 398 752
Foreign exchange rate risk 4 022 322 3 773 302
Total market risk 38 794 3 104 43 213 3 457
Other own funds requirements
Operational risk advanced measurement approach 48 219 3 858 47 901 3 832
Settlement risk 38 3
Credit value adjustment 6 767 541 7 818 625
Investment in insurance business 16 633 1 331 16 633 1 331
Other exposures 4 219 338 6 547 524
Additional risk exposure amount 2) 15 802 1 264 14 747 1 180
Total other own funds requirements 91 678 7 334 93 646 7 492
Total 610 819 48 866 609 959 48 797
2)The Additional REA was established in 2015 in agreement with the SFSA as a measure of prudence. Capital
Requirements Regulation (EU) No 575/2013 (CRR) Article 3.
1) Own funds requirement 8% of risk exposure amount according to the Capital Requirements Regulation (EU)
No 575/2013 (CRR).
31 Dec
2017
31 Dec
2016

SEB Annual Accounts 2017 38
31 Dec
SEK bn 2017
Balance 31 Dec 2016 610
Asset size 10
Asset quality -6
Foreign exchange movements -3
Model updates, methodology & policy, other 6
Underlying market and operational risk changes -5
Balance 31 Dec 2017 611
Change in risk exposure amount (REA)
Total REA remained unchanged over the year.The increase in credit volumes led to higher credit risk REA, which however was offset by foreign exchange
movements and improved asset quality. Also contributing to higher credit risk REA was the Swedish FSA’s requirement in the second quarter that all
Swedish IRB (internal ratings based) banks shall use the IRB approach for sovereigns and municipalities. Market risk REA was stable over the first three quarters but
decreased by SEK 4bn before year-end. The Additional REA that was established in 2015 in
agreement with the SFSA as a measure of prudence,
increased by SEK 1.1bn to SEK 15.8bn.
Average risk-weight
The following table summarises average risk-weights
(risk exposure amount divided by exposure at default, EAD) for exposures where the risk exposure amount is calculated according to the internal ratings based (IRB)
approach. Repos and securities lending transactions are excluded from the analysis since they carry low risk-weight and can vary considerably in volume, thus
making numbers less comparable.
IRB reported credit exposures (less repos and securities lending) 31 Dec 31 Dec
Average risk-weight 2017 2016
Exposures to central governments or central banks 3.3%
Exposures to institutions 24.0% 25.1%
Exposures to corporates 31.6% 31.4%
Retail exposures 10.4% 9.9%
of which secured by immovable property 7.0% 6.9%
of which retail SME 59.6% 73.4%
of which other retail exposures 30.7% 28.0%
Securitisation positions 10.6% 50.6%

SEB Annual Accounts 2017 39
Skandinaviska Enskilda Banken AB (publ.)
Income statement – Skandinaviska Enskilda Banken AB (publ.) In accordance with FSA regulations Q4 Q3 Q4
SEK m 2017 2017 % 2016 % 2017 2016 %
Interest income 7 990 8 170 -2 7 493 7 32 285 29 022 11
Leasing income 1 382 1 375 1 1 377 0 5 481 5 443 1
Interest expense -4 311 -4 427 -3 -4 140 4 -17 750 -15 223 17
Dividends 1 207 1 018 19 1 252 -4 6 981 6 581 6
Fee and commission income 3 176 2 750 15 3 350 -5 12 153 11 648 4
Fee and commission expense - 649 - 576 13 -1 005 -35 -2 596 -2 805 -7
Net financial income 962 1 075 -10 1 459 -34 4 493 4 642 -3
Other income 509 258 98 261 95 1 342 817 64
Total operating income 10 267 9 643 6 10 047 2 42 390 40 125 6
Administrative expenses -3 571 -3 350 7 -3 909 -9 -14 252 -15 039 -5
Depreciation, amortisation and
impairment of tangible and intangible
assets -2 332 -1 384 69 -1 319 77 -6 377 -5 775 10
Total operating expenses -5 903 -4 733 25 -5 228 13 -20 629 -20 814 -1
Profit before credit losses 4 364 4 909 -11 4 819 -9 21 761 19 311 13
Net credit losses - 162 - 326 -50 - 248 -35 - 749 - 789 -5
Impairment of financial assets1)
-1 347 - 54 - 144 -1 497 -3 841 -61
Operating profit 2 855 4 529 -37 4 427 -36 19 515 14 681 33
Appropriations 664 355 87 1 882 -65 1 885 2 437 -23
Income tax expense - 713 - 935 -24 -1 202 -41 -3 633 -2 877 26
Other taxes 19 0 128 -86 43 137 -69
Net profit 2 825 3 949 -28 5 235 -46 17 811 14 378 24
Jan–Dec
1) As a result of impairment of goodwill in SEB Group, impairment of shares in subsidiaries has affected the parent company in
Q1 2016 with an amount of SEK 2,687m.
Statement of comprehensive income – Skandinaviska Enskilda Banken AB (publ.) Q4 Q3 Q4
SEK m 2017 2017 % 2016 % 2017 2016 %
Net profit 2 825 3 949 -28 5 235 -46 17 811 14 378 24
Items that may subsequently be reclassified to the income statement:
Available-for-sale financial assets - 759 - 79 16 - 878 1 130 -178
Cash flow hedges - 261 - 286 -9 - 473 -45 -1 207 - 811 49
Translation of foreign operations - 10 4 - 36 -72 - 8 25 -132
Other comprehensive income
(net of tax) -1 030 - 361 185 - 493 109 -2 093 344
Total comprehensive income 1 795 3 588 -50 4 742 -62 15 718 14 722 7
Jan–Dec

SEB Annual Accounts 2017 40
Balance sheet - Skandinaviska Enskilda Banken AB (publ.)
Condensed 31 Dec 31 Dec
SEK m 2017 2016
Cash and cash balances with central banks 97 741 70 671
Loans to credit institutions 192 591 287 059
Loans to the public 1 196 824 1 172 095
Financial assets at fair value 261 857 322 195
Fair value changes of hedged items in a portfolio hedge 32
Available-for-sale financial assets 10 521 12 063
Investments in associates 1 032 1 025
Shares in subsidiaries 50 567 50 611
Tangible and intangible assets 36 084 37 186
Other assets 44 914 46 939
Total assets 1 892 163 1 999 844
Deposits from credit institutions 127 539 168 852
Deposits and borrowing from the public1)
822 151 782 584
Debt securities 610 292 664 186
Financial liabilities at fair value 115 869 172 678
Other liabilities 57 618 47 610
Provisions 113 80
Subordinated liabilities 32 390 40 719
Untaxed reserves 21 429 21 761
Total equity 104 762 101 374
Total liabilities, untaxed reserves and shareholders' equity 1 892 163 1 999 844
1) Private and SME deposits covered by deposit guarantee 186 674 177 381
Private and SME deposits not covered by deposit guarantee 135 254 127 507
All other deposits 500 224 477 696
Total deposits from the public 822 151 782 584
Pledged assets, contingent liabilities and commitments - Skandinaviska Enskilda Banken AB (publ.) 31 Dec 31 Dec
SEK m 2017 2016
Pledged assets for own liabilities 447 925 392 227
Other pledged assets 114 494 152 317
Pledged assets 562 419 544 544
Contingent liabilities 103 059 97 642
Commitments 435 488 468 953
Contingent liabilities and commitments 538 547 566 595
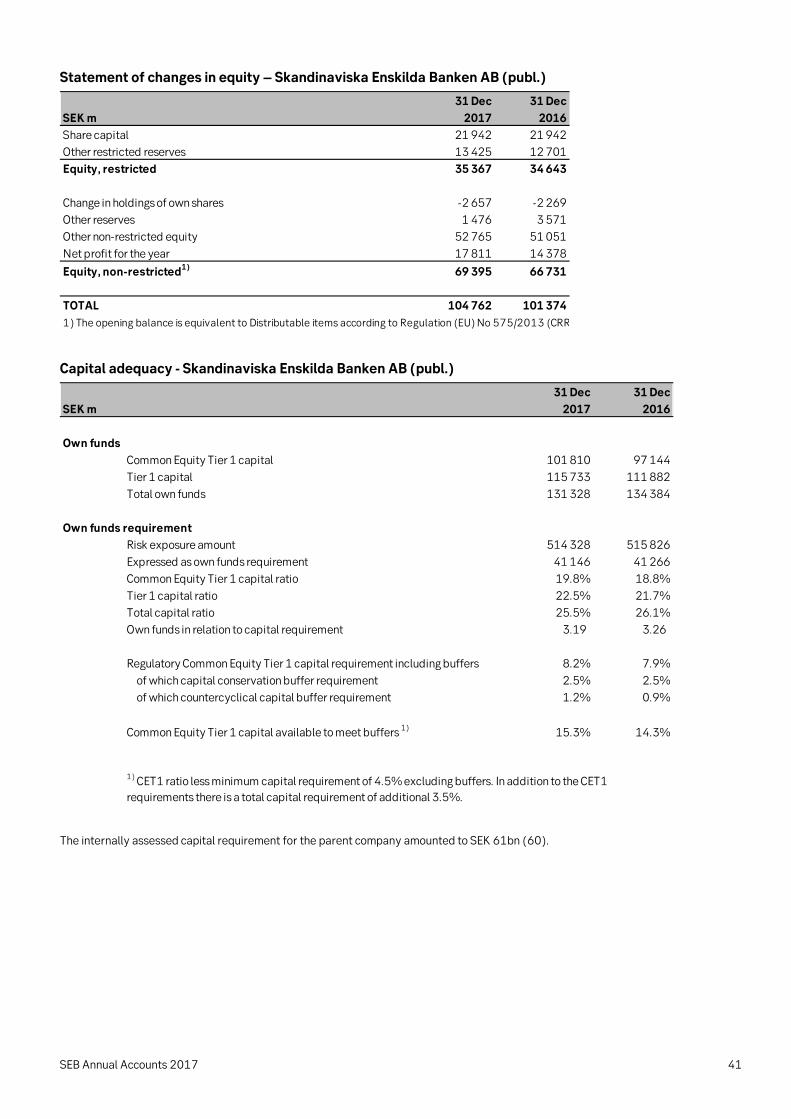
SEB Annual Accounts 2017 41
Statement of changes in equity – Skandinaviska Enskilda Banken AB (publ.)
31 Dec 31 Dec
SEK m 2017 2016
21 942 21 942
Other restricted reserves 13 425 12 701
Equity, restricted 35 367 34 643
Change in holdings of own shares -2 657 -2 269
Other reserves 1 476 3 571
Other non-restricted equity 52 765 51 051
Net profit for the year 17 811 14 378
Equity, non-restricted1)69 395 66 731
TOTAL 104 762 101 374
1) The opening balance is equivalent to Distributable items according to Regulation (EU) No 575/2013 (CRR
Share capital
Capital adequacy - Skandinaviska Enskilda Banken AB (publ.)
31 Dec 31 Dec
SEK m 2017 2016
Own funds
Common Equity Tier 1 capital 101 810 97 144
Tier 1 capital 115 733 111 882
Total own funds 131 328 134 384
Own funds requirement
Risk exposure amount 514 328 515 826
Expressed as own funds requirement 41 146 41 266
Common Equity Tier 1 capital ratio 19.8% 18.8%
Tier 1 capital ratio 22.5% 21.7%
Total capital ratio 25.5% 26.1%
Own funds in relation to capital requirement 3.19 3.26
Regulatory Common Equity Tier 1 capital requirement including buffers 8.2% 7.9%
of which capital conservation buffer requirement 2.5% 2.5%
of which countercyclical capital buffer requirement 1.2% 0.9%
Common Equity Tier 1 capital available to meet buffers 1)15.3% 14.3%
1) CET1 ratio less minimum capital requirement of 4.5% excluding buffers. In addition to the CET1
requirements there is a total capital requirement of additional 3.5%.
The internally assessed capital requirement for the parent company amounted to SEK 61bn (60).
SEB Annual Accounts 2017 42
Definitions - Alternative Performance Measures1
Items affecting comparability To facilitate the comparison of operating profit between
current and previous periods, items with significant impact that management considers affect the comparability or are
relevant for the understanding of the financial result, are identified and presented separately, for example impairment
of goodwill, restructuring, net profit from divestments and other income or costs that are not recurring.
Operating profit
Total profit before tax.
Operating profit before items affecting comparability
Total profit before items affecting comparability and tax.
Return on equity
Net profit attributable to shareholders in relation to average2
shareholders’ equity.
Return on equity excluding items affecting comparability
Net profit attributable to shareholders, excluding items effecting comparability and their related tax effect, in relation
to average2 shareholders’ equity.
Return on business equity
Operating profit by division, reduced by a standard tax rate, in relation to the divisions’ average2 business equity (allocated
capital).
Return on total assets Net profit attributable to shareholders, in relation to average2
total assets.
Return on risk exposure amount Net profit attributable to shareholders in relation to average2
risk exposure amount.
Cost/income ratio
Total operating expenses in relation to total operating income.
Basic earnings per share Net profit attributable to shareholders in relation to the
weighted average3 number of shares outstanding before dilution.
Diluted earnings per share
Net profit attributable to shareholders in relation to the weighted average3 diluted number of shares. The calculated
dilution is based on the estimated economic value of the long-term equity-based programmes.
Net worth per share The sum of shareholders’ equity and the equity portion of any
surplus values in the holdings of interest-bearing securities and the surplus value in life insurance operations in relation to
the number of shares outstanding.
Equity per share Shareholders’ equity in relation to the number of shares
outstanding.
Credit loss level Net credit losses in relation to the sum of the opening balances
of loans to the public, loans to credit institutions and loan guarantees less specific, collective and off balance sheet
reserves.
Gross level of impaired loans Individually assessed impaired loans, gross, in relation to the
sum of loans to the public and loans to credit institutions before reduction of reserves.
Net level of impaired loans
Individually assessed impaired loans, net (less specific reserves), in relation to the sum of net loans to the public and
loans to credit institutions less specific reserves and collective reserves.
Specific reserve ratio for individually assessed impaired loans
Specific reserves in relation to individually assessed impaired loans.
Total reserve ratio for individually assessed impaired loans
Total reserves (specific reserves and collective reserves for individually assessed impaired loans) in relation to individually
assessed impaired loans.
Reserve ratio for portfolio assessed loans Collective reserves for portfolio assessed loans in relation to
portfolio assessed loans past due more than 60 days or restructured loans.
Non-performing loans (NPL) SEB’s term for loans that are either impaired or not performing
according to the loan contract. Includes individually assessed impaired loans, portfolio assessed loans, past due more than
60 days and restructured portfolio assessed loans .
NPL coverage ratio Total reserves (specific, collective and off balance sheet
reserves) in relation to non-performing loans.
NPL per cent of lending Non-performing loans in relation to the sum of loans to the
public and loans to credit institutions before reduction of reserves.
1 Alternative Performance Measures, APMs, are financial measures of
historical or future financial performance, financial position, or cash
flows, other than those defined in the applicable financial reporting
framework (IFRS) or in the EU Capital Requirements Regulation and Directive CRR/CRD IV. APMs are used by SEB when relevant to assess
and describe SEB’s financial situation and provide additional relevant
information and tools to enable analysis of SEB’s performance. APMs on basic earnings per share, diluted earnings per share, net worth per share,
equity per share, return on equity, return on total assets and return on
risk exposure amount provide relevant information on the performance in relation to different investment measurements. The cost/income ratio
provides information on SEB’s cost efficiency. APMs related to lending
provide information on provisions in relation to credit risk. All these measures may not be comparable to similarly titled measures used by
other companies. 2 Average year-to-date, calculated on month-end figures. 3 Average, calculated on a daily basis.
The excel file Alternative Performance Measures, available on
sebgroup.com/ir, provides information on how the measures are
calculated.

SEB Annual Accounts 2017
43
STOCKHOLM 3 MAY 2011
DefinitionsAccording to the EU Capital Requirements Regulation no 575/2013 (CRR)
Risk exposure amount
Total assets and off balance sheet items, weighted in accordance with capital adequacy regulations for credit risk
and market risk. The operational risks are measured and added as risk exposure amount. Risk exposure amounts are
only defined for the consolidated situation, excluding insurance entities and items deducted from own funds.
Common Equity Tier 1 capital
Shareholders’ equity excluding proposed dividend, deferred tax assets, intangible assets and certain other regulatory
adjustments defined in EU Regulation no 575/2013 (CRR).
Tier 1 capital
Common Equity Tier 1 capital plus qualifying forms of subordinated loans.
Tier 2 capital
Mainly subordinated loans not qualifying as Tier 1 capital contribution.
Own funds
The sum of Tier 1 and Tier 2 capital.
Common Equity Tier 1 capital ratio Common Equity Tier 1 capital as a percentage of risk exposure
amount.
Tier 1 capital ratio
Tier 1 capital as a percentage of risk exposure amount.
Total capital ratio Total own funds as a percentage of risk exposure amount.
Leverage ratio
Tier 1 capital as a percentage of total assets including off balance sheet items with conversion factors according to the
standardised approach.
Liquidity Coverage Ratio (LCR)
High-quality liquid assets in relation to the estimated net cash outflows over the next 30 calendar days.
SEB Annual Accounts 2017 44
This is SEB
Our vision To deliver world-class service to our customers.
Our purpose We believe that entrepreneurial minds and innovative companies are key to creating a better world. We are here to enable them to achieve their aspirations and succeed through good times and bad.
Our overall ambition To be the undisputed leading Nordic bank for corporations and institutions and the top
universal bank in Sweden and the Baltic countries.
Whom we serve 2,300 large corporations, 700 financial institutions, 267,000 SME and 1.4 million
private full-service customers bank with SEB.
Our strategic priorities Leading customer experience – develop long-term relationships based on trust so that
customers feel that the services and advice offered are insightful about their needs, are
convenient and accessible on their terms and that SEB shares knowledge and acts proactively in their best interest.
Growth in areas of strength – pursue growth in three selected core areas – offering to all customer segments in Sweden, large corporations and financial institutions in the Nordic countries, Germany and the United Kingdom and savings offering to private
individuals and corporate customers. Resilience and flexibility – maintain resilience and flexibility in order to adapt operations
to the prevailing market conditions. Resilience is based upon cost and capital efficiency.
Values Guided by our Code of Business Conduct and our core values: customers first,
commitment, collaboration and simplicity.
People Around 15,000 highly skilled employees serving customers from locations in some 20
countries; covering different time zones, securing reach and local market knowledge.
History 160 years of business, trust and sharing knowledge. The Bank has always acted
responsibly in society promoting entrepreneurship, international outlook and long-term relationships.
Additional financial information is available in SEB’s Fact Book which is published quarterly on sebgroup.com/ir