interim report 30.06.2015
TRANSCRIPT

Amana Takaful PLC
Interim Report
30th June 2015
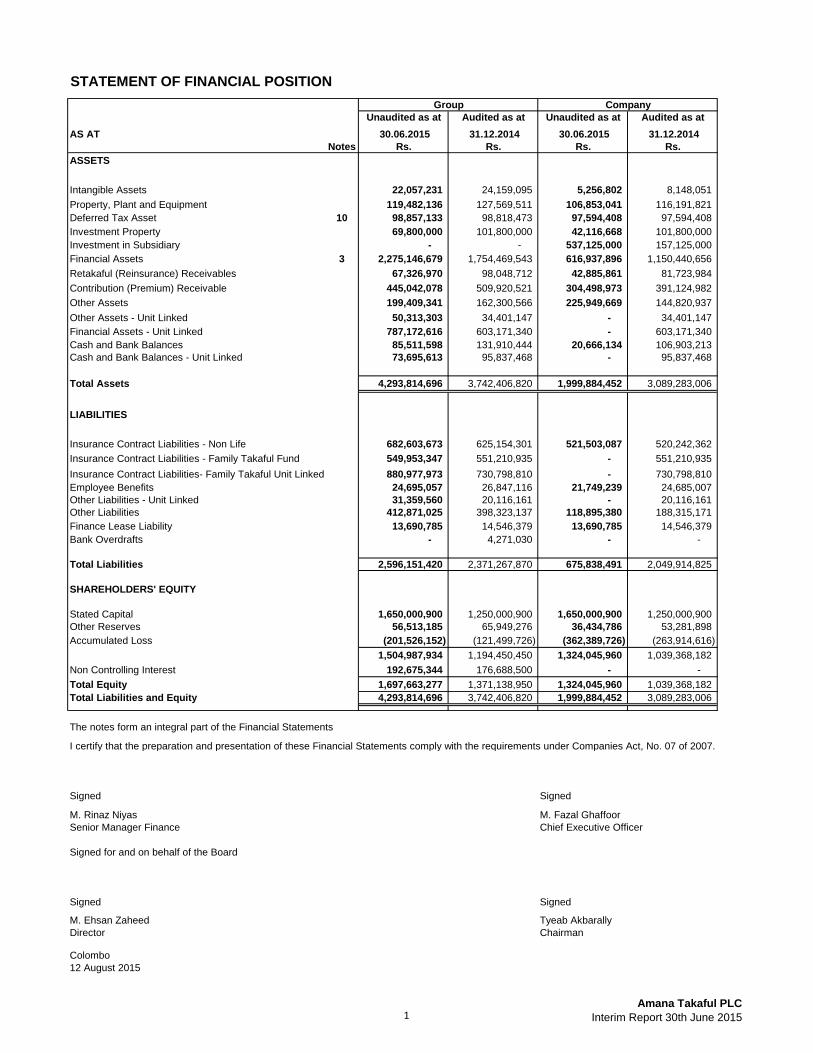
Unaudited as at Audited as at Unaudited as at Audited as at
AS AT 30.06.2015 31.12.2014 30.06.2015 31.12.2014
Notes Rs. Rs. Rs. Rs.
ASSETS
Intangible Assets 22,057,231 24,159,095 5,256,802 8,148,051
Property, Plant and Equipment 119,482,136 127,569,511 106,853,041 116,191,821
Deferred Tax Asset 10 98,857,133 98,818,473 97,594,408 97,594,408
Investment Property 69,800,000 101,800,000 42,116,668 101,800,000
Investment in Subsidiary - - 537,125,000 157,125,000
Financial Assets 3 2,275,146,679 1,754,469,543 616,937,896 1,150,440,656
Retakaful (Reinsurance) Receivables 67,326,970 98,048,712 42,885,861 81,723,984
Contribution (Premium) Receivable 445,042,078 509,920,521 304,498,973 391,124,982
Other Assets 199,409,341 162,300,566 225,949,669 144,820,937
Other Assets - Unit Linked 50,313,303 34,401,147 - 34,401,147
Financial Assets - Unit Linked 787,172,616 603,171,340 - 603,171,340
Cash and Bank Balances 85,511,598 131,910,444 20,666,134 106,903,213
Cash and Bank Balances - Unit Linked 73,695,613 95,837,468 - 95,837,468
Total Assets 4,293,814,696 3,742,406,820 1,999,884,452 3,089,283,006
LIABILITIES
Insurance Contract Liabilities - Non Life 682,603,673 625,154,301 521,503,087 520,242,362
Insurance Contract Liabilities - Family Takaful Fund 549,953,347 551,210,935 - 551,210,935
Insurance Contract Liabilities- Family Takaful Unit Linked 880,977,973 730,798,810 - 730,798,810
Employee Benefits 24,695,057 26,847,116 21,749,239 24,685,007
Other Liabilities - Unit Linked 31,359,560 20,116,161 - 20,116,161
Other Liabilities 412,871,025 398,323,137 118,895,380 188,315,171
Finance Lease Liability 13,690,785 14,546,379 13,690,785 14,546,379
Bank Overdrafts - 4,271,030 - -
Total Liabilities 2,596,151,420 2,371,267,870 675,838,491 2,049,914,825
SHAREHOLDERS' EQUITY
Stated Capital 1,650,000,900 1,250,000,900 1,650,000,900 1,250,000,900
Other Reserves 56,513,185 65,949,276 36,434,786 53,281,898
Accumulated Loss (201,526,152) (121,499,726) (362,389,726) (263,914,616)
1,504,987,934 1,194,450,450 1,324,045,960 1,039,368,182
Non Controlling Interest 192,675,344 176,688,500 - -
Total Equity 1,697,663,277 1,371,138,950 1,324,045,960 1,039,368,182
Total Liabilities and Equity 4,293,814,696 3,742,406,820 1,999,884,452 3,089,283,006
The notes form an integral part of the Financial Statements
I certify that the preparation and presentation of these Financial Statements comply with the requirements under Companies Act, No. 07 of 2007.
Signed Signed
M. Rinaz Niyas M. Fazal Ghaffoor
Senior Manager Finance Chief Executive Officer
Signed for and on behalf of the Board
Signed Signed
M. Ehsan Zaheed Tyeab Akbarally
Director Chairman
Colombo
12 August 2015
STATEMENT OF FINANCIAL POSITION
Group Company
1 Amana Takaful PLC
Interim Report 30th June 2015

STATEMENT OF COMPREHENSIVE INCOME
Unaudited Unaudited Unaudited Unaudited
FOR THE PERIOD ENDED 30TH JUNE 2015 2014 Change 2015 2014
Notes Rs. Rs. % Rs. Rs.
Gross Written Contribution (Premium) 4 1,556,782,098 1,265,134,490 23% 729,581,230 928,758,492
Retakaful Contribution (Reinsurance Premium) (338,498,408) (283,833,225) 19% (126,498,558) (119,242,390)
Net Written Contribution (Premium) 1,218,283,690 981,301,265 24% 603,082,672 809,516,102
Net Change in Reserve for Un-Earned Contribution
(Premium) (48,735,049) (12,741,706) 282% (4,601,970) (4,606,091)
Net Earned Contribution (Premium) 1,169,548,641 968,559,559 21% 598,480,702 804,910,011
Other Revenue
Income from investments 70,237,169 97,415,969 -28% 13,966,294 95,136,837
Fair Value Gains and Losses of Available For Sale
Financial Assets (10,892) (222,346) -95% 877,660 (222,346)
Other income 22,227,047 16,243,473 37% 2,322,959 3,725,845
Total Revenue 5 1,262,001,966 1,081,996,655 17% 615,647,615 903,550,347
Benefits, Losses and Expenses
Takaful (Insurance) claims and benefits (597,821,730) (405,385,498) 47% (427,983,832) (366,580,416)
Acquisition Cost (net of reinsurance commission) (113,531,540) (84,602,302) 34% (34,354,746) (55,442,685)
Change in Family Takaful Contract Liability (178,991,870) (148,519,227) 21% - (148,519,227)
Other Operating and Administration Expenses (415,007,775) (353,233,855) 17% (238,637,195) (294,943,709)
Depreciation (14,566,556) (12,568,756) 16% (12,132,862) (11,354,707)
Total Claims, Benefits and Expenses (1,319,919,470) (1,004,309,638) 31% (713,108,635) (876,840,744)
Profit from Operations (57,917,505) 77,687,017 -175% (97,461,020) 26,709,603
Finance cost (1,720,311) (2,855,419) -40% (1,014,090) (583,086)
Profit / (Loss) Before Taxation 8 (59,637,815) 74,831,598 -180% (98,475,110) 26,126,517
Income Tax Expenses 9 (5,306,039) (6,640,862) -20% - -
Net Profit / (Loss) for the Period (64,943,854) 68,190,736 -195% (98,475,110) 26,126,517
Attributable to: Rs Rs
Equity holders of the parent (80,026,426) 49,357,555
Non-Controlling Interest 15,082,572 18,833,181
(64,943,854) 68,190,736
Rs Rs Rs Rs
Basic / Diluted Earnings / (Loss) Per Share To Equity Holders (0.05) 0.05 -208% (0.07) 0.03
Dividend per share
Interim dividend paid per share - - - - -
Final proposed dividend per share - - - - -
- - - - -
Group Company
2 Amana Takaful PLC
Interim Report 30th June 2015

OTHER COMPREHENSIVE INCOME
Unaudited Unaudited Unaudited Unaudited
FOR THE PERIOD ENDED 30TH JUNE 2015 2014 Change 2015 2014
Rs. Rs. % Rs. Rs.
Other Comprehensive Income
Profit / (Loss) for the period (64,943,854) 68,190,736 -195% (98,475,110) 26,126,517
Fair Value of Available for Sale Financial Assets 10,892 222,346 -95% (877,660) 222,346
12,586,030 (2,566,979) 590% - -
Total Comprehensive Income / (Loss) for the period (52,346,933) 65,846,104 -179% (99,352,770) 26,348,863
Attributable to;
Equity holders of the parent (73,493,066) 47,012,923
Non-Controlling Interest 21,146,133 18,833,181
(52,346,933) 65,846,104
Group Company
Foreign Currency Translation Differences for Foreign Operations
3 Amana Takaful PLC
Interim Report 30th June 2015

STATEMENT OF COMPREHENSIVE INCOME
Unaudited Unaudited Unaudited Unaudited
FOR THE QUARTER ENDED 30TH JUNE 2015 2014 Change 2015 2014
Rs. Rs. % Rs. Rs.
Revenues
Gross Written Contribution (Premium) 766,359,114 629,478,090 22% 352,360,580 476,019,200
Retakaful Contribution (Reinsurance Premium) (160,694,556) (135,734,179) 18% (66,273,237) (67,386,552)
Net Written Contribution (Premium) 605,664,557 493,743,911 23% 286,087,343 408,632,648
Net Change in Reserve for Un-Earned Contribution (Premium) (12,484,491) (22,451,447) 44% 8,704,402 (15,375,832)
Net Earned Contribution (Premium) 593,180,066 471,292,464 26% 294,791,744 393,256,817
Other Revenue
Income from investments 49,027,546 68,215,150 -28% 10,758,674 55,990,917
Fair Value Gains and Losses of Available For Sale Financial
Assets (2,563,341) (3,418,704) 25% (916,079) (3,418,704)
Other income / (Loss) 9,335,302 9,932,080 -6% 1,027,278 2,986,937
Total Revenue 648,979,574 546,020,990 19% 305,661,617 448,815,967
Benefits, Losses and Expenses
Takaful (Insurance) claims and benefits (302,221,747) (197,623,886) 53% (212,932,628) (180,433,593)
Acquisition Cost (net of reinsurance commission) (51,658,360) (34,283,122) 51% (14,840,495) (24,651,683)
Change in Family Takaful Contract Liability (101,979,268) (88,093,816) 16% - (88,093,816)
Other Operating and Administration Expenses (206,053,266) (183,944,935) 12% (117,407,707) (151,357,815)
Depreciation (5,873,113) (4,786,551) 23% (5,117,208) (4,878,068)
Total Claims, Benefits and Expenses (667,785,755) (508,732,311) 31% (350,298,038) (449,414,975)
Profit / (Loss) from Operations (18,806,181) 37,288,679 -150% (44,636,421) (599,008)
Finance cost (1,000,966) (1,388,194) 28% (440,715) (401,912)
Profit Before Taxation (19,807,148) 35,900,485 155% (45,077,136) (1,000,920)
Income Tax Expenses (2,803,896) (5,569,725) -50% - -
Net Profit for the Quarter (22,611,044) 30,330,760 -175% (45,077,136) (1,000,920)
Attributable to: Rs Rs
Equity holders of the parent (29,038,442) 16,127,986
Non-Controlling Interest 6,427,398 14,202,774
(22,611,044) 30,330,760
Rs Rs Rs Rs
Basic / Diluted Earnings Per Share To Equity Holders (0.02) 0.02 -220% (0.03) (0.001)
Dividend per share
Interim dividend paid per share - - - - -
Final proposed dividend per share - - - - -
- - - - -
Group Company
4 Amana Takaful PLC
Interim Report 30th June 2015

GROUP STATEMENT OF CHANGES IN EQUITY
FOR THE PERIOD ENDED 30TH JUNE 2015
Stated Capital Revaluation
Reserve
Accumulated
Losses
Available For
Sale Reserve
Exchange
Fluctuation
Reserve
Prepaid
Share
Reserve
Non
Controlling
Interest
Total Equity
(Rs) (Rs) (Rs) (Rs) (Rs) (Rs) (Rs) (Rs)
Balance as at 01st January 2014 1,250,000,900 30,128,071 (184,268,515) 26,711,229 15,505,816 - 154,950,901 1,293,028,404
Net Profit for the period - - 49,357,555 - - - 18,833,181 68,190,736
Other Comprehensive Income
Net Change in Fair Value of Available for Sale Financial Asstes - - - 222,346 - - - 222,346
Foreign Currency Translation Difference - - - - (1,411,838) - (1,155,141) (2,566,979)
Total Comprehensive Income - - 49,357,555 222,346 (1,411,838) - 17,678,040 65,846,104
Dividend paid - - - - - - (4,997,139) (4,997,139)
Balance as at 30th June 2014 1,250,000,900 30,128,071 (134,910,960) 26,933,575 14,093,979 - 167,631,803 1,353,877,367
Net Profit for the period - - 18,335,224 - - - 16,484,910 34,820,135
Other Comprehensive Income
Net Change in Fair Value of Available for Sale Financial Asstes - - - (4,973,746) - - (6,658,208) (11,631,954)
Net Change in Fair Value of Available for Sale Financial Assets
- Transferred to Profit or Loss - - - (21,395,206) - - - (21,395,206)
Defined Benefit Plan Acturial Losses, Net of deferred Tax - - (4,923,991) - - - - (4,923,991)
Foreign Currency Translation Difference - - - - 5,193,151 - 4,248,943 9,442,094
Total Comprehensive Income - - 13,411,234 (26,368,951) 5,193,151 - 14,075,645 6,311,079
Dividend paid - - - - - - (5,018,948) (5,018,948)
Advance received for the Ordinary Shares to be issued - - - - - 15,969,452 - 15,969,452
Balance as at 31st December 2014 1,250,000,900 30,128,071 (121,499,726) 564,624 19,287,130 15,969,452 176,688,500 1,371,138,950
Net Profit for the period - - (80,026,426) - - - 15,082,572 (64,943,853)
Other Comprehensive Income
Net Change in Fair Value of Available for Sale Financial Assets - - - (388,957) - - 399,848 10,892
Foreign Currency Translation Difference - - - - 6,922,316 - 5,663,713 12,586,030
Total Comprehensive Income - - (80,026,426) (388,957) 6,922,316 - 21,146,133 (52,346,931)
Dividend paid - - - - - - (5,159,290) (5,159,290)
Issue of Ordinary Shares 400,000,000 - - - - (15,969,452) - 384,030,548
Balance as at 30th June 2015 1,650,000,900 30,128,071 (201,526,152) 175,667 26,209,446 - 192,675,344 1,697,663,277
COMPANY STATEMENT OF CHANGES IN EQUITY
FOR THE PERIOD ENDED 30TH JUNE 2015
Stated Capital Revaluation
Reserve
Accumulated
Losses
Prepaid
Share
Reserve
Available
For Sale
Reserve
Total Equity
(Rs) (Rs) (Rs) (Rs) (Rs) (Rs)
Balance as at 1st January 2014 1,250,000,900 30,128,071 (323,554,575) - 26,711,229 983,285,625
Net Profit for the period - - 26,126,517 - - 26,126,517
Other Comprehensive Income
Net Change in Fair Value of Available for Sale Financial Assets - - - - 222,346 222,346
Total Comprehensive Income - - 26,126,517 - 222,346 26,348,863
Balance as at 30th June 2014 1,250,000,900 30,128,071 (297,428,058) - 26,933,575 1,009,634,488
Net Profit for the period - - 37,593,907 - - 37,593,907
Other Comprehensive Income
Net Change in Fair Value of Available for Sale Financial Asstes - - - - 1,646,006 1,646,006
Net Change in Fair Value of Available for Sale Financial Assets
- Transferred to Profit or Loss - - - - (21,395,206) (21,395,205)
Defined Benefit Plan Acturial Losses, Net of deferred Tax - - (4,080,467) - - (4,080,467)
Total Comprehensive Income - - 33,513,440 - (19,749,200) 13,764,242
Advance received for the Ordinary Shares to be issued - - - - - 15,969,452 - 15,969,452
Balance as at 31st December 2014 1,250,000,900 30,128,071 (263,914,616) 15,969,452 7,184,375 1,039,368,182
Net Profit for the period - - (98,475,110) - - (98,475,110)
Other Comprehensive Income
Net Change in Fair Value of Available for Sale Financial Asstes - - - - (877,660) (877,660)
Total Comprehensive Income - - (98,475,110) - (877,660) (99,352,770)
Issue of Ordinary Shares 400,000,000 - - (15,969,452) - 384,030,548
Balance as at 30th June 2015 1,650,000,900 30,128,071 (362,389,726) - 6,306,715 1,324,045,960
5 Amana Takaful PLC
Interim Report 30th June 2015

CASH FLOW STATEMENT
Unaudited Unaudited Unaudited Unaudited
FOR THE PERIOD ENDED 30TH JUNE 2015 2014 2015 2014
Rs Rs Rs Rs
Cash Flows from Operating Activities
Contribution (Premium) received from customers 1,621,660,542 1,145,600,738 816,207,240 895,210,628
Retakaful (Reinsurance) Premium paid (336,326,846) (156,173,883) (138,784,271) (81,115,704)
Claims, Benefits and Expenses paid (697,438,239) (561,058,192) (466,470,265) (531,058,192)
Retakaful (Reinsurance) Receipts in respect of Claims 73,292,229 30,040,678 68,552,728 28,453,963
Cash paid to and behalf of Employees (178,469,750) (166,643,820) (107,793,790) (130,948,563)
Profits received from Investments and Other Income 65,471,361 46,894,536 15,787,468 44,449,367
Dividends received 14,129,313 - 2,826,559 943,263
Finance Cost paid 1,720,311 (2,855,419) 1,014,090 (583,086)
Other operating cash payments (292,920,291) (289,525,430) (212,184,723) (244,927,338)
Cash Flow from/(used in) Operating Activities (Note A) 271,118,629 46,279,207 (20,844,964) (19,575,660)
Gratuity Paid (5,720,737) (3,188,300) (5,720,737) (3,188,300)
Net Cash Flow from/(used in) Operating Activities 265,397,892 43,090,907 (26,565,700) (22,763,960)
Cash Flows from/(used in) Investing Activities
Net Disposal/(Purchase) of Investment Securities (653,805,395) 13,005,512 (168,134,799) 46,321,042
Purchase of Intangible Assets (599,560) (80,870) - (80,870)
Purchase of Property, Plant & Equipment (9,193,773) (59,983,673) (7,046,202) (51,397,992)
Disposal of Property, Plant & Equipment 2,714,593 - 4,252,120 -
Disposal of Investment Property 32,000,000 - 16,000,000 -
Disposal / (Purchase) of Subsidiaries - - (380,000,000) -
Net Cash Flow from/(used in) Investing Activities (628,884,135) (47,059,031) (534,928,882) (5,157,820)
Cash Flows from Financing Activities
Repayment of Extended Murabaha Facility - (362,372) - (362,372)
Repayment of Lease Facility (1,984,693) 12,426,715 (1,984,693) 12,426,715
Dividend Paid (5,159,290) - - -
Proceeds from Rights Issue 384,030,548 - 384,030,548 -
Net cash flows from financing activities 376,886,565 12,064,343 382,045,854 12,064,342
Increase/(Decrease) in Cash and Cash Equivalents (Note B) 13,400,322 8,096,219 (179,448,727) (15,857,439)
Group Company
6 Amana Takaful PLC
Interim Report 30th June 2015

CASH FLOW STATEMENT cont..
Unaudited Unaudited Unaudited Unaudited
FOR THE PERIOD ENDED 30TH JUNE 2015 2014 2015 2014
Rs. Rs. Rs. Rs.
NOTE A
Reconciliation of Operating Profit/(Loss) with Cash Flows from Operations
Profit / (Loss) from Operations (57,917,505) 77,687,017 (97,461,020) 26,709,603
Depreciation 14,566,556 12,568,756 12,132,862 11,354,707
Amortisations 2,701,423 283,113 1,985,828 566,227
Provision for Gratuity 3,568,678 4,018,976 2,784,969 4,018,976
Unrealised (Income)/Losses 9,374,396 (41,192,645) 3,770,073 (36,705,738)
(Increase)/Decrease in Debtors and Other Assets 42,579,255 (241,059,324) 100,857,234 (197,744,456)
Increase in Family Takaful (Long Term Insurance) Fund 178,991,870 148,519,227 - 148,519,227
Increase/(Decrease) in Unearned Contribution (Premium) 48,735,049 12,741,706 4,601,970 4,606,091
Increase/(Decrease) in Claims Provision 8,663,531 (45,925,044) (3,341,245) (34,051,098)
Increase/(Decrease) in Other Creditors 18,135,064 121,492,843 (47,189,726) 53,733,887
Finance Cost Paid 1,720,311 (2,855,419) 1,014,090 (583,086)
Cash Flows from/(usedin) Operating Activities 271,118,629 46,279,207 (20,844,964) (19,575,660)
Note B
Increase/( Decrease ) in Cash and Cash Equivalents
Cash at bank and in Hand and Cash Equivalents 531,669,934 144,934,660 182,907,182 77,084,660
Over drafts - - - -
Cash and Cash Equivalents at the end of the period 531,669,934 144,934,660 182,907,182 77,084,660
Cash and Cash Equivalents at the beginning of the year 518,269,611 136,838,441 472,778,442 92,942,099
Cash and Cash Equivalents transferred to Amana Takaful Life Ltd - - 110,422,533 -
Increase/( Decrease ) in Cash and Cash Equivalents 13,400,322 8,096,219 (179,448,727) (15,857,439)
Group Company
7 Amana Takaful PLC
Interim Report 30th June 2015

FAMILY TAKAFUL / LIFE INSURANCE FUND - SUPPLEMENTAL
Unaudited as at Audited as at
AS AT 30.06.2015 31.12.2014
Rs. Rs.
ASSETS
Intangible Assets 14,074,080 -
Property, Plant and Equipment 6,600,844 -
Investment Property 27,683,332 43,683,332
Financial Assets 1,065,976,439 590,098,533
Retakaful Receivable 1,506,860 313,733
Contribution (Premium) Receivable 32,467,405 29,941,781
Other Assets 11,685,119 19,771,455
Other Assets - Unit Linked 50,313,303 34,401,147
Financial Assets - Unit Linked 787,172,616 603,171,340
Cash and Bank Balances 3,403,271 14,585,065
Cash and Bank Balances - Unit Linked 73,695,613 95,837,468
Total Assets 2,074,578,882 1,431,803,854
LIABILITIES
Insurance Contract Liability - Family Takaful Fund 549,953,347 551,210,935
Insurance Contract Liability - Family Takaful Linked Unit Linked 880,977,973 730,798,810
Inter Fund Payables - 87,454,742
Intercompany Payables 47,094,082 -
Employee Benefits 783,709 -
Re Takaful (Reinsurance) Payable 7,560,493 7,560,493
Management Fee Payable - 19,094,060
Other Liabilities 53,661,588 15,568,653
Other Liabilities - Unit Linked 31,359,560 20,116,161
Total Liability 1,571,390,753 1,431,803,854
SHAREHOLDERS' EQUITY
Stated Capital 500,000,000 -
Other Reserves 1,518,058 -
Accumulated Loss 1,670,071 -
Total Equity 503,188,129 -
Total Equity and Liability 2,074,578,882 1,431,803,854
#REF!
STATEMENT OF FINANCIAL POSITION
The above Long Term Insurance ( Family Takaful ) Balance Sheet is to be read in conjunction with the consolidated Balance Sheet.
8 Amana Takaful PLC
Interim Report 30th June 2015

NOTES TO THE FINANCIAL STATEMENTS
1. Figures in the Interim Financial Statements for the period ended 30th June 2015 are provisional and unaudited.
3. Financial Assets
Unaudited as at Audited as at Unaudited as at Audited as at
AS AT 30.06.2015 31.12.2014 30.06.2015 31.12.2014
Rs. Rs. Rs. Rs.
Financial Assets at Fair Value Through Profit or Loss (3.1) 120,457,148 113,201,213 48,539,340 107,127,360
Available For Sale Financial Assets (3.2) 351,376,801 279,338,549 57,954,858 130,779,745
Loans & Receivables (3.3) 1,803,312,730 1,361,929,781 510,443,698 912,533,551
2,275,146,679 1,754,469,543 616,937,896 1,150,440,656
Unaudited as at Audited as at Unaudited as at Audited as at
AS AT 30.06.2015 31.12.2014 30.06.2015 31.12.2014
Rs. Rs. Rs. Rs.
3.1 Financial Assets at Fair Value Through Profit & Loss
Investments in Equity Securities 120,457,148 113,201,213 48,539,340 107,127,360
120,457,148 113,201,213 48,539,340 107,127,360
3.2 Available For Sale Financial Assets
Investments in Equity Securities - Quoted 79,206,723 54,379,535 - -
Unit Trust 264,484,705 219,255,865 56,429,858 125,076,596
Investments in Equity Securities - Unquoted 525,000 525,000 525,000 525,000
Treasury Bills 7,160,373 5,178,149 1,000,000 5,178,149
351,376,801 279,338,549 57,954,858 130,779,745
3.3 Loans and Receivable
Repurchase Agreements 374,462,722 337,141,540 162,241,048 311,675,306
Murabaha Investments 185,657,171 170,760,615 - -
Mudharaba Investments 1,232,533,335 842,255,763 337,813,169 589,489,433
Bank Deposits 73,798 73,848 73,798 73,848
Advances to Company Officers 10,585,704 11,698,015 10,315,683 11,294,965
1,803,312,730 1,361,929,781 510,443,698 912,533,551
4. Gross Written Premium (Contribution)
Unaudited Unaudited Unaudited Unaudited
FOR THE PERIOD ENDED 30TH JUNE 2015 2014 2015 2014
Rs. Rs. Rs. Rs.
4.1 Non-Life (General Takaful)
Motor 503,077,752 468,588,760 483,378,404 456,949,600
Fire 254,131,557 201,636,107 70,526,394 66,411,162
Marine 96,108,635 61,035,597 53,255,983 16,965,216
Medical 212,880,757 165,982,145 70,278,238 57,418,982
Miscellaneous 98,829,892 89,643,408 52,142,211 52,765,059
1,165,028,594 986,886,017 729,581,230 650,510,019
4.2 Long Term Insurance (Family Takaful)
Family Takaful 73,323,070 84,301,482 - 84,301,482
Mortgage & Group Family Takaful 20,491,455 12,504,617 - 12,504,617
Unit Linked 297,938,979 181,442,374 - 181,442,374
391,753,504 278,248,473 - 278,248,473
Total Gross Written Premium 1,556,782,098 1,265,134,490 729,581,230 928,758,492
Group Company
Group Company
2. These Interim Financial Statements of the Company and Group have been prepared in accordance with Sri Lanka Accounting Standards (SLAS) prefixed both SLFRS
(corresponding to IFRS) and LKAS (corresponding to IAS), promulgated by the Institute of Chartered Accountants of Sri Lanka (ICASL) and comply with the requirements
of the Companies Act, No. 7 of 2007 and the Regulation of Insurance Industry Act, No. 43 of 2000.
The same accounting policies and methods of computation as stated in the Annual Report 2014 have been followed in preparation of these Interim Financial Statements.
Comparative information has been re-valued/re-classified where necessary, to confirm to the current period recognition, measurement and presentation.
Group Company
9 Amana Takaful PLC
Interim Report 30th June 2015

NOTES TO THE FINANCIAL STATEMENTS
5. Revenue
5.1 Revenue by Segment
Unaudited Unaudited Unaudited Unaudited
FOR THE PERIOD ENDED 30TH JUNE 2015 2014 2015 2014
Rs. Rs. Rs. Rs.
Segment
Non-Life (General Takaful) 409,204,899 551,170,139 409,204,899 551,170,139
Long Term (Family Takaful) 421,049,255 323,730,180 - 323,730,180
Shareholders' Fund (Amana Takaful PLC) 206,442,716 34,703,226 206,442,716 34,703,226
Shareholders' Fund (Amana Takaful Life Ltd) 13,135,072 - - -
Amana Global Ltd 13,303,892 15,156,729 - -
Amana Takaful (Maldives) PLC 209,224,931 172,408,705 - -
Eliminations (10,358,799) (15,172,324) - (6,053,198)
1,262,001,966 1,081,996,655 615,647,615 903,550,347
5.2 Revenue
Unaudited Unaudited Unaudited Unaudited
FOR THE PERIOD ENDED 30TH JUNE 2015 2014 2015 2014
Rs. Rs. Rs. Rs.
Gross written Contribution (Premium) 1,556,782,098 1,265,134,490 729,581,230 928,758,492
Less :
Reinsurance premium (338,498,408) (283,833,225) (126,498,558) (119,242,390)
Net written premium 1,218,283,690 981,301,265 603,082,672 809,516,102
(Increase)/decrease in net unearned premium (48,735,049) (12,741,706) (4,601,970) (4,606,091)
Net earned premium 1,169,548,641 968,559,559 598,480,702 804,910,011
Income from investments 70,226,278 97,193,623 14,843,954 94,914,491
Other income 22,227,047 16,243,473 2,322,959 3,725,845
Revenue 1,262,001,966 1,081,996,655 615,647,615 903,550,347
8. Profit Before Taxation by Segment
Unaudited Unaudited Unaudited Unaudited
FOR THE PERIOD ENDED 30TH JUNE 2015 2014 2015 2014
Rs. Rs. Rs. Rs.
Segment
Non Life - General Takaful (59,759,956) 35,020,662 (59,759,956) 35,020,662
Shareholders' Fund (Amana Takaful PLC) (38,715,154) (8,894,145) (38,715,154) (8,894,145)
Amana Global Ltd 2,963,932 6,331,831 - -
Amana Takaful (Maldives) PLC 38,822,865 48,492,375 - -
Shareholders' Fund (Amana Takaful Life Ltd) 2,575,047 - - -
Eliminations (5,524,549) (6,119,125) - -
Total (59,637,815) 74,831,598 (98,475,110) 26,126,517
Group Company
Group Company
Group Company
6. The Company has not done a valuation of the insurance contract liabilities - Life (Family Takaful) by the consultant actuary
for the period ended 30th June 2015. Valuation will be performed annually.
7. The Company has not done a Liability Adequacy Test (LAT) in respect of Insurance Contract Liabilities - Non-Life Fund as
required by SLFRS 4 - Insurance Contracts as at 30th June 2015. LAT will be performed annually.
10 Amana Takaful PLC
Interim Report 30th June 2015

NOTES TO THE FINANCIAL STATEMENTS
11. The nature of related party transactions in the current period is similar to those reported in the Annual Report 2014.
16. Stated Capital as at 30th June 2015 is represented by shares in issue as given below:
Unaudited Audited
Number of shares as at 30.06.2015 31.12.2014
Ordinary shares - Voting 1,500,001,080 1,000,000,720
17. Share Information
30.06.2015 31.12.2014
3 30.06.2015 31.12.2014
Rs. Rs.
R Rs. Rs.
Net asset value per share 1.00 1.19 0.88 1.04
Market price per share as at 1.40 1.80 - -
Highest price per share for the period 1.50 2.10 - -
Lowest price per share for the period 1.20 1.20 - -
Group Company
9. 9.1 Amana Takaful PLC is liable to income tax at 28% (2014 - 28%)
9.2 Amana Global Ltd. which is approved under Section 17 of the BOI Law is liable to income tax at 15% (2014-15%)
9.3 Amana Takaful Maldives PLC is liable to income tax at 15% (2014 - 15%)
9.4 Amana Takaful Life Ltd. is liable for income tax at 28% (2014 - 28%)
10. Deferred tax assets are recognied for unused tax losses to the extent that it is probable that future taxable profit will be available
against which the losses can be utilised. Significant management judgement is required to determine the amount of deferred tax assets
that can be recognised, based on the likely timing and the level of future taxable profits together with future tax planning strategies.
The Deferred tax assets has been recognised only for the general insurance segment and no deferred tax asset is recognised for the
life segment on the tax losses amounting to Rs. 396,276,808/-.
12. Amana Takaful PLC transferred its Life Insurance business to its subsidiary (Amana Takaful Life Ltd) w.e.f 1st January 2015 in line
with the segregation guidelines issued by the Insurance Board of Sri Lanka (IBSL). Further, proceeds from the Rights Issue of Amana
Takaful PLC was utilized to further invest in its said subsidiary, resulting in the Stated Capital of Amana Takaful Life Ltd to increase up
to Rs. 500 million in order to meet its regulatory minimum capital requirements.
13. Comparative figures have been restated wherever necessary to conform to the current periods presentation.
14. There has not been a significant change in the nature of the contingent liabilities as disclosed in the Annual Report 2014.
15. No events have occurred since the reporting date that necessitates adjustments to or disclosure in the Financial Statements.
11 Amana Takaful PLC
Interim Report 30th June 2015

NOTES TO THE FINANCIAL STATEMENTS
18. Twenty Largest Shareholders as at 30th June 2015
Name of Shareholder No. of Shares %
Amana Holdings Limited 894,655,185 59.64
Amana Bank Limited 228,685,572 15.25
Expolanka Holdings PLC 79,096,234 5.27
Dr. Thirugnanasambandar Senthilverl 59,320,459 3.95
Falcon Trading (Pvt) Ltd 19,239,001 1.28
Mr. Hitihami Koralage Pushpakumara 7,406,053 0.49
Mr. Kalugala Eraj Hasitha De Alwis 5,348,674 0.36
Seylan Bank PLC/Jayantha Dewage 4,704,883 0.31
Mubasher Financial Services Bsc 3,840,118 0.26
Mr. Nandadeva Perera 3,220,800 0.21
Mr. Osman Kassim 3,164,103 0.21
Mrs. Pattini Deva Ashoka Swarna Kanthie Beruwelage 3,022,544 0.20
Miss. Rathnayake Hettiarachchige Mallika 3,000,000 0.20
Mr. Mohamed Imtiaz Samsudeen 2,901,848 0.19
Mrs. Riffat Kassim 2,602,651 0.17
Mr. Kallara Wijetunga Mudiyansalage Sardatissa 2,500,000 0.17
Mr. Gajath Chrysantha Goonetilleke 2,410,174 0.16 Mr. Mohamed Hussain Mohamed Nazeer 2,250,000 0.15 Mrs. Nabeela Haroon 3,000,000 0.20
Mr. Goodson Prabha Ranjith Jayasooriya 2,034,983 0.14
1,332,403,282 88.83
Others 167,597,798 11.17
Total 1,500,001,080 100.00
19. Directors' Shareholdings No. of Shares No. of Shares
30.6.2015 31.12.2014
Mr. Tyeab Akbarally 120 80
Mr. Osman Kassim 3,840,118 2,560,079
Dato' Mohd. Fadzli Yusof Nil Nil
Dr. A.A.M. Haroon 40 40
Mr. M.H.M. Rafiq 20 20
Mr. M. Ehsan Zaheed 65,000 65,000
Mr. A.S.M. Muzzammil Nil Nil
Dr.I.A. Ismail Nil Nil
Mr. R. Gopinath Nil Nil
The percentage of shares held by the public as at 30th June 2015 was 24.80% (31.12.2014 - 24.51%), where the
number of shareholders was 6,580 (31.12.2014 - 6,477)
12 Amana Takaful PLC
Interim Report 30th June 2015

CORPORATE INFORMATION
NAME OF THE COMPANY REGISTERED OFFICE
Amana Takaful PLC No. 660 - 1/1, Galle Road, Colombo 03, Sri Lanka
LEGAL STATUS SUBSIDIARY
Public Quoted Company with Limited Liability
incorporated in Sri Lanka on 7th December 1998.
Registered under the Companies Act, No. 07 of 2007
on 27th June 2007.
Amana Takaful Life Limited.
No. 660 - 1/1, Galle Road, Colombo 03, Sri Lanka
COMPANY REGISTRATION NUMBER Amana Global Limited
PQ 23 No. 6, Glen Aber Place, Colombo 04, Sri Lanka
TAX PAYER IDENTIFICATION NUMBER(TIN)
134007958 AUDITORS
Ernst & Young Chartered Accountants
STOCK EXCHANGE LISTING
The shares of the Company are listed in the Second
Board of the Colombo Stock Exchange, Sri Lanka in
November 2006. Stock Exchange Code for Amana
Takaful PLC shares is 'ATL'. CONSULTANT ACTUARIES - LONG-TERM INSURANCE
Actuarial Partners Consulting Sdn Bhd
DIRECTORS Suite 17.02 Kenanga International
Mr.Tyeab Akbarally - Chairman Jalan Sultan Ismail
Mr. Osman Kassim 50250 Kuala Lumpur, Malaysia
Dato' Mohd Fadzli Yusof
Dr. A.A.M. Haroon CONSULTANT ACTUARIES – GENERAL INSURANCE
Mr. M.H.M. Rafiq NMG Financial Services Consulting Pte Limited
Mr. M. Ehsan Zaheed 65 Chulia Street
Mr. A.S.M. Muzzammil #37-07/08, OCBC Centre
Dr.I.A. Ismail Singapore 049513
Mr. R. Gopinath
REINSURANCE PANEL
SHARIAH ADVISORY COUNCIL SWISS Retakaful
Ash-Sheikh M.M.A. Mubarak - Chairman GIC Retakaful
Ash-Sheikh M.I.M. Rizvi Labuan Reinsurance (L) Ltd
Ash-Sheikh Murshid Mulaffar- Secretary Trust International Bahrain
Catlin Labuan Ltd. (Lloyds Syndicate)
Hannover Retakaful
CEO - AMANA TAKAFUL PLC
DIRECTOR - AMANA TAKAFUL LIFE LIMITED SECRETARIES
Mr. M. Fazal Ghaffoor Managers & Secretaries (Pvt) Ltd
CEO - AMANA TAKAFUL LIFE LIMITED PRINCIPAL BANKERS
Mr. A. Reyaz Jeffrey Amana Bank PLC
Pan Asia Bank/NDB Bank/Bank of Ceylon
Commercial Bank/Public Bank/Nations Trust Bank
Amana Takaful PLC
Interim Report 30th June 2015