interim report 1 january – 31 march 2010 finnair group
TRANSCRIPT
Interim Report 1 January – 31 March 2010
Finnair Group
Despite difficulties, positive signs perceptible
The sector’s projected loss for the current year was 5.6 billion US dollars, in addition to which the ash cloud caused an estimated further burden of around 1.5 billion euros Finnair incurred a direct loss of 20 million euros; recovery of passenger numbers will take weeks Passenger demand had returned to slow growthBusiness travel clearly rose, excluding the Finnish marketCargo demand improving, price level risingPunctuality returned to a good level
Finnair’s loss halved
Q1 turnover declined 6.6%; in March, turnover grew for the first time since the start of the economic downturn
Operational expenses declined by 9.9%
Operational loss 26.3 million euros
Average passenger yield weakened 7%
Fall in volume adjusted to through capacity cuts
Passenger load factor good
Finnair continues to have strong balance sheet and cash position
Unique ash cloud crisis overFinnair traffic was at a standstill for a week due to the Iceland volcanic eruption, but the situation has now completely normalizedMore than 1,700 cancelled flights, affecting more than 140,000 passengers Stranded passengers were repatriated quickly after traffic resumedOf the more than 20,000 stranded passengers, the last will return home todayEU internal coordination operated poorly. Integrating Europe airspace control would bring better coordination in corresponding situations (and would reduce unnecessary emissions)Finnair expects clear ground rules on customer care, for the benefit of both customers and airlines

Aid measures distort competition
Companies in the weakest situation are making strong demands for help Finnair opposes aid; there is a great risk of the system being used to support airlines more widely Already signs of aid in contravention of EU competition law Under the EU air services regulation, airlines must be able to meet their obligations for the next 12-month periodDo the airlines demanding support fulfil the conditions of their operating licences?The EU Commission has made unreasonable demands on airlines, but at the same time has paid scant regard to the fulfilment of operating licence requirementsIf money is given to the sector, all airlines should be equally treated
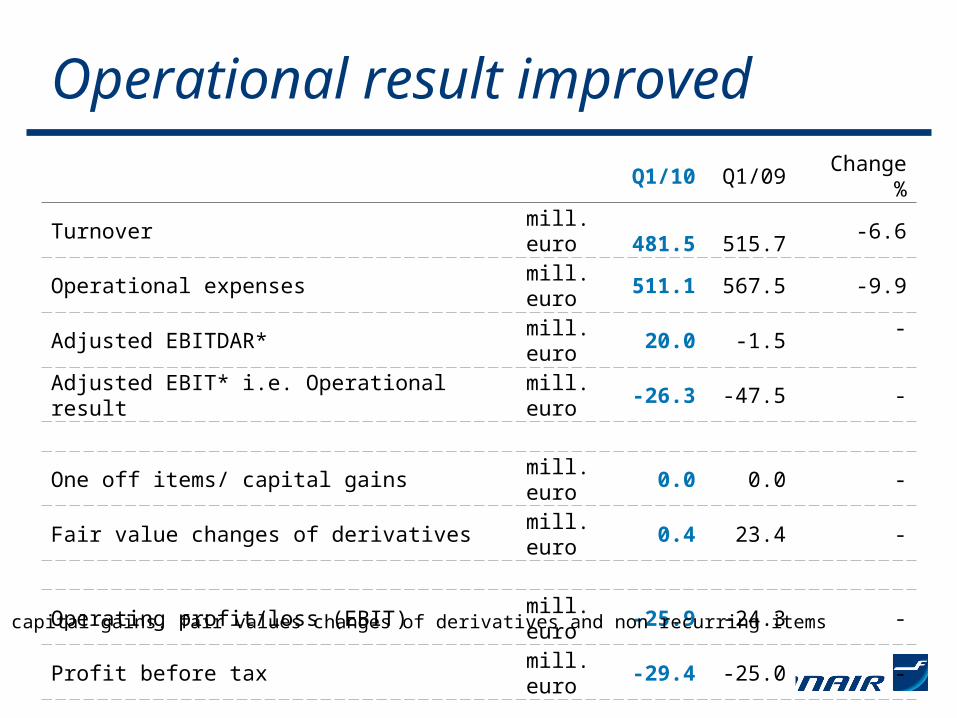
Operational result improvedQ1/10 Q1/09 Change %
Turnover mill. euro 481.5 515.7 -6.6
Operational expenses mill. euro 511.1 567.5 -9.9
Adjusted EBITDAR* mill. euro 20.0 -1.5-
Adjusted EBIT* i.e. Operational result mill. euro -26.3 -47.5 -
One off items/ capital gains mill. euro 0.0 0.0 -
Fair value changes of derivatives mill. euro 0.4 23.4 -
Operating profit/loss (EBIT) mill. euro -25.9 -24.3 -
Profit before tax mill. euro -29.4 -25.0 -
*excl. capital gains. fair values changes of derivatives and non recurring items

A right trend in operational results EBIT* per quarter
*excl. capital gains. fair value changes of derivatives and non recurring items
-80
-60
-40
-20
0
20
40
60
Q1 Q2 Q3 Q4 Q1 Q2 Q3 Q4 Q1 Q2 Q3 Q4 Q1 Q2 Q3 Q4 Q1 Q2 Q3 Q4 Q1
MEUR
2006 2007 20082005 2009 2010

-15
-10
-5
0
5
10
Q1 Q2 Q3 Q4 Q1 Q2 Q3 Q4 Q1 Q2 Q3 Q4 Q1 Q2 Q3 Q4 Q1 Q2 Q3 Q4 Q1
Unit costs develop in the right direction
% Yield (EUR/RTK) Unit costs (EUR/RTK)
2006 2007 20082005 2009
Change YoY
2010

Savings materialise
Q1/10 Q1/09
Unit costs of flight operations* c/RTK -10.6% +5,1%
Unit costs of flight operations* excl. fuel c/RTK -6.5% +4,5%
Personnel expenses c/RTK -19.2% +1,4%
Fuel costs c/RTK -20.9% +6,8%
Traffic charges c/RTK -2.3% +9,3%
Ground handling and catering €/psgr. -3.8% +6,4%
Sales and marketing €/psgr. +3.8% -15,2%
Aircraft lease payments and depreciation c/RTK +3.2% +4,7%
Other costs* c/RTK -7.7% +10,8%
* excluding fair value changes of derivatives and non-recurring itemsRTK = Revenue Tonne Kilometre
200 million euro efficiency program
Savings target in personnel costs totalling 120 million euros
Targets of close to 200 mill. euro identified or agreed upon• Fuel efficiency• Structural and operational changes• Temporary lay-offs continue• Stabilisation agreements in Technical Services, Catering and
cabin service• Reduction of unit costs agreed upon in pilots’ collective agreement,
permanent flexibility targeted also with other personnel groups
Structural impact of the program per annum over 140 mill. euro

Headcount shrinks, productivity improves
0
2000
4000
6000
8000
10000
12000
2000 2001 2002 2003 2004 2005 2006 2007 2008 2009 Q12010
Personnel on averagePersonnel

Fuel price on rise
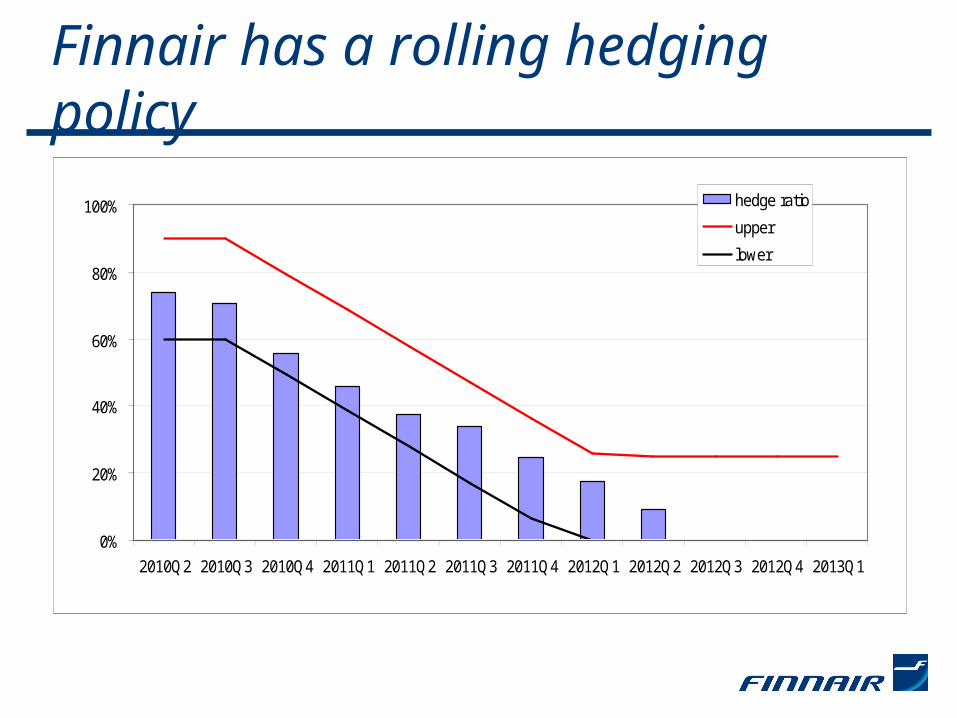
Finnair has a rolling hedging policy
0%
20%
40%
60%
80%
100%
2010Q2 2010Q3 2010Q4 2011Q1 2011Q2 2011Q3 2011Q4 2012Q1 2012Q2 2012Q3 2012Q4 2013Q1
hedge ratio
upper
lower
One of the world's most modern fleets
Average age of entire fleet around six yearsModern fleet consumes less fuel and produces less emissionsThe last Boeing MD-11 aircraft was withdrawn from Finnair's passenger traffic on 22 FebruaryThree of seven Boeing 757 aircraft will be withdrawn in coming weeksTwo Embraer 170 aircraft leased, two for saleIn early 2010 two new Airbus A330 aircraft, one more at end of year
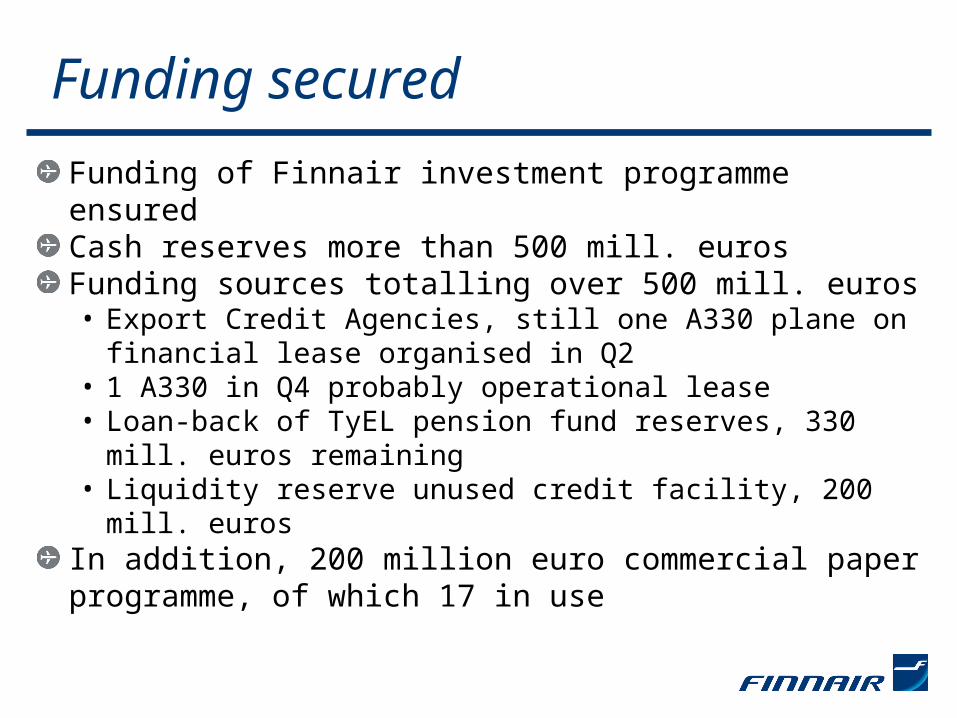
Funding secured
Funding of Finnair investment programme ensuredCash reserves more than 500 mill. eurosFunding sources totalling over 500 mill. euros• Export Credit Agencies, still one A330 plane on financial
lease organised in Q2• 1 A330 in Q4 probably operational lease• Loan-back of TyEL pension fund reserves, 330 mill.
euros remaining • Liquidity reserve unused credit facility, 200 mill. euros
In addition, 200 million euro commercial paper programme, of which 17 in use

Cash flow improved in Q1 Cash flow statement
Q1/2010 Q1/2009
Cash flow from operations mill. euro -18 -73
Investments and sale of assets mill. euro -24 -129
Grossinvestments * mill. euro -69 -128
Change of advances and others
mill. euro +45 -1
Cash flow from financing mill. euro -42 +185
Liquid funds at the beginning mill. euro 607 392
Change in liquid funds mill. euro -84 -17
Liquid funds at the end mill. euro 523 375
** incl. A330 aircraft lease arrangement
* incl. financial interest bearing assets at fair value
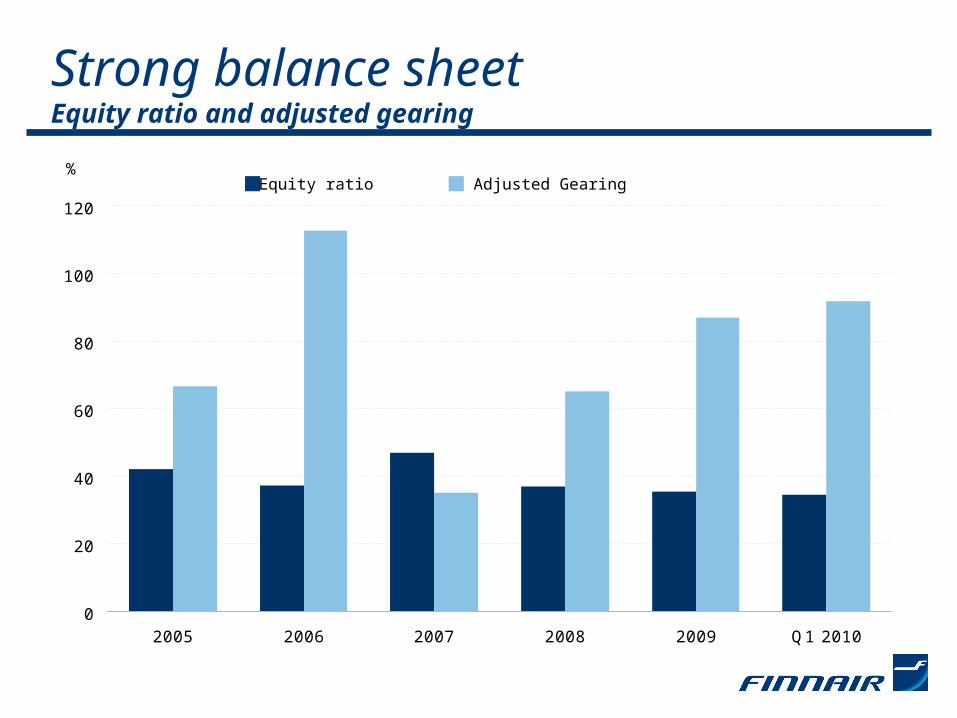
Strong balance sheet Equity ratio and adjusted gearing
0
20
40
60
80
100
120
2005 2006 2007 2008 2009 Q1 2010
Equity ratio Adjusted Gearing%
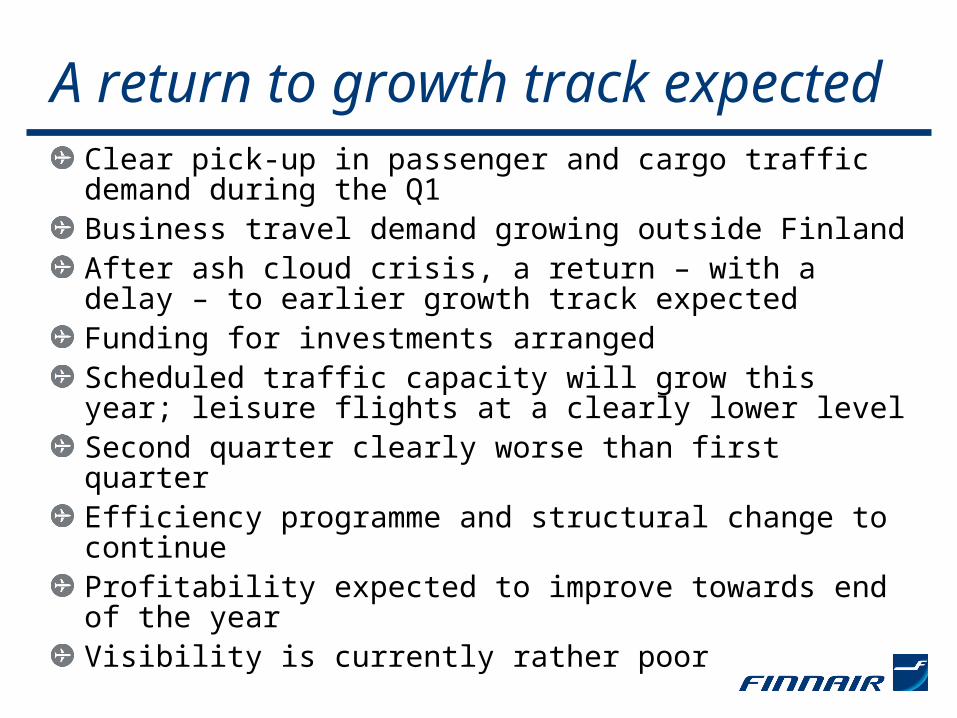
A return to growth track expectedClear pick-up in passenger and cargo traffic demand during the Q1Business travel demand growing outside FinlandAfter ash cloud crisis, a return – with a delay – to earlier growth track expectedFunding for investments arrangedScheduled traffic capacity will grow this year; leisure flights at a clearly lower levelSecond quarter clearly worse than first quarterEfficiency programme and structural change to continueProfitability expected to improve towards end of the yearVisibility is currently rather poor

Appendices
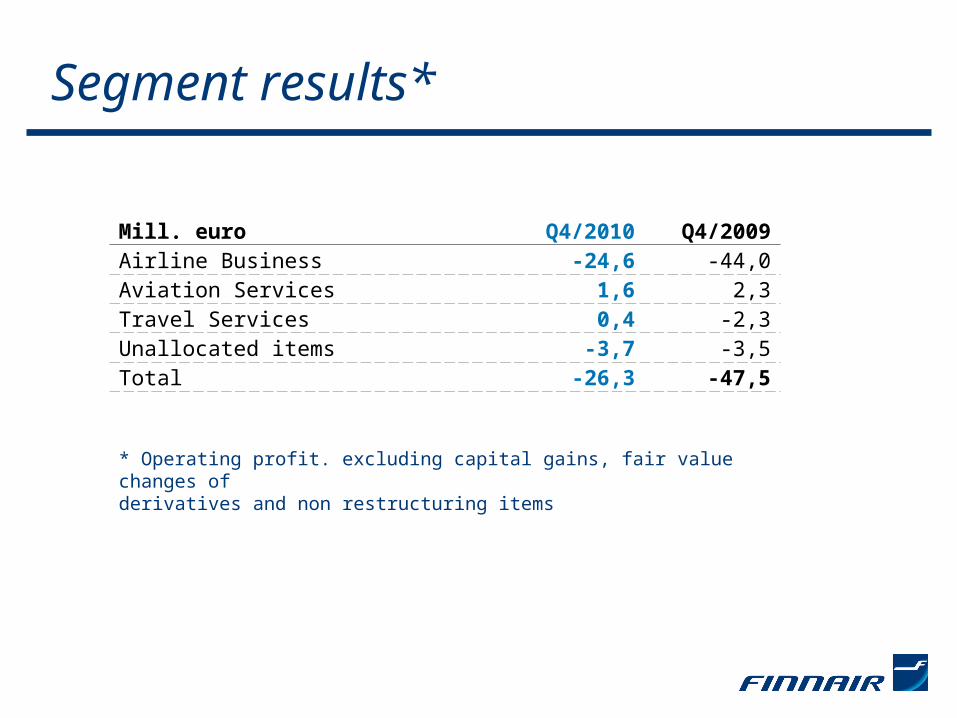
Segment results*
Mill. euro Q4/2010 Q4/2009Airline Business -24,6 -44,0Aviation Services 1,6 2,3Travel Services 0,4 -2,3Unallocated items -3,7 -3,5Total -26,3 -47,5
* Operating profit. excluding capital gains, fair value changes of derivatives and non restructuring items
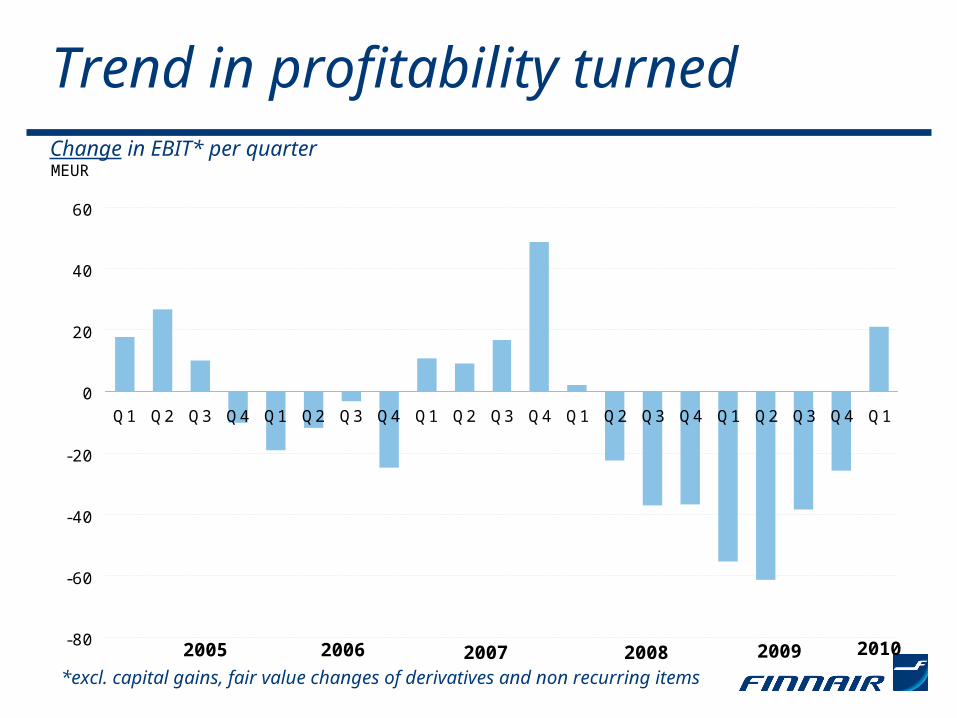
Trend in profitability turned
-80
-60
-40
-20
0
20
40
60
Q1 Q2 Q3 Q4 Q1 Q2 Q3 Q4 Q1 Q2 Q3 Q4 Q1 Q2 Q3 Q4 Q1 Q2 Q3 Q4 Q1
MEUR
2006 2007 20082005 2009 2010
Change in EBIT* per quarter
*excl. capital gains, fair value changes of derivatives and non recurring items

Fuel costs reduced during Q1
12
132
105
-7
-17
-14
0
50
100
150
2009Q1 Volume Price Currency Hedging 2010Q1
MEUR

ROE and ROCE Rolling 12 months
-15
-10
-5
0
5
10
15
20
Q1 200
5
Q2 200
5
Q3 200
5
Q4 200
5
Q1 200
6
Q2 200
6
Q3 200
6
Q4 200
6
Q1 200
7
Q2 200
7
Q3 200
7
Q4 200
7
Q1 200
8
Q2 200
8
Q3 200
8
Q4 200
8
Q1 200
9
Q2 200
9
Q3 200
9
Q4 200
9
Q1 201
0
% ROE ROCE
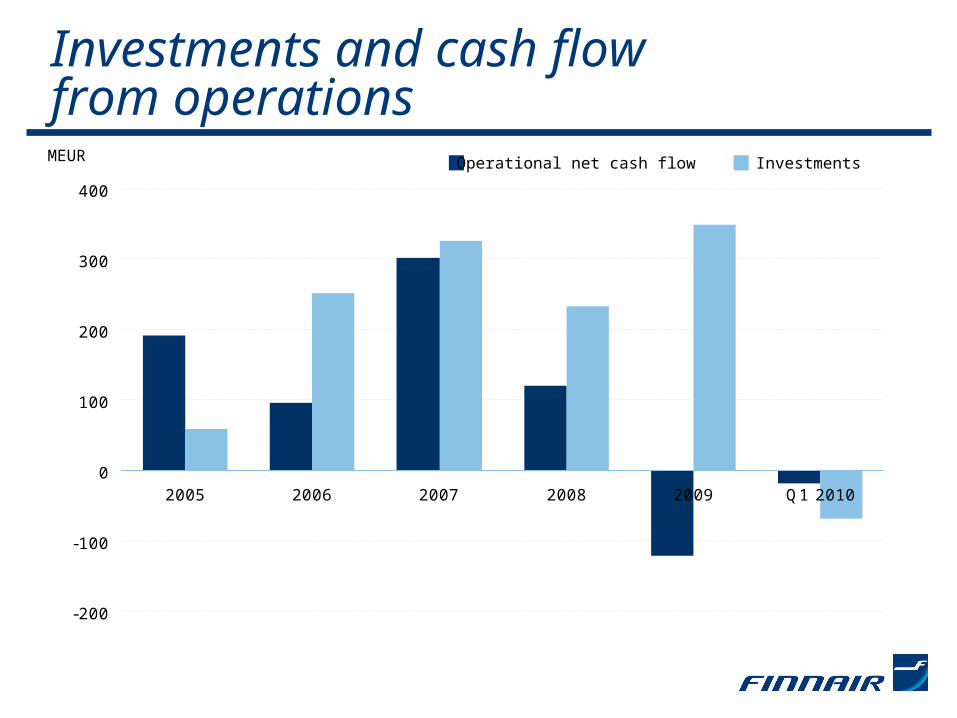
Investments and cash flowfrom operations
-200
-100
0
100
200
300
400
2005 2006 2007 2008 2009 Q1 2010
Operational net cash flow InvestmentsMEUR

Aircraft operating lease liabilities
0
100
200
300
400
500
600
2005 2006 2007 2008 2009 Q1 2010
MEUR Flexibility. costs. risk management
On 31 March all leases were operating leases. If capitalised using the common method of multiplying annual aircraft lease payments byseven, the adjusted gearing on 31 March 2010 would have been91.9%

Emissions trading raises questions
EU begins air transport emissions trading unilaterally in 2012Free emissions rights to be received by each airline for 2012-2020 will be based on this year’s revenue tonne kilometresRisk of changing ground rules existsFinnair has supplied the necessary documentation to TraFiCurrent emissions trading model will increase carbon leakage risk and jeopardise EU competitivenessFinnair supports sector-specific emissions trading which is global and does not distort competition
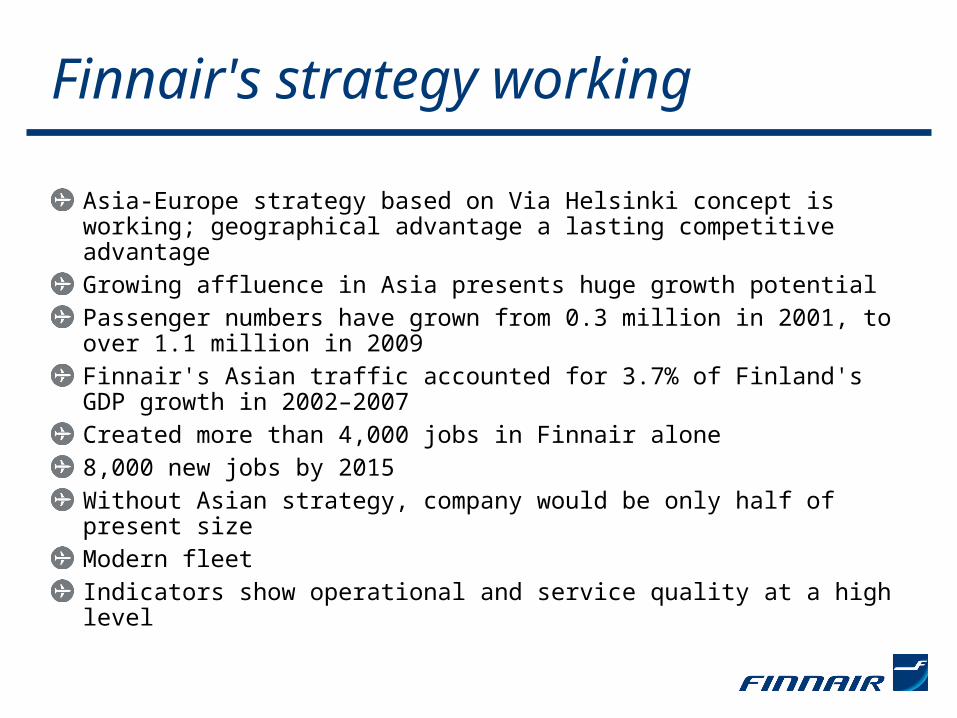
Finnair's strategy working
Asia-Europe strategy based on Via Helsinki concept is working; geographical advantage a lasting competitive advantageGrowing affluence in Asia presents huge growth potentialPassenger numbers have grown from 0.3 million in 2001, to over 1.1 million in 2009 Finnair's Asian traffic accounted for 3.7% of Finland's GDP growth in 2002–2007Created more than 4,000 jobs in Finnair alone8,000 new jobs by 2015 Without Asian strategy, company would be only half of present sizeModern fleetIndicators show operational and service quality at a high level

Towards future growth
Customers of the future will increasingly come from Asia
Strategy update and supporting reforms during the spring – main strategy will not change
Competitiveness based on excellent product and efficient operations
Group structure focused on core functions in order to achieve flexibility, partners supplement network and service provision
Working toghether with personnel, to reach joint objectives
Sustainable development creates added value for environment-conscious customers

Finnair Financial Targets
”Sustainable value creation”
Operating profit (EBIT)
EBIT margin at least 6% => over 120 mill. € in the coming few years
EBITDAREBITDAR margin at least 17% => over 350 mill. € in the coming few years
Economic profit
Pay out ratio Minimum one third of the EPS
Adjusted Gearing
Gearing adjusted for aircraft lease liabilities not to exceed 140 %
To create positive value over pretax WACC of 8.25%
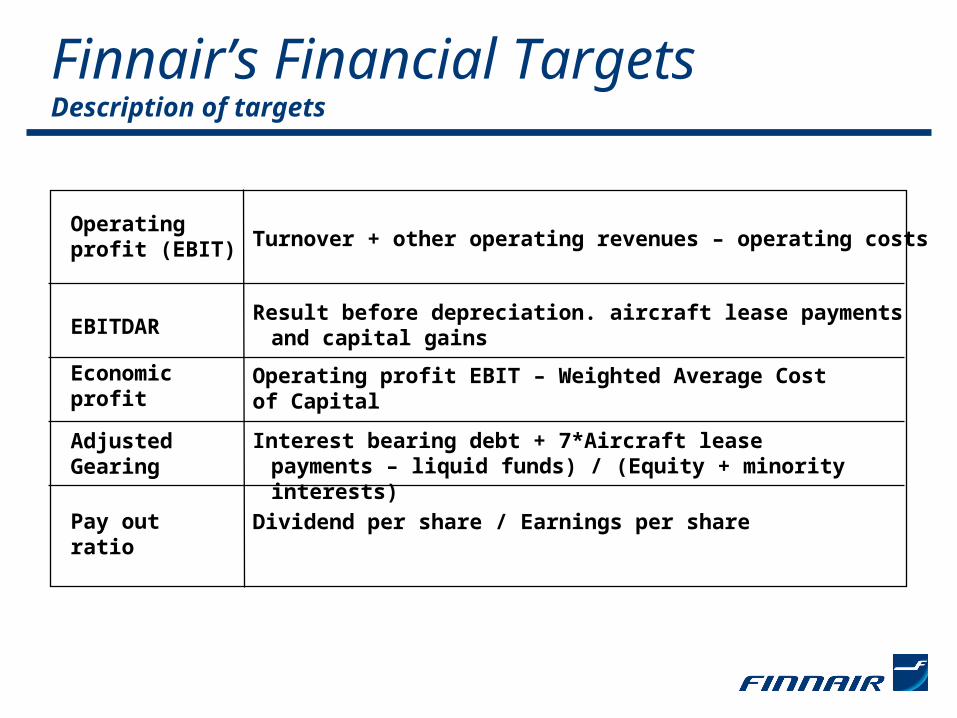
Finnair’s Financial Targets Description of targets
Operating profit (EBIT)
EBITDAR
Economic profit
Pay out ratio
Adjusted Gearing
Turnover + other operating revenues – operating costs
Result before depreciation. aircraft lease payments and capital gains
Operating profit EBIT – Weighted Average Cost of Capital
Interest bearing debt + 7*Aircraft lease payments – liquid funds) / (Equity + minority interests)
Dividend per share / Earnings per share
www.finnair.com/groupFinnair Group Investor Relations
email: [email protected]
tel: +358-9-818 4951fax: +358-9-818 4092