interim report 1 january 30 june 2017 - mb.cision.commb.cision.com/main/1493/2327362/710492.pdf ·...
TRANSCRIPT

1
3 months ended 30 June 2017 • Local currency sales increased by 11% and Euro sales increased by 12% to €347.6m (€309.6m).
• Number of registered actives decreased by 2% to 2.8m.
• EBITDA amounted to €47.9m (€40.6m).
• Operating margin was 11.7% (9.9%), favourably impacted by 40 bps from currencies, and operating profit was €40.5m
(€30.8m).
• Net profit was €19.9m (€18.1m) and diluted EPS €0.35 (€0.32), negatively impacted by a one-off translation reserve loss
on exchange rate of around €3m. The tax rate was further unfavorably impacted by approximately 300 bps from
withholding tax on extraordinary large intra group dividends during the quarter.
• Cash flow from operating activities was €33.9m (€35.8m).
• During the quarter, Oriflame successfully completed a €70m issue of Euro denominated private placement notes bilaterally
agreed with an international investor.
• The year to date sales development is approximately 9% in local currency and the development in the third quarter to date
is approximately 10% in local currency.
6 months ended 30 June 2017 • Local currency sales increased by 9% and Euro sales increased by 12% to €687.8m (€615.4m).
• EBITDA amounted to €88.3m (€68.3m).
• Operating margin was 10.2% (8.4%), positively impacted by 60 bps from currencies, and operating profit was €70.3m
(€51.9m).
• Net profit was €39.4m (€28.8m) and diluted EPS €0.69 (€0.51).
• Cash flow from operating activities amounted to €32.5m (€57.3m).
Interim Report 1 January – 30 June 2017
+11% LC SALES
+12% EURO SALES
11.7% OPERATING MARGIN
“We are pleased to report double-digit growth in both Euro and local currency with healthy profitability improvements and a strong financial position. The positive sales momentum for the Group has continued into the third quarter, in which Oriflame
celebrates its 50th anniversary Gold Conference.”
CEO Magnus Brännström

Oriflame Interim report 1 January – 30 June 2017
2
“ CEO Magnus Brännström comments
“We are pleased to report double-digit growth in both Euro and local currency with healthy profitability improvements and a strong financial
position. During the quarter, our strategic priorities continued to serve as important drivers of growth. CIS experienced local currency growth in
the quarter, driven by ongoing productivity increases and positive timing. Asia & Turkey and Latin America were affected by fewer trading days
and negative timing of catalogues – the underlying performance remained strong. The positive sales momentum for the Group has continued
into the third quarter, in which Oriflame celebrates its 50th anniversary Gold Conference.”
Key financial data 3 months ended 30 June
Sales
Registered actives
Operating profit
Net Sales LTM
Adj. operating margin % LTM
Financial summary (€m)
3 months ended 30 June
6 months ended 30 June
LTM July ‘16- June ‘17
Year end 2016
2017 2016 Change % 2017 2016 Change %
Sales 347.6 309.6 12% 687.8 615.4 12% 1,321.8 1,249.4
Gross margin, % 72.9 71.5 72.2 70.5 71.6 70.7
EBITDA 47.9 40.6 18% 88.3 68.3 29% 168.2 148.2
Operating profit 40.5 30.8 32% 70.3 51.9 35% 137.5 119.2
Operating margin, % 11.7 9.9 10.2 8.4 10.4 9.5
Net profit before tax 29.7 27.1 10% 57.1 42.7 34% 114.9 100.5
Net profit 19.9 18.1 10% 39.4 28.8 37% 77.3 66.7
Diluted EPS, € 0.35 0.32 8% 0.69 0.51 35% 1.35 1.18
Cash flow from operating activities 33.9 35.8 (5%) 32.5 57.3 (43%) 88.3 113.1
Net interest-bearing debt 82.4 106.5 (23%) 82.4 106.5 (23%) 82.4 82.3
Net interest-bearing debt at hedged values 43.9 44.9 (2%) 43.9 44.9 (2%) 43.9 13.2
Registered actives, ‘000 2,806 2,862 (2%) 2,806 2,862 (2%) 2,806 3,006
Sales /registered actives, € 122.7 107.3 14% 241.9 213.0 14% 465.8 411.9
12% (13%)
23% (26%)
27% (25%)
38% (36%)
10% (10%)
26% (26%)
28% (32%)
36% (32%)
11% (13%)
19% (26%)
18% (11%)
52% (50%)
0%
5%
10%
15%
20%
0
200
400
600
800
1000
1200
1400
Q2
15
Q3
15
Q4
15
Q1
16
Q2
16
Q3
16
Q4
16
Q1
17
Q2
17
Net Sales LTM
Adj. Op Margin % LTM
Asia & Turkey Europe & Africa Latin America CIS

Oriflame Interim report 1 January – 30 June 2017
3
+180 bps OPERATING
MARGIN
500,000 MONTHLY
ACTIVE USERS OF
THE ORIFLAME APP
Three months ended 30 June 2017
Sales in local currencies increased by 11%, favourably impacted by timing. Euro sales increased by
12% to €347.6m compared to €309.6m in the same period prior year. Sales development in local
currencies was impacted by a 13% increase in productivity while the number of registered actives in
the quarter decreased by 2% to 2.8m (2.9m).
Unit sales increased by 4% and the price/mix effect was up by 7%, driven by mix effect. The
positive mix effect is a combination of geographic and product mix, mainly driven by Skin Care and
Wellness.
Local currency sales increased by 4% in Latin America, by 4% in Europe & Africa, by 6% in CIS
and by 21% in Asia & Turkey.
The gross margin at 72.9% (71.5%), was positively impacted by currency movements of 40 bps,
price/mix effects and supply chain efficiency measures. The operating margin amounted to 11.7%
(9.9%), favourably impacted by lower administrative costs and lower distribution and infrastructure
expenses, partly offset by higher selling and marketing expenses and higher costs for the share
incentive plan and bonuses.
Net profit increased to €19.9m (€18.1m) and diluted earnings per share amounted to €0.35
(€0.32), negatively impacted by a one-off translation reserve loss on exchange rate of around €3m.
The tax rate was further unfavorably impacted by approximately 300 bps from withholding tax on
extraordinary large intra group dividends during the quarter.
Cash flow from operating activities amounted to €33.9m (€35.8m).
The average number of full-time equivalent employees amounted to 6,264 (6,264).
Six months ended 30 June 2017
Sales in local currencies increased by 9% and Euro sales increased by 12% to €687.8m compared to
€615.4m in the same period prior year. Sales development in local currencies was impacted by a
11% increase in productivity while the number of registered actives decreased by 2%.
The gross margin amounted to 72.2% (70.5%) and the operating margin to 10.2% (8.4%). The
operating margin was favourably impacted by currency movements of 60 bps, positive price/mix
effects, lower administrative costs and lower distribution and infrastructure expenses, partly offset
by higher selling and marketing expenses and higher costs for the share incentive plan and bonuses.
Net profit amounted to €39.4m (€28.8m) and diluted earnings per share was €0.69 (€0.51).
Cash flow from operating activities decreased to €32.5m (€57.3m).
Operational highlights
Brand and Innovation
The strategic categories Skin Care and Wellness continued to perform well during the quarter with
both categories recording double-digit growth. The Skin Care growth was supported by a
successful launch of Innoage Radiant White in China as well as the celebrity golden edition of Tender
Care. Within Wellness, the Swedish Beauty Supplement was introduced in Turkey.
In Colour Cosmetics, The ONE Express Collection was launched during the quarter accompanied
by a digital communication campaign. The collection includes new products within Lip, Eye and Nail
products.
The Fragrance growth was primarily driven by newness. New launches include Volare Gold Eau
de Parfum, Sensual Jasmine Eau de Toilette, Cool Lavender and Northern Beauty Eau de Toilette.
In Personal and Hair Care, Love Nature was launched with all rinse-off products being
biodegradable, hair products silicone-free and exfoliants having natural origin beads. During the
quarter, the high performing footcare brand Feet Up Advanced was relaunched.
Within Accessories, the electric foot file FeetUp Pedi Smooth enjoyed a successful launch.
Online
During the quarter, the utilization of mobile apps continued to increase together with the share of
website visits from mobile devices.
More than 10% of global orders are now being placed using the Oriflame app, the number
exceeding 50% in selected markets. It currently features close to 500,000 monthly active users,
with the corresponding figure for the Oriflame Business app being 200,000 active users. In total, the
Oriflame app suite generates more than 5,000 new users daily, making it the fastest growing digital
channel in the company.

Oriflame Interim report 1 January – 30 June 2017
4
Other activities during the quarter include the continued rollout of the new e-commerce
platform in Asia, further development of online payment options, consultant tools, improved
personalization and segmentation support.
Service and Manufacturing
Service levels were healthy and the number of inventory days increased compared to the same
period last year.
The capacity utilization in manufacturing continued to improve during the quarter, driven by
insourcing efforts, favourable product mix and pre-production.
The implementation of the outsourcing of IT and financial operational services to IBM
continued and is developing well.
During the quarter, the Oriflame Sustainability Report was published and is available on the
Oriflame website.
Oriflame Interim report 1 January – 30 June 2017
5
NEGATIVELY
IMPACTED BY
TIMING
+4% LC SALES
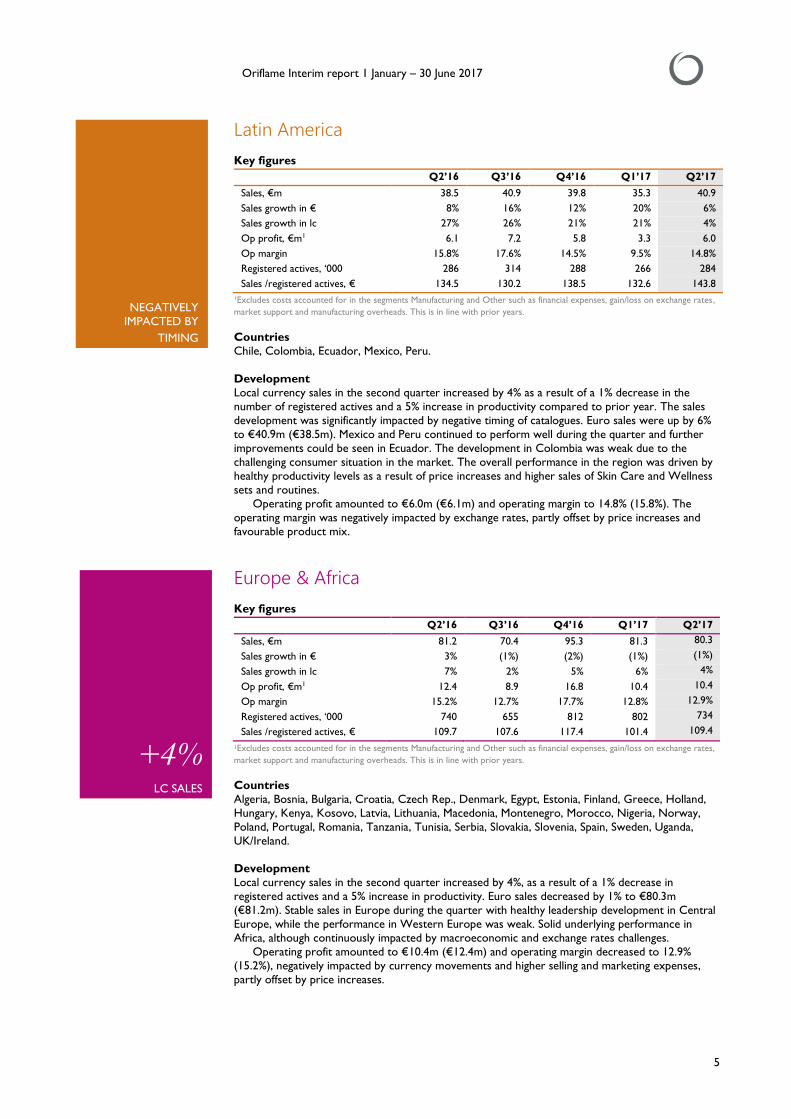
Latin America
Key figures
Q2’16 Q3’16 Q4’16 Q1’17 Q2’17
Sales, €m 38.5 40.9 39.8 35.3 40.9
Sales growth in € 8% 16% 12% 20% 6%
Sales growth in lc 27% 26% 21% 21% 4%
Op profit, €m1 6.1 7.2 5.8 3.3 6.0
Op margin 15.8% 17.6% 14.5% 9.5% 14.8%
Registered actives, ‘000 286 314 288 266 284
Sales /registered actives, € 134.5 130.2 138.5 132.6 143.8
¹Excludes costs accounted for in the segments Manufacturing and Other such as financial expenses, gain/loss on exchange rates,
market support and manufacturing overheads. This is in line with prior years.
Countries
Chile, Colombia, Ecuador, Mexico, Peru.
Development
Local currency sales in the second quarter increased by 4% as a result of a 1% decrease in the
number of registered actives and a 5% increase in productivity compared to prior year. The sales
development was significantly impacted by negative timing of catalogues. Euro sales were up by 6%
to €40.9m (€38.5m). Mexico and Peru continued to perform well during the quarter and further
improvements could be seen in Ecuador. The development in Colombia was weak due to the
challenging consumer situation in the market. The overall performance in the region was driven by
healthy productivity levels as a result of price increases and higher sales of Skin Care and Wellness
sets and routines.
Operating profit amounted to €6.0m (€6.1m) and operating margin to 14.8% (15.8%). The
operating margin was negatively impacted by exchange rates, partly offset by price increases and
favourable product mix.
Europe & Africa
Key figures
Q2’16 Q3’16 Q4’16 Q1’17 Q2’17
Sales, €m 81.2 70.4 95.3 81.3 80.3
Sales growth in € 3% (1%) (2%) (1%) (1%)
Sales growth in lc 7% 2% 5% 6% 4%
Op profit, €m1 12.4 8.9 16.8 10.4 10.4
Op margin 15.2% 12.7% 17.7% 12.8% 12.9%
Registered actives, ‘000 740 655 812 802 734
Sales /registered actives, € 109.7 107.6 117.4 101.4 109.4
1Excludes costs accounted for in the segments Manufacturing and Other such as financial expenses, gain/loss on exchange rates,
market support and manufacturing overheads. This is in line with prior years.
Countries
Algeria, Bosnia, Bulgaria, Croatia, Czech Rep., Denmark, Egypt, Estonia, Finland, Greece, Holland,
Hungary, Kenya, Kosovo, Latvia, Lithuania, Macedonia, Montenegro, Morocco, Nigeria, Norway,
Poland, Portugal, Romania, Tanzania, Tunisia, Serbia, Slovakia, Slovenia, Spain, Sweden, Uganda,
UK/Ireland.
Development
Local currency sales in the second quarter increased by 4%, as a result of a 1% decrease in
registered actives and a 5% increase in productivity. Euro sales decreased by 1% to €80.3m
(€81.2m). Stable sales in Europe during the quarter with healthy leadership development in Central
Europe, while the performance in Western Europe was weak. Solid underlying performance in
Africa, although continuously impacted by macroeconomic and exchange rates challenges.
Operating profit amounted to €10.4m (€12.4m) and operating margin decreased to 12.9%
(15.2%), negatively impacted by currency movements and higher selling and marketing expenses,
partly offset by price increases.

Oriflame Interim report 1 January – 30 June 2017
6
+19% EURO SALES
21.5% OPERATING
MARGIN
CIS
Key figures
Q2’16 Q3’16 Q4’16 Q1’17 Q2’17
Sales, €m 78.0 67.2 93.9 99.5 92.9
Sales growth in € (20%) (13%) (10%) 15% 19%
Sales growth in lc 4% (3%) (10%) (6%) 6%
Op profit, €m1 5.2 5.5 14.0 11.1 9.7
Op margin 6.7% 8.1% 14.9% 11.2% 10.5%
Registered actives, ‘000 913 784 926 889 794
Sales /registered actives, € 85.4 85.7 101.5 111.9 117.0
¹Excludes costs accounted for in the segments Manufacturing and Other such as financial expenses, gain/loss on exchange rates,
market support and manufacturing overheads. This is in line with prior years.
Countries
Armenia, Azerbaijan, Belarus, Georgia, Kazakhstan, Kyrgyzstan, Moldova, Mongolia, Russia, Ukraine.
Development
Local currency sales in the second quarter increased by 6%, as a result of a 13% decrease in the
number of registered actives and an increase in productivity of 22%. Euro sales were up by 19% to
€92.9m (€78.0m). Local currency sales in Russia increased by 10%, driven by ongoing productivity
growth and positive timing of catalogues. The online activity and leadership development continued
to be on high levels in the market and the strategic product categories performed well. The
situation in Ukraine was continuously challenging and the development in Kazakhstan was negatively
impacted by macroeconomic difficulties.
Operating profit amounted to €9.7m (€5.2m) and operating margin increased to 10.5% (6.7%),
favourably impacted by exchange rates, realised price increases and sales leverage.
Asia & Turkey
Key figures
Q2’16 Q3’16 Q4’16 Q1’17 Q2’17
Sales, €m 109.5 97.5 123.3 118.2 130.3
Sales growth in € 26% 26% 23% 14% 19%
Sales growth in lc 35% 29% 25% 16% 21%
Op profit, €m1 23.1 17.7 27.6 21.1 28.0
Op margin 21.1% 18.1% 22.4% 17.8% 21.5%
Registered actives, ‘000 923 895 980 1,034 994
Sales /resgistered actives, € 118.8 109.0 125.7 114.4 131.1
¹Excludes costs accounted for in the segments Manufacturing and Other such as financial expenses, gain/loss on exchange rates,
market support and manufacturing overheads. This is in line with prior years.
Countries
China, India, Indonesia, Myanmar, Pakistan, Sri Lanka, Thailand, Turkey, Vietnam.
Development
Second quarter sales growth in local currencies was 21% as a result of an 8% increase in the
number of registered actives and a 12% increase in productivity. Euro sales were up by 19% to
€130.3m (€109.5m). Most markets performed well with healthy growth in China and notably
strong performance in Vietnam. Indonesia and Turkey were negatively impacted by fewer trading days due to Ramadan and the development in India was continuously weak, with measures taken to
adapt to administrative changes in the market. Strong development of Skin Care and Wellness sets
and routines together with solid leadership and online activity continue to drive the performance.
Operating margin increased to 21.5% (21.1%) and operating profit was €28.0m (€23.1m). The
margin was positively impacted by a favourable geographical mix, partly offset by negative currency
movements and higher selling and marketing expenses.
Oriflame Interim report 1 January – 30 June 2017
7
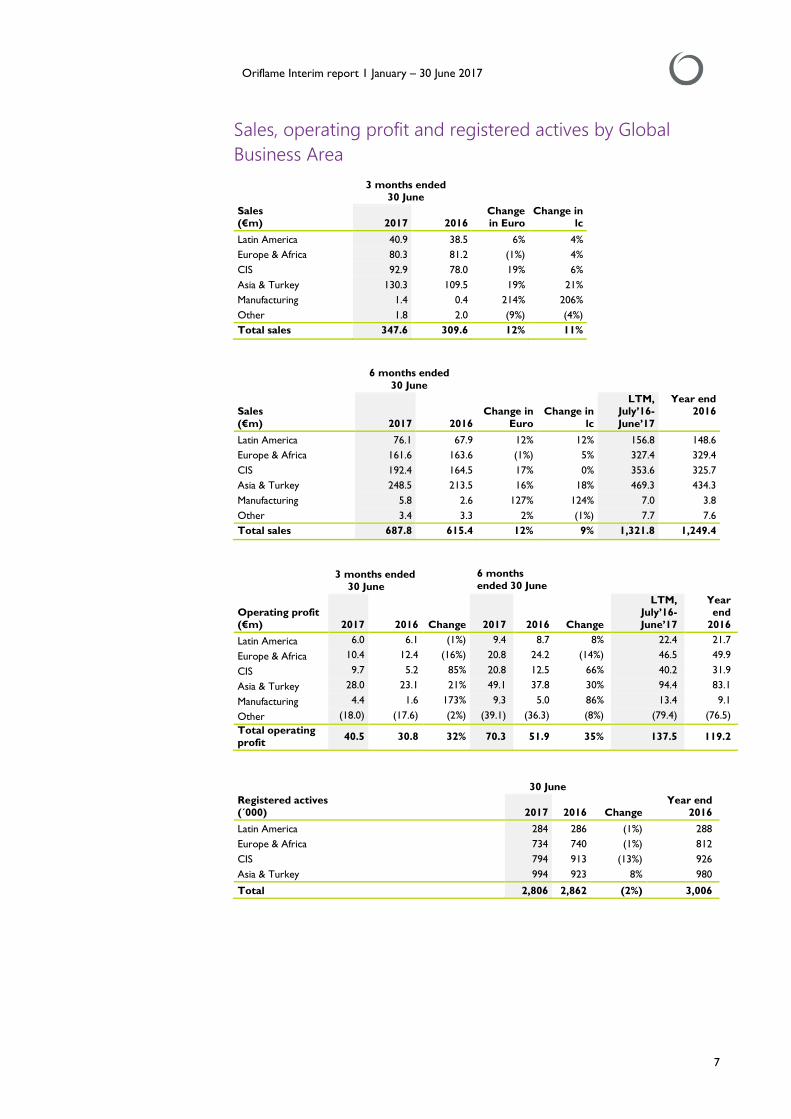
Sales, operating profit and registered actives by Global
Business Area
Sales (€m)
3 months ended 30 June
2017 2016 Change in Euro
Change in lc
Latin America 40.9 38.5 6% 4%
Europe & Africa 80.3 81.2 (1%) 4%
CIS 92.9 78.0 19% 6%
Asia & Turkey 130.3 109.5 19% 21%
Manufacturing 1.4 0.4 214% 206%
Other 1.8 2.0 (9%) (4%)
Total sales 347.6 309.6 12% 11%
Sales
(€m)
6 months ended
30 June
2017 2016
Change in
Euro
Change in
lc
LTM, July’16-
June’17
Year end 2016
Latin America 76.1 67.9 12% 12% 156.8 148.6
Europe & Africa 161.6 163.6 (1%) 5% 327.4 329.4
CIS 192.4 164.5 17% 0% 353.6 325.7
Asia & Turkey 248.5 213.5 16% 18% 469.3 434.3
Manufacturing 5.8 2.6 127% 124% 7.0 3.8
Other 3.4 3.3 2% (1%) 7.7 7.6
Total sales 687.8 615.4 12% 9% 1,321.8 1,249.4
Operating profit (€m)
3 months ended 30 June
Change
6 months ended 30 June
2017 2016 2017 2016 Change
LTM, July’16- June’17
Year end
2016
Latin America 6.0 6.1 (1%) 9.4 8.7 8% 22.4 21.7
Europe & Africa 10.4 12.4 (16%) 20.8 24.2 (14%) 46.5 49.9
CIS 9.7 5.2 85% 20.8 12.5 66% 40.2 31.9
Asia & Turkey 28.0 23.1 21% 49.1 37.8 30% 94.4 83.1
Manufacturing 4.4 1.6 173% 9.3 5.0 86% 13.4 9.1
Other (18.0) (17.6) (2%) (39.1) (36.3) (8%) (79.4) (76.5)
Total operating profit
40.5 30.8 32% 70.3 51.9 35% 137.5 119.2
Registered actives (´000)
30 June
Change
2017 2016 Year end
2016
Latin America 284 286 (1%) 288
Europe & Africa 734 740 (1%) 812
CIS 794 913 (13%) 926
Asia & Turkey 994 923 8% 980
Total 2,806 2,862 (2%) 3,006

Oriflame Interim report 1 January – 30 June 2017
8
0.3 NET DEBT AT
HEDGED VALUES
/EBITDA
Cash flow & investments
Cash flow from operating activities in the second quarter amounted to €33.9m (€35.8m), driven by
higher EBITDA and unrealised profit on exchange rates, offset by increased inventory and higher
income taxes paid.
Cash flow used in investing activities amounted to €-3.0m (€-3.3m).
Financial position
Net interest-bearing debt at hedged values amounted to €43.9m (€44.9m). The net debt at hedged
values/EBITDA ratio was 0.3 (0.3).
Net interest-bearing debt amounted to €82.4m (€106.5m). The net debt/EBITDA ratio was 0.5
(0.8). Interest cover amounted to 13.2 (8.2) in the quarter and to 8.3 (5.7) during the last twelve
months.
Covenant disclosure
As per the end of the second quarter 2017, the financial measures as defined in the Agreements
relating to the existing Revolving Credit Facility and the Private Placement Notes were as follows:
Consolidated Net Debt to Consolidated EBITDA: 0.4 (covenant at ≤ 3.0 times)
Consolidated EBITDA to Consolidated Finance costs: 19.5 (covenant at ≥ 5.0 times)
Consolidated Net Worth: €212m (covenant at ≥ €120m)
Note that the definition of these measures differ from the definitions of the Net Debt to EBITDA
and Interest cover disclosed in the other sections of the report, primarily related to gains from
sales of assets and cash in non-OECD markets.
Related parties
There have been no significant changes in the relationships or transactions with related parties
compared with the information given in the Annual Report 2016.
2017 Annual General Meeting
Oriflame Holding AG held its 2017 Annual General Meeting in Zurich (Kloten), Switzerland, on 9
May 2017. For further information please see the separate press release issued on 9 May 2017.
Dividend
The AGM held on 9 May 2017 resolved that a dividend of €1.50 per share, of which €1.00 (€0.40)
per share is to be considered as ordinary and €0.50 to be considered as extra dividend, be
distributed out of the capital contribution reserve and paid in four instalments as follows: €0.75 to
the shareholders of record on 15 May 2017, €0.25 to the shareholders of record on 15 August
2017, €0.25 to the shareholders of record on 15 November 2017 and €0.25 to the shareholders of
record on 15 February 2018.
The second instalment of €0.25 per share (record date 15 August 2017) will have expected payment date 23 August 2017. The last day of trading the share including dividend right was on 13
August 2017 (Ex-Date 14 August).
Significant events during the quarter During the quarter, Oriflame successfully completed a €70m issue of Euro denominated private
placement notes bilaterally agreed with an international investor. The notes have a final maturity in
2029 and will be linearly amortised starting from 2025, resulting in an average maturity of 10 years.
The proceeds refinance the loan maturing during the second quarter 2017 and will be used for
general corporate purposes.

Oriflame Interim report 1 January – 30 June 2017
9
10% THIRD QUARTER TO
DATE LC SALES
9% YEAR TO DATE LC
SALES
Personnel The average number of full-time equivalent employees amounted to 6,264 (6,264).
Year to date and third quarter update
The year to date sales development is approximately 9% in local currency and the development in
the third quarter to date is approximately 10% in local currency.
Long term targets
Oriflame aims to achieve local currency sales growth of approximately 10 percent per annum and
an operating margin of 15 percent.
The business of the Group presents cyclical evolutions and is driven by a number of factors:
• Effectiveness of individual catalogues and product introductions
• Effectiveness and timing of recruitment programmes
• Timing of sales and marketing activities
• The number of effective sales days per quarter
• Currency effect on sales and results
Financial Calendar for 2017 The third quarter 2017 report will be published on 8 November 2017
The fourth quarter 2017 report will be published on 15 February 2018

Oriflame Interim report 1 January – 30 June 2017
10
Other A Swedish translation is available on www.oriflame.com.
Conference call for the financial community
The Company will host a conference call on Thursday, 17 August 2017 at 9.30 CET.
Participant access numbers:
SE: +46856642664
DK: +4535445576
FIN: +358981710492
UK: +442030089808
NO: +4723500252
US: 18558315947
The conference call will also be audio web cast in “listen-only” mode through Oriflame’s website:
www.oriflame.com or through http://oriflame-ir.creo.se/170817
August 17, 2017
Magnus Brännström
Chief Executive Officer
For further information, please contact:
Magnus Brännström, Chief Executive Officer Tel: +41 798 263 754
Gabriel Bennet, Chief Financial Officer Tel: +41 798 263 769
Nathalie Redmo, Sr. Manager IR Tel: +41 799 220 173
This information is information that Oriflame Holding AG is obliged to make public pursuant to the
EU Market Abuse Regulation and the Securities Markets Act. The information was submitted for
publication, through the agency of the contact person set out above, at 07:15 CET on August 17,
2017.
Oriflame Holding AG
Bleicheplatz 3, CH-8200 Schaffhausen, Switzerland
www.oriflame.com
Company registration no CHE-134.446.883

Oriflame Interim report 1 January – 30 June 2017
11
Statement from the Board of Directors
The condensed consolidated set of interim financial statements is prepared in accordance with IAS 34 “Interim Financial Reporting”
and gives a true and fair view of the condensed consolidated interim financial position of Oriflame and of its consolidated financial
performance. The interim report includes a fair review of the development and performance of the business and the position of the
entity and the undertakings included in the consolidation taken as a whole.
Alexander af Jochnick
Chairman of the Board
Anders Dahlvig Mona Abbasi Jonas af Jochnick Robert af Jochnick
Board member Board member Board member Board member
Karen Tobiasen Anna Malmhake Christian Salamon Magnus Brännström
Board member Board member Board member CEO & Board member
Oriflame Interim report 1 January – 30 June 2017
12
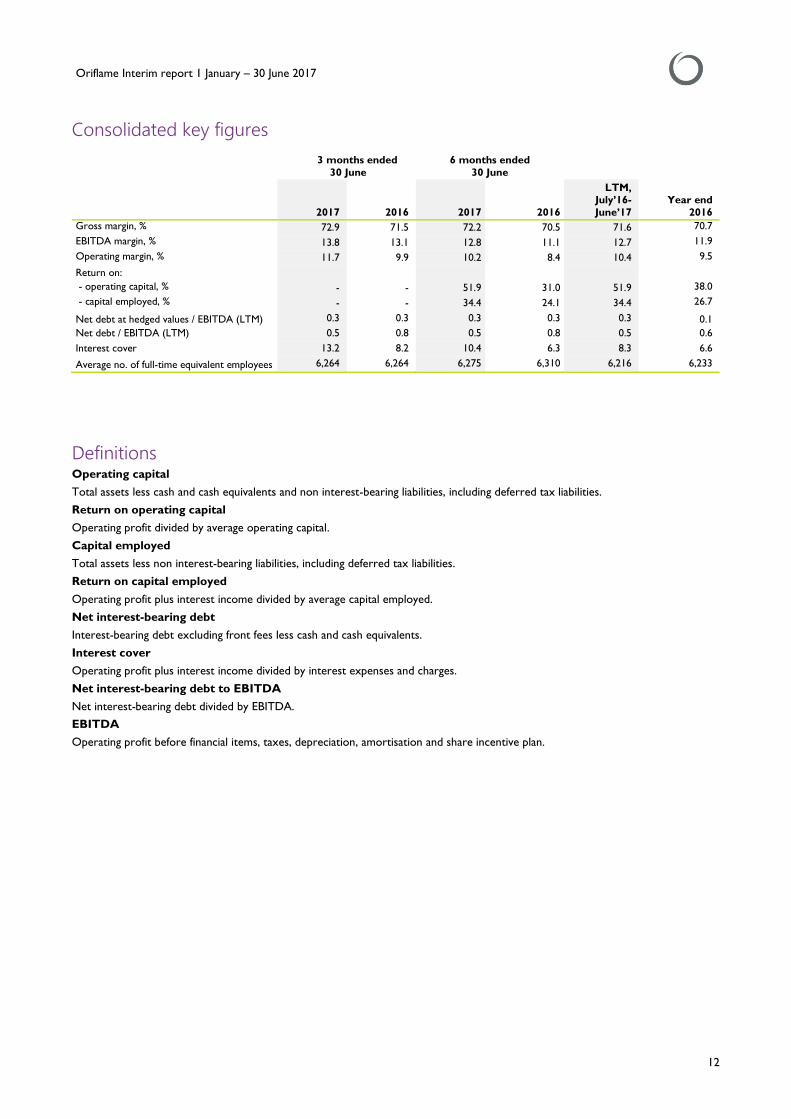
Consolidated key figures 3 months ended
30 June
6 months ended
30 June
2017 2016 2017 2016
LTM, July’16-
June’17
Year end
2016
Gross margin, % 72.9 71.5 72.2 70.5 71.6 70.7
EBITDA margin, % 13.8 13.1 12.8 11.1 12.7 11.9
Operating margin, % 11.7 9.9 10.2 8.4 10.4 9.5
Return on:
- operating capital, % - - 51.9 31.0 51.9 38.0
- capital employed, % - - 34.4 24.1 34.4 26.7
Net debt at hedged values / EBITDA (LTM) 0.3 0.3 0.3 0.3 0.3 0.1
Net debt / EBITDA (LTM) 0.5 0.8 0.5 0.8 0.5 0.6
Interest cover 13.2 8.2 10.4 6.3 8.3 6.6
Average no. of full-time equivalent employees 6,264 6,264 6,275 6,310 6,216 6,233
Definitions Operating capital
Total assets less cash and cash equivalents and non interest-bearing liabilities, including deferred tax liabilities.
Return on operating capital
Operating profit divided by average operating capital.
Capital employed
Total assets less non interest-bearing liabilities, including deferred tax liabilities.
Return on capital employed
Operating profit plus interest income divided by average capital employed.
Net interest-bearing debt
Interest-bearing debt excluding front fees less cash and cash equivalents.
Interest cover
Operating profit plus interest income divided by interest expenses and charges.
Net interest-bearing debt to EBITDA
Net interest-bearing debt divided by EBITDA.
EBITDA
Operating profit before financial items, taxes, depreciation, amortisation and share incentive plan.

Oriflame Interim report 1 January – 30 June 2017
13
Quarterly Figures
Financial summary Q1’16 Q2’16 Q3’16 Q4’16 Q1’17 Q2’17
Sales, €m 305.8 309.6 278.9 355.1 340.1 347.6
Gross margin, % 69.5 71.5 70.4 71.2 71.6 72.9
EBITDA, €m 27.7 40.6 30.8 49.0 40.4 47.9
Operating profit, €m 21.1 30.8 25.2 42.0 29.8 40.5
Operating margin, % 6.9 9.9 9.0 11.8 8.8 11.7
Net profit before income tax, €m 15.7 27.1 20.4 37.3 27.4 29.7
Net profit, €m 10.7 18.1 12.7 25.2 19.5 19.9
EPS, diluted € 0.19 0.32 0.23 0.44 0.34 0.35
Cash flow from op. activities, €m 21.5 35.8 (5.8) 61.7 (1.5) 33.9
Net interest-bearing debt, €m 133.8 106.5 111.8 82.3 92.7 82.4
Registered actives, ‘000 3,105 2,862 2,648 3,006 2,991 2,806
Sales, €m Q1’16 Q2’16 Q3’16 Q4’16 Q1’17 Q2’17
Latin America 29.4 38.5 40.9 39.8 35.3 40.9
Europe & Africa 82.4 81.2 70.4 95.3 81.3 80.3
CIS 86.6 78.0 67.2 93.9 99.5 92.9
Asia & Turkey 103.9 109.5 97.5 123.3 118.2 130.3
Manufacturing 2.1 0.4 0.7 0.6 4.5 1.4
Other 1.4 2.0 2.2 2.2 1.3 1.8
Oriflame 305.8 309.6 278.9 355.1 340.1 347.6
Operating Profit, €m Q1’16 Q2’16 Q3’16 Q4’16 Q1’17 Q2’17
Latin America 2.6 6.1 7.2 5.8 3.3 6.0
Europe & Africa 11.8 12.4 8.9 16.8 10.4 10.4
CIS 7.2 5.2 5.5 14.0 11.1 9.7
Asia & Turkey 14.7 23.1 17.7 27.6 21.1 28.0
Manufacturing 3.3 1.6 2.5 1.6 4.9 4.4
Other (18.5) (17.6) (16.6) (23.8) (21.0) (18.0)
Oriflame 21.1 30.8 25.2 42.0 29.8 40.5
Registered actives, ‘000 Q1’16 Q2’16 Q3’16 Q4’16 Q1’17 Q2’17
Latin America 243 286 314 288 266 284
Europe & Africa 768 740 655 812 802 734
CIS 1,133 913 784 926 889 794
Asia & Turkey 961 923 895 980 1,034 994
Oriflame 3,105 2,862 2,648 3,006 2,991 2,806
Operating Margin, % Q1’16 Q2’16 Q3’16 Q4’16 Q1’17 Q2’17
Latin America 8.9 15.8 17.6 14.5 9.5 14.8
Europe & Africa 14.3 15.2 12.7 17.7 12.8 12.9
CIS 8.4 6.7 8.1 14.9 11.2 10.5
Asia & Turkey 14.2 21.1 18.1 22.4 17.8 21.5
Oriflame 6.9 9.9 9.0 11.8 8.8 11.7
€ Sales Growth in % Q1’16 Q2’16 Q3’16 Q4’16 Q1’17 Q2’17
Latin America (3) 8 16 12 20 6
Europa & Africa 1 3 (1) (2) (1) (1)
CIS (20) (20) (13) (10) 15 19
Asia & Turkey 23 26 26 23 14 19
Oriflame (1) 3 6 5 11 12
Cash Flow, €m Q1’16 Q2’16 Q3’16 Q4’16 Q1’17 Q2’17
Operating cash flow 21.5 35.8 (5.8) 61.7 (1.5) 33.9
Cash flow used in investing activities (1.7) (3.3) (2.3) (4.6) (3.0) (3.0)

Oriflame Interim report 1 January – 30 June 2017
14
Independent Auditor’s Report on the Review of Condensed Consolidated Interim Financial Statements To the Board of Directors of Oriflame Holding AG, Schaffhausen
Introduction
We have been engaged to review the accompanying condensed consolidated statement of financial position of Oriflame Holding AG
as at 30 June 2017 and the related condensed consolidated statements of income, comprehensive income, changes in equity and cash
flows for the 6-month period then ended, and selected explanatory notes (the condensed consolidated interim financial statements)
on pages 15 to 25. The Board of Directors is responsible for the preparation and presentation of these condensed consolidated
interim financial statements in accordance with International Accounting Standard 34 Interim Financial Reporting. Our responsibility is
to express a conclusion on this condensed consolidated interim financial statements based on our review.
Scope of Review
We conducted our review in accordance with the International Standard on Review Engagements 2410, Review of Interim Financial
Information Performed by the Independent Auditor of the Entity. A review of interim financial statements consists of making inquiries,
primarily of persons responsible for financial and accounting matters, and applying analytical and other review procedures. A review
is substantially less in scope than an audit conducted in accordance with International Standards on Auditing and consequently does
not enable us to obtain assurance that we would become aware of all significant matters that might be identified in an audit.
Accordingly, we do not express an audit opinion.
Conclusion
Based on our review, nothing has come to our attention that causes us to believe that the accompanying condensed consolidated
interim financial statements as at 30 June 2017 are not prepared, in all material respects, in accordance with International Accounting
Standard 34 Interim Financial Reporting.
KPMG AG
Hélène Béguin
Kathrin Schünke
Licensed Audit Expert Licensed Audit Expert
Zurich, 16 August 2017
KPMG AG, Badenerstrasse 172, PO Box, CH-8036 Zurich
KPMG AG is a subsidiary of KPMG Holding AG, which is a member of the KPMG network of independent firms affiliated with KPMG International Cooperative (“KPMG International”), a Swiss legal entity. All rights reserved.

Oriflame Interim report 1 January – 30 June 2017
15
Condensed consolidated income statements
Earnings per share
€
3 months ended 30 June
6 months ended 30 June
2017 2016 2017 2016
LTM, July’16-
June’17
Year end
2016
EPS:
- basic 0.36 0.33 0.71 0.52 1.39 1.20
- diluted 0.35 0.32 0.69 0.51 1.35 1.18
Weighted avg. number of shares outstanding:
- basic 55,740,805 55,673,369 55,740,805 55,640,787 55,740,949 55,691,352
- diluted 57,151,906 56,245,663 57,151,906 56,213,081 57,152,051 56,537,639
Total number of shares outstanding (excluding treasury shares)
55,740,805 55,741,121 55,740,805 55,741,121 55,740,805 55,740,805
The attached notes on page 20 to 25 form integral part of the condensed consolidated interim financial statements
3 months ended 30 June
6 months ended 30 June
€’000 Note 2017 2016 2017 2016
LTM, July’ 16- June’ 17
Year End 2016
Sales 347,632 309,590 687,767 615,395 1,321,754 1,249,382
Cost of sales (94,310) (88,244) (191,040) (181,508) (375,999) (366,467)
Gross profit 253,322 221,346 496,727 433,887 945,755 882,915
Other income 11,727 11,506 23,684 22,159 45,856 44,331
Selling and marketing expenses (128,687) (110,155) (258,277) (224,802) (482,991) (449,516)
Distribution and infrastructure (24,075) (22,581) (48,507) (45,822) (96,741) (94,056)
Administrative expenses (71,773) (69,314) (143,344) (133,478) (274,356) (264,490)
Operating profit 40,514 30,802 70,283 51,944 137,523 119,184
Financial income 4 25,853 8,482 33,371 15,649 39,580 21,858
Financial expenses 4 (36,662) (12,224) (46,530) (24,858) (62,184) (40,512)
Net financing costs (10,809) (3,742) (13,159) (9,209) (22,604) (18,654)
Net profit before income tax 29,705 27,060 57,124 42,735 114,919 100,530
Total income tax expense (9,797) (8,932) (17,733) (13,934) (37,615) (33,816)
Profit attributable to owners of the
Company 19,908 18,128 39,391 28,801 77,304 66,714

Oriflame Interim report 1 January – 30 June 2017
16
Condensed consolidated statements of comprehensive income
€’000
3 months ended 30 June
6 months ended 30 June
2017 2016 2017 2016
LTM,
July’16- June’17
Year end 2016
Profit attributable to owners of the
Company 19,908 18,128 39,391 28,801 77,304 66,714
Other comprehensive income
Items that will not be reclassified subsequently to profit or loss:
Remeasurements of net defined benefit
liability, net of tax 110 (837) 110 (837) 631 (316)
Revaluation reserve for property, plant & equipment
(223) (180) - (210) (20) (230)
Total items that will not be reclassified subsequently to profit or loss
(113) (1,017) 110 (1,047) 611 (546)
Items that are or may be reclassified subsequently to profit or loss:
Foreign currency translation differences
for foreign operations (14,813) 4,283 (6,917) 2,275 3,107 12,299
Effective portion of changes in fair value of cash flow hedges, net of tax
3,162 (2,011) 2,773 (2,961) 3,015 (2,719)
Total items that are or may be reclassified subsequently to profit or
loss
(11,651) 2,272 (4,144) (686) 6,122 9,580
Other comprehensive income for
the period, net of tax (11,764) 1,255 (4,034) (1,733) 6,733 9,034
Total comprehensive income for the
period attributable to owners of the Company
8,144 19,383 35,357 27,068 84,037 75,748
The attached notes on page 20 to 25 form integral part of the condensed consolidated interim financial statements

Oriflame Interim report 1 January – 30 June 2017
17
Condensed consolidated statements of financial position
€’000 Note
30 June,
2017 31 December,
2016 30 June,
2016
Assets
Property, plant and equipment 155,597 164,831 156,527
Intangible assets 14,168 13,849 13,892
Investment property 542 542 542
Deferred tax assets 32,626 25,702 21,274
Other long-term receivables 137 948 1,096
Total non-current assets 203,070 205,872 193,331
Inventories 165,634 166,833 144,060
Trade and other receivables 70,385 71,352 63,736
Tax receivables 11,787 7,647 8,382
Prepaid expenses 37,055 36,283 36,038
Derivative financial assets 42,721 72,338 64,111
Cash and cash equivalents 173,428 185,469 163,787
Total current assets 501,010 539,922 480,114
Total assets 704,080 745,794 673,445
Equity
Share capital 79,850 79,850 79,850
Treasury shares (90) (90) (80)
Share premium 548,474 632,085 654,381
Reserves (163,507) (167,017) (179,239)
Retained earnings (293,603) (333,104) (393,834)
Total equity 171,124 211,724 161,078
Liabilities
Interest-bearing loans 8 254,534 199,713 194,154
Other long-term liabilities 3,954 3,691 839
Net defined benefit liability 3,690 3,859 4,673
Deferred income 282 296 325
Deferred tax liabilities 3,027 2,869 236
Total non-current liabilities 265,487 210,428 200,227
Current portion of interest-bearing loans 8 281 66,836 74,822
Trade and other payables 81,950 95,292 67,250
Dividend payables 5 41,896 11,167 22,296
Deferred Income 364 421 401
Tax payables 16,378 17,032 16,470
Accrued expenses 120,902 122,208 115,350
Derivative financial liabilities 3,109 5,458 4,777
Provisions 2,589 5,228 10,774
Total current liabilities 267,469 323,642 312,140
Total liabilities 532,956 534,070 512,367
Total equity and liabilities 704,080 745,794 673,445
The attached notes on page 20 to 25 form integral part of the condensed consolidated interim financial statements

Oriflame Interim report 1 January – 30 June 2017
18
Condensed consolidated statements of changes in equity
€’000
Note
Share capital
Treasury shares
Share premium
Reserves
Retained earnings
Total equity
At 1 January 2016 79,788 (621) 654,381 (178,675) (401,416) 153,457
Net profit - - - - 28,801 28,801
Other comprehensive income, net of tax
- - - (896) (837) (1,733)
Total comprehensive income for the period
- - - (896) 27,964 27,068
Issue of ordinary shares in
relation to share incentive plan
62 - - (862) 800 -
Treasury shares used in relation
to share incentive plan
- 541 - (1,655) 1,114 -
Share incentive plan - - - 2,849 - 2,849
Dividends 5 - - - - (22,296) (22,296)
Total contributions and
distributions
62 541 - 332 (20,382) (19,447)
At 30 June 2016 79,850 (80) 654,381 (179,239) (393,834) 161,078
At 1 January 2017 79,850 (90) 632,085 (167,017) (333,104) 211,724
Net profit - - - - 39,391 39,391
Other comprehensive income,
net of tax - - - (4,144) 110 (4,034)
Total comprehensive income for the period
- - - (4,144) 39,501 35,357
Share incentive plan 6 - - - 7,654 - 7,654
Dividends 5 - - (83,611) - - (83,611)
Total contributions and
distributions - - (83,611) 7,654 - (75,957)
At 30 June 2017 79,850 (90) 548,474 (163,507) (293,603) 171,124
The attached notes on page 20 to 25 form integral part of the condensed consolidated interim financial statements

Oriflame Interim report 1 January – 30 June 2017
19
Condensed consolidated statements of cash flows
€’000
3 months ended
30 June
6 months ended
30 June
Note 2017 2016 2017 2016
Operating activities
Net profit before income tax 29,705 27,060 57,124 42,735
Adjustments for:
Depreciation of property, plant and equipment 4,491 4,661 9,164 9,029
Amortisation of intangible assets 411 1,055 833 2,009
Change in fair value of borrowings and derivatives financial instruments (894) 861 (1,038) 3,058
Deferred income (31) 227 (68) (405)
Impairment 347 2,473 347 2,473
Share incentive plan 2,116 1,599 7,654 2,849
Unrealised exchange rate differences 9,614 (3,639) 4,614 (11,448)
Profit on disposal of property, plant and equipment, intangible assets (993) (49) (996) (69)
Financial income (3,231) (4,320) (7,387) (8,838)
Financial expenses 4,660 5,826 10,294 12,844
Operating profit before changes in working capital and provisions 46,195 35,754 80,541 54,237
(Increase)/decrease in trade and other receivables, prepaid expenses and derivative financial assets 7,577 4,293 419 (856)
(Increase)/decrease in inventories (4,017) 5,648 (2,605) 26,600
Increase/(decrease) in trade and other payables, accrued expenses and derivatives
financial liabilities 5,673 3,302 (11,078) 2,765
Decrease in provisions (1,551) (1,724) (2,455) (3,268)
Cash generated from operations 53,877 47,273 64,822 79,478
Interest received 4,662 4,495 8,467 10,166
Interest and bank charges paid (6,912) (6,701) (11,348) (14,740)
Income taxes paid (17,700) (9,258) (29,486) (17,645)
Cash flow from operating activities 33,927 35,809 32,455 57,259
Investing activities
Proceeds on sale of property, plant and equipment, intangible assets 1,874 159 1,904 224
Purchases of property, plant, equipment (4,233) (2,576) (6,755) (4,106)
Purchases of intangible assets (637) (851) (1,105) (1,063)
Cash flow used in investing activities (2,996) (3,268) (5,956) (4,945)
Financing activities
Proceeds from borrowings 105,000 - 105,000 -
Repayments of borrowings (86,471) (5,992) (86,471) (62,033)
Decrease of finance lease liabilities - (1) - (4)
Dividends paid 5 (41,750) - (52,863) -
Cash flow used in financing activities (23,221) (5,993) (34,334) (62,037)
Change in cash and cash equivalents 7,710 26,548 (7,835) (9,723)
Cash and cash equivalents at the beginning of the period net of bank overdrafts 170,600 135,719 185,365 176,384
Effect of exchange rate fluctuations on cash held (5,164) 1,261 (4,384) (3,133)
Cash and cash equivalents at the end of the period net of bank overdrafts 173,146 163,528 173,146 163,528
The attached notes on page 20 to 25 form integral part of the condensed consolidated interim financial statements

Oriflame Interim report 1 January – 30 June 2017
20
Notes to the condensed consolidated interim financial statements of Oriflame
Holding AG
Note 1 • Status and principal activity
Oriflame Holding AG (“OHAG” or the “Company”) is a holding company incorporated in Switzerland and registered at Bleicheplatz 3, CH-8200 Schaffhausen. The principal activity of the Company’s subsidiaries is the direct sale of cosmetics. The condensed consolidated interim financial statements (‘interim financial statements’) of the Company as at and for the six months ended 30 June 2017 comprise the Company and its subsidiaries (together
referred to as the “Group”).
Note 2 • Basis of preparation and summary of significant accounting policies
Statement of compliance The interim financial statements for the six months period ended 30 June 2017 have been prepared by management in accordance with IAS 34 “Interim Financial Reporting” and should be read in conjunction with the consolidated financial statements of the Group as at and for the year ended 31
December 2016. The interim financial statements were authorised for issue by the Directors on 16 August 2017.
Significant accounting policies, use of judgements and estimates The accounting policies, significant judgements and key sources of estimation uncertainty applied by the Group in these interim financial statements are the same as those applied by the Group in its consolidated financial statements as at and for the year ended 31 December 2016.
New or amended IFRS standards The new or amended IFRS standards, which became effective 1 January 2017, have had no material effect on the interim financial statements.
Upcoming IFRS standards
The Group is introducing IFRS 15 Revenue from Contracts with Customers from January 1 2018. An early application will at the same time be made
of IFRS 16 Leases. The application of IFRS 15 is expected to impact the income statement at different levels. Net sales will be negatively impacted by a low-single percentage digit in absolute terms due to a one-off effect related to deferred recognition of revenue as well as further ongoing reclassifications under
the new standard. The gross margin will be impacted by ongoing reclassifications of costs, resulting in a total negative gross margin impact of a low single percentage digit. The above mentioned ongoing reclassification of costs will have a corresponding positive impact on the operating margin.
However, the operating margin will for the first year be negatively impacted by a minor single digit percentage (around or below 100 bps) due to the
one-off effect in Net sales. The implementation of IFRS 16 will positively impact the operating margin with a minor single digit percentage (around or below 100 bps) due to the
elimination of operation leasing expenses which will be mainly compensated by depreciation of the lease assets. In addition, the finance costs will increase due to the recognition of interest on the finance lease liabilities. During the first year, it will result in a net negative impact on the net profit margin after tax of a minor single digit percentage (around or below 100 bps). The new standard will also impact the deferred tax calculation for which
the impact has not yet been assessed. In summary, excluding the one-off effects of IFRS 15, the combined effect of the new standards will have a negligible impact on the operating margin.

Oriflame Interim report 1 January – 30 June 2017
21
Note 3 • Segment reporting
Operating segments
The Group has five main reportable segments, which consists of Latin America, Europe & Africa, CIS, Asia & Turkey and Manufacturing, as this is the
structure of financial information reviewed by the Corporate Committee. The purpose of the Group is selling cosmetics within the above organisation. The Group sales consist mainly of sales of Colour cosmetics, Skin care, Personal & Hair Care, Fragrances and Accessories & Wellness products. The segment Manufacturing is producing mainly for the Group. Smaller quantities are produced for third parties as well. “All other segments” includes
licensee sales and royalties income. The performance of each market and region is measured by the operating profit. Sales presented in the segment reporting are only revenues from external customers.
Unallocated items
Some costs and capital expenditure are not identified as part of any operating segment and are therefore not allocated. Examples of such items are
cost for corporate staff, IT costs and general marketing costs. Net financing costs and total income tax expense are also not allocated. Summarised financial information concerning the reportable segments is shown in the following tables:
As per 30 June 2017
Latin
America
Europe &
Africa CIS
Asia &
Turkey
Manu-
facturing
All other
segments
Total
segments
Unallocated
items Total €’000
Sales 76,139 161,623 192,392 248,511 5,849 3,253 687,767 - 687,767
Operating Profit 9,378 20,808 20,825 49,083 9,331 945 110,370 (40,087) 70,283
Net financing costs (13,159)
Net profit before
income tax 57,124
Total income tax
expense (17,733)
Net profit 39,391
Capital expenditure (412) (522) (942) (926) (1,542) - (4,344) (3,516) (7,860)
Depreciation &
amortisation (571) (836) (1,539) (1,077) (4,596) - (8,619) (1,378) (9,997)
Impairment - - - - - - - (347) (347)
Goodwill - 1,053 - 4,345 - - 5,398 - 5,398
As per 30 June 2016
Latin
America
Europe
& Africa CIS
Asia &
Turkey
Manu-
facturing
All other
segments
Total
segments
Unallocated
items Total €’000
Sales 67,873 163,583 164,550 213,512 2,582 3,466 615,566 (171) 615,395
Operating Profit 8,709 24,151 12,484 37,785 4,969 877 88,975 (37,031) 51,944
Net financing costs (9,209)
Net profit before
income tax 42,735
Total income tax
expense (13,934)
Net profit 28,801
Capital expenditure (502) (577) (767) (1,036) (745) - (3,627) (1,542) (5,169)
Depreciation &
amortisation (554) (923) (1,327) (1,107) (2,804) - (6,715) (4,323) (11,038)
Impairment - - - - - - - (2,473) (2,473)
Goodwill - 1,053 - 4,345 - - 5,398 - 5,398

Oriflame Interim report 1 January – 30 June 2017
22
Note 4 • Financial income and expense
Recognised in the condensed consolidated interim income statements
€’000
3 months ended
30 June
6 months ended
30 June
2017 2016 2017 2016
Interest income on bank deposits 531 651 1,009 1,265
Interest received on finance lease receivable 6 30 14 32
Cross currency interest rate swaps interest income 2,693 3,639 6,364 7,541
Change in fair value of financial
assets and liabilities at fair value held for trading:
- Forward exchange rate contracts gain 1,242 863 1,369 679
- Interest rate swaps gain 57 - 57 -
- Interest rate caps gain - - 3 -
- Cross currency interest rate swaps gain - 3,299 - -
Change in fair value of financial assets and
liabilities at fair value designated as such upon initial recognition:
- USD loan fair value gain 21,324 - 24,555 6,132
- Foreign exchange gains, net - - - -
Total financial income 25,853 8,482 33,371 15,649
Bank charges and interest expense on loans carried at amortised cost (466) (1,478) (2,706) (3,871)
Interest expense on loan carried at fair value (2,743) (2,608) (4,452) (5,233)
Cross currency interest rate swaps interest expense (1,451) (1,740) (3,137) (3,741)
Change in fair value of financial
assets and liabilities at fair value held for trading:
- Forward exchange rate contracts expense - (474) (284) (1,873)
- Interest rate caps expense (13) (87) (2) (760)
- Cross currency interest rate swaps expense (21,715) - (24,661) (7,235)
Change in fair value of financial assets and
liabilities at fair value designated as such upon initial recognition:
- USD loan fair value loss - (4,462) - -
- Option exchange rate contract loss - - - -
Foreign exchange losses, net (10,274) (1,375) (11,288) (2,145)
Total financial expenses (36,662) (12,224) (46,530) (24,858)
Net financing costs (10,809) (3,742) (13,159) (9,209)

Oriflame Interim report 1 January – 30 June 2017
23
Note 5 • Dividends
Dividends declared
During the 6 months period in 2017 and following the Annual General Meeting (AGM) held on 9 May 2017, a dividend of €1.50 per share was recognised against the capital contribution reserve (share premium) for an amount of €83.6m. In 2016, during the period, a dividend of €0.40 per share totalling €22.3m was recognised in the equity.
Dividends paid In February 2017, the second instalment from the 2016 AGM dividend resolution was paid for €11.1m (€0.20 per share).
In May 2017, the first instalment from the 2017 AGM dividend resolution was paid for €41.8m (€0.75 per share).
Note 6 • Share Incentive Plan
During the period, as part of the share incentive Plan adopted on 13 August 2015 by the Board and amended in December 2016 to reflect the 2017 Grid, a further 2017 share incentive offer was proposed to participants. This offer resulted at the beginning of the scheme in a grant of 71,000 investment shares.
Note 7 • Inventories
During the first half of 2017 the Group wrote down €3.0 million (€3.3 million) inventory mainly due to obsolescence which is included in cost of sales.
Note 8 • Interest-bearing loans
On 20 April 2017, the second tranche in the U.S. private placement loan issued in 2010 matured and the Group repaid the aggregated principal amount of $70 million together with the interest accrued to investors.
On 29 June 2017, the Group successfully completed the issuance of €70 million private placement notes. The notes have a final maturity in 2029 and will be linearly amortised starting from 2025. Interest is fixed and paid semi-annually.
The terms and maturity schedule of loans outstanding at 30 June 2017 were as follows:
* Difference between the face value and the carrying amount consists of the fair value difference and the amount of amortised front-end fees.
Note 9 • Financial instruments
Interest rate risk
Not designated as hedge
In 2010 and 2011, the Group issued loans in the U.S. private placement market (USD loan) and at the same time entered into a series of cross currency interest rate swaps, effectively converting USD semi-annual fixed interest rate of USD loans into floating rates of 6-month and 3-month Euribor,
respectively, plus spread which the Group decided to hedge economically through series of interest rate cap agreements. At 30 June 2017, the total outstanding nominal EUR amount of these cross currency interest rate swaps corresponds to €88.4 million. On 29 June 2017, the Group decided to enter into interest rate swap agreements in the total nominal amount of €47.9 million in order to convert the floating rates into fixed interest rates
obligations. Subsequently, on 3 July 2017, the Group entered into interest rate swap agreements to convert floating rate into fixed rate for the remaining part of cross currency interest rate swaps in the total nominal amount of €40.5 million.
Similarly to the USD loan and related cross currency interest rate swaps, the recently acquire interest rate swaps are measured at fair value through profit and loss in the consolidated statements of financial position since the underlying hedged item is a derivative itself. Fair value estimation
The fair values of financial assets and liabilities, together with the carrying amounts shown in the condensed consolidation interim statements of financial position are as follows:
€ '000 Currency Interest Year of 30 June 2017 31 December 2016
rate maturity Face Carrying Face Carrying
value amount * value amount *
Revolving bank facility EUR Euribor + margin 2020 - (946) - (1,113)
Private placement loan USD Fixed rate USD coupon 2017-2020 51,471 64,212 102,941 136,571
Private placement loan USD/ EUR Fixed rate EUR and USD coupon 2018-2023 95,624 121,268 95,624 130,987
Private placement loan EUR Fixed rate EUR 2029 70,000 70,000 - -
Bank overdrafts TRY 0% / 16% - 281 281 104 104
Total interest bearing liabilities 217,376 254,815 198,669 266,549

Oriflame Interim report 1 January – 30 June 2017
24
€’000 30 June 2017 31 December 2016
Carrying amount
Fair value
Carrying amount Fair value
Financial assets carried at fair value:
Cross currency interest rate swaps for trading 26,051 26,051 51,650 51,650
Interest rate caps for trading 25
25 23 23
Interest rate swaps for trading 57 57 - -
Forward exchange rate contracts for trading 787 787 202 202
Total derivatives for trading 26,920 26,920 51,875 51,875
Cross currency interest rate swaps for hedging 13,701 13,701 18,929 18,929
Forward exchange rate contracts for hedging 2,100 2,100 1,534 1,534
Total derivatives for hedging 15,801 15,801 20,463 20,463
Total derivative financial assets 42,721 42,721 72,338 72,338
Total financial assets carried at fair value 42,721 42,721 72,338 72,338
Financial liabilities carried at amortised cost:
Loans (142,454) (155,874) (78,338) (81,529)
Total financial liabilities carried at amortised cost (142,454) (155,874) (78,338) (81,529)
Financial liabilities carried at fair value:
USD loan (112,080) (112,080) (188,107) (188,107)
Total designated as such upon initial recognition (112,080) (112,080) (188,107) (188,107)
Cross currency interest rate swaps for trading (490)
(490) (757) (757)
Forward exchange rate contracts for trading (981)
(981) (2,130) (2,130)
Total derivatives for trading (1,471) (1,471) (2,887) (2,887)
Cross currency interest rate swaps for hedging (675)
(675) (684) (684)
Forward exchange rate contracts for hedging (963)
(963) (1,887) (1,887)
Total derivatives for hedging (1,638) (1,638) (2,571) (2,571)
Total derivative financial liabilities (3,109) (3,109) (5,458) (5,458)
Total financial liabilities carried at fair value cost (115,189) (115,189) (193,565) (193,565)
The fair values for all other financial instruments such as cash and cash equivalents, short-term trade receivables and payables are not disclosed, because their carrying amounts are a reasonable approximation of fair value.
Derivative financial assets and liabilities The fair value of forward exchange contracts, interest rate swaps, cross currency interest rate swaps and options are based on their market quotes. Those quotes are tested for reasonableness by discounting estimated future cash flows based on the terms and maturity of each contract and using
market interest rates for a similar instrument at the reporting date. The fair value of interest rate caps is the estimated amount which the Group would receive or pay when unwinding the caps at the reporting date.
Financial liabilities at amortised costs
Fair value is calculated based on the present value of future principal and interest cash flows, discounted at the forward market rate of interest at the reporting date.
Financial liabilities carried at fair value designated as such upon initial recognition The fair value of the USD loans is calculated by discounting the cash flows associated to the loan schedule for the life of the loan at the market interest rates prevailing for such type and currency of loan as of the reporting date. No changes in the credit risks were done for this calculation as there have
been no changes in the financial condition of the Group since the inception of the USD loans. Fair value hierarchy
The table below shows fair value of financial assets and financial liabilities, including their levels in the fair value hierarchy, by valuation method. It does not include fair value information for financial assets and financial liabilities not measured at fair value if the carrying amount is a reasonable approximation of fair value. The different levels have been defined as follows:
Level 1: quoted prices (unadjusted) in active markets for identical assets or liabilities

Oriflame Interim report 1 January – 30 June 2017
25
Level 2: inputs other than quoted prices included within Level 1 that are observable for the asset or liability, either directly (i.e., as prices) or indirectly
(i.e., derived from prices) Level 3: inputs for the asset or liability that are not based on observable market data (unobservable inputs)
€'000 Level 1 Level 2 Level 3 Total
30 June 2017
Financial assets and liabilities measured at fair value
USD loans - (112,080) -
(112,080)
Derivative financial assets - 42,721 -
42,721
Derivative financial liabilities -
(3,109) -
(3,109)
-
(72,468) -
(72,468)
Financial assets and liabilities not measured at fair value
Loans - (155,874) -
(155,874)
-
(155,874) -
(155,874)
€'000 Level 1 Level 2 Level 3 Total
31 December 2016
Financial assets and liabilities measured at fair value
USD loans - (188,107) -
(188,107)
Derivative financial assets - 72,338 -
72,338
Derivative financial liabilities -
(5,458) -
(5,458)
-
(121,227) -
(121,227)
Financial assets and liabilities not measured at fair value
Loans - (81,529) -
(81,529)
-
(81,529) -
(81,529)
There were no transfers between levels of the fair value hierarchy during the six months ended 30 June 2017 and the twelve months ended 31 December 2016.
Note 10 • Seasonality
The business of the Group presents cyclical evolutions and is driven by a number of factors:
• Effectiveness of individual catalogues and product introductions
• Effectiveness and timing of recruitment programmes
• Timing of sales and marketing activities
• The number of effective sales days per quarter
Note 11 • Events subsequent to the reporting date
As at 16 August 2017, there were no significant events after the reporting period that could have impacted or influenced the interim financial statements.