interim financial statements (unaudited) · interim financial statements (unaudited) ... total...
TRANSCRIPT
Interim financial statements (unaudited)
as at 30 September 2012
These financial statements for the six months ended 30 September 2012 were presented to the Board of Directors on 4 November 2012.
Jaime Caruana Hervé Hannoun General Manager Deputy General Manager

Interim Financial Statements – 30.09.2012 iii
Contents
Management report ................................................................................................. 1
Balance sheet ......................................................................................................... 2
Profit and loss account............................................................................................ 3
Statement of comprehensive income ..................................................................... 4
Statement of cash flows .......................................................................................... 5
Movements in the Bank’s equity .............................................................................. 7
Notes to the financial statements ........................................................................... 8
1. Accounting policies................................................................................. 8
2. Use of estimates .................................................................................... 8
3. Currency assets ..................................................................................... 9
4. Land, buildings and equipment ............................................................... 10
5. Currency deposits .................................................................................. 10
6. Dividends ............................................................................................... 11
7. Share capital .......................................................................................... 11
8. Earnings per share ................................................................................. 11
9. Cash and cash equivalents..................................................................... 12
10. Commitments ......................................................................................... 12
11. Related parties ....................................................................................... 12
12. Contingent liabilities ............................................................................... 15
Capital adequacy .................................................................................................... 16
1. Capital .................................................................................................... 16
2. Economic capital .................................................................................... 16
3. Risk-weighted assets and minimum capital requirements under the Basel II Framework ................................................................................. 17
4. Tier 1 capital ratio .................................................................................. 18
Risk management ................................................................................................... 19
1. Credit risk ............................................................................................... 19
2. Market risk ............................................................................................. 27
3. Liquidity risk ........................................................................................... 31
4. Operational risk ...................................................................................... 34

Interim Financial Statements – 30.09.2012 1
Management report
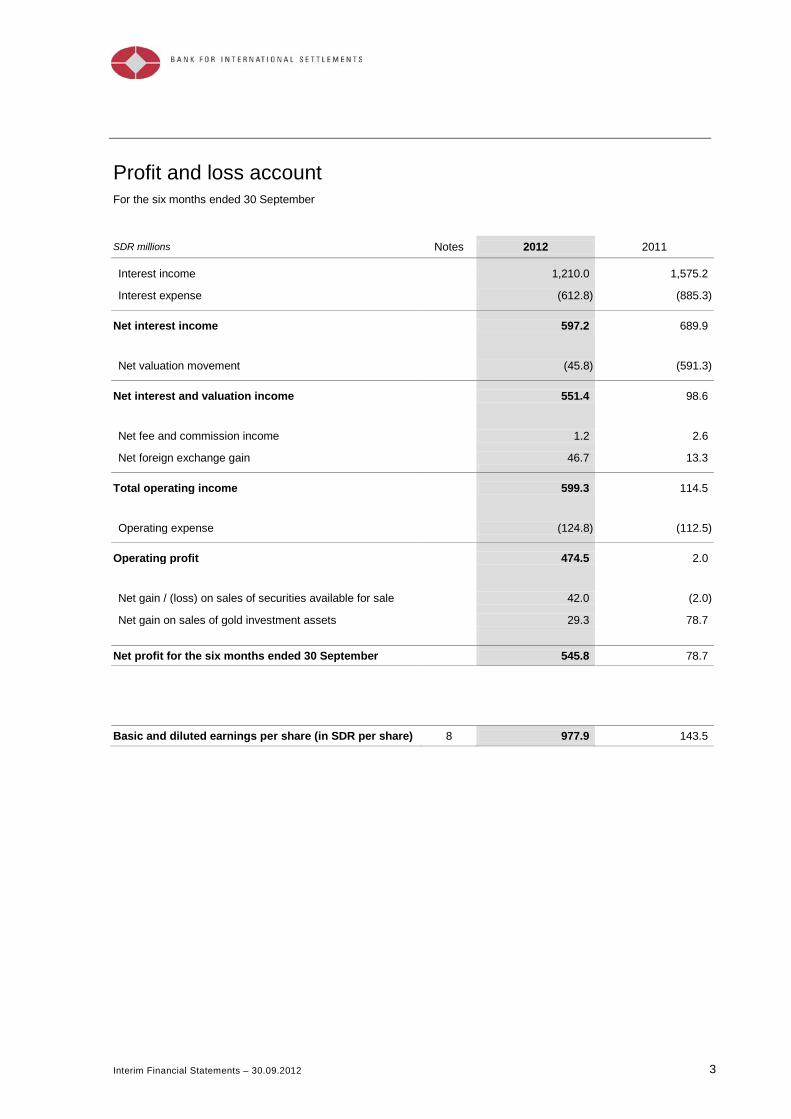
The Bank recorded a net profit of SDR 545.8 million for the six months ended 30 September 2012. This compares with a profit of SDR 78.7 million for the equivalent period last year. The main factors behind this outcome are described below.
Net interest income for the six months ended 30 September 2012 amounted to SDR 597.2 million, against SDR 689.9 million in the equivalent period last year. The reduction in the net interest income was principally driven by the reduction in the size of balance sheet in a period of continuing uncertainty in financial markets. The Bank maintained a stable net interest margin.
Net valuation movements amounted to a loss of SDR 45.8 million for the six months ended 30 September 2012, compared with a loss of SDR 591.3 million in the equivalent period last year. The first quarter of 2012/13 saw valuation losses, which were largely recovered in the second quarter when market sentiment improved.
Operating expenses increased from SDR 112.5 million in the prior period to SDR 124.8 million in the six months ended 30 September 2012.
Mainly as a result of the factors above, the Bank’s operating profit amounted to SDR 474.5 million, compared with SDR 2.0 million last year, an increase of 472.5 million.
A net gain of SDR 42.0 million was realised during the period on the sale of securities available for sale. This figure compares with a net loss of SDR 2.0 million for the equivalent period last year. A gain of SDR 29.3 million was realised on the sale of gold investment assets during the period, representing the disposal of one tonne of the Bank’s own gold. In the first half of 2011/12 the Bank sold three tonnes of gold and realised a gain of SDR 78.7 million.
The net profit for the first six months of 2012/13 amounted to SDR 549.7 million, compared with a net profit of SDR 78.7 million for the equivalent period last year.
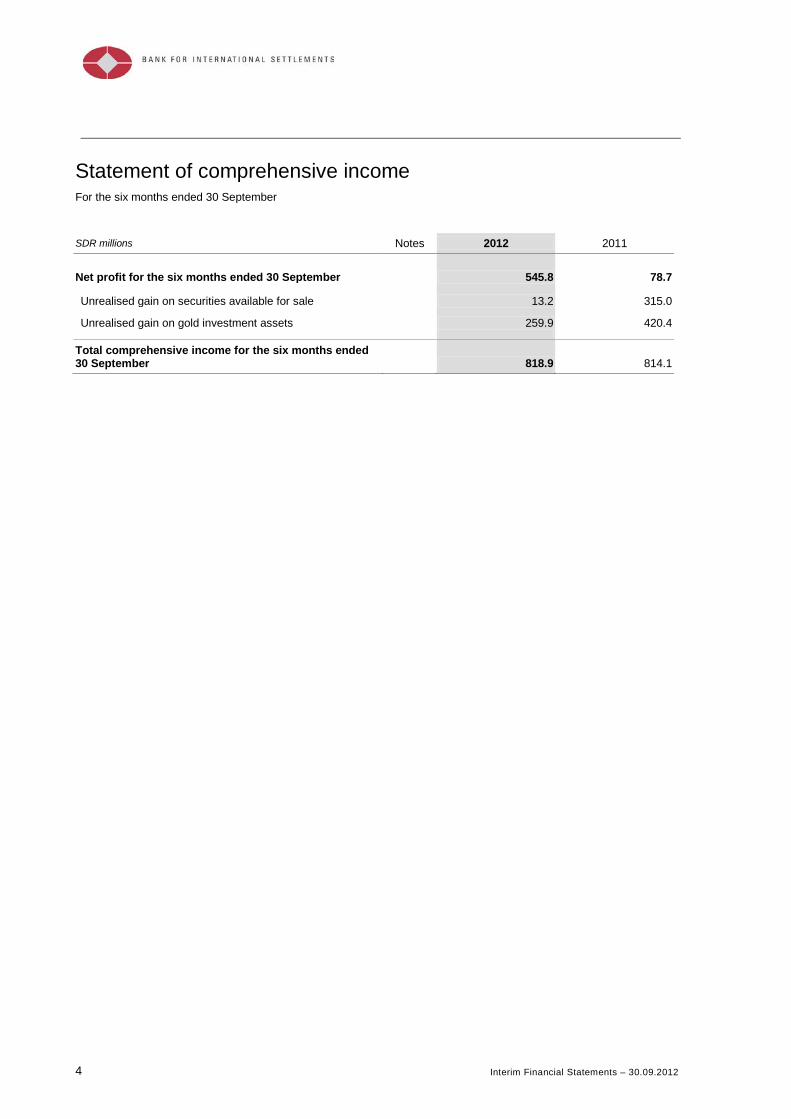
In addition to the items reflected in the Bank’s profit and loss account, the unrealised gains and losses on the Bank’s securities available for sale and gold investment assets are recorded in the securities revaluation account and gold revaluation account, which are included in the Bank’s equity.
The securities revaluation account increased by SDR 13.2 million during the period as a result of unrealised gains on investment securities held in the Bank’s own funds. The gold revaluation account increased by SDR 259.9 million as a result of the further appreciation of the price of gold of SDR 289.2 million.
The Bank’s total comprehensive income amounted to SDR 818.9 million. This represented an annualised return of 8.9% on average equity. By comparison, the total comprehensive income for the equivalent period last year was SDR 814.1 million, resulting in an annualised return on average equity of 9.4%.
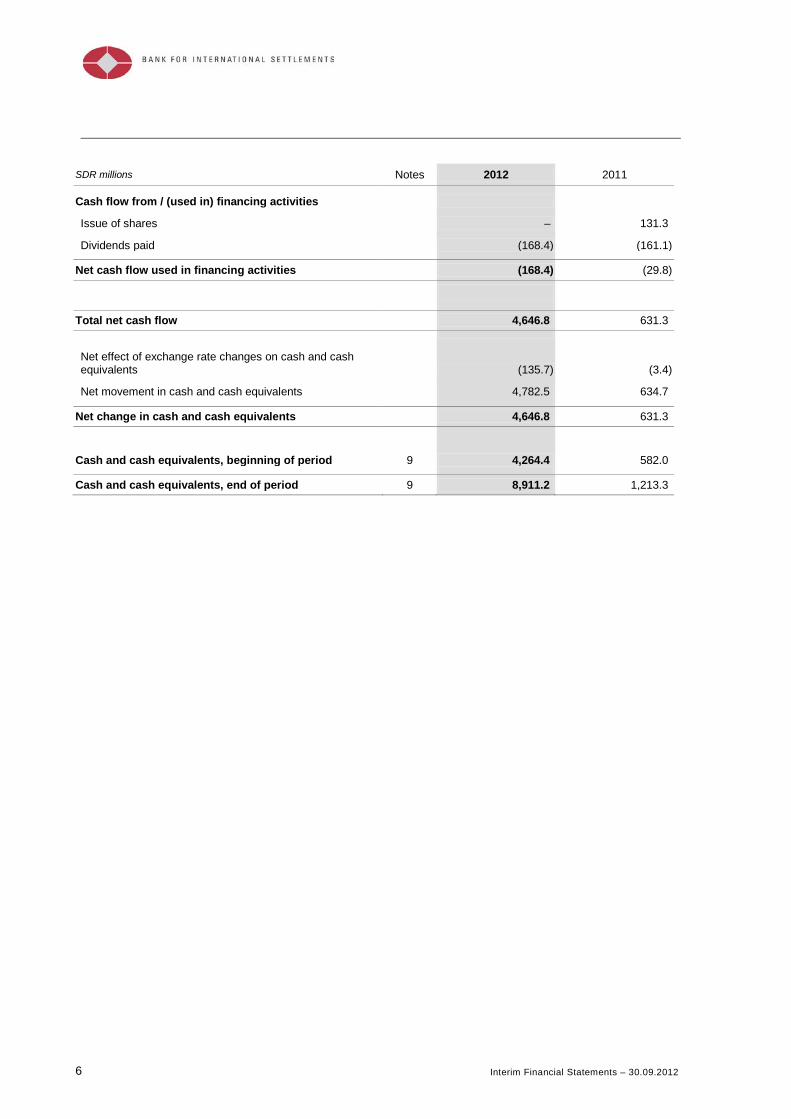
After the payment of the dividend for the 2011/12 financial year (SDR 168.4 million), the Bank’s equity increased over the six months ended 30 September 2012 by SDR 650.5 million to SDR 19,029.8 million.
2 Interim Financial Statements – 30.09.2012
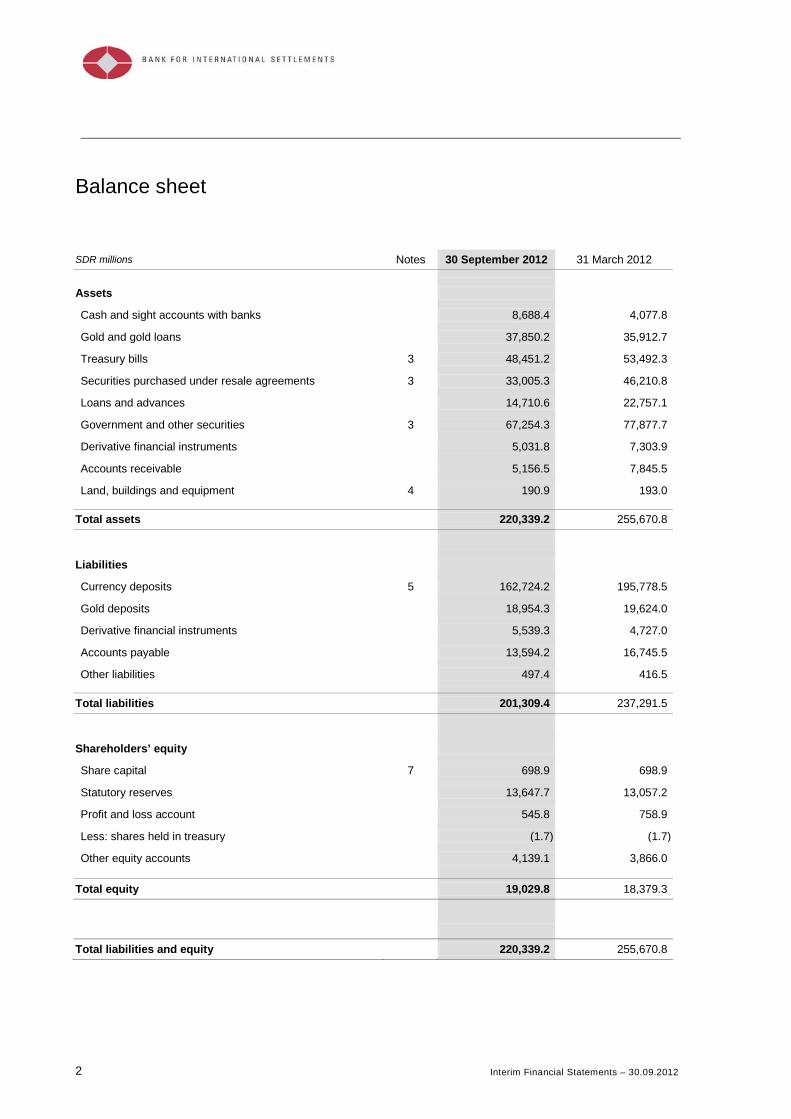
Balance sheet
SDR millions Notes 30 September 2012 31 March 2012 Assets
Cash and sight accounts with banks 8,688.4 4,077.8
Gold and gold loans 37,850.2 35,912.7
Treasury bills 3 48,451.2 53,492.3
Securities purchased under resale agreements 3 33,005.3 46,210.8
Loans and advances 14,710.6 22,757.1
Government and other securities 3 67,254.3 77,877.7
Derivative financial instruments 5,031.8 7,303.9
Accounts receivable 5,156.5 7,845.5
Land, buildings and equipment 4 190.9 193.0 Total assets 220,339.2 255,670.8
Liabilities
Currency deposits 5 162,724.2 195,778.5
Gold deposits 18,954.3 19,624.0
Derivative financial instruments 5,539.3 4,727.0
Accounts payable 13,594.2 16,745.5
Other liabilities 497.4 416.5 Total liabilities 201,309.4 237,291.5
Shareholders’ equity
Share capital 7 698.9 698.9
Statutory reserves 13,647.7 13,057.2
Profit and loss account 545.8 758.9
Less: shares held in treasury (1.7) (1.7)
Other equity accounts 4,139.1 3,866.0 Total equity 19,029.8 18,379.3
Total liabilities and equity 220,339.2 255,670.8
Interim Financial Statements – 30.09.2012 3
Profit and loss account For the six months ended 30 September
SDR millions Notes 2012 2011
Interest income 1,210.0 1,575.2
Interest expense (612.8) (885.3) Net interest income 597.2 689.9
Net valuation movement (45.8) (591.3) Net interest and valuation income 551.4 98.6
Net fee and commission income 1.2 2.6
Net foreign exchange gain 46.7 13.3 Total operating income 599.3 114.5
Operating expense (124.8) (112.5) Operating profit 474.5 2.0
Net gain / (loss) on sales of securities available for sale 42.0 (2.0)
Net gain on sales of gold investment assets 29.3 78.7
Net profit for the six months ended 30 September 545.8 78.7
Basic and diluted earnings per share (in SDR per share) 8 977.9 143.5
4 Interim Financial Statements – 30.09.2012
Statement of comprehensive income For the six months ended 30 September
SDR millions Notes 2012 2011
Net profit for the six months ended 30 September 545.8 78.7
Unrealised gain on securities available for sale 13.2 315.0
Unrealised gain on gold investment assets 259.9 420.4 Total comprehensive income for the six months ended 30 September 818.9 814.1

Interim Financial Statements – 30.09.2012 5
Statement of cash flows For the six months ended 30 September
SDR millions Notes 2012 2011
Cash flow from / (used in) operating activities
Interest and similar income received 1,527.7 1,935.5
Interest and similar expenses paid (568.2) (778.6)
Net fee and commission income 1.2 2.6
Foreign exchange transaction gain 18.8 7.7
Operating expenses paid (117.0) (105.4) Non-cash flow items included in operating profit
Valuation movements on operating assets and liabilities (45.8) (591.3)
Foreign exchange translation gain 27.9 5.6
Change in accruals and amortisation (362.3) (467.0) Change in operating assets and liabilities
Currency deposit liabilities held at fair value through profit and loss (18,940.8) (24,448.8)
Currency banking assets 33,913.3 18,332.1
Sight and notice deposit account liabilities (11,025.3) 9,970.6
Gold deposit liabilities (669.7) (127.6)
Gold and gold loan banking assets (1,682.9) 495.7
Accounts receivable (38.2) (1.5)
Other liabilities / accounts payable 189.0 103.1
Net derivative financial instruments 3,084.4 (3,030.1) Net cash flow from operating activities 5,312.1 1,302.6
Cash flow from / (used in) investment activities
Net change in currency investment assets available for sale (436.8) (620.5)
Net change in currency investment assets held at fair value through profit and loss (89.0) (110.5)
Net change in gold investment assets 34.6 97.2
Net purchase of land, buildings and equipment 4 (5.7) (7.7) Net cash flow used in investment activities (496.9) (641.5)
6 Interim Financial Statements – 30.09.2012
SDR millions Notes 2012 2011
Cash flow from / (used in) financing activities
Issue of shares – 131.3
Dividends paid (168.4) (161.1) Net cash flow used in financing activities (168.4) (29.8)
Total net cash flow 4,646.8 631.3
Net effect of exchange rate changes on cash and cash equivalents (135.7) (3.4)
Net movement in cash and cash equivalents 4,782.5 634.7 Net change in cash and cash equivalents 4,646.8 631.3
Cash and cash equivalents, beginning of period 9 4,264.4 582.0 Cash and cash equivalents, end of period 9 8,911.2 1,213.3
Interim Financial Statements – 30.09.2012 7
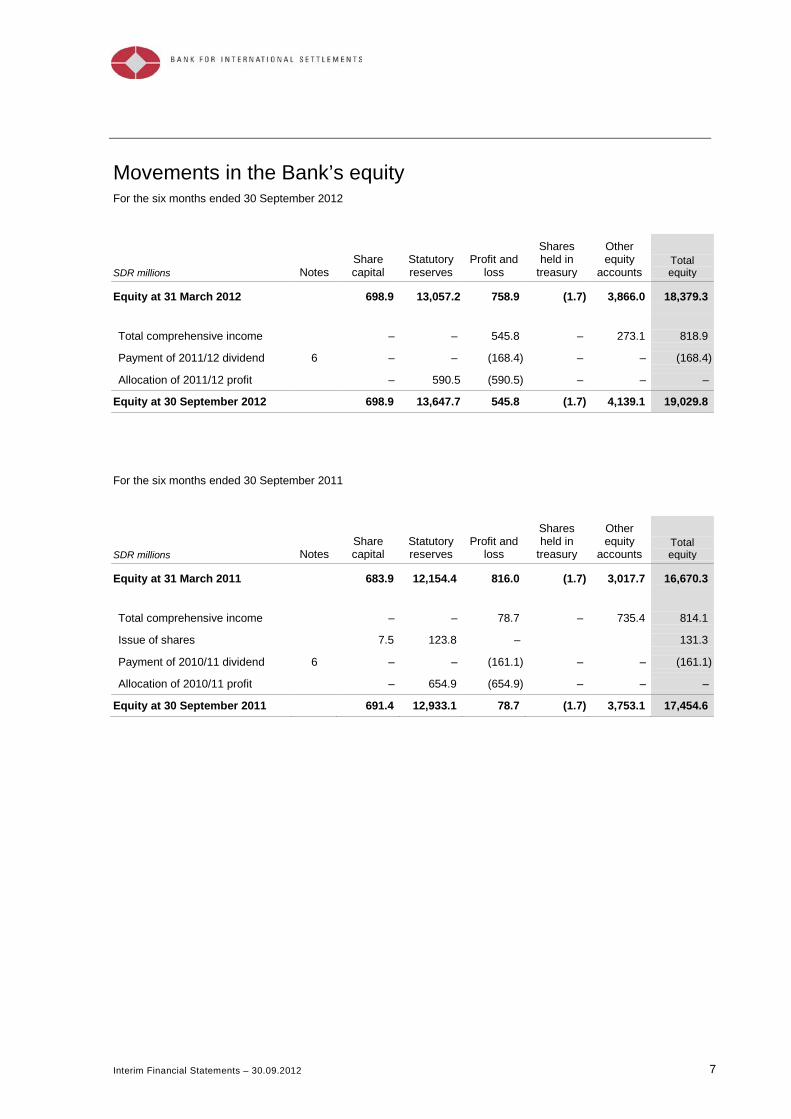
Movements in the Bank’s equity
For the six months ended 30 September 2012
SDR millions Notes Share capital
Statutory reserves
Profit and loss
Shares held in
treasury
Other equity
accounts Total equity
Equity at 31 March 2012 698.9 13,057.2 758.9 (1.7) 3,866.0 18,379.3 Total comprehensive income – – 545.8 – 273.1 818.9
Payment of 2011/12 dividend 6 – – (168.4) – – (168.4)
Allocation of 2011/12 profit – 590.5 (590.5) – – –
Equity at 30 September 2012 698.9 13,647.7 545.8 (1.7) 4,139.1 19,029.8
For the six months ended 30 September 2011
SDR millions Notes Share capital
Statutory reserves
Profit and loss
Shares held in
treasury
Other equity
accounts Total equity
Equity at 31 March 2011 683.9 12,154.4 816.0 (1.7) 3,017.7 16,670.3 Total comprehensive income – – 78.7 – 735.4 814.1
Issue of shares 7.5 123.8 – 131.3
Payment of 2010/11 dividend 6 – – (161.1) – – (161.1)
Allocation of 2010/11 profit – 654.9 (654.9) – – –
Equity at 30 September 2011 691.4 12,933.1 78.7 (1.7) 3,753.1 17,454.6
8 Interim Financial Statements – 30.09.2012
Notes to the financial statements
1. Accounting policies
The accounting policies adopted by the Bank for these interim financial statements are consistent with those described in the Bank’s 82nd Annual Report.
2. Use of estimates
The preparation of the financial statements requires the Bank’s Management to make some estimates in arriving at the reported amounts of assets and liabilities and disclosure of contingent assets and liabilities at the date of the financial statements, and the reported amounts of income and expenses during the financial year. To arrive at these estimates, Management uses available information, makes assumptions and exercises judgment.
Assumptions include forward-looking estimates, for example relating to the valuation of assets and liabilities, the assessment of post-employment benefit obligations and the assessment of provisions and contingent liabilities.
Judgment is exercised when selecting and applying the Bank’s accounting policies. The judgments relating to the designation and valuation of financial instruments are another key element in the preparation of these financial statements.
Subsequent actual results could differ materially from those estimates.
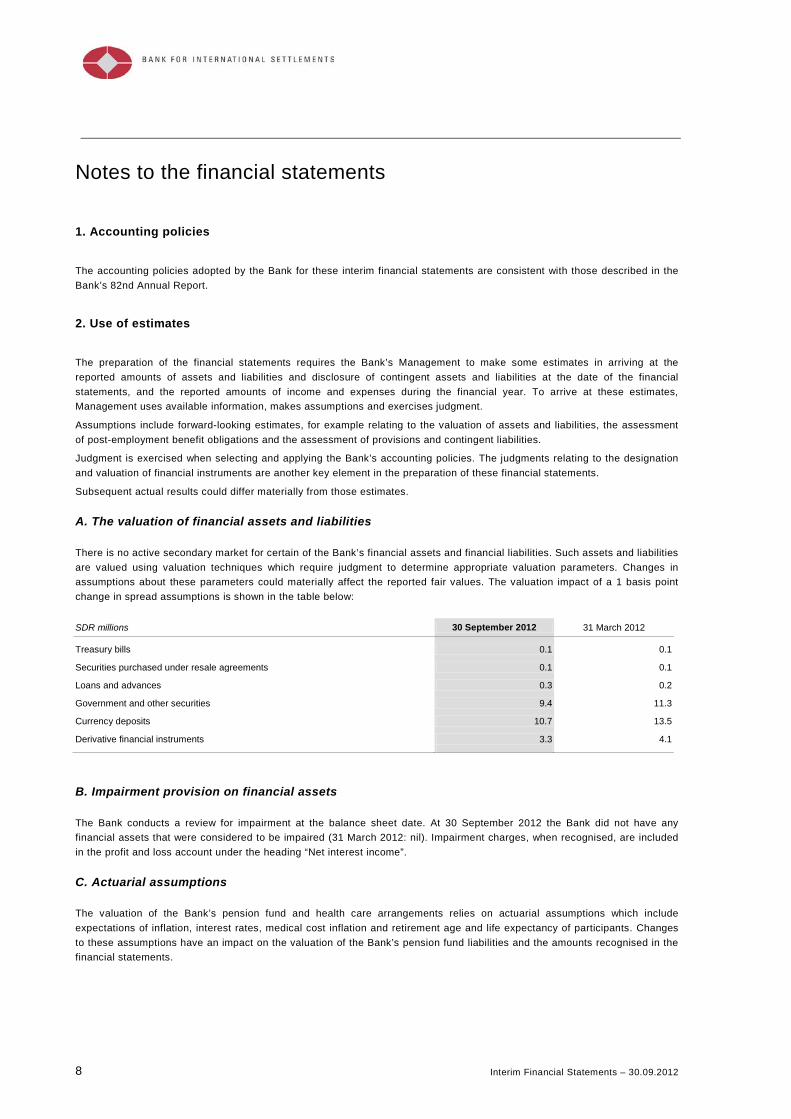
A. The valuation of financial assets and liabilities
There is no active secondary market for certain of the Bank’s financial assets and financial liabilities. Such assets and liabilities are valued using valuation techniques which require judgment to determine appropriate valuation parameters. Changes in assumptions about these parameters could materially affect the reported fair values. The valuation impact of a 1 basis point change in spread assumptions is shown in the table below: SDR millions 30 September 2012 31 March 2012
Treasury bills 0.1 0.1
Securities purchased under resale agreements 0.1 0.1
Loans and advances 0.3 0.2
Government and other securities 9.4 11.3
Currency deposits 10.7 13.5
Derivative financial instruments 3.3 4.1
B. Impairment provision on financial assets
The Bank conducts a review for impairment at the balance sheet date. At 30 September 2012 the Bank did not have any financial assets that were considered to be impaired (31 March 2012: nil). Impairment charges, when recognised, are included in the profit and loss account under the heading “Net interest income”.
C. Actuarial assumptions
The valuation of the Bank’s pension fund and health care arrangements relies on actuarial assumptions which include expectations of inflation, interest rates, medical cost inflation and retirement age and life expectancy of participants. Changes to these assumptions have an impact on the valuation of the Bank’s pension fund liabilities and the amounts recognised in the financial statements.

Interim Financial Statements – 30.09.2012 9
3. Currency assets
Currency assets comprise treasury bills, securities purchased under resale agreements, fixed-term loans and advances, and government and other securities.
Currency assets held at fair value through profit and loss comprise those currency banking assets that represent the reinvestment of currency deposit liabilities along with currency investment assets that are part of more actively traded portfolios. The remaining part of the Bank’s currency investment assets are categorised as available for sale and, together with the gold investment assets, largely represent the investment of the Bank’s equity.
The tables below analyse the Bank’s holdings of currency assets:
As at 30 September 2012 Banking
assets Investment assets Total currency
assets
SDR millions
Held at fair value through profit and loss
Available for sale
Held at fair value through profit and loss
Total
Treasury bills 48,328.5 – 122.7 122.7 48,451.2
Securities purchased under resale agreements 33,005.3 – – – 33,005.3
Fixed-term loans and advances 14,487.8 – – – 14,487.8
Government and other securities
Government 27,988.4 13,689.6 – 13,689.6 41,678.0
Financial institutions 12,789.3 142.1 714.3 856.4 13,645.7
Other 11,880.1 50.5 – 50.5 11,930.6
52,657.8 13,882.2 714.3 14,596.5 67,254.3
Total currency assets 148,479.4 13,882.2 837.0 14,719.2 163,198.6
As at 31 March 2012 Banking
assets Investment assets Total currency
assets
SDR millions
Held at fair value through profit and loss
Available for sale
Held at fair value through profit and loss
Total
Treasury bills 53,338.3 – 154.0 154.0 53,492.3
Securities purchased under resale agreements 46,210.8 – – – 46,210.8
Fixed-term loans and advances 22,570.5 – – – 22,570.5
Government and other securities
Government 35,885.9 13,181.9 130.9 13,312.8 49,198.7
Financial institutions 15,790.4 201.9 – 201.9 15,992.3
Other 12,099.9 94.8 492.0 586.8 12,686.7
63,776.2 13,478.6 622.9 14,101.5 77,877.7
Total currency assets 185,895.8 13,478.6 776.9 14,255.5 200,151.3
Note that the balance sheet heading “Loans and advances” comprises “Fixed-term loans and advances” and notice accounts. The tables above exclude notice accounts which totalled SDR 222.8 million at 30 September 2012 (31 March 2012: SDR 186.6 million).
10 Interim Financial Statements – 30.09.2012
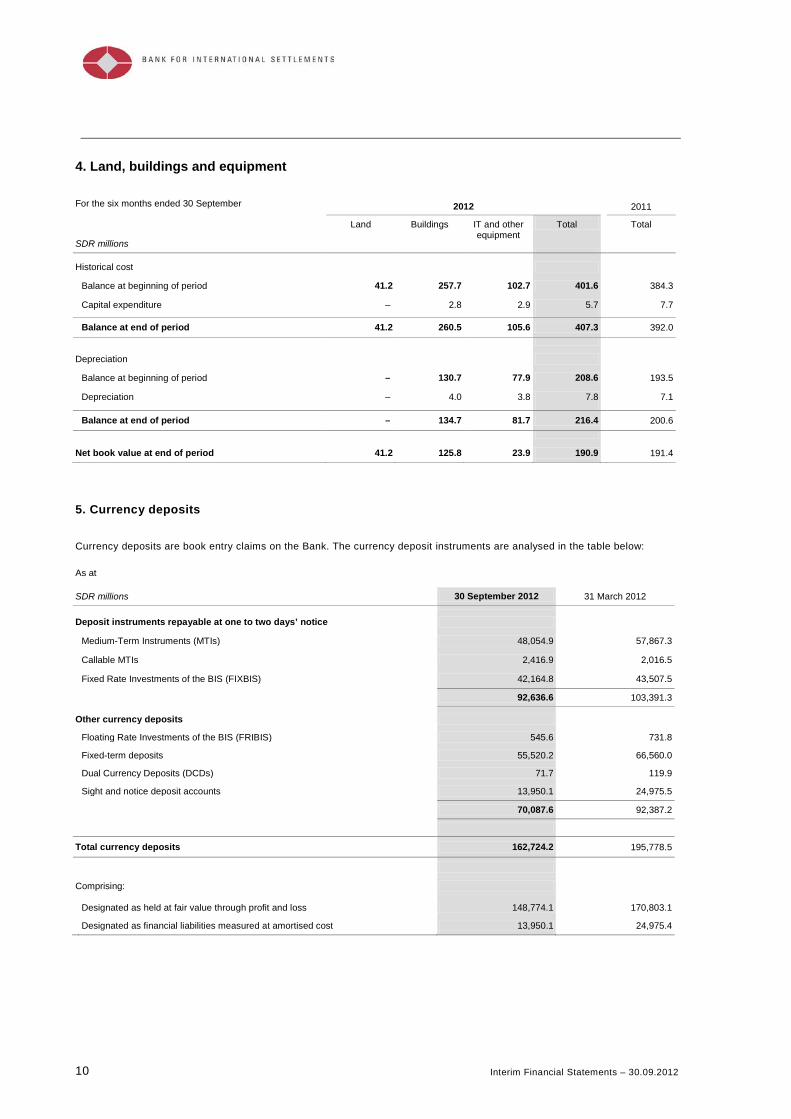
4. Land, buildings and equipment
For the six months ended 30 September 2012 2011
SDR millions
Land Buildings IT and other equipment
Total Total
Historical cost
Balance at beginning of period 41.2 257.7 102.7 401.6 384.3
Capital expenditure – 2.8 2.9 5.7 7.7
Balance at end of period 41.2 260.5 105.6 407.3 392.0
Depreciation
Balance at beginning of period – 130.7 77.9 208.6 193.5
Depreciation – 4.0 3.8 7.8 7.1
Balance at end of period – 134.7 81.7 216.4 200.6
Net book value at end of period 41.2 125.8 23.9 190.9 191.4
5. Currency deposits
Currency deposits are book entry claims on the Bank. The currency deposit instruments are analysed in the table below: As at
SDR millions 30 September 2012 31 March 2012 Deposit instruments repayable at one to two days’ notice
Medium-Term Instruments (MTIs) 48,054.9 57,867.3
Callable MTIs 2,416.9 2,016.5
Fixed Rate Investments of the BIS (FIXBIS) 42,164.8 43,507.5 92,636.6 103,391.3
Other currency deposits
Floating Rate Investments of the BIS (FRIBIS) 545.6 731.8
Fixed-term deposits 55,520.2 66,560.0
Dual Currency Deposits (DCDs) 71.7 119.9
Sight and notice deposit accounts 13,950.1 24,975.5 70,087.6 92,387.2
Total currency deposits 162,724.2 195,778.5
Comprising:
Designated as held at fair value through profit and loss 148,774.1 170,803.1 Designated as financial liabilities measured at amortised cost 13,950.1 24,975.4
Interim Financial Statements – 30.09.2012 11
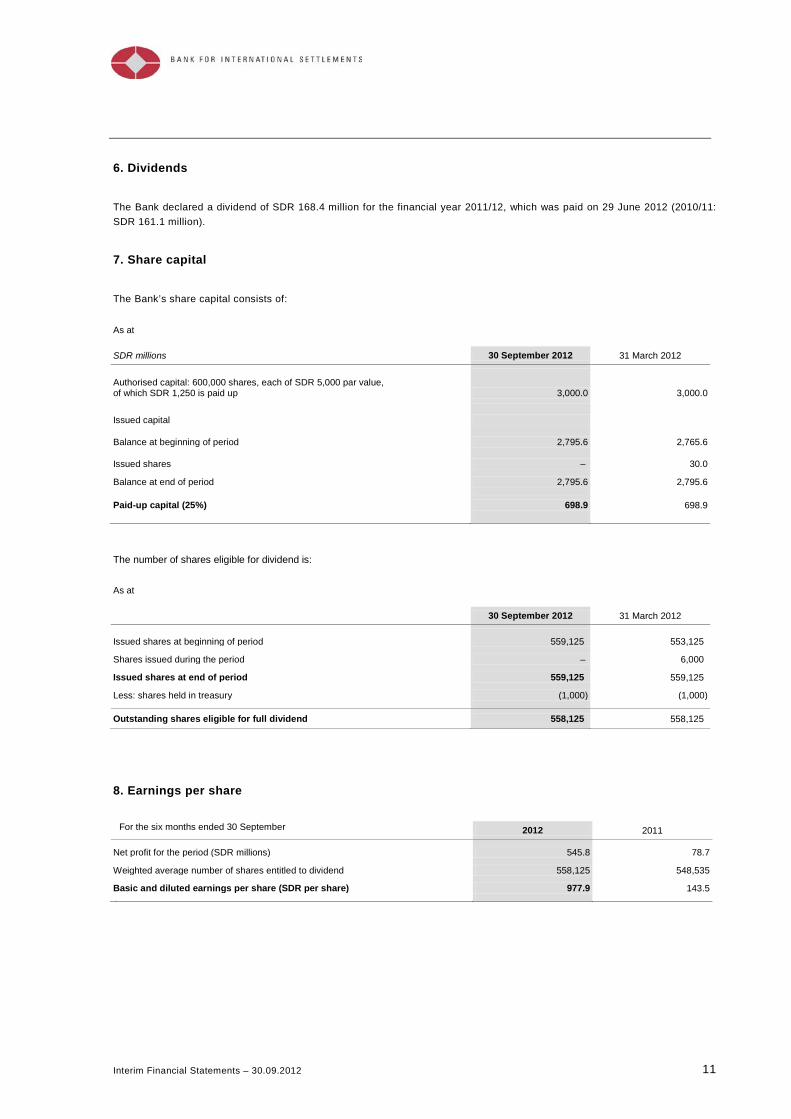
6. Dividends
The Bank declared a dividend of SDR 168.4 million for the financial year 2011/12, which was paid on 29 June 2012 (2010/11: SDR 161.1 million).
7. Share capital
The Bank’s share capital consists of:
As at
SDR millions 30 September 2012 31 March 2012 Authorised capital: 600,000 shares, each of SDR 5,000 par value, of which SDR 1,250 is paid up 3,000.0 3,000.0 Issued capital
Balance at beginning of period 2,795.6 2,765.6
Issued shares – 30.0
Balance at end of period 2,795.6 2,795.6 Paid-up capital (25%) 698.9 698.9 The number of shares eligible for dividend is:
As at
30 September 2012 31 March 2012 Issued shares at beginning of period 559,125 553,125
Shares issued during the period – 6,000
Issued shares at end of period 559,125 559,125
Less: shares held in treasury (1,000) (1,000) Outstanding shares eligible for full dividend 558,125 558,125
8. Earnings per share
For the six months ended 30 September 2012 2011
Net profit for the period (SDR millions) 545.8 78.7
Weighted average number of shares entitled to dividend 558,125 548,535
Basic and diluted earnings per share (SDR per share) 977.9 143.5
12 Interim Financial Statements – 30.09.2012
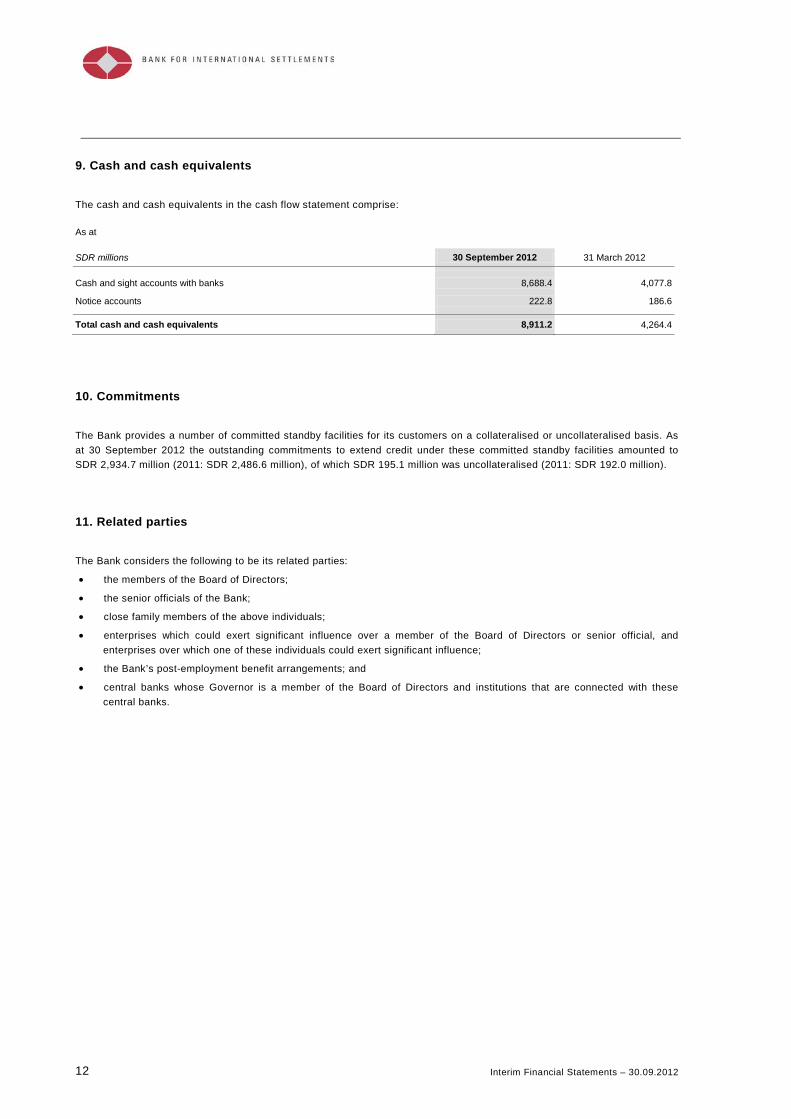
9. Cash and cash equivalents
The cash and cash equivalents in the cash flow statement comprise: As at
SDR millions 30 September 2012 31 March 2012 Cash and sight accounts with banks 8,688.4 4,077.8
Notice accounts 222.8 186.6 Total cash and cash equivalents 8,911.2 4,264.4
10. Commitments
The Bank provides a number of committed standby facilities for its customers on a collateralised or uncollateralised basis. As at 30 September 2012 the outstanding commitments to extend credit under these committed standby facilities amounted to SDR 2,934.7 million (2011: SDR 2,486.6 million), of which SDR 195.1 million was uncollateralised (2011: SDR 192.0 million).
11. Related parties
The Bank considers the following to be its related parties:
• the members of the Board of Directors;
• the senior officials of the Bank;
• close family members of the above individuals;
• enterprises which could exert significant influence over a member of the Board of Directors or senior official, and enterprises over which one of these individuals could exert significant influence;
• the Bank’s post-employment benefit arrangements; and
• central banks whose Governor is a member of the Board of Directors and institutions that are connected with these central banks.
Interim Financial Statements – 30.09.2012 13
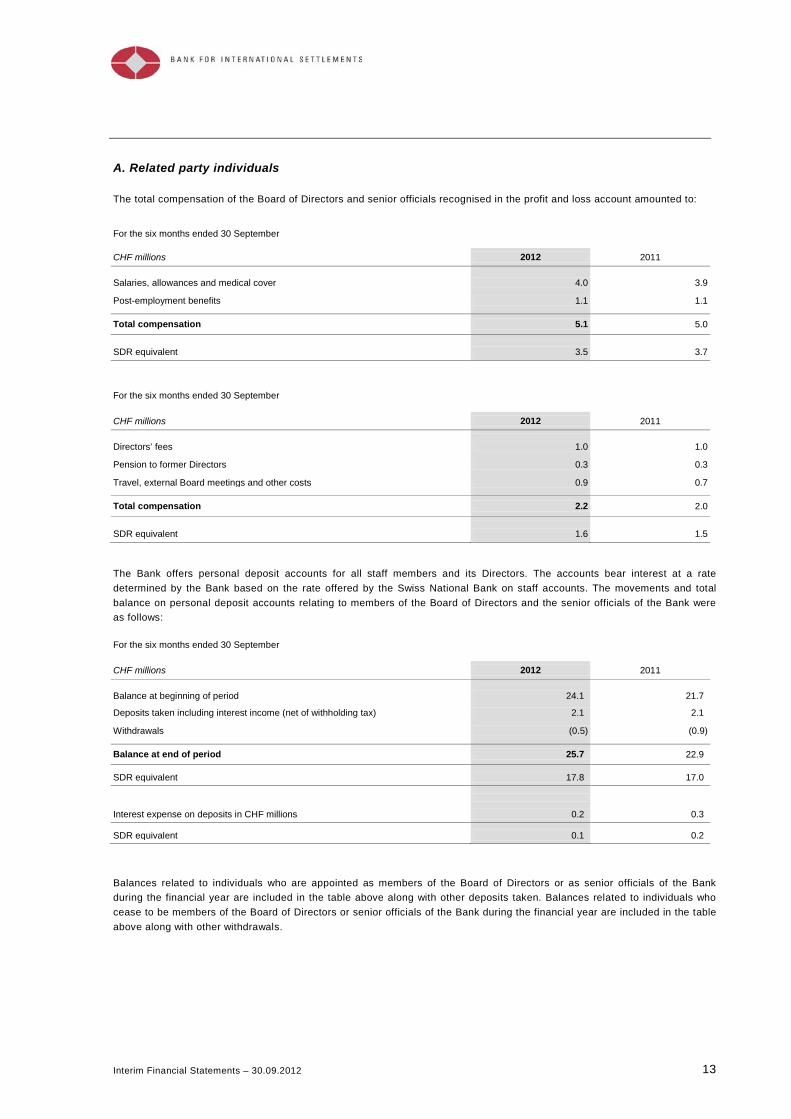
A. Related party individuals
The total compensation of the Board of Directors and senior officials recognised in the profit and loss account amounted to:
For the six months ended 30 September
CHF millions 2012 2011 Salaries, allowances and medical cover 4.0 3.9
Post-employment benefits 1.1 1.1 Total compensation 5.1 5.0 SDR equivalent 3.5 3.7 For the six months ended 30 September
CHF millions 2012 2011 Directors’ fees 1.0 1.0
Pension to former Directors 0.3 0.3
Travel, external Board meetings and other costs 0.9 0.7 Total compensation 2.2 2.0 SDR equivalent 1.6 1.5 The Bank offers personal deposit accounts for all staff members and its Directors. The accounts bear interest at a rate determined by the Bank based on the rate offered by the Swiss National Bank on staff accounts. The movements and total balance on personal deposit accounts relating to members of the Board of Directors and the senior officials of the Bank were as follows: For the six months ended 30 September
CHF millions 2012 2011 Balance at beginning of period 24.1 21.7
Deposits taken including interest income (net of withholding tax) 2.1 2.1
Withdrawals (0.5) (0.9) Balance at end of period 25.7 22.9
SDR equivalent 17.8 17.0 Interest expense on deposits in CHF millions 0.2 0.3 SDR equivalent 0.1 0.2 Balances related to individuals who are appointed as members of the Board of Directors or as senior officials of the Bank during the financial year are included in the table above along with other deposits taken. Balances related to individuals who cease to be members of the Board of Directors or senior officials of the Bank during the financial year are included in the table above along with other withdrawals.
14 Interim Financial Statements – 30.09.2012
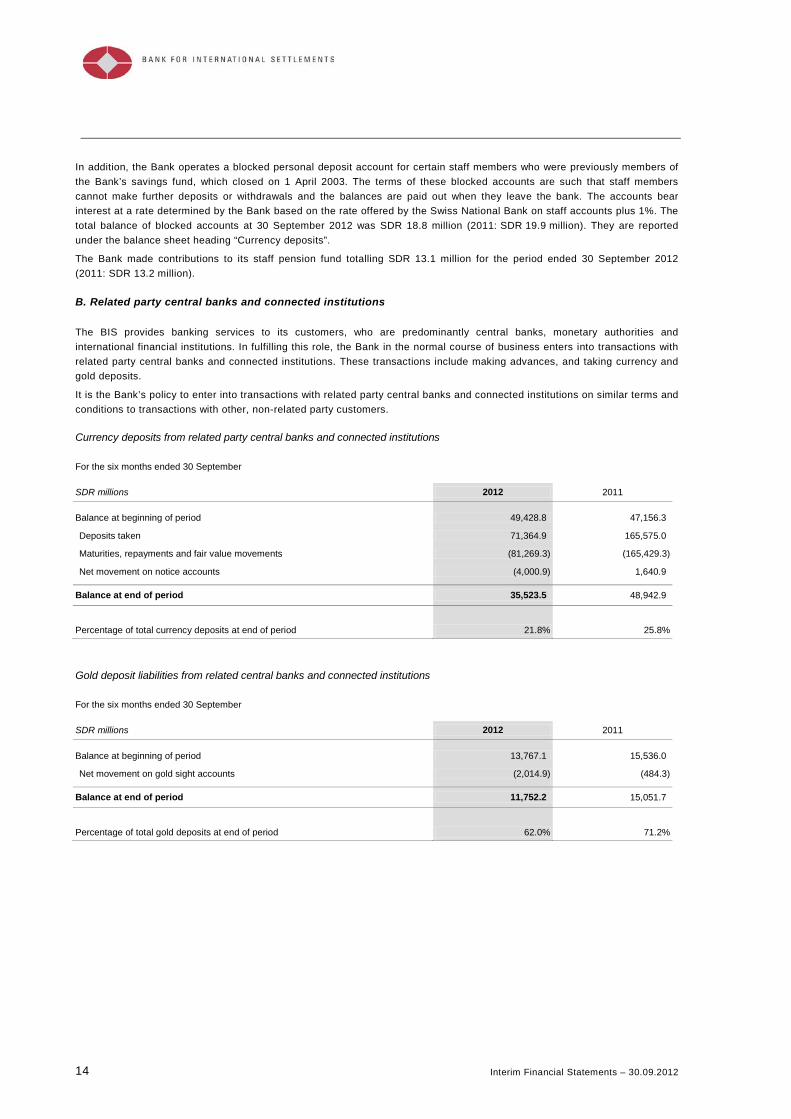
In addition, the Bank operates a blocked personal deposit account for certain staff members who were previously members of the Bank’s savings fund, which closed on 1 April 2003. The terms of these blocked accounts are such that staff members cannot make further deposits or withdrawals and the balances are paid out when they leave the bank. The accounts bear interest at a rate determined by the Bank based on the rate offered by the Swiss National Bank on staff accounts plus 1%. The total balance of blocked accounts at 30 September 2012 was SDR 18.8 million (2011: SDR 19.9 million). They are reported under the balance sheet heading “Currency deposits”.
The Bank made contributions to its staff pension fund totalling SDR 13.1 million for the period ended 30 September 2012 (2011: SDR 13.2 million).
B. Related party central banks and connected institutions
The BIS provides banking services to its customers, who are predominantly central banks, monetary authorities and international financial institutions. In fulfilling this role, the Bank in the normal course of business enters into transactions with related party central banks and connected institutions. These transactions include making advances, and taking currency and gold deposits.
It is the Bank’s policy to enter into transactions with related party central banks and connected institutions on similar terms and conditions to transactions with other, non-related party customers. Currency deposits from related party central banks and connected institutions
For the six months ended 30 September
SDR millions 2012 2011 Balance at beginning of period 49,428.8 47,156.3
Deposits taken 71,364.9 165,575.0
Maturities, repayments and fair value movements (81,269.3) (165,429.3)
Net movement on notice accounts (4,000.9) 1,640.9 Balance at end of period 35,523.5 48,942.9
Percentage of total currency deposits at end of period 21.8% 25.8% Gold deposit liabilities from related central banks and connected institutions
For the six months ended 30 September
SDR millions 2012 2011 Balance at beginning of period 13,767.1 15,536.0
Net movement on gold sight accounts (2,014.9) (484.3) Balance at end of period 11,752.2 15,051.7
Percentage of total gold deposits at end of period 62.0% 71.2%
Interim Financial Statements – 30.09.2012 15
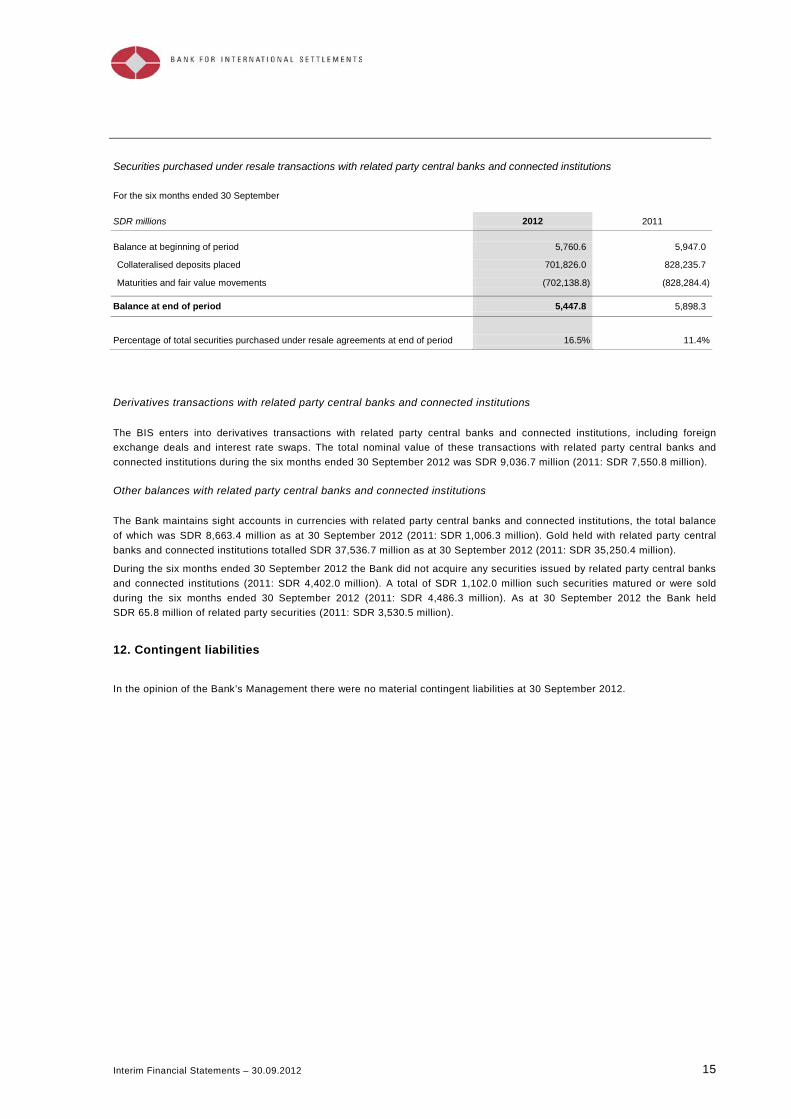
Securities purchased under resale transactions with related party central banks and connected institutions
For the six months ended 30 September
SDR millions 2012 2011 Balance at beginning of period 5,760.6 5,947.0
Collateralised deposits placed 701,826.0 828,235.7
Maturities and fair value movements (702,138.8) (828,284.4) Balance at end of period 5,447.8 5,898.3
Percentage of total securities purchased under resale agreements at end of period 16.5% 11.4%
Derivatives transactions with related party central banks and connected institutions
The BIS enters into derivatives transactions with related party central banks and connected institutions, including foreign exchange deals and interest rate swaps. The total nominal value of these transactions with related party central banks and connected institutions during the six months ended 30 September 2012 was SDR 9,036.7 million (2011: SDR 7,550.8 million).
Other balances with related party central banks and connected institutions
The Bank maintains sight accounts in currencies with related party central banks and connected institutions, the total balance of which was SDR 8,663.4 million as at 30 September 2012 (2011: SDR 1,006.3 million). Gold held with related party central banks and connected institutions totalled SDR 37,536.7 million as at 30 September 2012 (2011: SDR 35,250.4 million).
During the six months ended 30 September 2012 the Bank did not acquire any securities issued by related party central banks and connected institutions (2011: SDR 4,402.0 million). A total of SDR 1,102.0 million such securities matured or were sold during the six months ended 30 September 2012 (2011: SDR 4,486.3 million). As at 30 September 2012 the Bank held SDR 65.8 million of related party securities (2011: SDR 3,530.5 million).
12. Contingent liabilities
In the opinion of the Bank’s Management there were no material contingent liabilities at 30 September 2012.
16 Interim Financial Statements – 30.09.2012
Capital adequacy
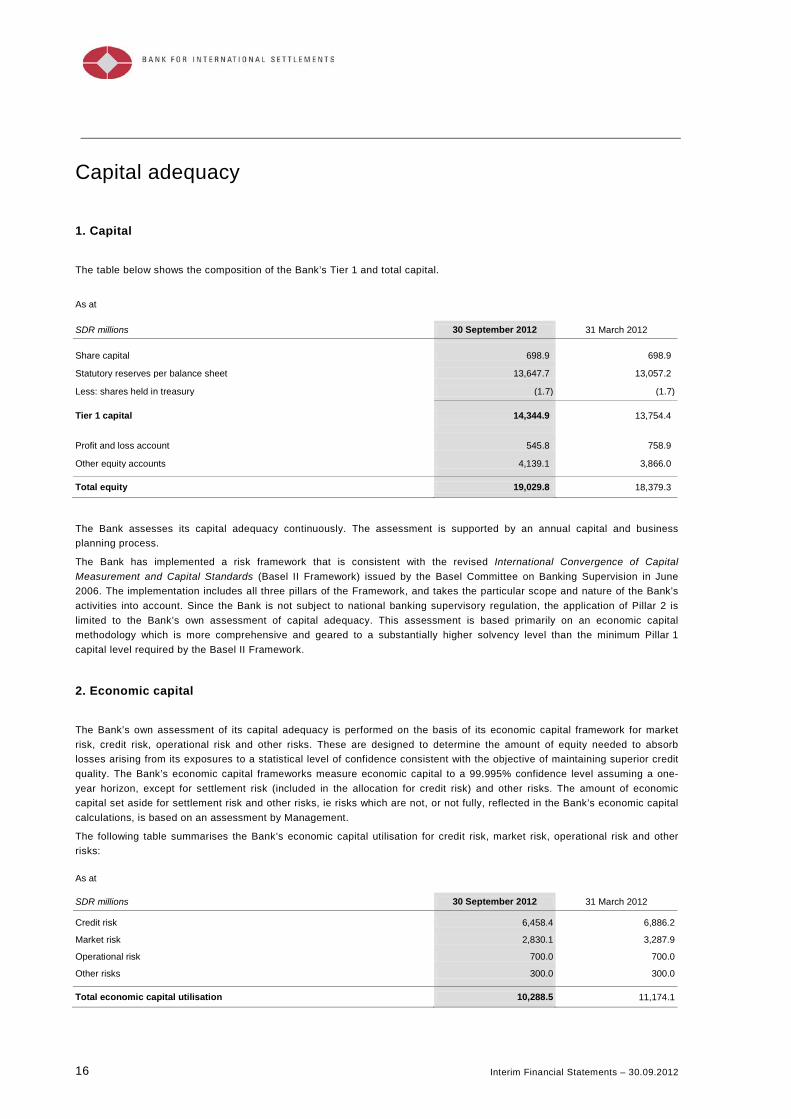
1. Capital
The table below shows the composition of the Bank’s Tier 1 and total capital.
As at
SDR millions 30 September 2012 31 March 2012 Share capital 698.9 698.9
Statutory reserves per balance sheet 13,647.7 13,057.2
Less: shares held in treasury (1.7) (1.7) Tier 1 capital 14,344.9 13,754.4 Profit and loss account 545.8 758.9
Other equity accounts 4,139.1 3,866.0 Total equity 19,029.8 18,379.3 The Bank assesses its capital adequacy continuously. The assessment is supported by an annual capital and business planning process.
The Bank has implemented a risk framework that is consistent with the revised International Convergence of Capital Measurement and Capital Standards (Basel II Framework) issued by the Basel Committee on Banking Supervision in June 2006. The implementation includes all three pillars of the Framework, and takes the particular scope and nature of the Bank’s activities into account. Since the Bank is not subject to national banking supervisory regulation, the application of Pillar 2 is limited to the Bank’s own assessment of capital adequacy. This assessment is based primarily on an economic capital methodology which is more comprehensive and geared to a substantially higher solvency level than the minimum Pillar 1 capital level required by the Basel II Framework.
2. Economic capital
The Bank’s own assessment of its capital adequacy is performed on the basis of its economic capital framework for market risk, credit risk, operational risk and other risks. These are designed to determine the amount of equity needed to absorb losses arising from its exposures to a statistical level of confidence consistent with the objective of maintaining superior credit quality. The Bank’s economic capital frameworks measure economic capital to a 99.995% confidence level assuming a one-year horizon, except for settlement risk (included in the allocation for credit risk) and other risks. The amount of economic capital set aside for settlement risk and other risks, ie risks which are not, or not fully, reflected in the Bank’s economic capital calculations, is based on an assessment by Management.
The following table summarises the Bank’s economic capital utilisation for credit risk, market risk, operational risk and other risks: As at
SDR millions 30 September 2012 31 March 2012
Credit risk 6,458.4 6,886.2
Market risk 2,830.1 3,287.9
Operational risk 700.0 700.0
Other risks 300.0 300.0 Total economic capital utilisation 10,288.5 11,174.1
Interim Financial Statements – 30.09.2012 17
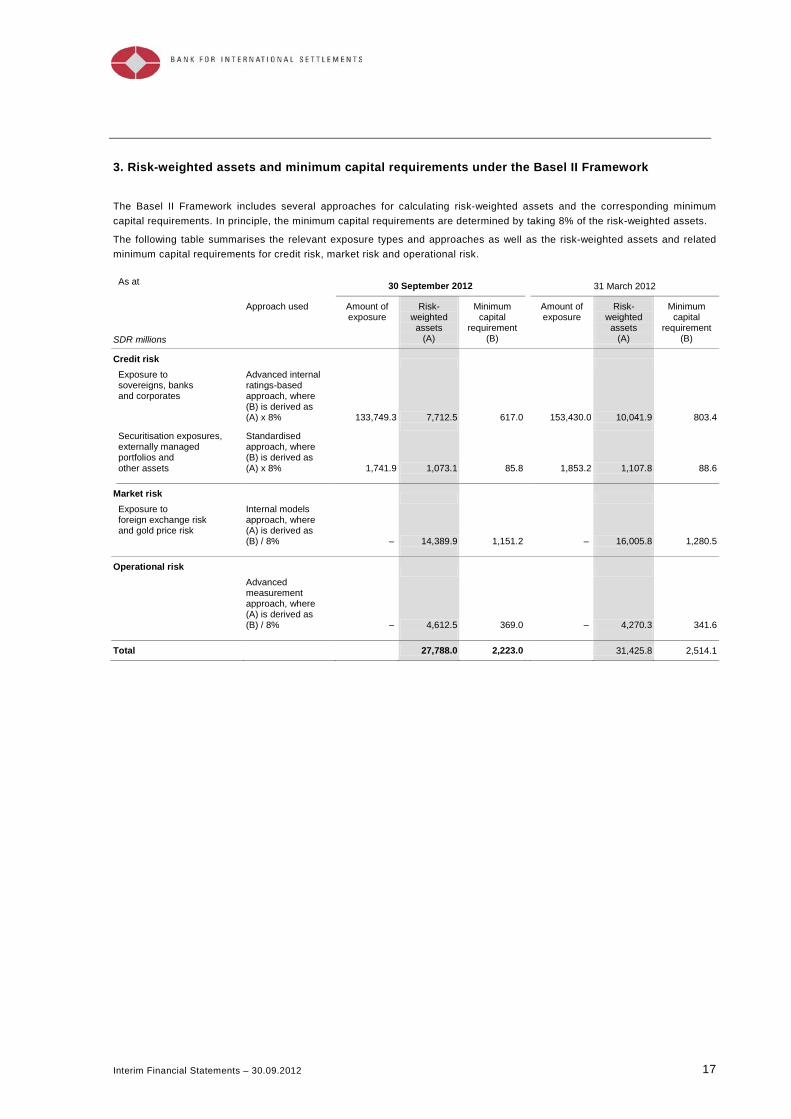
3. Risk-weighted assets and minimum capital requirements under the Basel II Framework
The Basel II Framework includes several approaches for calculating risk-weighted assets and the corresponding minimum capital requirements. In principle, the minimum capital requirements are determined by taking 8% of the risk-weighted assets.
The following table summarises the relevant exposure types and approaches as well as the risk-weighted assets and related minimum capital requirements for credit risk, market risk and operational risk. As at 30 September 2012 31 March 2012
SDR millions
Approach used Amount of exposure
Risk-weighted assets
(A)
Minimum capital
requirement (B)
Amount of exposure
Risk-weighted assets
(A)
Minimum capital
requirement (B)
Credit risk
Exposure to sovereigns, banks and corporates
Advanced internal ratings-based approach, where (B) is derived as (A) x 8% 133,749.3 7,712.5 617.0 153,430.0 10,041.9 803.4
Securitisation exposures, externally managed portfolios and other assets
Standardised approach, where (B) is derived as (A) x 8% 1,741.9 1,073.1 85.8 1,853.2 1,107.8 88.6
Market risk
Exposure to foreign exchange risk and gold price risk
Internal models approach, where (A) is derived as (B) / 8% – 14,389.9 1,151.2 – 16,005.8 1,280.5
Operational risk
Advanced measurement approach, where (A) is derived as (B) / 8% – 4,612.5 369.0 – 4,270.3 341.6
Total 27,788.0 2,223.0 31,425.8 2,514.1
18 Interim Financial Statements – 30.09.2012
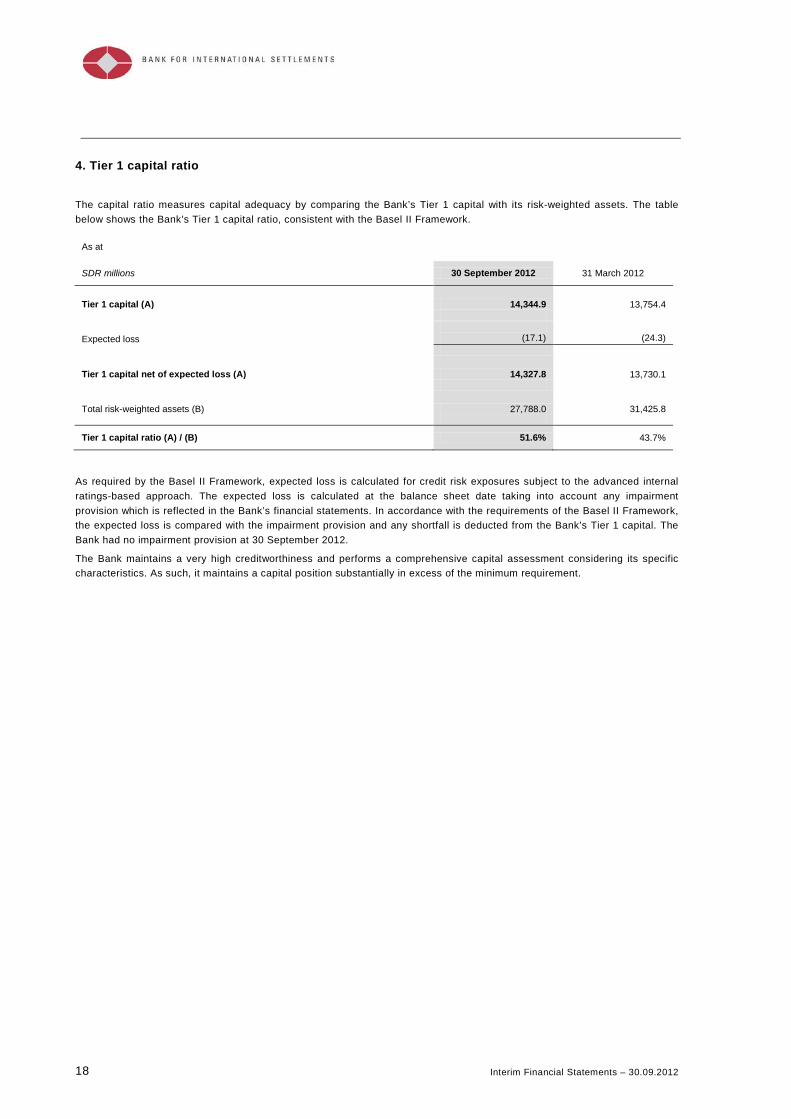
4. Tier 1 capital ratio
The capital ratio measures capital adequacy by comparing the Bank’s Tier 1 capital with its risk-weighted assets. The table below shows the Bank’s Tier 1 capital ratio, consistent with the Basel II Framework.
As at
SDR millions 30 September 2012 31 March 2012
Tier 1 capital (A) 14,344.9 13,754.4
Expected loss
(17.1)
(24.3)
Tier 1 capital net of expected loss (A) 14,327.8 13,730.1
Total risk-weighted assets (B) 27,788.0 31,425.8
Tier 1 capital ratio (A) / (B) 51.6% 43.7%
As required by the Basel II Framework, expected loss is calculated for credit risk exposures subject to the advanced internal ratings-based approach. The expected loss is calculated at the balance sheet date taking into account any impairment provision which is reflected in the Bank’s financial statements. In accordance with the requirements of the Basel II Framework, the expected loss is compared with the impairment provision and any shortfall is deducted from the Bank’s Tier 1 capital. The Bank had no impairment provision at 30 September 2012.
The Bank maintains a very high creditworthiness and performs a comprehensive capital assessment considering its specific characteristics. As such, it maintains a capital position substantially in excess of the minimum requirement.
Interim Financial Statements – 30.09.2012 19
Risk management
The Bank supports its customers, predominantly central banks, monetary authorities and international financial institutions, in the management of their reserves and related financial activities.
Banking activities form an essential element of meeting the Bank’s objectives and ensure its financial strength and independence. The BIS engages in banking activities that are customer-related as well as activities that are related to the investment of its equity, each of which may give rise to financial risk comprising credit risk, market risk and liquidity risk. The Bank is also exposed to operational risk.
Within the risk framework defined by the Board of Directors, the Management of the Bank has established risk management policies designed to ensure that risks are identified, appropriately measured and controlled as well as monitored and reported.
1. Credit risk
Credit risk arises because a counterparty may fail to meet its obligations in accordance with the agreed contractual terms and conditions. A financial asset is considered past due when a counterparty fails to make a payment on the contractual due date.
The Bank manages credit risk within a framework and policies set by the Board of Directors and Management. These are complemented by more detailed guidelines and procedures at the level of the independent risk control function. The following tables show the exposure of the Bank to default risk, without taking into account any collateral held or other credit enhancements available to the Bank. Credit risk is further mitigated through the use of collateral and legally enforceable netting or setoff agreements. The corresponding assets and liabilities are not offset on the balance sheet.
The exposures set out in the tables below are based on the carrying value of the assets on the balance sheet as categorised by asset class and issuer type, geographical region and credit quality. The carrying value is the fair value of the financial instruments, including derivatives, except in the case of very short-term financial instruments (sight and notice accounts) and gold, which are shown at amortised cost net of any impairment charge. Commitments are reported at their notional amounts. Gold and gold loans exclude gold bar assets held in custody, and accounts receivable do not include unsettled liability issues, because these items do not represent credit exposures of the Bank.
The vast majority of the Bank’s assets are invested in securities issued by G10 governments and financial institutions rated A– or above by at least one of the major external credit assessment institutions. Limitations on the number of high-quality counterparties in these sectors mean that the Bank is exposed to single-name concentration risk. As at 30 September 2012, no financial assets were considered past due (31 March 2012: nil).
20 Interim Financial Statements – 30.09.2012
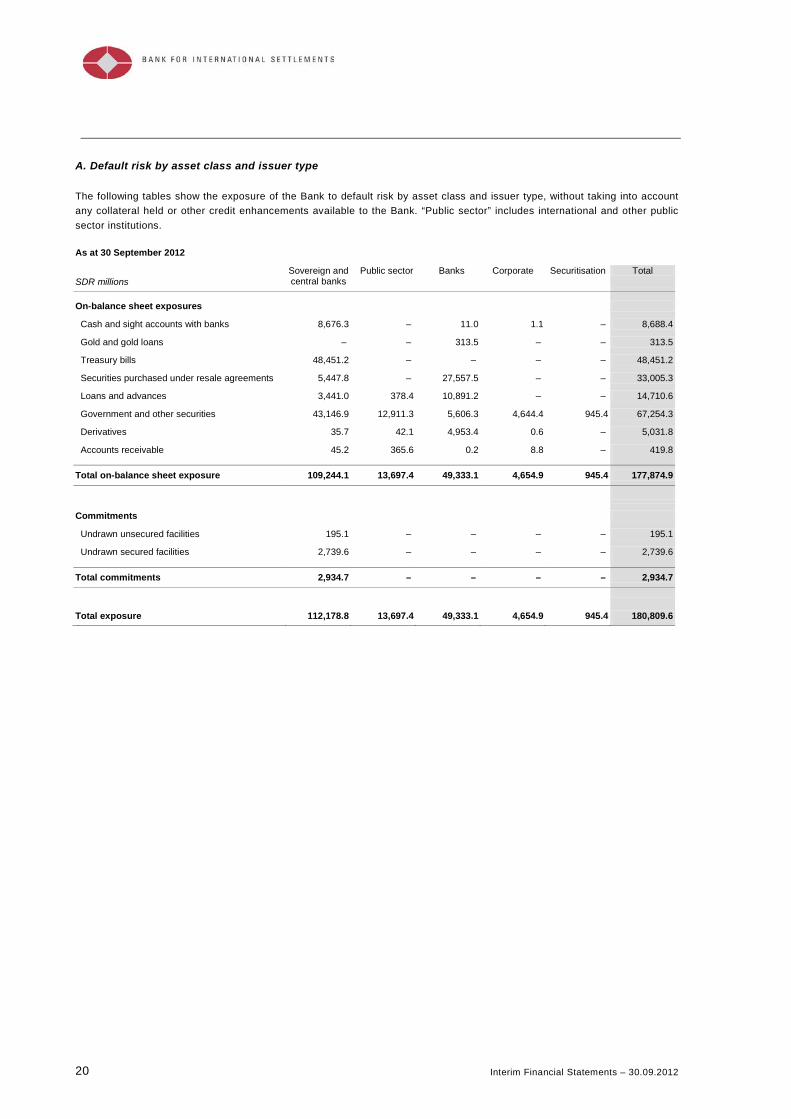
A. Default risk by asset class and issuer type
The following tables show the exposure of the Bank to default risk by asset class and issuer type, without taking into account any collateral held or other credit enhancements available to the Bank. “Public sector” includes international and other public sector institutions. As at 30 September 2012
SDR millions Sovereign and central banks
Public sector Banks Corporate Securitisation Total
On-balance sheet exposures
Cash and sight accounts with banks 8,676.3 – 11.0 1.1 – 8,688.4
Gold and gold loans – – 313.5 – – 313.5
Treasury bills 48,451.2 – – – – 48,451.2
Securities purchased under resale agreements 5,447.8 – 27,557.5 – – 33,005.3
Loans and advances 3,441.0 378.4 10,891.2 – – 14,710.6
Government and other securities 43,146.9 12,911.3 5,606.3 4,644.4 945.4 67,254.3
Derivatives 35.7 42.1 4,953.4 0.6 – 5,031.8
Accounts receivable 45.2 365.6 0.2 8.8 – 419.8 Total on-balance sheet exposure 109,244.1 13,697.4 49,333.1 4,654.9 945.4 177,874.9
Commitments
Undrawn unsecured facilities 195.1 – – – – 195.1
Undrawn secured facilities 2,739.6 – – – – 2,739.6 Total commitments 2,934.7 – – – – 2,934.7
Total exposure 112,178.8 13,697.4 49,333.1 4,654.9 945.4 180,809.6

Interim Financial Statements – 30.09.2012 21
As at 31 March 2012
SDR millions Sovereign and central banks
Public sector Banks Corporate Securitisation Total
On-balance sheet exposures
Cash and sight accounts with banks 4,064.5 – 11.9 1.4 – 4,077.8
Gold and gold loans – – 1,096.5 – – 1,096.5
Treasury bills 53,492.3 – – – – 53,492.3
Securities purchased under resale agreements 5,760.6 – 40,450.2 – – 46,210.8
Loans and advances 4,520.6 391.6 17,844.9 – – 22,757.1
Government and other securities 49,198.7 15,588.9 7,617.7 4,467.4 1,005.0 77,877.7
Derivatives 49.1 139.8 7,114.6 0.4 – 7,303.9
Accounts receivable 10.0 337.5 20.6 9.6 – 377.7 Total on-balance sheet exposure 117,095.8 16,457.8 74,156.4 4,478.8 1,005.0 213,193.8
Commitments
Undrawn unsecured facilities 193.8 – – – – 193.8
Undrawn secured facilities 2,376.8 – – – – 2,376.8 Total commitments 2,570.6 – – – – 2,570.6
Total exposure 119,666.4 16,457.8 74,156.4 4,478.8 1,005.0 215,764.4
22 Interim Financial Statements – 30.09.2012
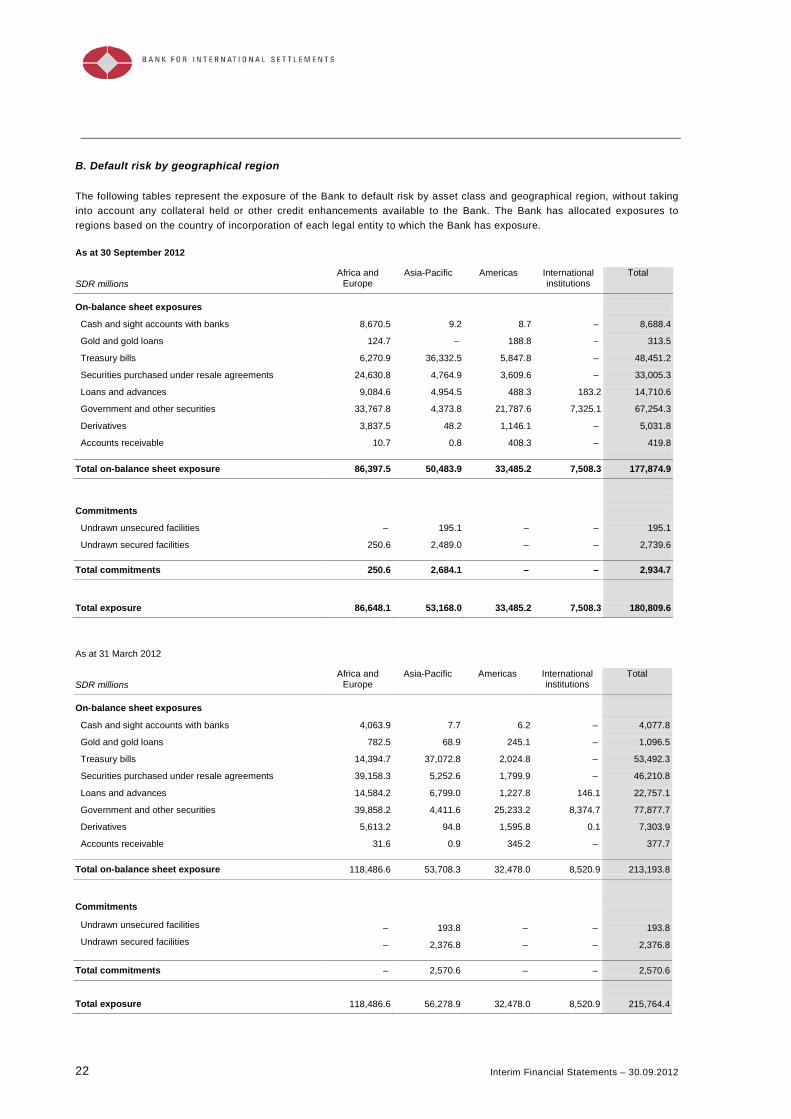
B. Default risk by geographical region
The following tables represent the exposure of the Bank to default risk by asset class and geographical region, without taking into account any collateral held or other credit enhancements available to the Bank. The Bank has allocated exposures to regions based on the country of incorporation of each legal entity to which the Bank has exposure. As at 30 September 2012
SDR millions Africa and
Europe Asia-Pacific Americas International
institutions Total
On-balance sheet exposures
Cash and sight accounts with banks 8,670.5 9.2 8.7 – 8,688.4
Gold and gold loans 124.7 – 188.8 – 313.5
Treasury bills 6,270.9 36,332.5 5,847.8 – 48,451.2
Securities purchased under resale agreements 24,630.8 4,764.9 3,609.6 – 33,005.3
Loans and advances 9,084.6 4,954.5 488.3 183.2 14,710.6
Government and other securities 33,767.8 4,373.8 21,787.6 7,325.1 67,254.3
Derivatives 3,837.5 48.2 1,146.1 – 5,031.8
Accounts receivable 10.7 0.8 408.3 – 419.8 Total on-balance sheet exposure 86,397.5 50,483.9 33,485.2 7,508.3 177,874.9
Commitments
Undrawn unsecured facilities – 195.1 – – 195.1
Undrawn secured facilities 250.6 2,489.0 – – 2,739.6 Total commitments 250.6 2,684.1 – – 2,934.7
Total exposure 86,648.1 53,168.0 33,485.2 7,508.3 180,809.6 As at 31 March 2012
SDR millions Africa and
Europe Asia-Pacific Americas International
institutions Total
On-balance sheet exposures
Cash and sight accounts with banks 4,063.9 7.7 6.2 – 4,077.8
Gold and gold loans 782.5 68.9 245.1 – 1,096.5
Treasury bills 14,394.7 37,072.8 2,024.8 – 53,492.3
Securities purchased under resale agreements 39,158.3 5,252.6 1,799.9 – 46,210.8
Loans and advances 14,584.2 6,799.0 1,227.8 146.1 22,757.1
Government and other securities 39,858.2 4,411.6 25,233.2 8,374.7 77,877.7
Derivatives 5,613.2 94.8 1,595.8 0.1 7,303.9
Accounts receivable 31.6 0.9 345.2 – 377.7 Total on-balance sheet exposure 118,486.6 53,708.3 32,478.0 8,520.9 213,193.8
Commitments Undrawn unsecured facilities – 193.8 – – 193.8 Undrawn secured facilities – 2,376.8 – – 2,376.8 Total commitments – 2,570.6 – – 2,570.6
Total exposure 118,486.6 56,278.9 32,478.0 8,520.9 215,764.4
Interim Financial Statements – 30.09.2012 23
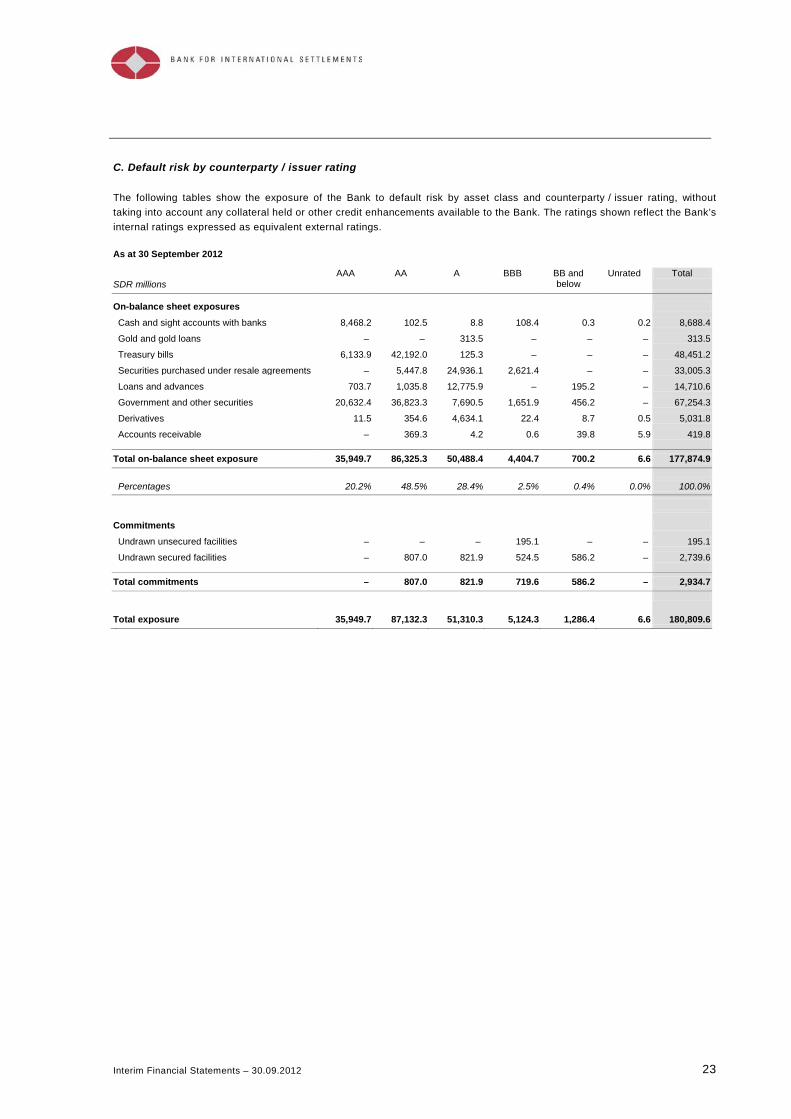
C. Default risk by counterparty / issuer rating
The following tables show the exposure of the Bank to default risk by asset class and counterparty / issuer rating, without taking into account any collateral held or other credit enhancements available to the Bank. The ratings shown reflect the Bank’s internal ratings expressed as equivalent external ratings. As at 30 September 2012
SDR millions AAA AA A BBB BB and
below Unrated Total
On-balance sheet exposures
Cash and sight accounts with banks 8,468.2 102.5 8.8 108.4 0.3 0.2 8,688.4
Gold and gold loans – – 313.5 – – – 313.5
Treasury bills 6,133.9 42,192.0 125.3 – – – 48,451.2
Securities purchased under resale agreements – 5,447.8 24,936.1 2,621.4 – – 33,005.3
Loans and advances 703.7 1,035.8 12,775.9 – 195.2 – 14,710.6
Government and other securities 20,632.4 36,823.3 7,690.5 1,651.9 456.2 – 67,254.3
Derivatives 11.5 354.6 4,634.1 22.4 8.7 0.5 5,031.8
Accounts receivable – 369.3 4.2 0.6 39.8 5.9 419.8 Total on-balance sheet exposure 35,949.7 86,325.3 50,488.4 4,404.7 700.2 6.6 177,874.9 Percentages 20.2% 48.5% 28.4% 2.5% 0.4% 0.0% 100.0%
Commitments
Undrawn unsecured facilities – – – 195.1 – – 195.1
Undrawn secured facilities – 807.0 821.9 524.5 586.2 – 2,739.6 Total commitments – 807.0 821.9 719.6 586.2 – 2,934.7
Total exposure 35,949.7 87,132.3 51,310.3 5,124.3 1,286.4 6.6 180,809.6
24 Interim Financial Statements – 30.09.2012
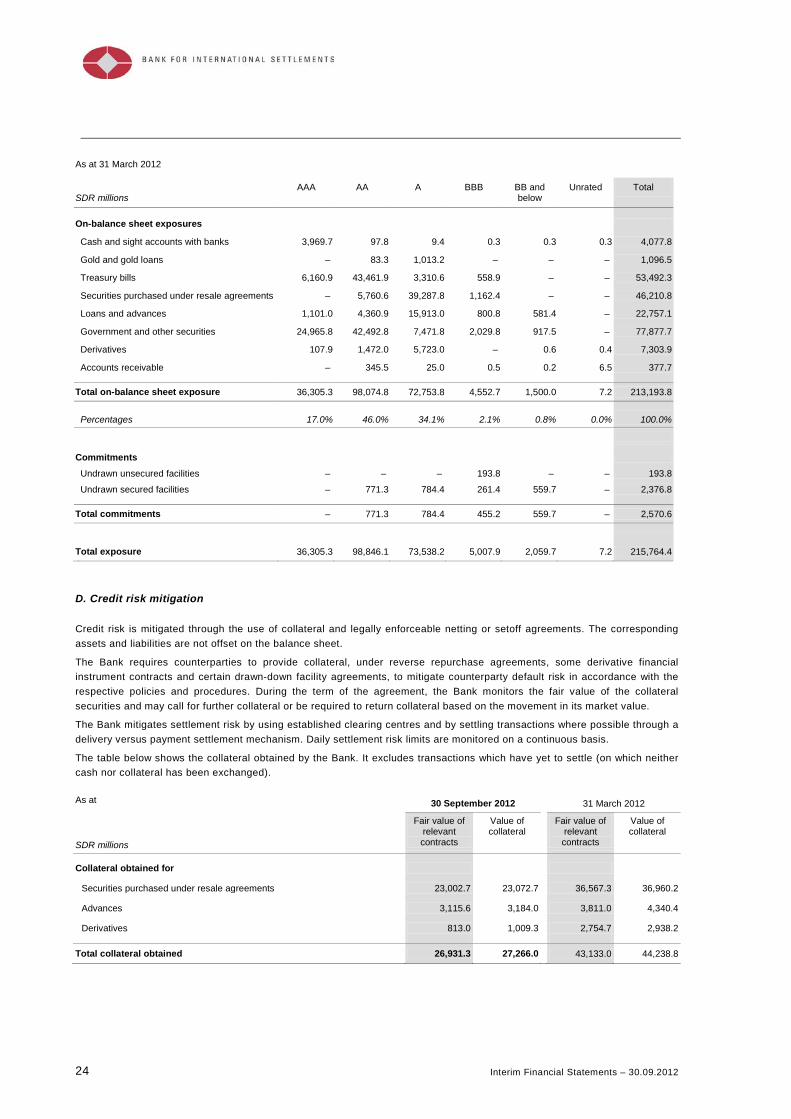
As at 31 March 2012
SDR millions AAA AA A BBB BB and
below Unrated Total
On-balance sheet exposures
Cash and sight accounts with banks 3,969.7 97.8 9.4 0.3 0.3 0.3 4,077.8
Gold and gold loans – 83.3 1,013.2 – – – 1,096.5
Treasury bills 6,160.9 43,461.9 3,310.6 558.9 – – 53,492.3
Securities purchased under resale agreements – 5,760.6 39,287.8 1,162.4 – – 46,210.8
Loans and advances 1,101.0 4,360.9 15,913.0 800.8 581.4 – 22,757.1
Government and other securities 24,965.8 42,492.8 7,471.8 2,029.8 917.5 – 77,877.7
Derivatives 107.9 1,472.0 5,723.0 – 0.6 0.4 7,303.9
Accounts receivable – 345.5 25.0 0.5 0.2 6.5 377.7 Total on-balance sheet exposure 36,305.3 98,074.8 72,753.8 4,552.7 1,500.0 7.2 213,193.8 Percentages 17.0% 46.0% 34.1% 2.1% 0.8% 0.0% 100.0%
Commitments
Undrawn unsecured facilities – – – 193.8 – – 193.8
Undrawn secured facilities – 771.3 784.4 261.4 559.7 – 2,376.8 Total commitments – 771.3 784.4 455.2 559.7 – 2,570.6
Total exposure 36,305.3 98,846.1 73,538.2 5,007.9 2,059.7 7.2 215,764.4
D. Credit risk mitigation
Credit risk is mitigated through the use of collateral and legally enforceable netting or setoff agreements. The corresponding assets and liabilities are not offset on the balance sheet.
The Bank requires counterparties to provide collateral, under reverse repurchase agreements, some derivative financial instrument contracts and certain drawn-down facility agreements, to mitigate counterparty default risk in accordance with the respective policies and procedures. During the term of the agreement, the Bank monitors the fair value of the collateral securities and may call for further collateral or be required to return collateral based on the movement in its market value.
The Bank mitigates settlement risk by using established clearing centres and by settling transactions where possible through a delivery versus payment settlement mechanism. Daily settlement risk limits are monitored on a continuous basis.
The table below shows the collateral obtained by the Bank. It excludes transactions which have yet to settle (on which neither cash nor collateral has been exchanged). As at 30 September 2012 31 March 2012
SDR millions
Fair value of relevant contracts
Value of collateral
Fair value of relevant contracts
Value of collateral
Collateral obtained for
Securities purchased under resale agreements 23,002.7 23,072.7 36,567.3 36,960.2
Advances 3,115.6 3,184.0 3,811.0 4,340.4
Derivatives 813.0 1,009.3 2,754.7 2,938.2 Total collateral obtained 26,931.3 27,266.0 43,133.0 44,238.8
Interim Financial Statements – 30.09.2012 25
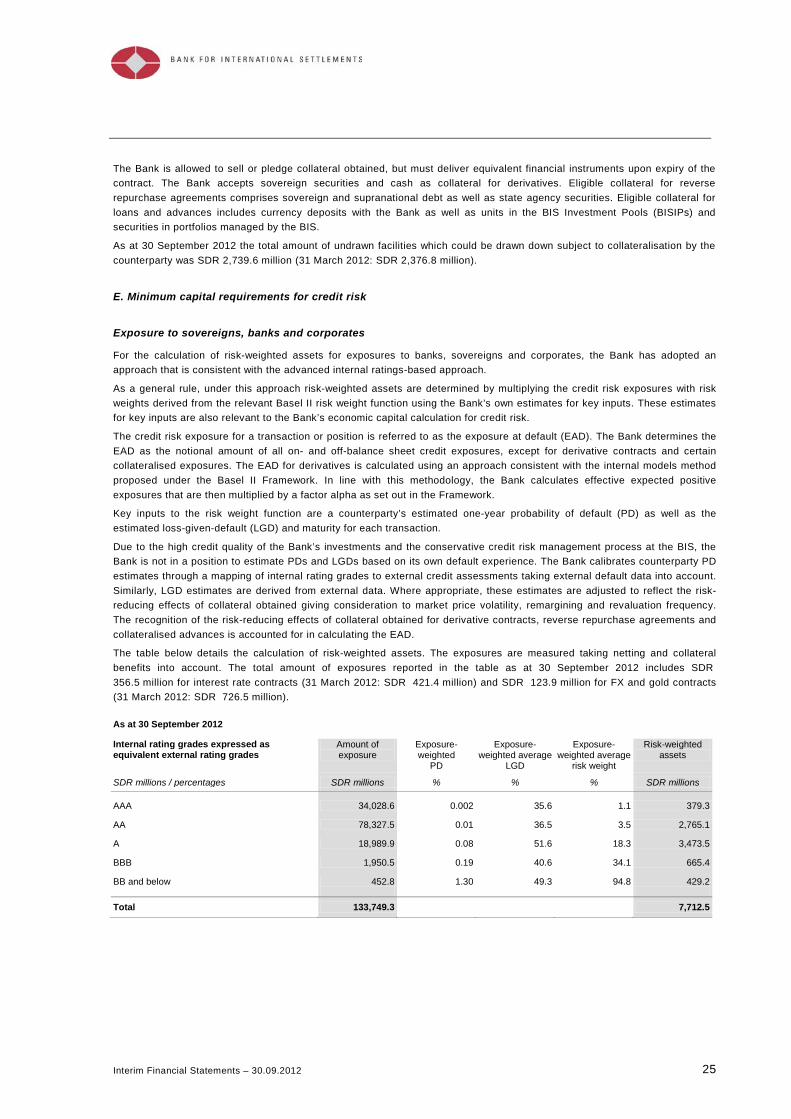
The Bank is allowed to sell or pledge collateral obtained, but must deliver equivalent financial instruments upon expiry of the contract. The Bank accepts sovereign securities and cash as collateral for derivatives. Eligible collateral for reverse repurchase agreements comprises sovereign and supranational debt as well as state agency securities. Eligible collateral for loans and advances includes currency deposits with the Bank as well as units in the BIS Investment Pools (BISIPs) and securities in portfolios managed by the BIS.
As at 30 September 2012 the total amount of undrawn facilities which could be drawn down subject to collateralisation by the counterparty was SDR 2,739.6 million (31 March 2012: SDR 2,376.8 million).
E. Minimum capital requirements for credit risk
Exposure to sovereigns, banks and corporates
For the calculation of risk-weighted assets for exposures to banks, sovereigns and corporates, the Bank has adopted an approach that is consistent with the advanced internal ratings-based approach.
As a general rule, under this approach risk-weighted assets are determined by multiplying the credit risk exposures with risk weights derived from the relevant Basel II risk weight function using the Bank’s own estimates for key inputs. These estimates for key inputs are also relevant to the Bank’s economic capital calculation for credit risk.
The credit risk exposure for a transaction or position is referred to as the exposure at default (EAD). The Bank determines the EAD as the notional amount of all on- and off-balance sheet credit exposures, except for derivative contracts and certain collateralised exposures. The EAD for derivatives is calculated using an approach consistent with the internal models method proposed under the Basel II Framework. In line with this methodology, the Bank calculates effective expected positive exposures that are then multiplied by a factor alpha as set out in the Framework.
Key inputs to the risk weight function are a counterparty’s estimated one-year probability of default (PD) as well as the estimated loss-given-default (LGD) and maturity for each transaction.
Due to the high credit quality of the Bank’s investments and the conservative credit risk management process at the BIS, the Bank is not in a position to estimate PDs and LGDs based on its own default experience. The Bank calibrates counterparty PD estimates through a mapping of internal rating grades to external credit assessments taking external default data into account. Similarly, LGD estimates are derived from external data. Where appropriate, these estimates are adjusted to reflect the risk-reducing effects of collateral obtained giving consideration to market price volatility, remargining and revaluation frequency. The recognition of the risk-reducing effects of collateral obtained for derivative contracts, reverse repurchase agreements and collateralised advances is accounted for in calculating the EAD.
The table below details the calculation of risk-weighted assets. The exposures are measured taking netting and collateral benefits into account. The total amount of exposures reported in the table as at 30 September 2012 includes SDR 356.5 million for interest rate contracts (31 March 2012: SDR 421.4 million) and SDR 123.9 million for FX and gold contracts (31 March 2012: SDR 726.5 million). As at 30 September 2012
Internal rating grades expressed as equivalent external rating grades
Amount of exposure
Exposure-weighted
PD
Exposure-weighted average
LGD
Exposure-weighted average
risk weight
Risk-weighted assets
SDR millions / percentages SDR millions % % % SDR millions AAA 34,028.6 0.002 35.6 1.1 379.3
AA 78,327.5 0.01 36.5 3.5 2,765.1
A 18,989.9 0.08 51.6 18.3 3,473.5
BBB 1,950.5 0.19 40.6 34.1 665.4
BB and below 452.8 1.30 49.3 94.8 429.2 Total 133,749.3 7,712.5
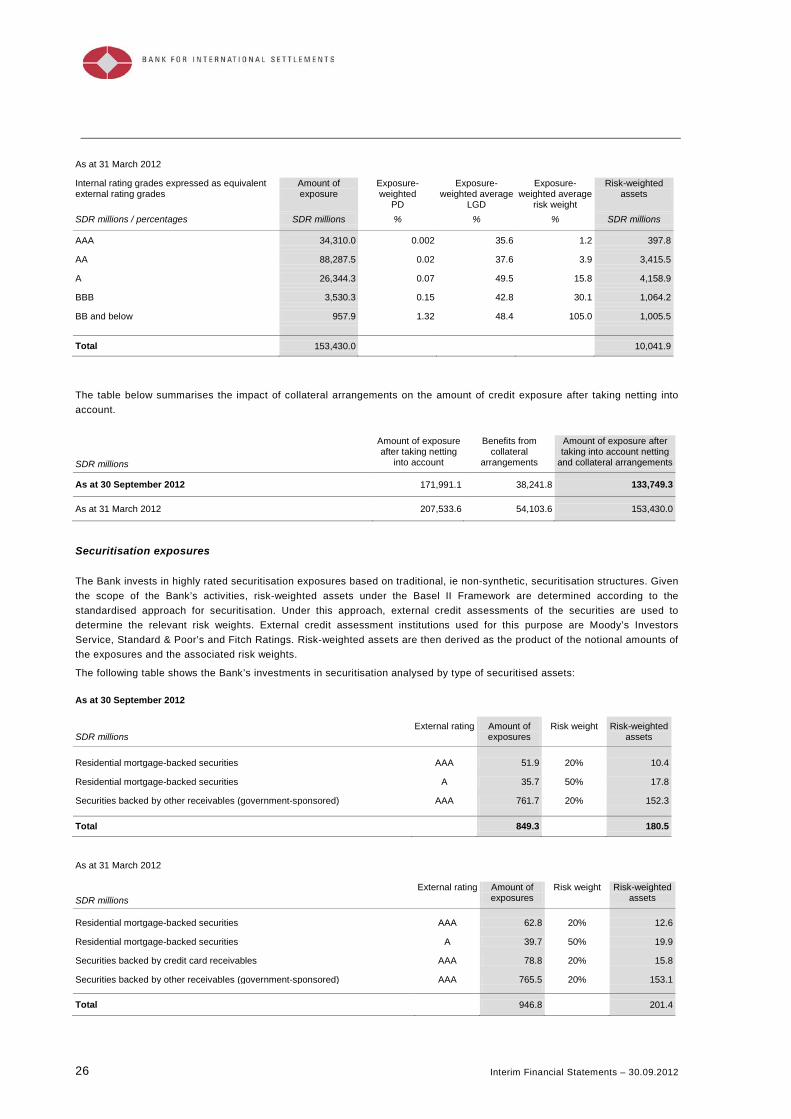
26 Interim Financial Statements – 30.09.2012
As at 31 March 2012 Internal rating grades expressed as equivalent external rating grades
Amount of exposure
Exposure-weighted
PD
Exposure-weighted average
LGD
Exposure-weighted average
risk weight
Risk-weighted assets
SDR millions / percentages SDR millions % % % SDR millions AAA 34,310.0 0.002 35.6 1.2 397.8
AA 88,287.5 0.02 37.6 3.9 3,415.5
A 26,344.3 0.07 49.5 15.8 4,158.9
BBB 3,530.3 0.15 42.8 30.1 1,064.2
BB and below 957.9 1.32 48.4 105.0 1,005.5 Total 153,430.0 10,041.9
The table below summarises the impact of collateral arrangements on the amount of credit exposure after taking netting into account.
SDR millions
Amount of exposure after taking netting
into account
Benefits from collateral
arrangements
Amount of exposure after taking into account netting
and collateral arrangements As at 30 September 2012 171,991.1 38,241.8 133,749.3
As at 31 March 2012 207,533.6 54,103.6 153,430.0
Securitisation exposures
The Bank invests in highly rated securitisation exposures based on traditional, ie non-synthetic, securitisation structures. Given the scope of the Bank’s activities, risk-weighted assets under the Basel II Framework are determined according to the standardised approach for securitisation. Under this approach, external credit assessments of the securities are used to determine the relevant risk weights. External credit assessment institutions used for this purpose are Moody’s Investors Service, Standard & Poor’s and Fitch Ratings. Risk-weighted assets are then derived as the product of the notional amounts of the exposures and the associated risk weights.
The following table shows the Bank’s investments in securitisation analysed by type of securitised assets: As at 30 September 2012
SDR millions External rating Amount of
exposures Risk weight Risk-weighted
assets Residential mortgage-backed securities AAA 51.9 20% 10.4
Residential mortgage-backed securities A 35.7 50% 17.8
Securities backed by other receivables (government-sponsored) AAA 761.7 20% 152.3 Total 849.3 180.5
As at 31 March 2012
SDR millions External rating Amount of
exposures Risk weight Risk-weighted
assets Residential mortgage-backed securities AAA 62.8 20% 12.6
Residential mortgage-backed securities A 39.7 50% 19.9
Securities backed by credit card receivables AAA 78.8 20% 15.8
Securities backed by other receivables (government-sponsored) AAA 765.5 20% 153.1 Total 946.8 201.4
Interim Financial Statements – 30.09.2012 27
2. Market risk
The Bank is exposed to market risk through adverse movements in market prices. The main components of the Bank’s market risk are gold price risk, interest rate risk and foreign exchange risk.
A. Gold price risk
Gold price risk is the exposure of the Bank’s financial condition to adverse movements in the price of gold. The Bank is exposed to gold price risk principally through its holdings of gold investment assets, which amount to 115 tonnes (31 March 2012: 116 tonnes). These gold investment assets are held in custody or placed on deposit with commercial banks. At 30 September 2012 the Bank’s net gold investment assets amounted to SDR 4,272.8 million (31 March 2012: SDR 4,018.2 million), approximately 22.5% of its equity (31 March 2012: 22.0%). The Bank sometimes has also small exposures to gold price risk arising from its banking activities with central and commercial banks.
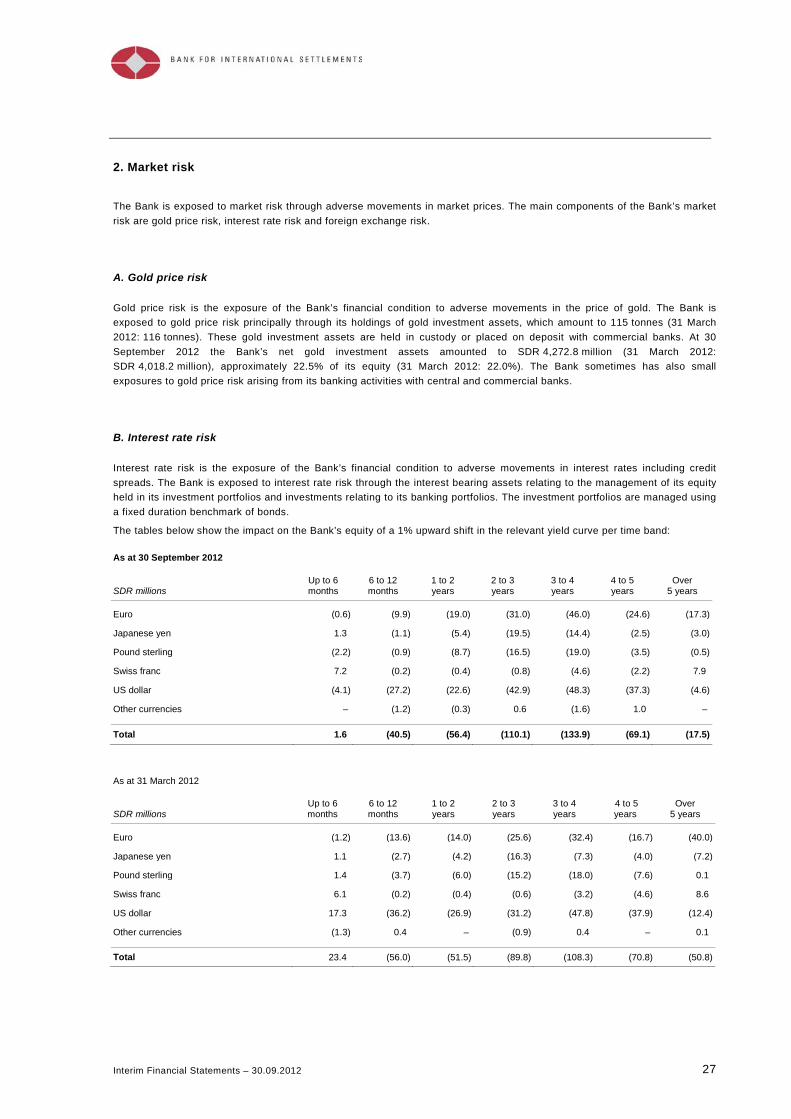
B. Interest rate risk
Interest rate risk is the exposure of the Bank’s financial condition to adverse movements in interest rates including credit spreads. The Bank is exposed to interest rate risk through the interest bearing assets relating to the management of its equity held in its investment portfolios and investments relating to its banking portfolios. The investment portfolios are managed using a fixed duration benchmark of bonds.
The tables below show the impact on the Bank’s equity of a 1% upward shift in the relevant yield curve per time band: As at 30 September 2012
SDR millions Up to 6 months
6 to 12 months
1 to 2 years
2 to 3 years
3 to 4 years
4 to 5 years
Over 5 years
Euro (0.6) (9.9) (19.0) (31.0) (46.0) (24.6) (17.3)
Japanese yen 1.3 (1.1) (5.4) (19.5) (14.4) (2.5) (3.0)
Pound sterling (2.2) (0.9) (8.7) (16.5) (19.0) (3.5) (0.5)
Swiss franc 7.2 (0.2) (0.4) (0.8) (4.6) (2.2) 7.9
US dollar (4.1) (27.2) (22.6) (42.9) (48.3) (37.3) (4.6)
Other currencies – (1.2) (0.3) 0.6 (1.6) 1.0 – Total 1.6 (40.5) (56.4) (110.1) (133.9) (69.1) (17.5)
As at 31 March 2012
SDR millions Up to 6 months
6 to 12 months
1 to 2 years
2 to 3 years
3 to 4 years
4 to 5 years
Over 5 years
Euro (1.2) (13.6) (14.0) (25.6) (32.4) (16.7) (40.0)
Japanese yen 1.1 (2.7) (4.2) (16.3) (7.3) (4.0) (7.2)
Pound sterling 1.4 (3.7) (6.0) (15.2) (18.0) (7.6) 0.1
Swiss franc 6.1 (0.2) (0.4) (0.6) (3.2) (4.6) 8.6
US dollar 17.3 (36.2) (26.9) (31.2) (47.8) (37.9) (12.4)
Other currencies (1.3) 0.4 – (0.9) 0.4 – 0.1 Total 23.4 (56.0) (51.5) (89.8) (108.3) (70.8) (50.8)
28 Interim Financial Statements – 30.09.2012
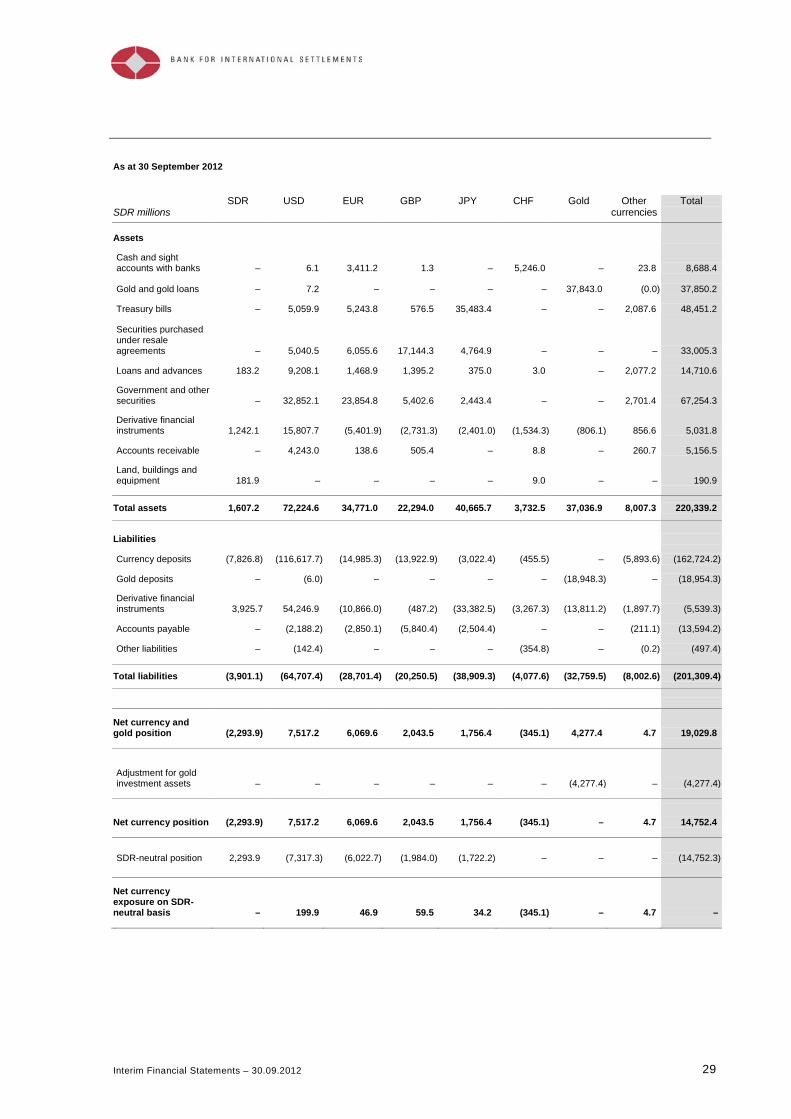
C. Foreign exchange risk
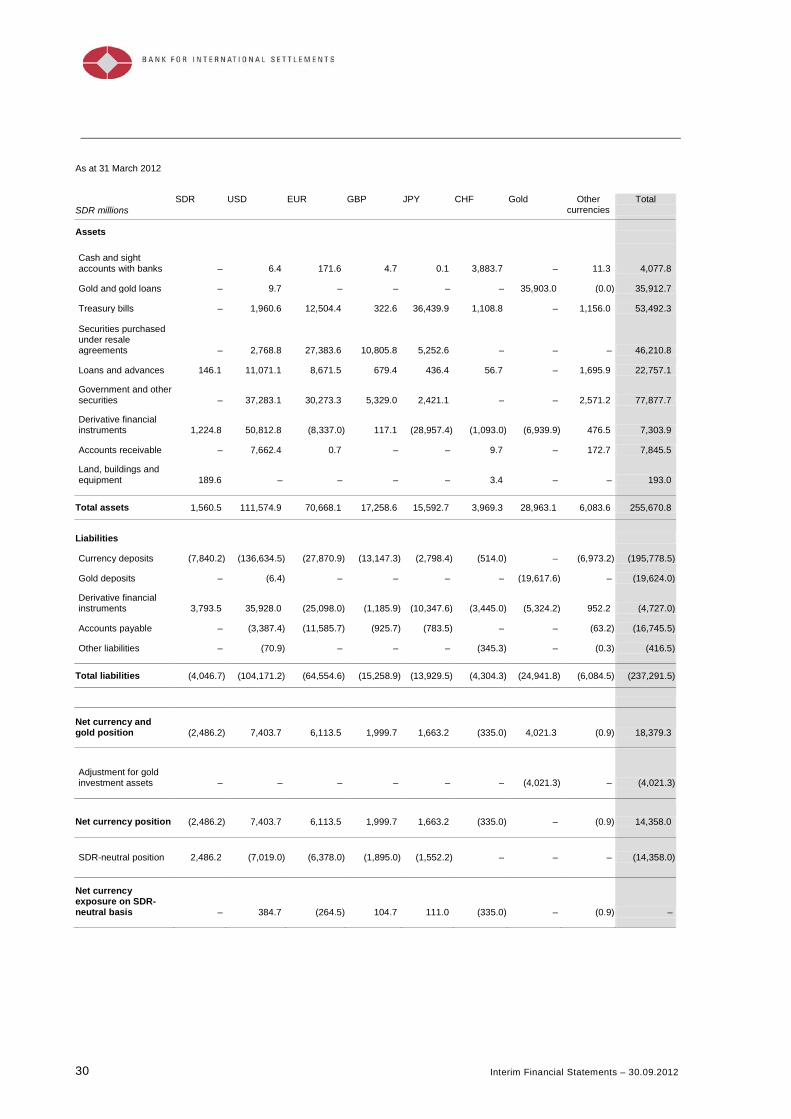
The Bank’s functional currency, the SDR, is a composite currency comprising fixed amounts of USD, EUR, JPY and GBP. Currency risk is the exposure of the Bank’s financial condition to adverse movements in exchange rates. The Bank is exposed to foreign exchange risk primarily through the assets relating to the management of its equity. The Bank is also exposed to foreign exchange risk through managing its customer deposits and through acting as an intermediary in foreign exchange transactions between central and commercial banks. The Bank reduces its foreign exchange exposures by matching the relevant assets to the constituent currencies of the SDR on a regular basis, and by limiting currency exposures arising from customer deposits and foreign exchange transaction intermediation.
The following tables show the Bank’s assets and liabilities by currency and gold exposure. The net foreign exchange and gold position in these tables therefore includes the Bank’s gold investments. To determine the Bank’s net foreign exchange exposure, the gold amounts need to be removed. The SDR-neutral position is then deducted from the net foreign exchange position excluding gold to arrive at the net currency exposure of the Bank on an SDR-neutral basis.
Interim Financial Statements – 30.09.2012 29
As at 30 September 2012
SDR millions SDR USD EUR GBP JPY CHF Gold Other
currencies Total
Assets
Cash and sight accounts with banks – 6.1 3,411.2 1.3 – 5,246.0 – 23.8 8,688.4
Gold and gold loans – 7.2 – – – – 37,843.0 (0.0) 37,850.2
Treasury bills – 5,059.9 5,243.8 576.5 35,483.4 – – 2,087.6 48,451.2
Securities purchased under resale agreements – 5,040.5 6,055.6 17,144.3 4,764.9 – – – 33,005.3
Loans and advances 183.2 9,208.1 1,468.9 1,395.2 375.0 3.0 – 2,077.2 14,710.6
Government and other securities – 32,852.1 23,854.8 5,402.6 2,443.4 – – 2,701.4 67,254.3
Derivative financial instruments 1,242.1 15,807.7 (5,401.9) (2,731.3) (2,401.0) (1,534.3) (806.1) 856.6 5,031.8
Accounts receivable – 4,243.0 138.6 505.4 – 8.8 – 260.7 5,156.5
Land, buildings and equipment 181.9 – – – – 9.0 – – 190.9
Total assets 1,607.2 72,224.6 34,771.0 22,294.0 40,665.7 3,732.5 37,036.9 8,007.3 220,339.2
Liabilities
Currency deposits (7,826.8) (116,617.7) (14,985.3) (13,922.9) (3,022.4) (455.5) – (5,893.6) (162,724.2)
Gold deposits – (6.0) – – – – (18,948.3) – (18,954.3)
Derivative financial instruments 3,925.7 54,246.9 (10,866.0) (487.2) (33,382.5) (3,267.3) (13,811.2) (1,897.7) (5,539.3)
Accounts payable – (2,188.2) (2,850.1) (5,840.4) (2,504.4) – – (211.1) (13,594.2)
Other liabilities – (142.4) – – – (354.8) – (0.2) (497.4)
Total liabilities (3,901.1) (64,707.4) (28,701.4) (20,250.5) (38,909.3) (4,077.6) (32,759.5) (8,002.6) (201,309.4)
Net currency and gold position (2,293.9) 7,517.2 6,069.6 2,043.5 1,756.4 (345.1) 4,277.4 4.7 19,029.8
Adjustment for gold investment assets – – – – – – (4,277.4) – (4,277.4)
Net currency position (2,293.9) 7,517.2 6,069.6 2,043.5 1,756.4 (345.1) – 4.7 14,752.4
SDR-neutral position 2,293.9 (7,317.3) (6,022.7) (1,984.0) (1,722.2) – – – (14,752.3)
Net currency exposure on SDR-neutral basis – 199.9 46.9 59.5 34.2 (345.1) – 4.7 –
30 Interim Financial Statements – 30.09.2012
As at 31 March 2012
SDR millions SDR USD EUR GBP JPY CHF Gold Other
currencies Total
Assets
Cash and sight accounts with banks – 6.4 171.6 4.7 0.1 3,883.7 – 11.3 4,077.8
Gold and gold loans – 9.7 – – – – 35,903.0 (0.0) 35,912.7
Treasury bills – 1,960.6 12,504.4 322.6 36,439.9 1,108.8 – 1,156.0 53,492.3
Securities purchased under resale agreements – 2,768.8 27,383.6 10,805.8 5,252.6 – – – 46,210.8
Loans and advances 146.1 11,071.1 8,671.5 679.4 436.4 56.7 – 1,695.9 22,757.1
Government and other securities – 37,283.1 30,273.3 5,329.0 2,421.1 – – 2,571.2 77,877.7
Derivative financial instruments 1,224.8 50,812.8 (8,337.0) 117.1 (28,957.4) (1,093.0) (6,939.9) 476.5 7,303.9
Accounts receivable – 7,662.4 0.7 – – 9.7 – 172.7 7,845.5
Land, buildings and equipment 189.6 – – – – 3.4 – – 193.0
Total assets 1,560.5 111,574.9 70,668.1 17,258.6 15,592.7 3,969.3 28,963.1 6,083.6 255,670.8
Liabilities
Currency deposits (7,840.2) (136,634.5) (27,870.9) (13,147.3) (2,798.4) (514.0) – (6,973.2) (195,778.5)
Gold deposits – (6.4) – – – – (19,617.6) – (19,624.0)
Derivative financial instruments 3,793.5 35,928.0 (25,098.0) (1,185.9) (10,347.6) (3,445.0) (5,324.2) 952.2 (4,727.0)
Accounts payable – (3,387.4) (11,585.7) (925.7) (783.5) – – (63.2) (16,745.5)
Other liabilities – (70.9) – – – (345.3) – (0.3) (416.5)
Total liabilities (4,046.7) (104,171.2) (64,554.6) (15,258.9) (13,929.5) (4,304.3) (24,941.8) (6,084.5) (237,291.5)
Net currency and gold position (2,486.2) 7,403.7 6,113.5 1,999.7 1,663.2 (335.0) 4,021.3 (0.9) 18,379.3
Adjustment for gold investment assets – – – – – – (4,021.3) – (4,021.3)
Net currency position (2,486.2) 7,403.7 6,113.5 1,999.7 1,663.2 (335.0) – (0.9) 14,358.0
SDR-neutral position 2,486.2 (7,019.0) (6,378.0) (1,895.0) (1,552.2) – – – (14,358.0)
Net currency exposure on SDR-neutral basis – 384.7 (264.5) 104.7 111.0 (335.0) – (0.9) –
Interim Financial Statements – 30.09.2012 31
D. Minimum capital requirements for market risk
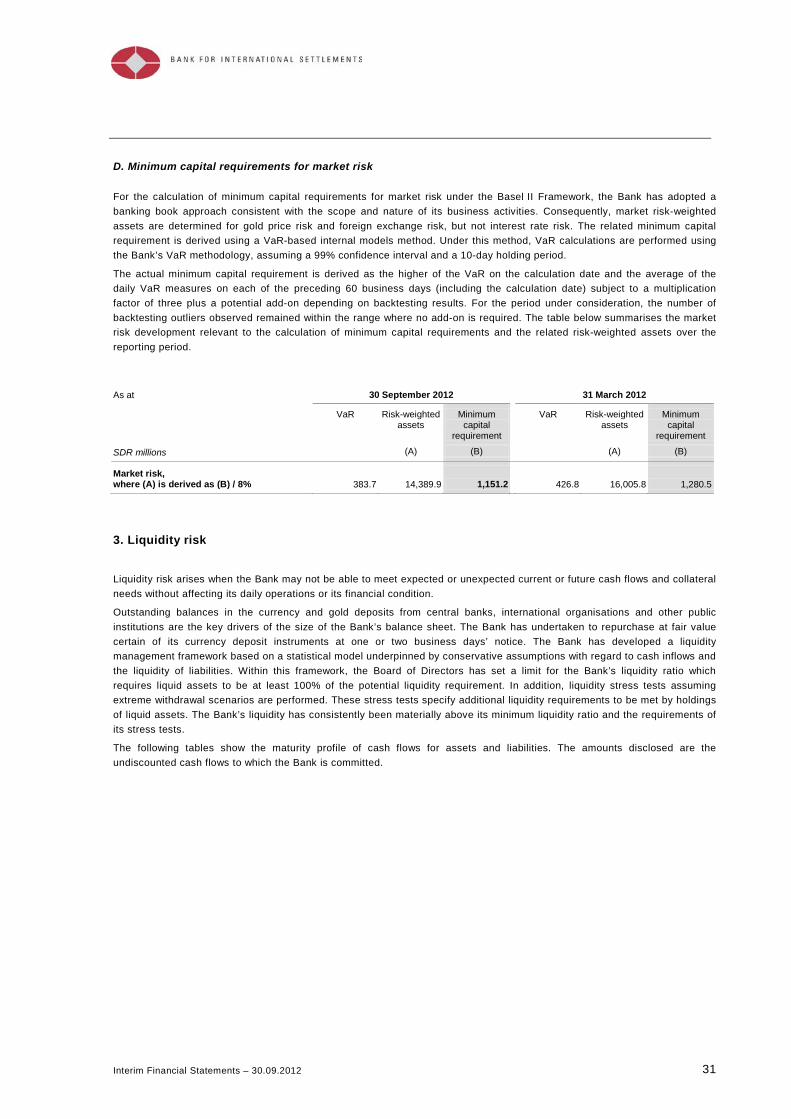
For the calculation of minimum capital requirements for market risk under the Basel II Framework, the Bank has adopted a banking book approach consistent with the scope and nature of its business activities. Consequently, market risk-weighted assets are determined for gold price risk and foreign exchange risk, but not interest rate risk. The related minimum capital requirement is derived using a VaR-based internal models method. Under this method, VaR calculations are performed using the Bank’s VaR methodology, assuming a 99% confidence interval and a 10-day holding period.
The actual minimum capital requirement is derived as the higher of the VaR on the calculation date and the average of the daily VaR measures on each of the preceding 60 business days (including the calculation date) subject to a multiplication factor of three plus a potential add-on depending on backtesting results. For the period under consideration, the number of backtesting outliers observed remained within the range where no add-on is required. The table below summarises the market risk development relevant to the calculation of minimum capital requirements and the related risk-weighted assets over the reporting period.
As at 30 September 2012 31 March 2012
SDR millions
VaR Risk-weighted assets
Minimum capital
requirement
VaR Risk-weighted assets
Minimum capital
requirement
(A) (B) (A) (B) Market risk, where (A) is derived as (B) / 8% 383.7 14,389.9 1,151.2 426.8 16,005.8 1,280.5
3. Liquidity risk
Liquidity risk arises when the Bank may not be able to meet expected or unexpected current or future cash flows and collateral needs without affecting its daily operations or its financial condition.
Outstanding balances in the currency and gold deposits from central banks, international organisations and other public institutions are the key drivers of the size of the Bank’s balance sheet. The Bank has undertaken to repurchase at fair value certain of its currency deposit instruments at one or two business days’ notice. The Bank has developed a liquidity management framework based on a statistical model underpinned by conservative assumptions with regard to cash inflows and the liquidity of liabilities. Within this framework, the Board of Directors has set a limit for the Bank’s liquidity ratio which requires liquid assets to be at least 100% of the potential liquidity requirement. In addition, liquidity stress tests assuming extreme withdrawal scenarios are performed. These stress tests specify additional liquidity requirements to be met by holdings of liquid assets. The Bank’s liquidity has consistently been materially above its minimum liquidity ratio and the requirements of its stress tests.
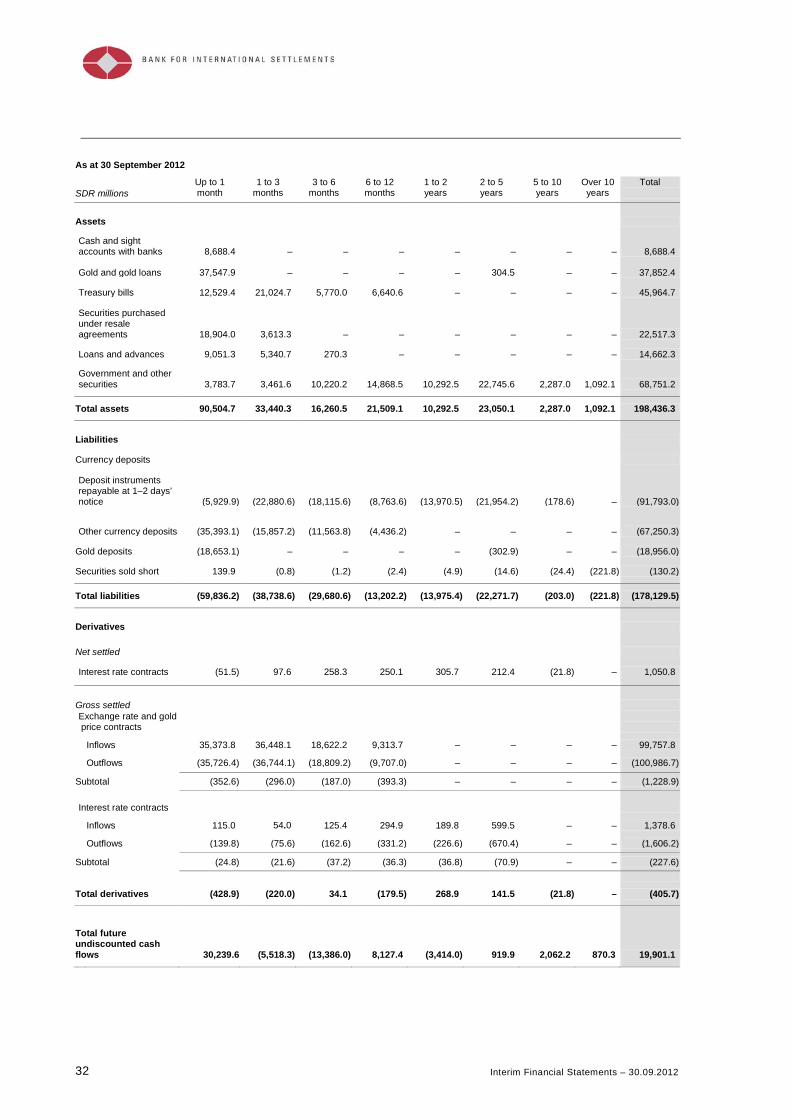
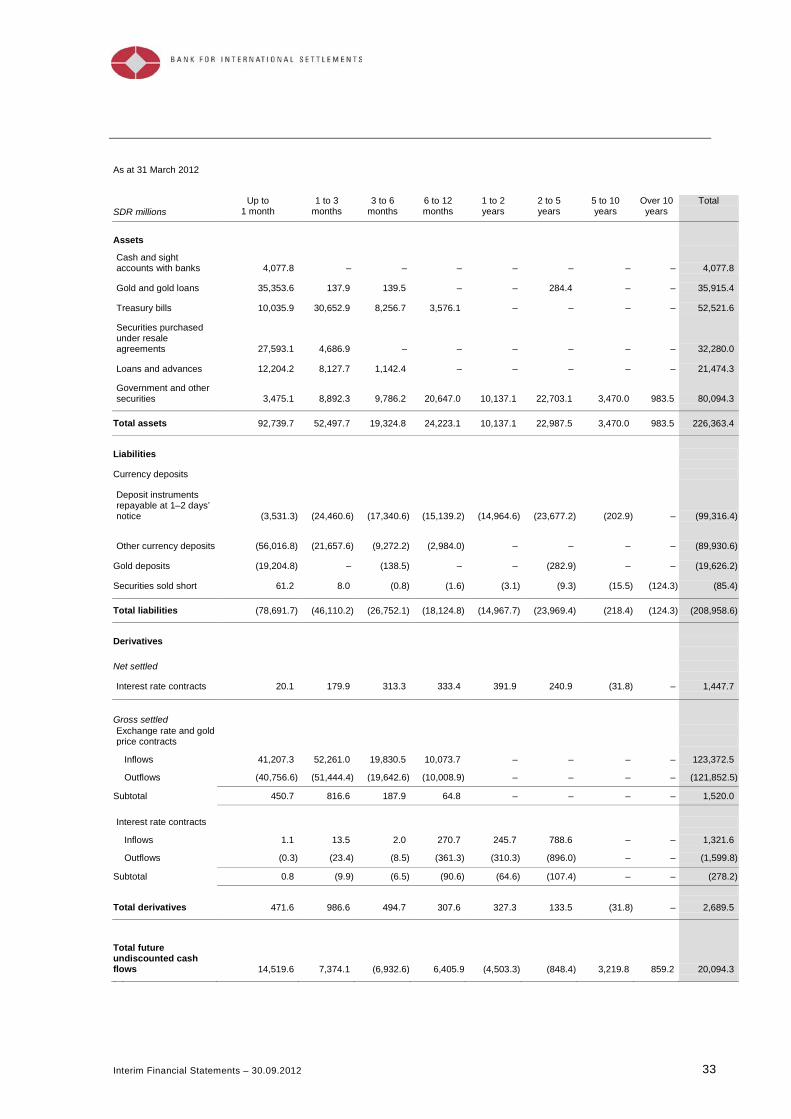
The following tables show the maturity profile of cash flows for assets and liabilities. The amounts disclosed are the undiscounted cash flows to which the Bank is committed.
32 Interim Financial Statements – 30.09.2012
As at 30 September 2012
SDR millions Up to 1 month
1 to 3 months
3 to 6 months
6 to 12 months
1 to 2 years
2 to 5 years
5 to 10 years
Over 10 years
Total
Assets
Cash and sight accounts with banks 8,688.4 – – – – – – – 8,688.4
Gold and gold loans 37,547.9 – – – – 304.5 – – 37,852.4
Treasury bills 12,529.4 21,024.7 5,770.0 6,640.6 – – – – 45,964.7
Securities purchased under resale agreements 18,904.0 3,613.3 – – – – – – 22,517.3
Loans and advances 9,051.3 5,340.7 270.3 – – – – – 14,662.3
Government and other securities 3,783.7 3,461.6 10,220.2 14,868.5 10,292.5 22,745.6 2,287.0 1,092.1 68,751.2
Total assets 90,504.7 33,440.3 16,260.5 21,509.1 10,292.5 23,050.1 2,287.0 1,092.1 198,436.3
Liabilities
Currency deposits
Deposit instruments repayable at 1–2 days’ notice (5,929.9) (22,880.6) (18,115.6) (8,763.6) (13,970.5) (21,954.2) (178.6) – (91,793.0)
Other currency deposits (35,393.1) (15,857.2) (11,563.8) (4,436.2) – – – – (67,250.3)
Gold deposits (18,653.1) – – – – (302.9) – – (18,956.0)
Securities sold short 139.9 (0.8) (1.2) (2.4) (4.9) (14.6) (24.4) (221.8) (130.2) Total liabilities (59,836.2) (38,738.6) (29,680.6) (13,202.2) (13,975.4) (22,271.7) (203.0) (221.8) (178,129.5)
Derivatives
Net settled
Interest rate contracts (51.5) 97.6 258.3 250.1 305.7 212.4 (21.8) – 1,050.8
Gross settled
Exchange rate and gold price contracts
Inflows 35,373.8 36,448.1 18,622.2 9,313.7 – – – – 99,757.8
Outflows (35,726.4) (36,744.1) (18,809.2) (9,707.0) – – – – (100,986.7) Subtotal (352.6) (296.0) (187.0) (393.3) – – – – (1,228.9)
Interest rate contracts
Inflows 115.0 54.0 125.4 294.9 189.8 599.5 – – 1,378.6
Outflows (139.8) (75.6) (162.6) (331.2) (226.6) (670.4) – – (1,606.2) Subtotal (24.8) (21.6) (37.2) (36.3) (36.8) (70.9) – – (227.6)
Total derivatives (428.9) (220.0) 34.1 (179.5) 268.9 141.5 (21.8) – (405.7)
Total future undiscounted cash flows 30,239.6 (5,518.3) (13,386.0) 8,127.4 (3,414.0) 919.9 2,062.2 870.3 19,901.1
Interim Financial Statements – 30.09.2012 33
As at 31 March 2012
SDR millions Up to
1 month 1 to 3
months 3 to 6
months 6 to 12 months
1 to 2 years
2 to 5 years
5 to 10 years
Over 10 years
Total
Assets
Cash and sight accounts with banks 4,077.8 – – – – – – – 4,077.8
Gold and gold loans 35,353.6 137.9 139.5 – – 284.4 – – 35,915.4
Treasury bills 10,035.9 30,652.9 8,256.7 3,576.1 – – – – 52,521.6
Securities purchased under resale agreements 27,593.1 4,686.9 – – – – – – 32,280.0
Loans and advances 12,204.2 8,127.7 1,142.4 – – – – – 21,474.3
Government and other securities 3,475.1 8,892.3 9,786.2 20,647.0 10,137.1 22,703.1 3,470.0 983.5 80,094.3 Total assets 92,739.7 52,497.7 19,324.8 24,223.1 10,137.1 22,987.5 3,470.0 983.5 226,363.4
Liabilities
Currency deposits
Deposit instruments repayable at 1–2 days’ notice (3,531.3) (24,460.6) (17,340.6) (15,139.2) (14,964.6) (23,677.2) (202.9) – (99,316.4)
Other currency deposits (56,016.8) (21,657.6) (9,272.2) (2,984.0) – – – – (89,930.6)
Gold deposits (19,204.8) – (138.5) – – (282.9) – – (19,626.2)
Securities sold short 61.2 8.0 (0.8) (1.6) (3.1) (9.3) (15.5) (124.3) (85.4) Total liabilities (78,691.7) (46,110.2) (26,752.1) (18,124.8) (14,967.7) (23,969.4) (218.4) (124.3) (208,958.6)
Derivatives
Net settled
Interest rate contracts 20.1 179.9 313.3 333.4 391.9 240.9 (31.8) – 1,447.7
Gross settled
Exchange rate and gold price contracts
Inflows 41,207.3 52,261.0 19,830.5 10,073.7 – – – – 123,372.5
Outflows (40,756.6) (51,444.4) (19,642.6) (10,008.9) – – – – (121,852.5) Subtotal 450.7 816.6 187.9 64.8 – – – – 1,520.0
Interest rate contracts
Inflows 1.1 13.5 2.0 270.7 245.7 788.6 – – 1,321.6
Outflows (0.3) (23.4) (8.5) (361.3) (310.3) (896.0) – – (1,599.8) Subtotal 0.8 (9.9) (6.5) (90.6) (64.6) (107.4) – – (278.2)
Total derivatives 471.6 986.6 494.7 307.6 327.3 133.5 (31.8) – 2,689.5
Total future undiscounted cash flows 14,519.6 7,374.1 (6,932.6) 6,405.9 (4,503.3) (848.4) 3,219.8 859.2 20,094.3
34 Interim Financial Statements – 30.09.2012
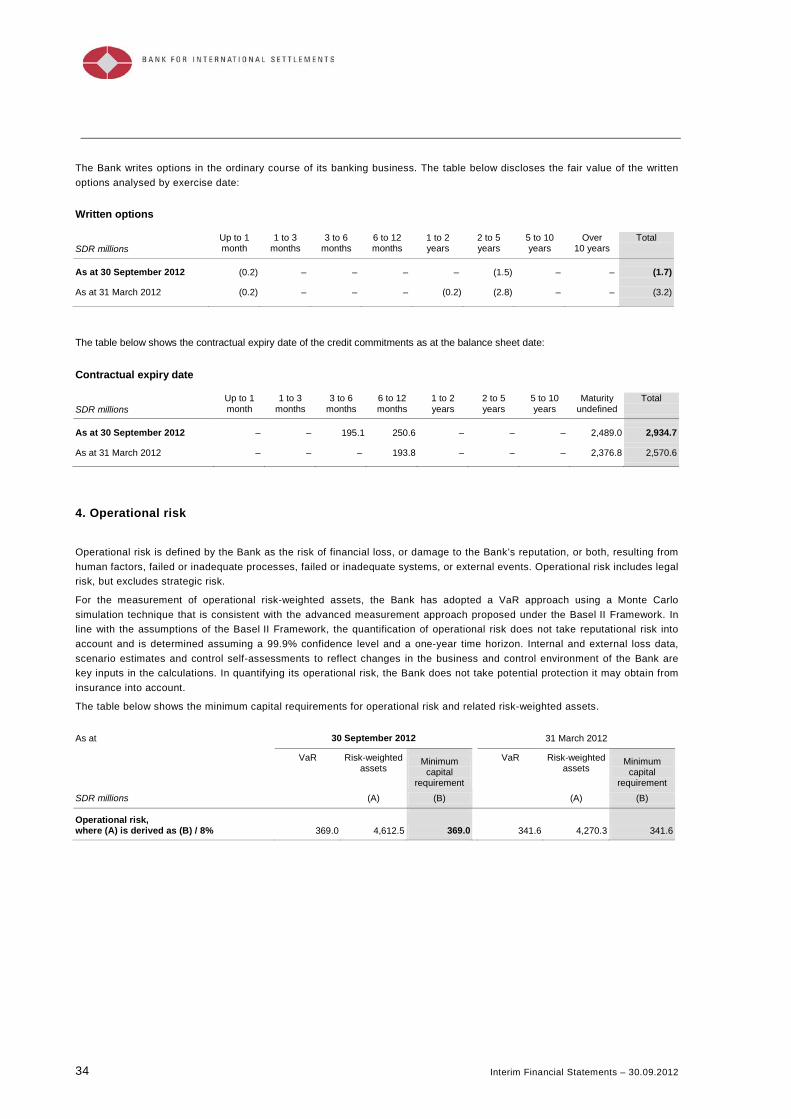
The Bank writes options in the ordinary course of its banking business. The table below discloses the fair value of the written options analysed by exercise date:
Written options
SDR millions Up to 1 month
1 to 3 months
3 to 6 months
6 to 12 months
1 to 2 years
2 to 5 years
5 to 10 years
Over 10 years
Total
As at 30 September 2012 (0.2) – – – – (1.5) – – (1.7)
As at 31 March 2012 (0.2) – – – (0.2) (2.8) – – (3.2) The table below shows the contractual expiry date of the credit commitments as at the balance sheet date:
Contractual expiry date
SDR millions Up to 1 month
1 to 3 months
3 to 6 months
6 to 12 months
1 to 2 years
2 to 5 years
5 to 10 years
Maturity undefined
Total
As at 30 September 2012 – – 195.1 250.6 – – – 2,489.0 2,934.7
As at 31 March 2012 – – – 193.8 – – – 2,376.8 2,570.6
4. Operational risk
Operational risk is defined by the Bank as the risk of financial loss, or damage to the Bank’s reputation, or both, resulting from human factors, failed or inadequate processes, failed or inadequate systems, or external events. Operational risk includes legal risk, but excludes strategic risk.
For the measurement of operational risk-weighted assets, the Bank has adopted a VaR approach using a Monte Carlo simulation technique that is consistent with the advanced measurement approach proposed under the Basel II Framework. In line with the assumptions of the Basel II Framework, the quantification of operational risk does not take reputational risk into account and is determined assuming a 99.9% confidence level and a one-year time horizon. Internal and external loss data, scenario estimates and control self-assessments to reflect changes in the business and control environment of the Bank are key inputs in the calculations. In quantifying its operational risk, the Bank does not take potential protection it may obtain from insurance into account.
The table below shows the minimum capital requirements for operational risk and related risk-weighted assets. As at 30 September 2012 31 March 2012
VaR Risk-weighted assets
Minimum capital
requirement
VaR Risk-weighted assets
Minimum capital
requirement SDR millions (A) (B) (A) (B)
Operational risk, where (A) is derived as (B) / 8% 369.0 4,612.5 369.0 341.6 4,270.3 341.6