interim financial report - aperam - about report 2016/2016_hy_report.pdf · interim financial...
TRANSCRIPT

Interim Financial Report Half year ended June 30, 2016

Interim Financial Report 2016
Table of contents
Interim Management Report 02
Company Overview 03 Message from the CEO 04 Business Overview 06 Recent Developments 32 Corporate Governance 33 Statement of Responsible Persons 35
Condensed Consolidated Financial Statements as of and 36for the six months ended June 30, 2016
Condensed Consolidated Statement of Operations 36 Condensed Consolidated Statement of Comprehensive Income / (Loss) 37 Condensed Consolidated Statement of Financial Position 38 Condensed Consolidated Statement of Changes in Equity 40 Condensed Consolidated Statement of Cash Flows 41 Notes to the Condensed Consolidated Financial Statements 42
Report of the Réviseur d’Entreprises Agréé on the Review 53 of Interim Financial Statements
Disclaimer – Forward Looking Statements
In this Interim Financial Report Aperam has made certain forwardlooking statements with respect to, among other topics, its financial position, business strategy, projected costs, projected savings, and the plans and objectives of its management.
Such statements are identified by the use of forwardlooking verbs such as ‘anticipate’, ‘intend’, ‘expect’, ‘plan’, ‘believe’, or ‘estimate’, or words or phrases with similar meanings. Aperam’s actual results may differ materially from those implied by such forwardlooking statements due to the known and unknown risks and uncertainties to which it is exposed, including, without limitation, the risks described in this Interim Financial Report. Aperam does not make any representation, warranty or prediction that the results anticipated by such forwardlooking statements will be achieved.
Please refer to the ‘Key factors affecting results of operations’ section of this report.
Such forwardlooking statements represent, in each case, only one of many possible scenarios and should not necessarily be viewed as the most likely to occur or standard scenario. Aperam undertakes no obligation to publicly update its forwardlooking statements, whether as a result of new information, future events or otherwise. Unless indicated otherwise or the context otherwise requires, references in this Interim Financial Report to ‘Aperam’, the ‘Group’ and the ‘Company’ or similar terms refer to Aperam, ‘société anonyme’, having its registered office at 12C, Rue Guillaume Kroll, L1882 Luxembourg, Grand Duchy of Luxembourg, and to its consolidated subsidiaries.
Photo credits Cover Page Slide at the ArcelorMittal Orbit Tower, London, UK Architects: Anish Kapoor & Cecil Balmond © LLDC (London Legacy Development Corporation)Grade used for the slide: Aperam 316L 2B 3mm sheets polished P240 and 316L HRAP 10mm sheets polished both sides P240 (quantity: 30t)
2

Interim Financial Report 2016
Company Overview Overview
Aperam including its subsidiaries (“Aperam” or the “Company” or “We” or the “Group”) is a leading global stainless and specialty steel producer with an annual production capacity of 2.5 million tonnes in 2015. We are also a leading producer of high value added specialty products, including grain oriented ("GO") and nongrain oriented ("NGO") electrical steels and nickel alloys.
Our production capacity is concentrated in six production facilities located in Brazil, Belgium and France, and we have approximately 9,500 employees at end of June 2016.
Since the early creation of Aperam, we have pursued a successful strategy designed to reinforce Aperam´s resilience to the market environment based on our inhouse internal improvement measures and relying on our own resources.
We are committed to operate in a responsible way with respect to health, safety and the wellbeing of our employees, contractors and the communities in which we operate. We are also committed to the sustainable management of the environment and of finite resources.
Our products are sold to customers in over 40 countries, including customers in the aerospace, automotive, catering, construction, household appliances and electrical engineering, industrial processes, medical, and oil & gas industries.
The business is organised in three primary operating segments: Stainless & Electrical Steel, Services & Solutions and Alloys & Specialties.
In 2015, Aperam had sales of U.S.$4.7 billion and shipments of 1.89 million tonnes. For the six months ended June 30, 2016, Aperam had sales of U.S.$2.2 billion and shipments of 1.0 million tonnes, compared to respectively U.S.$2.5 billion and 0.95 million tonnes for the six months ended 30 June 2015.
Contacts The Company is a Luxembourg public limited liability company (société anonyme) incorporated on September 9, 2010. The Company has its registered office at 12C, rue Guillaume Kroll, L1882 Luxembourg, Grand Duchy of Luxembourg and is registered with the Luxembourg Register of Commerce and Companies under the number B 155.908.
The mailing address and telephone number of Aperam’s registered office are: 12C, rue Guillaume Kroll, L1882 Luxembourg, GrandDuchy of Luxembourg, tel: +352 27 36 27 00.
To contact Aperam by email, please write to [email protected]. Please include your full name, postal address and telephone number.
3

Interim Financial Report 2016
Message from the CEO July 27, 2016
Dear Shareholders,
I am very proud to present the 2016 Aperam half year report which reflects our performance for the six months ended June 30, 2016 and the key milestones achieved since the beginning of the year, including our focus on operational excellence, Research & Development, and the strengthening of our balance sheet.
Once again we continued to progress during the first half of the year and we delivered a solid set of results despite market headwinds.
It is very clear that we can not only be a reference in terms of financial and operational performance and balance sheet strength, we must most importantly also be a reference with respect to Health and Safety. Our lost time injury frequency rate deteriorated to 1.59 in the first six months of 2016 compared to 1.0 for the year 2015 and this is very disappointing. I would like to reassure all our stakeholders that Health and Safety is at the heart of Aperam and that we will continue working hard to improve on this frequency rate. We must all aspire to have zero accidents and to be a sustainable Company in all respects.
The first six months of the year continued to be impacted by challenging market conditions with in particular nickel prices and stainless steel prices reaching record low levels, primarily as a consequence of an oversupplied nickel market, Asian stainless steel overcapacities and Chinese growth concerns.
In Europe, stainless steel demand continued to show a solid trend and stainless steel prices remained resilient over the first half of 2016. Despite antidumping measures against China and Taiwan, latest available data shows that imports into Europe remained at a high level with an increasing trend from Taiwan and South Korea.
In Brazil, stainless steel demand was impacted in the first half of 2016 by the continued Gross Domestic Product slowdown arising from political uncertainty. Although the economic situation weakened, we continued to rely on our operational improvements, our flexible product portfolio and our commercial strengths which enabled us to strengthen and diversify our geographical customer reach. At the same time, we remain confident about mid to long term growth prospects of stainless steel demand in Brazil.
In these difficult market conditions, we achieved U.S.$235 million EBITDA for the first six months of 2016, maintaining our EBITDA margin at a similar level compared to 2015. Our net result for the first six months reached U.S.$102 million, which is a slight decrease when compared to the same period of last year, despite more difficult market conditions. We continued to remain highly focused on our cash generation and a strong balance sheet, reducing our net debt to U.S.$280 million at the end of June 2016 (representing a gearing of 11%), compared to U.S.$316 million at the end of 2015 (representing a gearing of 14%). Finally, our operational efficiencies with our Leadership Journey® contributed a total amount of U.S.$497 million to EBITDA since the beginning of 2011.
This resilience of our results derives from the clear focus on our strategic objectives to i) improve our operational efficiency through our Leadership Journey®, ii) focus on our Top Line strategy and iii) strengthen our balance sheet. In this respect I would like to highlight the most relevant tangible actions in the first half of 2016:
As part of our Leadership Journey® initiative, we are now the first to produce High Grain Oriented (HGO) Electrical Steel in Latin America. The preparation of our plant in Timoteo (Brazil) for HGO also allowed us to improve the production process of other portfolio products of electrical steels, further improving our cost position.
As part of our Top Line strategy, we announced in partnership with the European Investment Bank a financing contract of €50 million which will be dedicated to finance a research and development programme over the period 20162019 as well as the upgrade of two plants located in cohesion regions in France & Belgium 1
(Isbergues HautsdeFrance and ChâteletHainaut). Aperam has a highly skilled Research & Development team of 130 researchers focused on developing the best stainless steel solutions in close cooperation with our customers.
As part of our strong focus on our balance sheet, we decreased our interest expenses and other net financing costs by 50% during the first half of 2016, compared to the same period of the previous year. The decrease in financing costs is partially related to repayment of remaining outstanding high yield bonds in 2015, improved financing conditions and the reduction of net financial indebtedness.
1 In these regions the EIB is acting to address regional economic imbalances and raising living standards across the European Union.
4

Interim Financial Report 2016
For the remainder of 2016, we are confident that the ongoing projects related to our Leadership Journey® and Top Line strategy will continue to improve our operational agility and performance. Under the leadership of its Board of Directors, Aperam will continue its efforts to become a sustainable, safe and profitable company and create value for its stakeholders.
Timoteo Di Maulo, CEO
Open Sky Shopping Center Waves Actisud, Metz, France; Gianni Ranaulo ; © Pino Musi
5

Interim Financial Report 2016
Business Overview
The following discussion and analysis should be read in conjunction with Aperam’s consolidated financial statements and related notes as of and for the year ended December 31, 2015 appearing in its 2015 Annual Report and the unaudited condensed consolidated financial statements as of and for the six months ended June 30, 2016 included in this report.
History of Aperam
On December 7, 2010, Aperam’s Board of Directors and the Board of Directors of ArcelorMittal approved a proposal to spinoff ArcelorMittal’s stainless and specialty steels businesses to its shareholders in order to enable it to benefit from better visibility in the markets, and to pursue its growth strategy as an independent company in the emerging markets and in specialty products, including electrical steel. On January 25, 2011, at an extraordinary general meeting, the shareholders of ArcelorMittal voted to approve the spinoff proposal.
Our key competitive strengths We believe that the following are among our key strengths:
We are committed to Sustainability and our number one priority is Health & Safety
The people who work for, and with, Aperam are our greatest asset and their Health and Safety is our top priority. To measure the effectiveness of our Health and Safety performance, the Group uses as a benchmark the "Lost Time Injury Frequency rate", or "LTIF", a key indicator which measures injuries (which lead to work time loss of a day or more) per 1,000,000 worked hours. In first half of 2016, LTIF rate was 1.59 compared to 1.0 in 2015. We believe strongly in the future of our employees offering them training and opportunities for career developments. This in turn leads to higher levels of employee engagement which has been proven to increase efficiency and for Aperam, also nurtures a true culture of innovation. Fully aware of the challenges of climate change, Aperam has a unique capability to produce charcoalbased biomass in Brazil as a fuel for its production and we are constantly seeking to reduce our environmental impacts. As a manufacturer of energyefficient steel solutions, the Group is also a fervent defender of circular economy. Beyond its zero wastetolandfill objective, it uses scraps for lower carbon footprint and recycled input materials, notably dusts recuperated through its whollyowned Recyco subsidiary (France). Lastly, Aperam maintains constant engagement with all of its stakeholders, from Communities in which we operate to the regulatory bodies that govern our own activities, and strives to anticipate its customers’ needs through close partnerships, tailormade solutions and unrivalled customer satisfaction. For further information regarding Sustainability, please refer to our “made for life” report for 2015 available on our internet site www.aperam.com, section “Sustainability”.
A restructured and efficient European footprint able to seize market opportunities
Aperam's modern production facilities allow the Group to support its customers' stainless and specialty steel requirements with a high level of operational efficiency. In Europe, the Group benefits from high quality and cost efficient plants with the largest and most recent electric arc furnace meltshop (Châtelet, Belgium), the largest hot rolling mill (Châtelet, Belgium), one of the largest cold rolling mills (Genk, Belgium) and LC2I, the bestinclass integrated rollingmill (Isbergues, France). In Brazil, the Group operates a fully integrated production facility using charcoal produced by Aperam BioEnergìa. Through an early restructuring of its downstream operations since the creation of Aperam from 29 tools to 17 tools in Europe to adapt to the market conditions, Aperam managed to reach record volumes in Europe since 2008 although with a lower number of tools. Aperam is well positioned in the core markets in Europe with an optimal loading of its most efficient assets. In addition, Aperam aims to continue investing in its industrial asset base with Leadership Journey® initiatives to benefit from the longterm potential growth of the stainless and specialtysteel industry. The Leadership Journey® initiative is described in greater detail below under the section " Our key strategic priorities".
As part of its continuous and strong focus on operational excellence and innovation, Aperam and the European Investment Bank (EIB) announced on June 27, 2016 the signature of a financing contract which is described in greater detail in the Financing section of this report.
6

Interim Financial Report 2016
A leading and geographically wellpositioned stainless and specialty steel producer
Aperam also has a strong presence in the European stainless steel market. The Group's modern production facilities in Belgium and France are strategically located close to the scrap generating regions and are also close to the Group’s major customers. Aperam’s European industrial operations have consistently maintained high performance standards through the optimisation of production volumes, inventory and costs. The Group also has a highly integrated and technically advanced distribution network that is effective at maintaining direct contact with endusers through strong sales and marketing capabilities.
Table: Key strengths of the European operations of Aperam
Sourcing:
The only integrated upstream operations in the heart of Europe, with the best access to scrap supply. Logistics:
Best location to serve the biggest consumption areas of Europe. Efficient logistics between sites for a competitive working capital management.
Production: Full range of stainless steel products. Flexibility and available capacity. A strategy to be a cost benchmark on key Aperam products.
Aperam is a leading stainless and specialty steel producer in South America and according to the International Stainless Steel Forum (the "ISSF"), is the second largest producer in Europe. Aperam is wellpositioned in both developed and emerging markets. In the first half of 2016 approximately 71% of the sales were derived from developed markets and 29% from emerging markets.
In South America, the Group has a leading presence in flat stainless steel and electrical steel production with modern, flexible and fully integrated production and service centres. This unique asset base is perfectly adapted to the South American market. Based upon low levels of historical apparent consumption per capita and a developing market for stainless steel, Management estimates that there is important growth potential in South America. In Brazil, Aperam also benefits from an improving costs position to ensure its commercial plan and capture opportunities of improving market penetration.
Table: Key strengths of the Brazilian operations of Aperam
Sourcing:
The only fully integrated stainless steel facility in South America with access to iron ore and charcoal produced from our own eucalyptus forests in environmentally friendly manner. Logistics:
Efficient logistics with integrated service centres. Only stainless steel producer in South America with best in class deliveries to customers. Flexible geographical sales capabilities within South America which allow Aperam to optimise its
geographical exposure. Production:
Full range of products including flat stainless steel, electrical steel and special carbon. A flexible production route which allow Aperam to maximise the product mix. An improving cost position compared to industry benchmark benefiting from exchanges on best practice with
European operations.
7

Interim Financial Report 2016
Value accretion beyond stainless production
Aperam has one of the largest integrated stainless and specialty steel sales, distribution and steel services networks in the world, with a total of 14 Steel Service Centres ("SSCs"), 8 transformation facilities and 19 sales offices. This network allows the Group to develop customers' loyalty thanks to a bestinclass service, to support a continuous activity for the mills and finally to capture additional value in the downstream operations. The Group's distribution channels are strategically located in areas of high demand and close to many endusers. The Group works continuously to further develop its distribution network through internal development, partnerships and targeted acquisitions. Aperam normally expands its global distribution network either in response to an identified market opportunity or in response to the express business needs of major customers. The Group's global distribution network enables it to tailor its products to address specific customer needs, thereby facilitating the maintenance of market share and the capture of growth opportunities. The Group's customer base is well diversified, comprising a number of blue chip clients.
A diversified product offering with a leading position in nickel alloys, supported by leading research and development capabilities
Aperam offers a wide range of products, including high margin valueadded niche products to a diversified customer base in both emerging and developed markets. The Group's products are mainly sold to endusers in the automotive, building and construction, catering and appliance, energy and chemicals, and transportation industries, while electrical steel products are primarily sold to customers in the electric motors, generators and transformers industries.
The Group is the fourth largest global producer of nickel alloys and the largest in alloys wire rods, which are sold to customers in the aerospace, automotive, electronics, petrochemical, and oil & gas industries. Aperam's diverse product offering, sold to a wide range of customers across numerous industries, allows the Group to enjoy greater stability and to mitigate some of the risks and cyclicality inherent in certain markets. In addition, Aperam's leading position in nickel alloys, which is a particularly high margin valueadded niche for stainless steel products, helps the Group to maintain and improve its margins and profitability.
Aperam's research and development activities are closely aligned with our strategy, focused on product development and process development. The Group's Research and Development team comprises 130 employees. These employees are based in two centers in Europe, located in Isbergues and Imphy, France, and one center in Timóteo, Brazil. The Research & Development departments interact closely with the Group's operating segments and partner with industrial endusers and leading research organisations in order to remain at the forefront of product development. The Research & Development capabilities have contributed to both the Group's leadership in the industry and its development of long standing and recognisable brands. Aperam concentrates a significant portion of its research and development budget on high margin valueadded niche products, such as nickel alloys.
As part of its continuous and strong focus on operational excellence and innovation, Aperam and the European Investment Bank (EIB) announced on June 27, 2016 the signature of a financing contract which is described in greater detail in the Financing section of this report. Resilient profitability, efficient cash flow management and a solid financial and funding structure
The Group's profitability is supported by its implementation of the Leadership Journey®, which, at the end of June 2016, has contributed to approximately U.S.$497 million to EBITDA since the beginning of 2011.
In addition, the Group has been able to generate positive free cash flows over the past five years. As of June 30, 2016, the Group had net financial debt of U.S.$280 million, representing a gearing of 11% compared to net financial debt of U.S.$1,066 million at the end of December 2010, representing a gearing of 29%. As of June 30, 2016 the Group had a solid funding structure and debt maturity profiles as described in greater detail in the section “Liquidity”.
These achievements have been the result of Aperam’s strategic priorities as described in greater detail under the below section “Our strategic priorities”.
8

Interim Financial Report 2016
Talented and dynamic Leadership Team and motivated workforce
Aperam benefits from the experience and industry knowhow of its Leadership Team. The team is comprised of ten members including the Chief Executive Officer ("CEO"), Mr. Timoteo Di Maulo. Mr. Di Maulo has over twentyfive years of experience in the stainless steel industry, having held a number of positions in the controlling, purchasing, logistics and commercial areas and has been CEO of different units of the Group. He is supported by the other members of the Group's senior management team, including Mr. Sandeep Jalan, the Chief Financial Officer ("CFO") who has over twentyfive years of experience in finance. Mr. Jalan joined the ArcelorMittal group in 1999 and served as CFO of ArcelorMittal Long Carbon Europe, responsible for finance and strategy prior to joining Aperam in 2014. The other members of the Leadership Team are Ms. Vanisha Mittal Bhatia, Chief Strategy Officer; Mr. Nicolas Changeur, Chief Marketing Officer; Mr. Bernard Hallemans, Chief Technical Officer; Mr. Bert Lyssens, Head of Sustainability, Human Resources and Communications, Mr. Jean Paul Rouffiac, Chief Operating Officer Stainless & Electrical Steel Europe; Mr. Frederico Ayres Lima, Chief Operating Officer Stainless & Electrical Steel South America; Ms. Johanna Van Sevenant, Chief Executive Officer Services & Solutions and Mr. Frédéric Mattei, Chief Executive Officer Alloys & Specialties. The collective industry knowledge and leadership of Aperam's senior management team and their record of accomplishment in responding to challenging economic conditions is a key asset to Aperam's business. The Group has also introduced various initiatives to improve the dedication and motivation of its workforce, including development programs, employee annual appraisal, career committee meetings to evaluate opportunities for managers and performancebased bonuses. Greater accountability improves motivation, and the Group's approach to human resources has contributed to the dedication and engagement of its workforce.
Our key strategic priorities
Since the early creation of Aperam, we have pursued a strategy designed to reinforce Aperam´s resilience to challenging market conditions based on our inhouse internal improvement measures and relying on our own resources. This has proven a successful strategy as it reduces reliance on external factors/resources to support our performance. Our key strategic priorities have proven their efficiency in terms of operating and financial performance over the past years, thus we remain focused on:
Improving operational efficiency and increasing EBITDA through the Leadership Journey®, Driving value through our Top Line strategy, Generating positive cash flows, and Maintaining a strong balance sheet consistent with Investment Grade Financial ratios.
Our Top Line strategy is based on commercial projects with the objective to develop Aperam’s most profitable products, segments, clients or geographical areas and to develop quality and service to the customers. Among the Top Line products, specific focus is allocated to develop innovative products allowing niche presence as well as attractive margins. More specifically, our Top Line strategy includes:
Leveraging our unique stainless steel product portfolio, Driving additional value through the Services & Solutions segment, and Growing the Alloys & Specialties segment.
9

Interim Financial Report 2016
Improving operational efficiency and increasing EBITDA through the Leadership Journey®
The Leadership Journey® is an initiative aimed at achieving management gains, fixed and variable cost reductions, and increased productivity over the near and medium term. The Leadership Journey® is composed of a number of initiatives which can be broadly characterised as restructuring projects, cost cutting projects and performance projects as described below:
Restructuring projects under the Leadership Journey® have traditionally focused on the closure of noncompetitive capacities and the reduction of fixed costs through process simplification.
In parallel to the restructuring initiatives, major cost cutting investments have been launched with the goal to improve the industrial footprint and to reduce the number of tools.
Several performance projects have also been launched in order to reinforce the existing continuous improvement program and accelerate cost reductions. In particular, specific actions have been implemented to reduce our costs for sourcing, IT and sales and general administrative costs.
Since 2014, upgrade programs on the most performing assets have been launched for a total amount of U.S.$112 million and are described more in detail at the below table: Tranche Amount Period of
implementation Description
1 U.S.$52 million
20142015 Productivity improvement of the downstream facilities in Genk (CAP2), Gueugnon (CAP10) and Timoteo (Sendzimir Mill #1)
Upgrade of the Wire Rod mill in Imphy Upgrade of GO operations in Timoteo with development of
HGO 2 U.S.$30
million 20152016 Upgrade of CAP 2 in Genk
Upgrade of LC2i in Isbergues 3 U.S.$30
million 20152017 Efficiency and competitiveness improvement of the lines
CR6 and BA8 in Gueugnon Upgrade of compact box annealing furnaces of the Wire Rod
mill in Imphy As at June 30, 2016, the Leadership Journey® had contributed a total amount of U.S.$497 million to EBITDA since the beginning of 2011.
Our goal is to achieve U.S.$575 million in gains and profit enhancements by the end of 2017.
Leveraging our unique stainless steel product portfolio
We intend to continue to support the development of our wide range of products, with a focus on highmargin valueadded niche products. Because of the specialised and innovative nature of these products, we are able to earn higher margins, typically attracting higher prices than our other more commoditised products.
In order to grow our sales of highmargin valueadded niche products and replace low contribution margin products, we continue to put our focus on the development of innovative products through our research and development, while leveraging our marketing and advertising efforts for wider promotion. The investments approved by the Board of Directors as part of the Top Line strategy, which will also be improving the cost competitiveness of the Group's operations, are described in greater detail under the section "Liquidity Capital expenditures".
10

Interim Financial Report 2016
Driving additional value through the Services & Solutions segment
Our industrial footprint in Europe and South America is perfectly complemented with global service centers and sales network as part of our Services & Solutions segment. In a volatile environment, we believe that the development of the Services & Solutions segment and the provision of better services to our customers are key for achieving financial and operational excellence. Valueadded services provided to our clients include cutting, polishing, brushing, forming, welding, pickling, annealing or packaging. We believe that further development of the Services & Solutions segment will drive additional value creation while serving our customers more effectively. As part of this strategy, we continue to invest in and strengthen our service centers in Europe, Brazil and other parts of the world.
Strengthening our Leadership in the Alloys & Specialties segment
The Alloys & Specialties segment specialises in the design, production and transformation of various nickel alloys and certain specific stainless steels. These products are intended for highend applications or to address very specific customer requirements across a broad range of industries, including the oil and gas, aerospace, automotive, electronics, petrochemical and other industries. We believe that the Alloys & Specialties segment has significant growth potential which could be captured with new investments. As part of this strategy, we invested U.S.$29 million in the upstream enhancements of our Imphy plant in France with one additional induction furnace with secondary metallurgy and two additional remelting furnaces. We are also investing U.S.$16 million in the downstream debottlenecking of the finishing line of the Imphy Wire Rod mill through automation and upgrade of its assets (including U.S.$10 million announced in 2014 with Tranche 1 and U.S.$6 million announced in 2015 with tranche 3 of the Leadership Journey® upgrading program).
Maintaining strong Balance Sheet ratios consistent with Investment Grade Financial ratios
As part of our efforts to become a more resilient company capable of responding to the volatile market environment, we have reduced our net debt to U.S.$280 million at the end of June 2016, representing a gearing of 11%, compared to U.S.$454 million at the end of June 2015 representing a gearing of 19% and U.S.$1,066 million at the end of December 2010 representing a gearing of 29%. This achievement is based on a strong set of actions in optimising our debt profile and interest costs. Our most relevant and recent debt restructuring actions included:
(i) in February 2016, the extension of the final maturity date of the U.S.$400 million Secured Borrowing Base Revolving Credit Facility to March 5, 2019. The Facility is used for liquidity and working capital purposes; (ii) in June 2016, the signature of a financing contract with the European Investment Bank for an amount of €50 million. The financing contract will be dedicated to finance a research and development programme over the period 20162019 as well as the upgrade of two plants located in cohesion regions in France & Belgium (Isbergues HautsdeFrance and ChâteletHainaut).
On November 5, 2015 Aperam announced its updated financial policy to maximise the long term growth and sustainability of the Group as well as the value accretion for its shareholders while maintaining a strong balance sheet. Aperam proposed the reinstatement of a base dividend of U.S.$1.25 per share, which was approved by the shareholders at the Annual General Meeting of May 4, 2016. The dividend is being paid in four equal quarterly instalments of U.S.$0.3125 (gross) per share during 2016. The Group also aims to grow dividends progressively as Aperam continues to improve its sustainable profitability benefiting from its strategic actions. The Group targets a Net Financial Debt/EBITDA ratio of <1.0x (through the cycle). In the (unlikely) event that Net Financial Debt/EBITDA exceeds 1.0x, the Group will suspend the cash dividend.
Please refer to the section "Liquidity" of this Management Report for further details with respect to the Group's financing and to the section "LiquidityEarnings Distribution" for the detailed and updated dividend calendar for the year 2016.
11

Interim Financial Report 2016
Mémorial international de NotreDame‐de‐Lorette, AlbainSaintNazarre, France; Philippe Prost, architecte / AAPP © adagp – 2014; © Pierre
di Sciullo, graphiste © Aitor Ortiz
12

Interim Financial Report 2016
Our profit driving pillars The Group’s key profit driving pillars based on our strategic priorities can be summarised as follows:
1. We are aiming at being the best in cost with our Leadership Journey® and are targeting a contribution of U.S.$575 million to EBITDA by end of 2017.
2. We aim to optimise our product portfolio and replace low contribution margin products by high margin products with our Top Line strategy and our innovative products.
3. We aim to continue to focus on cash and the strengthening of our balance sheet.
4. We aim to grow in our Alloys & Specialties business while continuing to improve our competitiveness.
City hall of Illkirch Graffenstaden, Strasbourg, France; Architect: Atelier Fillipini; © Fillipini Material: Grade: Aperam 304 Thickness: 5 mm Surface finish : bead blasted and electropolished
13

Interim Financial Report 2016
Summary of principal risks and uncertainties The following major factors could cause actual results to differ materially from those discussed in the forwardlooking statements included throughout this interim financial report.
Global economic cycle downturn, geopolitical risks, overcapacity in the stainless steel industry and/or China slowdown;
Risks of nickel price decrease, raw material price uncertainty, material margin squeeze and over dependency of main suppliers;
Fluctuations in currency exchange rates; Litigation risks (product liability, patent infringement, commercial practices, employment, employment
benefits, taxes, environmental issues, health & safety and occupational disease (including asbestos exposure));
Risks of lack of competitiveness of the workforce costs, of retention and social conflicts; Customer risks with respect to default and credit insurance companies refusing to ensure the risks; Cyber security risks.
These factors are discussed in more details in the section “Principal risks and uncertainties related to Aperam and the stainless and specialty steel industry” of the Annual Report 2015.
Bodega Irius, Barbastro, Huesca,Spain J.Marino Pascual y Asoc. Arquitectura © Adriana Landaluce
14

Interim Financial Report 2016
Market environment Our operations results are primarily affected by external factors which impact the stainless and specialty steel industry in general, particularly stainless and electrical steel pricing, demand for stainless and specialty steels, production capacity, trends in raw material and energy prices and fluctuations in exchange rates. In addition, our operational results are affected by certain factors specific to Aperam, including several initiatives we have introduced in response to the challenging economic environment. These factors are described in greater detail below.
Stainless Steel Pricing The market for stainless steel is considered to be a global market. Stainless steel is suitable for transport over long distances as logistics costs represent a small proportion of overall costs. As a result, prices for commoditised stainless steel products evolve similarly across regions. However, in general, stainless steel products are not completely fungible due to wide variations in shape, chemical composition, quality, specifications and application, all of which impact sales prices. Accordingly, there remains a limited market for uniform pricing or exchange trading of certain stainless steel products.
Stainless steel is a steel alloy with a minimum of 10.5% chromium content by mass and a combination of alloys which are added to confer certain specific properties depending upon the application. The cost of alloys used in stainless steel products varies across products and can fluctuate significantly. Prices for stainless steel in Europe and the United States generally include two components:
> the "base price", which is negotiated with customers and depends on market supply and demand; and
> the "alloy surcharge", which is a supplementary charge added by producers to the selling price of steel and offsets price increases in raw materials, such as nickel, chromium or molybdenum, by directly passing these increases onto customers. The concept of the "alloy surcharge", which is calculated using raw material prices quoted on certain accepted exchanges, such as the London Metals Exchange ("LME"), was introduced in Europe and the United States in response to significant volatility in the price of these materials. This has historically been driven by fluctuations in demand, increasing or decreasing inventory levels, changes in production capacity and speculation by metal traders.
Notwithstanding the application of the "alloy surcharge", the Group is still affected by changes in raw material prices, in particular nickel. In general, when the price of nickel is falling, purchasers of stainless steel products delay their orders to benefit from an expected decline in prices, which has the effect of reducing demand in the short term. By contrast, when nickel prices are rising, purchasers tend to acquire larger quantities of stainless steel in order to avoid having to buy at higher prices. The nickel price evolution over the period 2015 to first half of 2016 is highlighted in the graph below under "—Nickel price on the LME (in U.S.$/tonne)".
In 2015, the price of nickel showed a gradual decline from U.S.$14,750 per tonne in early January to U.S.$8,800 at the end of December. In the first half of 2016 Nickel price averaged U.S.$8,662 per tonne, with upward price trend towards the end of the second quarter of 2016.
The graphs below shows the price of nickel on the LME and the European transaction price for CR304 stainless steel for the period from January 1, 2015 to June 30, 2016:
15

Interim Financial Report 2016
Graph: Nickel price on the LME (in U.S.$/tonne)
Graph: Stainless Steel/CR304 2B 2mm Coil Transaction Price/Southern Europe Domestic Delivered (in U.S.$/tonne)
Source: Nickel prices have been derived from the LME. Stainless steel/CR304 2B 2mm coil transaction price/Southern European domestic delivered prices have been derived from Steel Business Briefing ("SBB").
In 2015, stainless steel transaction prices continuously decreased to approximately U.S.$2,200/tonne at the end of 2015. In the first half of 2016, price averaged U.S.$2,107/tonne. Despite improved demand, restocking and capacity utilisation improvements in Europe, Aperam expects stainless steel prices to remain under pressure, primarily as a consequence of overcapacity in Asia.
16

Interim Financial Report 2016
Electrical Steel Pricing
Electrical steels prices in 2016 with regards to Grain Oriented (GO) and Nongrain oriented (NGO) moved into different directions during 2015, where the GO price had strongly increased due to tightening of demand and supply, whereas NGO prices decreased. From end of December 2015 till June 2016 NGO electrical steel prices remained stable, whereas GO prices normalized due to a new demand and supply balance as well as reduction in prices of raw materials.
Demand for Stainless and Electrical Steel and Nickel Alloys Products
Demand for stainless and electrical steel, which represents approximately 2.5% of the global steel market by volume, is affected to a significant degree by trends in the global economy and industrial production. Demand is also affected in the short term by fluctuations in nickel prices, as discussed in greater detail under ''—Stainless Steel Pricing'' above.
In 2015, global demand for stainless steel flat products contracted by 1%, primarily due to a sharp slowdown in China consumption growth and contraction in developed markets. In the first half of 2016, global stainless consumption was up 3% over same period in 2015. Management believes that global demand for stainless steel flat products is expected to increase by approximately 2% to 3% per annum from 2015 until 2019.
In the first half of 2016 the demand of GO decreased by 33% and NGO domestic market decreased by 20% compared to the first half of 2015.
Nickel Alloys market growth slowed down in 2015 compared to 2014, as the consequence of a contrasted situation, opposing healthy aerospace and electrical safety markets against depressed oil & gas markets. However, among oil & gas applications, the growing role of natural gas in the world boosted the demand for nickel alloys in this area and enabled to partially offset the general oil & gas market decreases. In the first half of 2016 these trends were confirmed, as the general oil & gas market slowdown continued. Management estimates that the global demand for nickel alloys will remain stable for the rest of the year.
Production and capacity
In 2015, global flat stainless steel production decreased by 1% primarily driven by a sharp slowdown of China’s production growth and a contraction in the developed world output as Europe was impacted by a destocking phase. Global structural overcapacity driven by China continued to affect the global stainless steel industry, as 2015 saw another year of double digit growth in flat stainless steel capacity in China, while consumption growth decelerated sharply, with almost no growth in consumption in 2015. Overcapacity continues to be a main factor weighing down China stainless industry in the first semester of 2016, with cold rolled capacity utilisation estimated below 70%.
China is not only facing a significant industry restructuring challenge, but with over 50% of global installed capacity, its industry is exerting disproportionate direct and indirect export pressures globally.
Management estimates global utilisation rates reached approximately 70% in 2014 and decreased to 64% in 2015. Global utilisation rates of the first sixmonths of 2016 are estimated similar to 2015, and forecasted to gradually improve through 2019, as global demand growth continues and China addresses its structural overcapacity.
Competition
With over 1.89 million tonnes of shipments in 2015 and 1.0 in the first half of 2016, Aperam is the largest flat stainless steel producer in South America, the second largest producer in Europe behind Outokumpu, and one of the top 10 flat stainless steel producers in the World.
Aperam’s main competitors in Europe are Outokumpu, Acerinox and Thyssenkrupp Acciai Speciali Terni S.P.A. Although antidumping duties imposed on Chinese and Taiwanese cold rolled coils significantly reduced imports from these countries, these have been partially offset by a sharp increase in imports from other nonEuropean countries.
17

Interim Financial Report 2016
Aperam remains the leading flat stainless producer in South America, with its operations based in Timoteo, Brazil. Challenging market conditions in Brazil in 2015 and in the first half of 2016, and increased competitiveness of Brazilian operations in regional markets enabled higher exports out of the Latin America region.
The global competitive landscape has transformed over the past years, with Chinese producers Tsingshan, TISCO, Baosteel and Beihai Chengde today ranking among the ten largest global flat stainless producers in the world. Antidumping developments
European Union
The rates of the definitive antidumping duty applicable to the net, freeatUnionfrontier price, before duty, are as follows:
Type of products Countries Definitive Antidumping duty (%) Effective from Cold Rolled Stainless Steel Flat Products
People Republic of China From 24.4% up to 25.3% March 26, 2015*
Cold Rolled Stainless Steel Flat Products
Taiwan 6.8% except Chia Far 0% March 26, 2015*
* Entry in force from the day following that of the publication of the provisional measures in the Official Journal of the European Union. The measures have been implemented for a 5yearperiod.
18

Interim Financial Report 2016
Brazil
During 2012, Brazil's Trade Defence Department (''Decom''), an investigative body under the Brazilian Ministry of Development, Industry and Foreign Trade, opened an antidumping investigation against imports from several countries for welded austenitic stainless pipes, flat stainless steel products and flat nongrain oriented products and imposed antidumping duties for a period of 5 years as described below (no evolution since December 2015):
Type of products Import duties status Antidumping (“AD”) status Stainless Steel Flat Products CR 304 and 430, in thicknesses between 0.35mm and 4.75mm
Normal import duties are 14%
AD duties starting October 4, 2013 for 5 years from U.S.$236/tonne to U.S.$1,077/tonne for imports. Countries involved are China, Taiwan, South Korea, Vietnam, Finland and Germany.
Stainless Steel Welded Tubes in thickness between 0.4mm to 12.70mm
Normal import duties are 14%
AD duties starting July 29, 2013 for 5 years from U.S.$360/tonne up to U.S.$911/tonne. Countries involved are China and Taiwan.
Electrical steel – Non Grain Oriented
Normal import duties are 14%
AD duties starting July 17 2013 for 5 years from U.S.$133/tonne to U.S.$567/tonne. The countries involved are China, Korea and Taiwan. On August 15, 2014, Camex released AD partially, allowing 45 thousand tonnes of imports in the next 12 months to be without AD penalties. On August 12, 2015, Camex announced 11 thousand tonnes of free AD quota until the end of the Public Interest investigation in November 2015. AD rights payment would be subject to final investigation decision. On November 4, 2015 Camex announced the end of the Public Interest investigation that cancel free AD import quotas published in August 12, 2015 and established AD duties from U.S.$90/tonne to U.S.$132/tonne (valid until 2018) – from China, Taiwan and South Korea. Also announced a call for importers to make the payment of the AD rights for the material imported during the quota period from August 2015 to November 2015.
Electrical steel – Grain Oriented
Normal import duties are 14%
19

Interim Financial Report 2016
Raw Materials and Energy
Raw Materials
Stainless and specialty steel production requires substantial amounts of raw materials (primarily nickel, chromium, molybdenum, stainless and carbon steel scrap, charcoal (biomass) and iron ore). Except for charcoal, which is produced internally, we are exposed to price uncertainty with respect to each of these raw materials, which we typically purchase under shortterm and longterm supply contracts, as well as on the spot market.
Prices for these raw materials are strongly correlated with demand for stainless steel and carbon steel and accordingly tend to fluctuate in response to changes in supply and demand dynamics in the industry. In addition, since most of the raw materials we use are finite resources, their prices may also fluctuate in response to any perceived scarcity of reserves and the evolution of the pipeline of new exploration projects to replace depleted reserves. In 2015, the nickel price, like most other commodity prices, suffered from oversupply and the weaker Chinese economy. The European benchmark price for ferrochrome was stable at U.S.$1.08 per pound of chrome from January till September but dropped to U.S.$1.04 per pound of chrome in the fourth quarter. Like nickel, molybdenum prices saw a big correction from U.S.$20,000 per tonne in January to U.S.$10,000 per tonne in November, followed by a moderate recovery to U.S.$11,000 per tonne in December as some capacity was idled. The reference iron ore price (62% Fe2O3; CIF China) also continued its fall in 2015, from U.S.$70 per tonne in January to U.S.$40 per tonne by end December 2015. Ferrous scrap prices (E8 quality; Western Europe) followed the iron ore trend with some delay and started the year relatively stable in a range of €230 – €240 per tonne but decreased as of July to end the year at €170 per tonne.
In the first half of 2016, nickel continued to trade sideways around U.S.$8,600 per tonne, still depressed by a large stock overhang on the LME and SHFE exchanges. It was only at the end of June that nickel clearly broke out of the horizontal trading range and increased to above U.S.$10,000 in early July. The European benchmark price for ferrochrome dropped to U.S.$0.92 per pound of chrome in the first quarter and fell further to U.S.$0.82 per pound of chrome in the second quarter, mirroring weaker prices in the Chinese market. Molybdenum continued its recovery from end 2015 and the price gradually rose to an average of U.S.$17,400 per tonne as supply continued to decrease. Iron ore showed a volatile price evolution, strongly influenced by news and expectations on the Chinese economy. Starting at U.S.$43 per tonne in January, the reference price (62% Fe2O3; CIF China) peaked at U.S.$69 per tonne in April and fell back to around U.S.$54 per tonne in June. Volatility in ferrous scrap prices was even higher with a low of €180 per tonne in the first quarter and a high of €267 per tonne in May and a correction back to €212 per tonne in June. The Company’s production facilities use both the traditional blast furnace process as well as the electric arc furnace steelmaking process. In Brazil, the Company predominantly uses the traditional blast furnace production process, which requires, among other materials, iron ore and charcoal (biomass). In Europe, the electric arc furnaces at its Châtelet and Genk production facilities use stainless and carbon steel scrap as key raw material inputs. In addition, the Company uses nickel, chromium and molybdenum, among other materials, in its products. Energy
With regard to natural gas, as part of the Leadership Journey®, the Timóteo production facility in Brazil switched from LPG to natural gas in 2011 and entered into a longterm natural gas supply contract with a Brazilian supplier. As from 2015, the Group purchases in Europe most of its natural gas through a new supply contract that has been put in place with ArcelorMittal Energy Sca. With regard to electricity, in most of the countries where the Group operates, electricity prices have moved in line with other energy commodities. The Group benefits from access to baseload nuclear power in France. Complementary needs are sourced from the market. In France, a new supply contract has been put in place with ArcelorMittal Energy Sca since the beginning of 2016 and for the Belgium perimeter such contract was already in place since the beginning of 2015. Brazilian power prices have experienced a bearish trend in 2015 as compared to a 2014 peak, which continued during the first six months of 2016 amid lower industrial demand.
With regard to industrial gases, the Group procures its industrial gas requirements using short or longterm contracts with various suppliers in different geographical regions.
20

Interim Financial Report 2016
Impact of exchange rate movements
At the end of 2015, the U.S. dollars amounted to 1.0887 €/U.S.$ and 0.2561 R$/U.S.$. In the first half of 2016, the U.S. dollar depreciated by 2% against the Euro to reach 1.1102 €/U.S.$ at halfyear end. In the first half of 2016, the U.S. dollar depreciated by 22% against the Brazilian real to reach 0.3115 R$/U.S.$ at halfyear end. Because a substantial portion of Aperam's assets, liabilities, sales and earnings are denominated in currencies other than the U.S. dollar (its presentation currency), Aperam has exposure to fluctuations in the values of these currencies relative to the U.S. dollar. These currency fluctuations, especially the fluctuation of the U.S. dollar relative to the Euro and Brazilian real, as well as fluctuations in the currencies of the other countries in which Aperam has significant operations and sales, can have a material impact on its results of operations. In order to minimize its currency exposure, the Group enters into hedging transactions to lock in a set exchange rate for specific transactions in nonlocal currencies, in accordance with its management policies.
Refuge du Goûter, Chamonix, France, © Copyright Groupe H
21

Interim Financial Report 2016
Operational review Aperam reports its operations in three segments: Stainless & Electrical Steel, Services & Solutions and Alloys & Specialties. The information in this section relates to the six months ended June 30, 2016, compared to the six months ended June 30, 2015. The key performance indicators that we use to analyse operations are sales, steel shipments, average steel selling prices and operating result. Key Indicators The key performance indicators that we use to analyse operations are sales, steel shipments, average steel selling prices and operating result. Our analysis of liquidity and capital resources is based on operating cash flows. Sales, Steel Shipments and Average Steel Selling Prices The following table provides our sales, steel shipments and average selling prices by operating segment for the six months ended June 30, 2016 as compared to the six months ended June 30, 2015:
Sales for the Six Months
Ended June 30, (1) (2) Steel Shipments for
the Six Months Ended June 30, (1) (3)
Average Selling Price for the Six Months Ended June 30, (1)
Changes in
Operating segment 2016 2015 2016 2015 2016 2015 Sales
Steel Shipments
Average Steel Selling Price
(in millions of U.S. dollars) (in thousands of
tonnes) (in U.S. dollars/tonne) (%)
Stainless & Electrical Steel(4) 1,808 2,070 990 942 1,776 2,114 (12.7) 5.1 (16.0)
Services & Solutions
1,019 1,094 423 390 2,292 2,664 (6.9) 8.5 (14.0)
Alloys & Specialties 216 311 16 20 13,223 15,137 (30.5) (20.0) (12.6) Total (before intragroup eliminations)
3,043 3,475 1,429 1,352 (12.4) 5.7
Total (after intragroup eliminations)
2,197 2,522 1,003 955 (12.9) 5.0
Notes: (1) Due to the transfer of the Business Unit "Precision" from the segment "Services & Solutions" to the segment "Stainless & Electrical
Steel" as from January 1, 2016, segmented figures for the half year ended June 30, 2015 have been restated.
(2) Amounts are shown prior to intragroup eliminations. For additional information, see Note 2 to the Condensed Consolidated Financial Statements
(3) Stainless & Electrical Steel shipment amounts are shown prior to intersegment shipments of 426 thousand tonnes and 397 thousand tonnes in the six months ended June 30, 2016 and 2015, respectively.
(4) Includes shipments of special carbon steel from the Company’s Timóteo production facility.
22

Interim Financial Report 2016
Sales decreased by 12.9% to U.S.$2,197 million for the six months ended June 30, 2016 from U.S.$2,522 million for the six months ended June 30, 2015. The decrease in sales was due to lower average steel selling price, which decreased by 16.5% to U.S.$2,117 per tonne for the six months ended June 30, 2016 from U.S.$2,535 per tonne for the six months ended June 30, 2015, partly offset by higher shipments, which increased by 5.0% to approximately 1,003 thousand tonnes for the six months ended June 30, 2016 from 955 thousand tonnes for the six months ended June 30, 2015. Stainless & Electrical Steel Sales in the Stainless & Electrical Steel segment (including intersegment sales) decreased by 12.7% to U.S.$1,808 million for the six months ended June 30, 2016 from U.S.$2,070 million for the six months ended June 30, 2015, mainly as a result of decreased average steel selling price, partly offset by higher shipment volumes. The average steel selling price for the Stainless & Electrical Steel segment decreased by 16.0%, to U.S.$1,776 per tonne for the six months ended June 30, 2016 from U.S.$2,114 per tonne for the six months ended June 30, 2015. Steel shipments for this segment (including intersegment shipments) increased to 990 thousand tonnes for the six months ended June 30, 2016 from 942 thousand tonnes for the six months ended June 30, 2015, which represented an increase of 5.1%. Sales to external customers in the Stainless & Electrical Steel segment were U.S.$1,003 million for the six months ended June 30, 2016, representing 45.7% of total sales, a decrease of 13.2% as compared to sales to external customers of U.S.$1,155 million for the six months ended June 30, 2015, or 45.8% of total sales.
Services & Solutions Sales in the Services & Solutions segment (including intersegment sales) decreased by 6.9% to U.S.$1,019 million for the six months ended June 30, 2016 from U.S.$1,094 million for the six months ended June 30, 2015. The decrease was due to lower average stainless steel selling price, partly offset by higher shipment volumes. The average steel selling price for the Services & Solutions segment decreased by 14.0%, to U.S.$2,292 per tonne for the six months ended June 30, 2016 from U.S.$2,664 per tonne for the six months ended June 30, 2015. Steel shipments for this segment increased to 423 thousand tonnes for the six months ended June 30, 2016 from 390 thousand tonnes for the six months ended June 30, 2015, which represented an increase of 8.5%. Sales to external customers in the Services & Solutions segment were U.S.$981 million for the six months ended June 30, 2016, representing 44.7% of total sales, a decrease of 7.2% as compared to sales of U.S.$1,057 million for the six months ended June 30, 2015, or 41.9% of total sales.
Alloys & Specialties Sales in the Alloys & Specialties segment decreased by 30.5% to U.S.$216 million for the six months ended June 30, 2016 from U.S.$311 million for the six months ended June 30, 2015. The decrease was primarily due to lower average stainless steel selling price and lower shipments. The average steel selling price for the Alloys & Specialties segment decreased by 12.6% to U.S.$13,223 per tonne for the six months ended June 30, 2016 compared to U.S.$15,137 per tonne for the six months ended June 30, 2015. Steel shipments for this segment were 16 thousand tonnes for the six months ended June 30, 2016, which is a 20.0% decrease compared to the 20 thousand tonnes for the six months ended June 30, 2015.
Sales to external customers in the Alloys & Specialties segment were U.S.$212 million for the six months ended June 30, 2016, representing 9.6% of total sales, a decrease of 31.4% as compared to sales to external customers of U.S.$309 million for the six months ended June 30, 15 or 12.3% of total sales. Operating Income
The Group’s operating income for the six months ended June 30, 2016 was U.S.$153 million, compared to an operating income of U.S.$195 million for the six months ended June 30, 2015. The decreased operating profit for the six months ended June 30, 2016 compared to the six months ended June 30, 2015 is mainly driven by very challenging economic environment with a very significant drop on average steel selling prices.
The following table provides our operating income and operating margin for the six months ended June 30, 2016 as compared with the six months ended June 30, 2015:
23

Interim Financial Report 2016
Operating Income for the Six Months Ended June 30,
Operating Margin for the Six Months Ended June 30,
2016 2015 2016 2015
Operating Segment (in millions of U.S. dollars) (%)
Stainless & Electrical Steel 120 170 6.6 8.2
Services & Solutions 39 22 3.8 2.0
Alloys & Specialties 10 24 4.6 7.7
Total(1) 153 195 7.0 7.7
(1) Amounts shown include eliminations of U.S.$(16) million and U.S.$(21) million for the six months ended June 30, 2016 and 2015, respectively, which includes all operations other than those that are part of the Stainless & Electrical Steel, Services & Solutions and Alloys & Specialties operating segments, together with intersegment eliminations and/or nonoperational items which are not segmented.
Stainless & Electrical Steel The operating income for the Stainless & Electrical Steel segment was U.S.$120 million for the six months ended June 30, 2016 compared to an operating income of U.S.$170 million for the six months ended June 30, 2015. The operating result for the six months ended June 30, 2016 decreased compared to the six months ended June 30, 2015 in the Stainless & Electrical Steel segment mainly as a result of huge decrease on average steel selling price.
Services & Solutions The operating income for the Services & Solutions segment was U.S.$39 million for the six months ended June 30, 2016 compared to an operating income of U.S.$22 million for the six months ended June 30, 2015. This increased operational result was mainly due to high record of shipments.
Alloys & Specialties The operating income for the Alloys & Specialties segment was U.S.$10 million for the six months ended June 30, 2016, compared to an operating income of U.S.$24 million for the six months ended June 30, 2015. This decreased operational result was primarily due to product mix and decrease in average steel selling prices. Interest Income
Interest income was U.S.$2 million for the six months ended June 30, 2016, compared to U.S.$2 million recorded for the six months ended June 30, 2015, mainly due to interest income on shortterm investments in Brazil. Interest Expense and Other Net Financing Costs
Interest expense and other net financing costs include interest expense, net foreign exchange and derivative results and other net financing costs. Interest expense and other net financing costs decreased to U.S.$24 million for the six months ended June 30, 2016, compared to U.S.$47 million for the six months ended June 30, 2015.
Excluding foreign exchange and derivative result described below, interest expense and other financing costs for the six months ended June 30, 2016 were U.S.$24 million, primarily related to financing costs of U.S.$8 million, compared to interest expense and other financing costs of U.S.$52 million for the six months ended June 30, 2015, primarily related to financing costs of U.S.$19 million. Financing costs relate to interests and other expenses related to the service of debt and other financing facilities. The decrease in financing costs is primarily related to refinancing of remaining outstanding high yield bonds in 2015, improved financing conditions and reduction of net financial indebtedness.
Realised and unrealised foreign exchange and derivative gains were nil for the six months ended June 30, 2016, compared to realised and unrealised foreign exchange and derivative gains of U.S.$5 million for the six months ended June 30, 2015. Foreign exchange results primarily relate to the accounting revaluation of U.S. dollar denominated short
24

Interim Financial Report 2016
term investments by subsidiaries and the revaluation of Euro denominated deferred tax assets on tax losses in the parent company. Results on derivatives primarily relate to financial instruments we entered into to hedge our exposure to nickel prices which do not qualify for hedge accounting treatment under IAS 39. Income Tax We recorded an income tax expense of U.S.$29 million for the six months ended June 30, 2016, compared to an income tax expense of U.S.$35 million for the six months ended June 30, 2015. Our income tax expense in 2016 was primarily due to positive operational results in several countries. The decrease by U.S.$6 million in income tax expense for the six months ended June 30, 2016 compared to the six months ended June 30, 2015 is primarily due to the decrease in the result before tax from a profit before tax of U.S.$144 million for the six months ended June 30, 2015 to a profit before tax of U.S.$131 million for the six months ended June 30, 2016. Net Income Attributable to Equity Holders of the Parent
Our net result was a profit of U.S.$102 million for the six months ended June 30, 2016, compared to a profit of U.S.$108 million for the six months ended June 30, 2015.
Related Party Transactions
We are engaged in certain commercial and financial transactions with related parties. Please refer to the Condensed Consolidated Statement of Operations for the six months ended June 30, 2016 and to Note 21 to the Consolidated Financial Statements as of December 31, 2015 for further details. Liquidity Liquidity and Capital Resources The Group’s principal sources of liquidity are cash generated from its operations and its credit facilities at the corporate level.
Because Aperam S.A. is a holding company, it is dependent upon the earnings and cash flows of, and dividends and distributions from, its operating subsidiaries to pay expenses and meet its debt service obligations.
In management’s opinion, the Group’s operations and credit facilities are sufficient to meet the Group’s present requirements.
Our cash and cash equivalents amounted to U.S.$192 million and U.S.$148 million as of June 30, 2016 and December 31, 2015, respectively.
Our total debt, which includes longterm debt and shortterm debt, was U.S.$472 million and U.S.$464 million as of June 30, 2016 and December 31, 2015, respectively. Net debt, defined as longterm debt plus shortterm debt less cash and cash equivalents (including short term investments), was U.S.$280 million as of June 30, 2016 compared to U.S.$316 million at December 31, 2015. Gearing, defined as net debt divided by total equity, was 11% as of June 30, 2016 compared to 14% as of December 31, 2015.
As of June 30, 2016, no amount of the Borrowing Base Facility was drawn, leaving a committed credit line of U.S.$400 million under the facility(1). In addition, as of June 30, 2016, Aperam had U.S.$24 million of debt outstanding at the subsidiary level, of which the Company had granted security over U.S.$21 million of indebtedness. As of June 30, 2016, the Company had total liquidity of U.S.$647 million, consisting of cash and cash equivalents (including short term investments) of U.S.$192 million and committed credit lines(1) of U.S.$456 million (borrowing base facility of U.S.$400 million and EIB financing of €50 million described below). As of December 31, 2015, the Company had total liquidity of U.S.$548 million, consisting of cash and cash equivalents (including short term investments) of U.S.$148 million and committed credit lines(1) of U.S.$400 million.
(1) Subject to eligible collateral available
25

Interim Financial Report 2016
These facilities, which include debt held at the subsidiary level, together with other forms of financing, including the convertible bonds, represent an aggregate amount of approximately U.S.$1 billion, with borrowing capacity of U.S.$456 million. In management’s opinion, such financing will be sufficient for our future requirements.
Financing Borrowing Base Facility
On March 6, 2015 Aperam signed a U.S.$500 million secured borrowing base revolving credit facility (“The Facility”) with a group of nine banks. The facility is structured as a 3year revolving credit facility and includes a one year extension option. It will be used for liquidity and working capital purposes. On December 1, 2015, Aperam cancelled a U.S.$100 million of commitments leading to a remaining U.S.$400 million secured borrowing base revolving credit facility. On May 26, 2016 Aperam extended the credit facility until March 5, 2019. EIB Financing
On June 27, 2016, Aperam and the European Investment Bank (EIB) announced the signature of a financing contract of an amount of €50 million which will be dedicated to finance a research and development programme over the period 20162019 as well as the upgrade of two plants located in cohesion regions in France & Belgium (Isbergues HautsdeFrance and ChâteletHainaut).This project was funded under the Investment Plan for Europe, also named " Juncker Plan”, of which France is one of the main beneficiary countries with 35 operations launched to date by the EIB Group for a total amount of €1.7 billion, which should generate €15 billion of additional investments.The financing contract is senior unsecured and is available for eighteen month following the signature date. Loans can be drawn for five years maturity with bullet repayment or for ten years maturity with progressive amortisation of principal. Notes
On March 28, 2011, Aperam issued U.S. dollar denominated notes of U.S.$250 million aggregate principal amount of its 7.75% notes due 2018, in a private placement in the international capital markets. On April 1, 2015, Aperam called and early redeemed U.S.$250 million aggregate principal amount of its 7.75% notes due 2018.
Convertible bonds
Convertible and/or exchangeable bonds due 2020
On September 19, 2013, Aperam announced the successful placing and pricing of its offering of convertible and/or exchangeable bonds for U.S.$200 million (the “bonds” hereafter). The bonds are convertible into new or existing ordinary shares of the Company. The Significant Shareholder, subscribed for U.S.$81.8 million of bonds, equal to its 40.8% stake in the Company’s share capital. The bonds are senior and unsecured, and ranking equally in right of payment with all other existing and future senior unsecured indebtedness and senior in right of payment to all existing and future subordinated indebtedness. They have an annual coupon of 2.625% payable semiannually in arrear and an initial conversion price of U.S.$21.96. The bonds were issued and will be redeemed at 100% of their principal amount and will, unless previously redeemed, converted, purchased and cancelled under certain conditions, mature on September 30, 2020. The Company will have the option to redeem the bonds at their principal amount plus accrued interest on or after October 15, 2017, if the parity value (translated into U.S.$ at the prevailing exchange rate), shall have exceeded 130% of the bonds’ principal amount. Bondholders will be entitled to have their bonds redeemed at their principal amount plus accrued interest on September 30, 2017.
Unless previously redeemed, or purchased and cancelled, each bond will be convertible and/or exchangeable into shares at the option of the bondholder during the conversion period. The delivery of new and/or existing shares is at Aperam’s absolute discretion, subject to the limits and conditions set out below. Should the number of new shares to be issued be in excess of the number of new shares which Aperam is authorised to issue, Aperam will deliver existing shares. On the basis of the current conversion ratio convertible, the issuance of up to 9,107,468 new shares would be required to deliver the necessary new shares upon conversion of the bonds.
26

Interim Financial Report 2016
Net share settled convertible and/or exchangeable bonds due 2021
On June 27, 2014, Aperam announced the successful placing and pricing of its offering of net share settled convertible and/or exchangeable bonds due 2021 (the “bonds” hereafter). Following the success of the Offering, the Company decided to exercise in full the extension clause in order to increase the initial Offering size to U.S.$300 million. The net proceeds of the Offering are being used for general corporate purposes and the refinancing of existing indebtedness (including senior notes maturing in 2016 as described above under “— Notes”). The issue of the bonds reflects the proactive approach of the Company to optimising its debt profile and interest costs.
The Bonds are senior and unsecured, and ranking equally in right of payment with all other existing and future senior unsecured indebtedness and senior in right of payment to all existing and future subordinated indebtedness.
The bonds have an annual coupon of 0.625% payable semiannually in arrear and an initial conversion price of U.S.$43.92 representing a conversion premium of 32.5% above the reference price of U.S.$33.15 (based on the volumeweighted average price of the Company’s shares on Euronext Amsterdam between launch and pricing of €24.3453, and an exchange rate of €1=U.S.$1.3616). The bonds will be issued and redeemed at 100% of their principal amount and will mature on July 8, 2021 (7 years), unless previously redeemed, converted, exchanged or purchased and cancelled.
The Company has the option to redeem the Bonds at their principal amount plus accrued interest on or after July 23, 2018 (4 years plus 15 days), if the parity value (translated into U.S.$ at the prevailing exchange rate), shall have exceeded 130% of the Bonds’ principal amount.
Bondholders will be entitled to have their Bonds redeemed at their principal amount plus accrued interest on January 8, 2019 (4.5 years).
In case of exercise of their conversion right, bondholders shall receive, unless the Company elects otherwise, an amount in cash corresponding to the outstanding principal amount and, as the case may be, a number of new and/or existing Aperam shares corresponding to the value in excess thereof. The Company also has the option to elect to deliver new and/or existing shares only.
If the Company is unable to satisfy the conversion right in whole or in part through the issue or delivery of Shares, the Company will pay an equivalent cash amount.
The Bonds were issued and settled on July 8, 2014. Application was made to have the Bonds admitted to trading on the Open Market (“Freiverkehr”) of the Frankfurt Stock Exchange.
Pursuant to the terms and conditions of the Bonds, the conversion price adjustments to the bonds in connection with the dividend payments are available on the Company’s website www.aperam.com, section “Investors & shareholders” > “Fixed Income Investors Bonds”.
27

Interim Financial Report 2016
True Sales of Receivables Program Following the spinoff, the Group obtained liquidity from the sale of receivables through a true sale of receivables (“TSR”) program. As of the end of June 2012 the program was subsequently split into two programs under similar terms and conditions to the existing program. The maximum combined amount of the programs that could be utilised as of the end of June 2016 was €280 million. Through the TSR program, the Group and certain of its operating subsidiaries surrender the control, risks and benefits associated with the accounts receivable sold, allowing it to record the amount of receivables sold as a sale of financial assets and remove the accounts receivable from its statement of financial position at the time of the sale. The total amount of receivables sold under the True Sale of Receivables program and derecognised in accordance with IAS 39 for the six months ended June 30, 2016 and 2015 was respectively U.S.$0.7 billion and U.S.$0.8 billion. Expenses incurred under the TSR program (reflecting the discount granted to the acquirers of the accounts receivable) are recognised in the statement of operations as financing costs and amounted to U.S.$3 million and U.S.$5 million for the six months ended June 30, 2016 and 2015, respectively.
Credit ratings
The following tables provide an overview of the Group’s credit ratings evolution since our creation:
Rating Issuer Longterm rating Outlook
Moody's Ba1 Stable
Standard & Poor's BB+ Stable
Moody's
Date Revision Rating Outlook
January 2011 Initiate Ba2 stable
November 2011 Downgrade Ba3 negative
November 2012 Downgrade B1 negative
May 2014 Outlook revision B1 positive
November 2014 Upgrade Ba3 positive
April 2015 Upgrade Ba2 positive
February 2016 Upgrade Ba1 stable
28

Interim Financial Report 2016
Standard & Poor’s
Date Revision Rating Outlook
April 2011 Initiate BB stable
October 2011 Outlook revision BB negative
June 2012 Downgrade BB negative
November 2012 Downgrade B+ negative
July 2014 Outlook revision B+ positive
November 2014 Upgrade BB stable
April 2015 Upgrade BB stable
December 2015 Upgrade BB+ stable
Earnings distribution On November 5, 2015, Aperam declared its financial policy to maximise the long term growth and sustainability of the Group as well as value accretion for its shareholders while maintaining a strong balance sheet.
On May 4, 2016, at the 2016 Annual General Meeting, the shareholders approved a base dividend of U.S.$1.25 per share. The dividend is being paid in four equal quarterly instalments of U.S.$0.3125 (gross) per share.
On July 27, 2016, Aperam announced a change to its dividend calendar for 2016 with the payment date of the 3rd quarterly payment to take place on September 9, 2016 instead of September 12, 2016 (the other dates remaining identical to the detailed dividend calendar announced on February 10, 2016). This change follows a recommendation of the Dutch Advisory Committee Securities Industry to avoid corporate transactions close to the migration date of the securities settlement system to a harmonised European system.
The dividend is anticipated to progressively increase over time as the company continues to improve its sustainable profitability benefiting from its strategic actions. The Group targets a Net Financial Debt/EBITDA ratio of <1.0x (through the cycle). In the (unlikely) event that Net Financial Debt/EBITDA exceeds 1.0x, the Group will suspend the cash dividend. Dividends are announced in U.S. dollars. They are paid in U.S. dollars for shares traded in the United States on the overthecounter market in the form of New York registry shares and paid in Euro for shares listed on the European Stock Exchanges (Netherlands, France, Luxembourg). Dividends to be paid in Euro are converted from U.S. dollars to Euro based on the European Central Bank exchange rate at the date mentioned in the table below. A Luxembourg withholding tax of 15% is applied on the gross dividend amounts.
29

Interim Financial Report 2016
The updated detailed detailed dividend schedule for 2016 following the change announced on July 27, 2016 is as follows: 1st Quarterly
Payment (interim)
2nd Quarterly Payment
3rd Quarterly Payment
4th Quarterly Payment
Announcement date 07 March 2016 17 May 2016 16 August 2016 15 November 2016 ExDividend 10 March 2016 20 May 2016 19 August 2016 18 November 2016 Record Date 11 March 2016 23 May 2016 22 August 2016 21 November 2016 Payment Date 30 March 2016 14 June 2016 9 September 2016 12 December 2016
FX Exchange rate 09 March 2016 19 May 2016 18 August 2016 17 November 2016
Castelao stadium, Fortaleza, Brazil © Copyright Ceara state Government. Vigliecca & Associados
30

Interim Financial Report 2016
Sources and Uses of Cash The following table presents a summary of our cash flow for the six months ended June 30, 2016, as compared to the six months ended June 30, 2015:
Summary of Cash Flows
Six months ended June 30,
2016 2015
(in millions of U.S. dollars)
Net cash provided by operating activities 151 158
Net cash used in investing activities (58) (56)
Net cash used in financing activities (56) (214)
Net cash provided by Operating Activities Net cash provided by operating activities amounted to U.S.$151 million for the six months ended June 30, 2016, compared to U.S.$158 million for the six months ended June 30, 2015. The net cash provided by operating activities in six months ended June 30, 2016 slightly decreased by U.S.$7 million compared to the six months ended June 30, 2015 mainly on account of lower operating result, partly offset by a better ratio of conversion of operating income into cash.
Net cash used in Investing Activities
Net cash used in investing activities amounted to U.S.$58 million for the six months ended June 30, 2016, compared to U.S.$56 million for the six months ended June 30, 2015. The net cash used in investing activities for the six months ended June 30, 2016 was mainly related to capital expenditures for U.S.$58 million compared to U.S.$58 million for the six months ended June 30, 2015.
Net Cash used in Financing Activities Net cash used in financing activities was U.S.$56 million for the six months ended June 30, 2016, compared to net cash used in financing activities of U.S.$214 million for the six months ended June 30, 2015. Net cash used in financing activities for the six months ended June 30, 2016 was primarily due to U.S.$48 million of dividend payments. Net cash used in financing activities for the six months ended June 30, 2015 was primarily due to U.S.$250 million early reimbursement of the notes maturing in 2018, partly offset by U.S.$50 million net drawings on the Borrowing Base Facility.
Equity
Equity attributable to the equity holders of the parent increased to U.S.$2,461 million at June 30, 2016, as compared to U.S.$2,217 million at December 31, 2015, primarily due to foreign currency translation differences of U.S.$212 million and net income for the period of U.S.$102 million, partly offset by dividend declaration of U.S.$97 million.
Trend Information
All of the statements in this “Trend Information” section are subject to and qualified by the information set forth under the “Disclaimer ForwardLooking Statements”. See also above “Summary of principal risks and uncertainties”.
On July 27, 2016, the Company released its second quarter 2016 results which are available on the Company’s website www.aperam.com, section “Investors & shareholders” > ”Earnings”. As part of its prospects, the Company announced that EBITDA in Q3 2016 is expected to be comparable to EBITDA in Q2 2016 and that net debt is to continue to decrease in Q3 2016 versus Q2 2016.
31

Interim Financial Report 2016
Recent Developments On February 17, 2016, Moody's Investors Service upgraded Aperam’s corporate family rating to Ba1 from Ba2. The
outlook is stable. On March 6, 2016, Aperam announced the publication of its 2015 Annual Report. On April 4, 2016, Aperam announced the publication of the convening notice for its Annual General Meeting of
shareholders to be held on May 4, 2016.
On April 6, 2016, Aperam announced the publication of its “made for life” report for 2015, which constitutes Aperam's sustainability performance report.
On May 4, 2016, Aperam announces that the Annual General Meeting of Shareholders of Aperam held in
Luxembourg on the same day approved all resolutions on the agenda by a large majority. On June 27, 2016, Aperam and the European Investment Bank announced the signature of a financing contract of
an amount of €50 million which will be dedicated to finance a research and development programme over the period 20162019 as well as the upgrade of two plants located in cohesion regions in France & Belgium (Isbergues HautsdeFrance and ChâteletHainaut).
On July 27, 2016, Aperam announced a change to its dividend calendar for 2016 with the payment date of the 3rd
quarterly payment to take place on September 9, 2016 instead of September 12, 2016 (the other dates remaining identical to the detailed dividend calendar announced on February 10, 2016). This change follows a recommendation of the Dutch Advisory Committee Securities Industry to avoid corporate transactions close to the migration date of the securities settlement system to a harmonised European system.
Recent Developments in Legal Proceedings
The Company is party to various environmental liabilities, labor disputes, tax and other claims, the most significant are described in Note 23 to the consolidated financial statements as of and for the year ended December 31, 2015. Changes in contingencies since December 31, 2015 are described in Note 11 to the Condensed Consolidated Financial Statements.
Atomium, Brussels, Belgium; © Copyright Adagp
32

Interim Financial Report 2016
Corporate Governance Please refer to the “Corporate Governance” section of Aperam’s Annual Report 2015 for a complete overview. Aperam’s Annual Report is available on www.aperam.com under "Investors & shareholders" > "Aperam Financial Reports". The purpose of the present section is solely to describe the events and changes affecting the corporate governance of Aperam between December 31, 2015 and June 30, 2016.
Election of members of the Board of Directors
On May 4, 2016, the Annual General Meeting of Shareholders approved the reelection of Mr. Lakshmi N. Mittal, Mr. Romain Bausch, Ms. Kathryn A. Matthews and Mr. Aditya Mittal as Members of the Board of Directors of Aperam for a term of three years.
Authorisation of grants of share based incentives
On May 4, 2016, the Annual General Meeting of Shareholders authorised the Board of Directors to issue up to 220,000 of the Company’s fully paidup ordinary shares under the Leadership Team Performance Share Unit Plan (the “LT PSU Plan”). These shares can be newly issued shares or treasury shares. The Board of Directors may consider appropriate rules to implement the LT PSU Plan, including other retention based grants below the level of the Leadership Team. Awards under the LT PSU Plan are subject to the fulfillment of cumulative performance criteria over a threeyear period from the date of the PSU grant (development of Total Shareholder Return and Earnings per Share compared to a peer group of companies over a three year period). The details of the LT PSU Plan are described in the convening notice as well as in an explanatory presentation available on www.aperam.com, section “Investors & shareholders” > “Equity Investors” > “Shareholders’ Meetings”, > “4 May 2016 Annual General Meeting of Shareholders”.
Board of Directors and Committee composition
The members of the Board of Directors as well as their memberships to the Board’s Committees as of the date of this interim financial report are set forth below.
Name Position within the Company Date joined Board Term Expires
Mr. Lakshmi N. Mittal Chairman, Nonindependent member of the Board of Directors
December 2010 May 2019
Mr. Romain Bausch(1) (2) Lead Independent Director, Independent member of the Board of Directors
January 2011 May 2019
Mr. Joseph Greenwell(1) (2) Independent member of the Board of Directors
May 2013 May 2017
Ms. Kathryn A. Matthews(2) Independent member of the Board of Directors
December 2010 May 2019
Mr. Aditya Mittal Nonindependent member of the Board of Directors
December 2010 May 2019
Ms. Laurence Mulliez(1) Independent member of the Board of Directors
May 2011 May 2017
Mr. Philippe Darmayan Nonindependent member of the Board of Directors
May 2015 May 2018
Notes: Company Secretary: Mr. Laurent Beauloye (1) Member of the Audit and Risk Management Committee. (2) Member of the Remuneration, Nomination and Corporate Governance Committee.
33
Interim Financial Report 2016
Familistère (Family Lodgings) in Montreuil, France; Architect: Archi5; © Sergio Grazia Material: Grade : K36; Surface finish : Uginox Bright; Thickness : 0.80 mm; Surface / Volume: 6T 1000sqm
34

Interim Financial Report 2016
Statement of Responsible Persons July 27, 2016
We confirm, to the best of our knowledge, that:
1. the Condensed Consolidated Financial Statements of Aperam presented in this Interim Financial Report 2016, prepared in conformity with International Accounting Standard 34,Interim Financial Reporting, as adopted in the European Union, give a true and fair view of the assets, liabilities, financial position, and results of Aperam and the undertakings as of June 30, 2016 and for the six months period then ended included within the consolidation taken as a whole; and
2. the interim management report includes a fair review of the development and performance of the business and
position of Aperam and the undertakings included within the consolidation taken as a whole, together with a description of the principal risks and uncertainties they face.
For and on behalf of the Board of Directors Mr. Philippe Darmayan
Chief Executive Officer Mr. Timoteo di Maulo
Chief Financial Officer Mr. Sandeep Jalan
35

Interim Financial Report 2016
Aperam Condensed Consolidated Statement of Operations
(in millions of U.S. dollars except share and per share data)
Six months ended June 30, 2016 2015
Sales (Note 2) (including 35 and 82 of sales to related parties in 2016 and
2015, respectively) 2,197 2,522 Cost of sales (including depreciation and impairment of 82 and 93, and purchases from related parties of 96 and 111 for 2016 and 2015,
respectively) (1,950) (2,223) Gross margin 247 299 Selling, general and administrative expense (94) (104)Operating income (Note 2) 153 195 Loss from other investments and associates (Note 6) — (6) Interest income 2 2 Interest expense and other net financing costs (24) (47)Income before taxes 131 144 Income tax expense (Note 3) (29) (35)Net income (including noncontrolling interests) 102 109
Net income attributable to Equity holders of the parent 102 108 Noncontrolling interests — 1 Net income (including noncontrolling interests) 102 109
Earnings per common share (in U.S. dollars): Basic 1.31 1.39 Diluted 1.09 1.30
Weighted average common shares outstanding (in thousands): Basic 77,604 78,007 Diluted 93,847 87,246
The accompanying notes are an integral part of these condensed consolidated financial statements.
36

Interim Financial Report 2016
Aperam Condensed Consolidated Statement of Comprehensive Income / (Loss)
(in millions of U.S. dollars)
Six months ended June 30,
2016 2015
Net income (including noncontrolling interests) 102 109
Items that cannot be recycled to the consolidated statement of operations: Remeasurement of defined benefit obligation during the period, net of tax benefit (expense) of nil and nil for 2016 and 2015, respectively 1 — Items that can be recycled to the consolidated statement of operations: Availableforsale investments (Note 6): Gain (loss) arising during the period, net of tax (expense) benefit of (1) and 2 for 2016 and 2015, respectively 3 (3) Reclassification adjustments for loss included in the statement of operations, net of tax benefit of nil and 2 for 2016 and 2015, respectively — 4
3 1
Cash flow hedges: Gain (loss) arising during the period, net of tax (expense) benefit of (10) and 6 for 2016 and 2015, respectively 22 (11) Reclassification adjustments for gain included in the statement of operations, net of tax expense of nil and 4 for 2016 and 2015, respectively (1) (8)
21 (19)
Exchange differences arising on translation of foreign operations, net of tax (expense) benefit of (6) and 20 for 2016 and 2015, respectively 212 (320) Total other comprehensive income (loss) 237 (338)
Total other comprehensive income (loss) attributable to: Equity holders of the parent 237 (337) Noncontrolling interests — (1) Total other comprehensive income (loss) 237 (338)
Net comprehensive income (loss) 339 (229) Net comprehensive income (loss) attributable to: Equity holders of the parent 339 (229)
The accompanying notes are an integral part of these condensed consolidated financial statements.
37

Interim Financial Report 2016
Aperam Condensed Consolidated Statement of Financial Position
(in millions of U.S. dollars)
June 30,
2016 December 31,
2015 ASSETS Current assets: Cash and cash equivalents 192 148 Trade accounts receivable 303 248 Inventories (Note 4) 1,108 1,121 Prepaid expenses and other current assets (Note 5) 88 128 Income tax receivable 13 12 Total current assets 1,704 1,657 Noncurrent assets: Goodwill and intangible assets 596 556 Biological assets (1) 57 49 Property, plant and equipment (1) 1,676 1,603 Other investments (Note 6) 25 18 Deferred tax assets 290 285 Other assets 136 131 Total noncurrent assets 2,780 2,642 Total assets 4,484 4,299
(1) Amounts for December 31, 2015 have been revised in accordance with IAS 16 and IAS 41 implementation on “Bearer Plants” — see
Note 1 below
The accompanying notes are an integral part of these condensed consolidated financial statements.
38

Interim Financial Report 2016
Aperam Condensed Consolidated Statement of Financial Position
(in millions of U.S. dollars)
June 30,
2016 December 31, 2015
LIABILITIES AND EQUITY
Current liabilities:
Shortterm debt including current portion of longterm debt (Note 7) 14 14 Trade accounts payable 820 849 Shortterm provisions 20 30 Accrued expenses and other liabilities 260 298 Income tax liabilities 6 3 Total current liabilities 1,120 1,194 Noncurrent liabilities: Longterm debt, net of current portion (Note 7) 458 450 Deferred tax liabilities 149 126 Deferred employee benefits 184 184 Longterm provisions 47 46 Other longterm obligations 60 77 Total noncurrent liabilities 898 883 Total liabilities 2,018 2,077 Equity (Note 8): Common shares (no par value, 96,216,785 and 96,216,785 shares authorised, 78,049,730, and 78,049,730 shares issued and 77,626,795 and 77,590,196 shares outstanding as of June 30, 2016 and December 31, 2015, respectively) 547 547 Treasury shares (422,935 and 459,534 common shares as of June 30, 2016 and December 31, 2015, respectively)
(14) (15)
Additional paidin capital 1,599 1,599 Retained earnings 1,171 1,165 Other comprehensive loss (869) (1,106) Option premium on convertible bonds 27 27 Equity attributable to the equity holders of the parent 2,461 2,217 Noncontrolling interests 5 5 Total equity 2,466 2,222 Total liabilities and equity 4,484 4,299
The accompanying notes are an integral part of these condensed consolidated financial statements.
39

Aperam Condensed Consolidated Statement of Changes in Equity
(in millions of U.S. dollars, except share data)
Other Comprehensive Income (Loss)
Shares(1) Share capital
Treasury shares
Additional paidin capital
Retained earnings
Foreign currency translation adjustments
Unrealised gains (losses) on derivatives
financial instruments
Unrealised gains
(losses) on available for
sale securities
Recognised actuarial gains
(losses)
Option premium on convertible
bonds
Equity attributable to the equity holders of the parent
Noncontrolling interests
Total Equity
Balance at December 31, 2014 78,005 547 (2) 1,599 991 (459) (8) — (23) 27 2,672 4 2,676
Net income — — — — 108 — — — — — 108 1 109 Other comprehensive (loss) income — — — — — (319) (19) 1 — — (337) (1) (338)
Total comprehensive (loss) income — — — — 108 (319) (19) 1 — — (229) — (229)
Recognition of share based payments 4 — 1 — 1 — — — — — 2 — 2
Balance at June 30, 2015 78,009 547 (1) 1,599 1,100 (778) (27) 1 (23) 27 2,445 4 2,449
Balance at December 31, 2015 77,590 547 (15) 1,599 1,165 (1,060) (24) — (22) 27 2,217 5 2,222 Net income — — — — 102 — — — — — 102 — 102 Other comprehensive income — — — — — 212 21 3 1 — 237 — 237
Total comprehensive income — — — — 102 212 21 3 1 — 339 — 339
Treasury stock — — 1 — — — — — — — 1 — 1 Recognition of share based payments 37 — — — 1 — — — — — 1 — 1
Dividends — — — — (97) — — — — — (97) — (97)
Balance at June 30, 2016 77,627 547 (14) 1,599 1,171 (848) (3) 3 (21) 27 2,461 5 2,466
(1) Number of shares denominated in thousands, excludes treasury shares.
The accompanying notes are an integral part of these condensed consolidated financial statements.
40
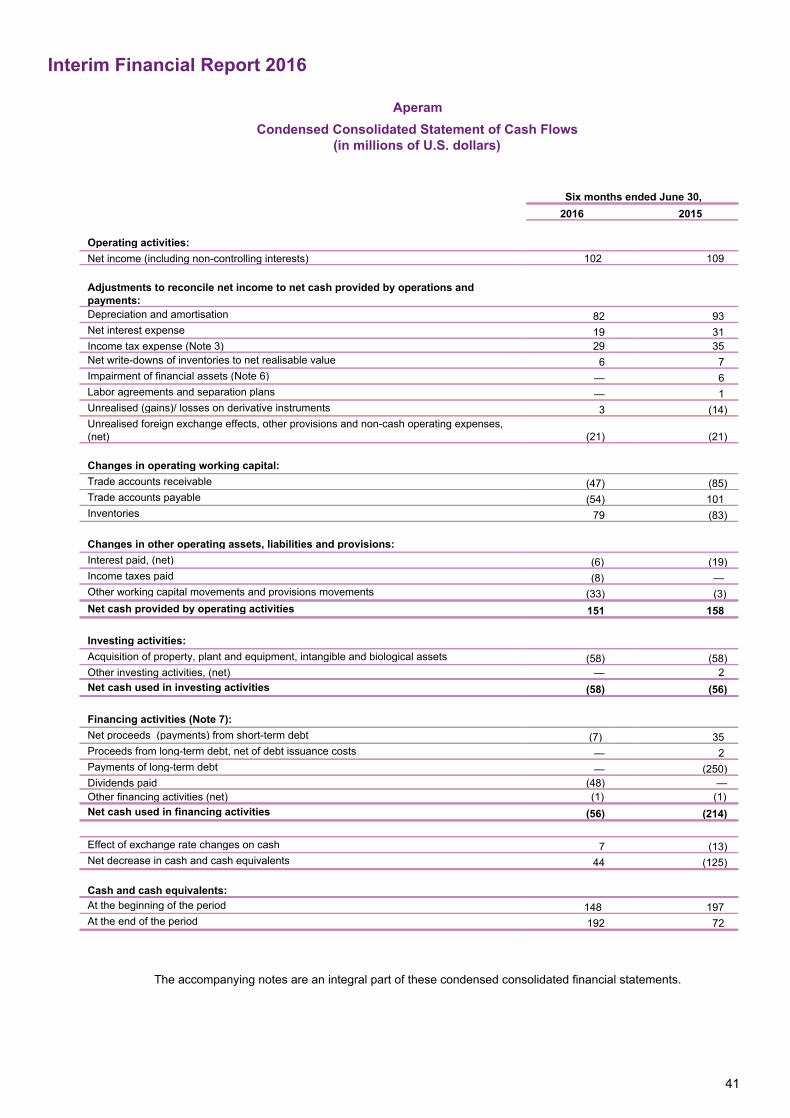
Interim Financial Report 2016
Aperam Condensed Consolidated Statement of Cash Flows
(in millions of U.S. dollars)
Six months ended June 30, 2016 2015
Operating activities: Net income (including noncontrolling interests) 102 109 Adjustments to reconcile net income to net cash provided by operations and payments: Depreciation and amortisation 82 93 Net interest expense 19 31 Income tax expense (Note 3) 29 35 Net writedowns of inventories to net realisable value 6 7 Impairment of financial assets (Note 6) — 6 Labor agreements and separation plans — 1 Unrealised (gains)/ losses on derivative instruments 3 (14) Unrealised foreign exchange effects, other provisions and noncash operating expenses, (net) (21) (21) Changes in operating working capital: Trade accounts receivable (47) (85) Trade accounts payable (54) 101 Inventories 79 (83) Changes in other operating assets, liabilities and provisions: Interest paid, (net) (6) (19) Income taxes paid (8) — Other working capital movements and provisions movements (33) (3) Net cash provided by operating activities 151 158 Investing activities: Acquisition of property, plant and equipment, intangible and biological assets (58) (58) Other investing activities, (net) — 2 Net cash used in investing activities (58) (56) Financing activities (Note 7): Net proceeds (payments) from shortterm debt (7) 35 Proceeds from longterm debt, net of debt issuance costs — 2 Payments of longterm debt — (250) Dividends paid (48) — Other financing activities (net) (1) (1) Net cash used in financing activities (56) (214) Effect of exchange rate changes on cash 7 (13) Net decrease in cash and cash equivalents 44 (125) Cash and cash equivalents: At the beginning of the period 148 197 At the end of the period 192 72
The accompanying notes are an integral part of these condensed consolidated financial statements.
41

Interim Financial Report 2016
SUMMARY OF NOTES TO THE CONDENSED CONSOLIDATED FINANCIAL STATEMENTS
Note 1: Nature of business, basis of presentation and accounting policies Note 2: Segment reporting Note 3: Income tax Note 4: Inventories Note 5: Prepaid expenses and other current assets Note 6: Other investments Note 7: Shortterm and longterm debt Note 8: Equity Note 9: Instruments at fair value Note 10: Commitments Note 11: Contingencies Note 12: Subsequent events
NOTE 1 – NATURE OF BUSINESS, BASIS OF PRESENTATION AND ACCOUNTING POLICIES
Nature of business
Aperam Société Anonyme ( “Aperam”) was incorporated in Luxembourg on September 9, 2010 to own certain operating subsidiaries of ArcelorMittal Société Anonyme (“ArcelorMittal”) which primarily comprise ArcelorMittal’s stainless steel and nickel alloys business. This business was transferred to Aperam prior to the distribution of all its outstanding common shares to shareholders of ArcelorMittal on January 26, 2011. Collectively, Aperam together with its subsidiaries are referred to in these condensed consolidated financial statements as the “Company”. The Company’s shares have been trading on the European stock exchanges of Amsterdam, Paris (Euronext) and Luxembourg since January 31, 2011.
Basis of presentation
The condensed consolidated financial statements of Aperam (or the “Company”) as of June 30, 2016 and for the six months then ended (the “Interim Financial Statements”) have been prepared in accordance with International Accounting Standard (“IAS”) No. 34, “Interim Financial Reporting”. They should be read in conjunction with the annual consolidated financial statements and the notes thereto as of and for the year ended December 31, 2015 included in the Company’s 2015 Annual Report which have been prepared in accordance with International Financial Reporting Standards (“IFRS”) as issued by the International Accounting Standards Board (“IASB”) and adopted by the European Union (“EU”). They are presented in U.S. dollars with all amounts rounded to the nearest million, except for share and per share data.
Accounting policies
The Interim Financial Statements have been prepared on a historical cost basis, except for available for sale financial assets, derivative financial instruments and biological assets, which are measured at fair value, and inventories which are measured at the lower of net realisable value or cost. Unless specifically described herein, the accounting policies used to prepare the Interim Financial Statements are the policies described in Note 2 of the consolidated financial statements for the year ended December 31, 2015.
There were no significant effects on the Interim Financial Statements as a result of the adoption of any of the aforementioned standards or interpretations, except for the adoption of amendment to IAS 16 “Property, Plant and Equipment” and IAS 41 “Agriculture: Bearer Plants” as of date January 1, 2016. The amendment precises that bearer plants should no longer be in the scope of IAS 41 “Agriculture” (and measured at fair value) but under the scope of IAS 16 “Property, Plant and Equipment” (PP&E) and as such measured at cost. Therefore, starting in January 2016, the accounting of the Company’s eucalyptus plantations is split in two parts:
The roots of the plantations which meet the definition of bearer plants are accounted for at cost as PP&E, The remaining part of the plantations are still accounted for at fair value as biological assets.
The application of this standard didn’t have any significant impact on our financial statements except a balance sheet reclassification between biological assets and PP&E for an amount of U.S.$21 million as of date January 1, 2015.
42

Interim Financial Report 2016
Due to a reorganisation at the level of business units, it has been decided to transfer the Business Unit "Precision" from the segment "Services & Solutions" to the segment "Stainless & Electrical Steel" as from January 1, 2016. Figures for 2015 have been restated accordingly. The preparation of financial statements in conformity with IFRS recognition and measurement principles requires the use of estimates and assumptions that affect the reported amounts of assets, liabilities, revenues and expenses. Management reviews its estimates on an ongoing basis using currently available information. Changes in facts and circumstances may result in revised estimates, and actual results could differ from those estimates.
NOTE 2 – SEGMENT REPORTING
Aperam reports its operations in three segments: Stainless & Electrical Steel, Services & Solutions and Alloys & Specialties.
The following table summarises certain financial data relating to Aperam’s operations in its different segments:
(in millions of U.S. dollars)
Stainless & Electrical Steel
Services & Solutions
Alloys & Specialties
Others / Eliminations(1) Total
Six months ended June 30, 2016
Sales to external customers 1,003 981 212 1 2,197 Intersegment sales(2) 805 38 4 (847) — Operating income (loss) 120 39 10 (16) 153 Depreciation and Impairment 71 7 3 1 82 Capital expenditures 52 2 4 — 58
Six months ended June 30, 2015 (2)
Sales to external customers 1,155 1,057 309 1 2,522 Intersegment sales(3) 915 37 2 (954) — Operating income (loss) 170 22 24 (21) 195 Depreciation and Impairment 80 9 3 1 93 Capital expenditures 42 7 8 1 58 (1) Others / Eliminations includes all other operations than mentioned above, together with intersegment elimination, and/or nonoperational items which are not segmented. (2) Due to the transfer of the Business Unit "Precision" from the segment "Services & Solutions" to the segment "Stainless & Electrical Steel" as from January 1, 2016, segmented figures for the half year ended June 30, 2015 have been restated. (3) Transactions between segments are conducted on the same basis of accounting as transactions with third parties.
NOTE 3 – INCOME TAX
The income tax expense or benefit for the period is based on an estimated annual effective rate, which requires management to make its best estimate of annual pretax income for the year. During the year, management regularly updates its estimates based on changes in various factors such as geographical mix of operating profit, prices, shipments, product mix, plant operating performance and cost estimates, including labor, raw materials, energy and pension and other postretirement benefits.
Income tax was an expense of U.S.$29 million and U.S.$35 million for the six months ended June 30, 2016 and 2015, respectively. The lower income tax expense is a result of a slight deterioration in the level of the estimated results of the Company’s operating entities for the six months ended June 30, 2016 as compared to the six months ended June 30, 2015.
43

Interim Financial Report 2016
NOTE 4 – INVENTORIES
Inventories, net of provision for obsolescence, slowmoving inventories and excess of cost over net realisable value of U.S.$101 million and U.S.$109 million as of June 30, 2016 and December 31, 2015, respectively, are comprised of the following: (in millions of U.S. dollars) June 30, 2016 December 31, 2015 Finished products 436 469 Production in process 392 363 Raw materials 143 164 Manufacturing supplies, spare parts and other 137 125 Total 1,108 1,121
The amount of writedowns of inventories to net realisable value recognised as an expense was U.S.$6 million and U.S.$7 million during the six months ended June 30, 2016 and 2015, respectively and was reduced by U.S.$16 million and U.S.$7 million, respectively, due to normal inventory consumption.
The amount of inventories recognised as an expense (due to normal inventory consumption) was U.S.$1,251million and U.S.$1,490 million during the six months ended June 30, 2016 and 2015, respectively.
NOTE 5 – PREPAID EXPENSES AND OTHER CURRENT ASSETS
Prepaid expenses and other current assets consist of the following:
(in millions of U.S. dollars) June 30, 2016 December 31, 2015 Value added tax (VAT) and other amount receivable from tax authorities 39 89
Prepaid expenses and accrued receivables 15 12 Cash receivable from sold trade receivables 14 — Derivative financial assets 10 10 Other 10 17 Total 88 128
44

Interim Financial Report 2016
NOTE 6 – OTHER INVESTMENTS
The Company holds the following other investments:
Fair value
(in millions of U.S. dollars) Location
Ownership % at June 30,
2016 June 30,
2016 December 31,
2015 Availableforsale securities (at fair value) General Moly Inc U.S. 7.47% 3 2 Gerdau S.A. Brazil 0.53% 17 11 Total availableforsale securities 20 13 Investments accounted for at cost Exeltium S.A.S. France 2.05% 4 4 Other 1 1 Total investments accounted for at cost 5 5 Total 25 18 The fair value (applying a Level 1 fair value measurement) of Aperam’s stake in Gerdau amounted to U.S.$17 million and U.S.$11 million as of June 30, 2016 and December 31, 2015, respectively. The increase of U.S.$6 million over the period is due to the increase in the market price of the shares from R$4.65 as of December 31, 2015 to R$5.89 as of June 30, 2016. The fair value of Aperam’s stake in General Moly amounted to U.S.$3 million and U.S.$2 million as of June 30, 2016 and December 31, 2015, respectively.
The Company reviewed the investments in Gerdau and General Moly for impairment and didn’t recognise any impairment loss in the statement of operations for the six months ended June 30, 2016.
NOTE 7 – SHORTTERM AND LONGTERM DEBT
Shortterm debt, including the current portion of longterm debt, consisted of the following:
(in millions of U.S. dollars) June 30, 2016 December 31, 2015 Shortterm bank loans and other credit facilities 5 4 Current portion of longterm debt 8 9 Lease obligations 1 1 Total 14 14
Secured borrowing base revolving credit facility On March 6, 2015, Aperam signed a U.S.$500 million secured borrowing base revolving credit facility ("The Facility") with a group of nine banks. The Facility, which refinanced the existing Borrowing Base Facility of U.S.$400 million, is structured as a threeyear revolving credit facility and includes a oneyear extension option. It will be used for liquidity and working capital purposes. On December 1, 2015, Aperam cancelled a U.S.$100 million of commitments leading to a remaining U.S.$400 million secured borrowing base revolving credit facility. On May 26, 2016 Aperam extended the maturity of the credit facility until March 5, 2019.
As of June 30, 2016, no amount was drawn under this facility.
EIB financing On June 27, 2016, Aperam and the European Investment Bank (EIB) announced the signature of a financing contract of an amount of €50 million which will be dedicated to finance a research and development programme over the period 20162019 as well as the upgrade of two plants located in cohesion regions in France & Belgium (Isbergues HautsdeFrance and ChâteletHainaut). Loans can be drawn for five years maturity with bullet repayment or for ten years maturity with progressive amortisation of principal.
45

Interim Financial Report 2016
As of June 30, 2016, no amount was drawn under this facility.
The Company’s longterm debt consisted of the following:
(in millions of U.S. dollars) Year of maturity Type of Interest
Interest rate(1)
June 30, 2016
December 31, 2015
300 Convertible Bonds 2019/2021 (2) Fixed 0.625% 262 256 200 Convertible Bonds 2017/2020 (3) Fixed 2.625% 185 180 Loans in Brazil 20162021 Fixed/Floating 2.50%8.70% 16 21 Total 463 457 Less current portion of longterm debt (8) (9)Total longterm debt (excluding lease obligations) 455 448Lease obligations (4) 3 2Total longterm debt, net of current portion 458 450
(1) Rates applicable to balances outstanding at June 30, 2016.(2) Convertible bonds maturity is on July 8, 2021 but bonds are puttable by the bondholders on January 8, 2019. (3) Convertible bonds maturity is on September 30, 2020 but bonds are puttable by the bondholders on September 30, 2017.(4) Net of current portion of U.S.$1 million and U.S.$1 million as of June 30, 2016 and December 31, 2015 respectively.
Convertible Bonds On September 19, 2013, Aperam issued a U.S.$200 million convertible and/or exchangeable debt instrument with a contractual maturity of 7 years. These bonds bear interest at 2.625% per annum payable semiannually on March 30 and September 30 of each year, commencing on March 30, 2014. The bonds are puttable by the bondholders on September 30, 2017 at the principal amount (plus accrued interests). At inception, the Company determined the bonds met the definition of a compound financial instrument in accordance with IFRS. The conversion option premium is recognised as an equity component. The Company determined the fair value of the financial liability component of the bonds was U.S.$158 million on the date of issuance. On July 8, 2014, Aperam issued a U.S.$300 million convertible and/or exchangeable debt instrument with a contractual maturity of 7 years. These bonds bear interest at 0.625% per annum payable semiannually on January 8 and July 8 of each year, commencing on January 8, 2015. The bonds are puttable by the bondholders on January 8, 2019 at the principal amount (plus accrued interests). At inception, the Company determined the bonds met the definition of a compound financial instrument in accordance with IFRS. The Company determined the fair value of the financial liability component of the bonds was U.S.$237 million on the date of issuance. Conversion option is recognised as a derivative financial liability.
46

Interim Financial Report 2016
NOTE 8 – EQUITY
Authorised share capital and authorised shares
On May 8, 2014, the Extraordinary General Meeting resolved to increase the authorised share capital by €54,279,543, equivalent to 10,362,482 shares, so that the Company’s authorised share capital (including its issued share capital) shall amount to €503,991,548, represented by 96,216,785 shares without nominal value.
Dividends
On November 5, 2015, Aperam declared its financial policy to maximise the long term growth and sustainability of the company as well as the value accretion for its shareholders while maintaining a strong balance sheet. Subject to shareholder approval at the 2016 annual general meeting of shareholders, Aperam reinstates a base dividend of U.S.$1.25 per share, as the company continues to improve its sustainable profitability benefiting from its strategic actions. The company targets a Net Financial Debt/EBITDA ratio of <1.0x (through the cycle). In the case that Net Financial Debt/EBITDA exceeds 1.0x, the Company will suspend the cash dividend.
On May 4, 2016, the annual general meeting approved the quarterly dividend payment at U.S.$0.3125 per share. For the six months ended June 30, 2016, dividend payments of U.S.$24 million and U.S.$24 million (U.S.$0.3125 per share per quarter) were made on March 30, 2016 and June 14, 2016, respectively. The full year dividend to be paid in 2016 amounts to U.S.$97 million.
The dividend is paid in four equal quarterly instalments of U.S.$0.3125 (gross) per share.
Treasury shares
In January 2016, a total of 782 shares were allocated to qualifying employees under the RSU plan granted in August 2013 and in April 2016, 35,817 shares were allocated to qualifying employees under the RSU plan granted in April 2013.
Aperam held 422,935 and 459,534 treasury shares as of June 30, 2016 and December 31, 2015, respectively.
Share unit plan
On May 4, 2016, the Annual General Meeting of Shareholders authorised the Board of Directors to issue (during the period between the 2016 and the 2017 annual general meeting) up to 220,000 of the Company’s fully paidup ordinary shares under the Leadership Team Performance Share Unit Plan (the “LT PSU Plan”). These shares can be newly issued shares or treasury shares. The Board of Directors may consider appropriate rules to implement the LT PSU Plan, including other retention based grants below the level of the Leadership Team.
47

Interim Financial Report 2016
NOTE 9 – INSTRUMENTS AT FAIR VALUE
The estimated fair values of certain instruments have been determined using available market information or other valuation methodologies that require considerable judgment in interpreting market data and developing estimates. Fair value versus carrying amounts The following table summarises assets and liabilities based on their categories as of June 30, 2016. Instruments at fair value
(in millions of U.S. dollars)
Carrying amount in statements of financial position
Nonfinancial
assets and
liabilities Loan and receivables
Liabilities at amortised
cost
Fair value recognised in profit and
loss
Available for sale assets Derivatives
ASSETS Current assets: Cash and cash equivalents 192 — 192 — — — — Trade accounts receivable 303 — 303 — — — — Inventories 1,108 1,108 — — — — — Prepaid expenses and other current assets 88 38 40 — — — 10
Income tax receivable 13 13 — — — — — Total current assets 1,704 1,159 535 — — — 10 Noncurrent assets: Goodwill and intangible assets 596 596 — — — — — Biological assets 57 — — — 57 — — Property, plant and equipment 1,676 1,676 — — — — — Other investments 25 5 — — — 20 — Deferred tax assets 290 290 — — — — — Other assets 136 44 41 — — — 51 Total noncurrent assets 2,780 2,611 41 — 57 20 51 Total assets 4,484 3,770 576 — 57 20 61 LIABILITIES AND EQUITY Current liabilities: Shortterm debt and current portion of longterm debt 14 — — 14 — — —
Trade accounts payable 820 — — 820 — — — Shortterm provisions 20 20 — — — — — Accrued expenses and other liabilities 260 115 — 137 — — 8 Income tax liabilities 6 6 — — — — — Total current liabilities 1,120 141 — 971 — — 8 Noncurrent liabilities: Longterm debt, net of current portion 458 — — 458 — — — Deferred tax liabilities 149 149 — — — — — Deferred employee benefits 184 184 — — — — — Longterm provisions 47 47 — — — — — Other longterm obligations 60 4 — 5 — — 51 Total noncurrent liabilities 898 384 — 463 — — 51 Equity: Equity attributable to the equity holders of the parent 2,461 2,461 — — — — —
Noncontrolling interests 5 5 — — — — — Total equity 2,466 2,466 — — — — — Total liabilities and equity 4,484 2,991 — 1,434 — — 59
48

Interim Financial Report 2016
The following table summarises the bases used to measure assets and liabilities at their fair value.
As of June 30, 2016 (in millions of U.S. dollars) Level 1 Level 2 Level 3 Total Assets at fair value: Biological assets — — 57 57 Availableforsale financial assets 20 — — 20 Derivative financial current assets — 10 — 10 Derivative financial noncurrent assets — — 51 51 Total assets at fair value 20 10 108 138 Liabilities at fair value: Derivative financial current liabilities — 8 — 8 Derivative financial noncurrent liabilities — — 51 51 Total liabilities at fair value — 8 51 59
Availableforsale financial assets classified as Level 1 refer to listed securities quoted in active markets. The total fair value is either the price of the most recent trade at the time of the market close or the official close price as defined by the exchange on which the asset is most actively traded on the last trading day of the period, multiplied by the number of units held without consideration of transaction costs.
Derivative financial assets and liabilities classified as Level 2 refer to instruments to hedge fluctuations in foreign exchange rates and commodity prices (base metals). The total fair value is based on the price a dealer would pay or receive for the security or similar securities, adjusted for any terms specific to that asset or liability. Market inputs are obtained from well established and recognised vendors of market data (Bloomberg and Reuters) and the fair value is calculated using standard industry models based on significant observable market inputs such as foreign exchange rates, commodity prices, swap rates, and interest rates.
In order to determine the fair value of biological assets, a discounted cash flow model was used, with the harvest cycle of six to seven years. Fair value measurement of biological assets is categorised within level 3 of fair value hierarchy.
Derivative financial assets classified as Level 3 refer to the call options bought end of June 2014 by the Company on its own shares which may be exercised at the conversion price of the convertible bonds issued on July 8, 2014. Derivative financial liabilities classified as Level 3 refers to the conversion option in the U.S.$300 million convertible bonds. The fair valuation of Level 3 derivative instruments is established at each reporting date in relation to which an analysis is performed in respect of changes in the fair value measurement since the last period. Aperam’s valuation policies for derivatives are an integral part of its internal control procedures and have been reviewed and approved according to the Company’s principles for establishing such procedures. In particular, such procedures address the accuracy and reliability of input data, the accuracy of the valuation model and the knowledge of the staff performing the valuations.
Aperam establishes the fair valuation of the call options on its own shares and the conversion option with respect to the U.S.$300 million convertible bonds through the use of a volatility model based on a partial differential equation. The model uses an iterative procedure to price options, allowing for the specification of nodes, or points in time, during the time span between the valuation date and the option’s expiration date. In contrast to the BlackScholes model, which provides a numerical result based on inputs, the model allows for the calculation of the asset and the option for multiple periods along with the range of possible results for each period.
Observable input data used in the valuations include zero coupon yield curves, stock market prices and Libor interest rates. Unobservable inputs are used to measure fair value to the extent that relevant observable inputs are not available.
49

Interim Financial Report 2016
The following tables summarised the reconciliation of the fair value of the assets and liabilities classified as Level 3 for the six months ended June 30, 2016:
(in millions of U.S. dollars)
U.S.$300 millionconvertible bonds’ conversion option
Call option on own shares Total
Balance as of December 31, 2015 (65) 65 —
Change in fair value(1) 14 (14) —Balance as of June 30, 2016 (51) 51 —
(1) Recognised in net financing costs in the consolidated statements of operations.
(in millions of U.S. dollars) Biological assets Balance as of December 31, 2015(1) 49 Additions 4 Change in fair value(2) 3 Harvested trees (11) Foreign exchange difference 12 Balance as of June 30, 2016 57
(1) Amounts for December 31, 2015 have been restated in accordance with IAS 16 and 41 amendments “Bearer Plants” see Note 1 above
(2) Recognised in cost of sales in the consolidated statements of operations.
Portfolio of Derivatives
The Company enters into derivative financial instruments to manage its exposure to fluctuations in exchange rates and the price of raw materials arising from operating, financing and investment activities.
The Company’s portfolio of derivatives consists of transactions with Aperam Treasury S.C.A., which in turn enters into offsetting positions with counterparties external to Aperam. Aperam manages the counterparty risk associated with its instruments by centralising its commitments and by applying procedures which specify, for each type of transaction exposure limits based on the risk characteristics of the counterparty.
The portfolio associated with derivative financial instruments classified as Level 2 as of June 30, 2016 is as follows:
Assets Liabilities
(in millions of U.S. dollars) Notional Amount
Fair Value
Notional Amount
Fair Value
Foreign exchange rate instruments Forward purchase contracts 1 — 10 — Forward sale contracts 51 1 109 — Total foreign exchange rate instruments 1 —
Raw materials (base metal) Term contracts sales metals 15 3 51 (2) Term contracts purchases metals 96 6 35 (6) Total raw materials (base metal) 9 (8) Total 10 (8)
50
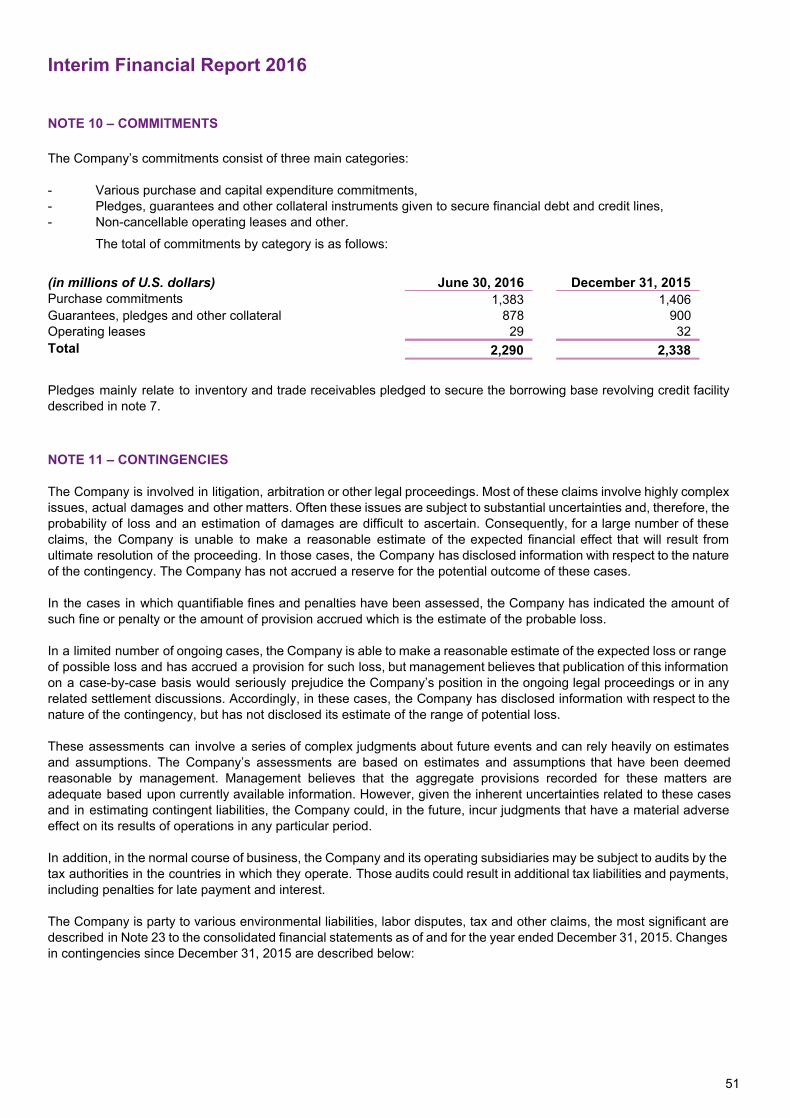
Interim Financial Report 2016
NOTE 10 – COMMITMENTS
The Company’s commitments consist of three main categories:
Various purchase and capital expenditure commitments, Pledges, guarantees and other collateral instruments given to secure financial debt and credit lines, Noncancellable operating leases and other.
The total of commitments by category is as follows:
(in millions of U.S. dollars) June 30, 2016 December 31, 2015 Purchase commitments 1,383 1,406 Guarantees, pledges and other collateral 878 900 Operating leases 29 32 Total 2,290 2,338
Pledges mainly relate to inventory and trade receivables pledged to secure the borrowing base revolving credit facility described in note 7.
NOTE 11 – CONTINGENCIES
The Company is involved in litigation, arbitration or other legal proceedings. Most of these claims involve highly complex issues, actual damages and other matters. Often these issues are subject to substantial uncertainties and, therefore, the probability of loss and an estimation of damages are difficult to ascertain. Consequently, for a large number of these claims, the Company is unable to make a reasonable estimate of the expected financial effect that will result from ultimate resolution of the proceeding. In those cases, the Company has disclosed information with respect to the nature of the contingency. The Company has not accrued a reserve for the potential outcome of these cases.
In the cases in which quantifiable fines and penalties have been assessed, the Company has indicated the amount of such fine or penalty or the amount of provision accrued which is the estimate of the probable loss.
In a limited number of ongoing cases, the Company is able to make a reasonable estimate of the expected loss or range of possible loss and has accrued a provision for such loss, but management believes that publication of this information on a casebycase basis would seriously prejudice the Company’s position in the ongoing legal proceedings or in any related settlement discussions. Accordingly, in these cases, the Company has disclosed information with respect to the nature of the contingency, but has not disclosed its estimate of the range of potential loss.
These assessments can involve a series of complex judgments about future events and can rely heavily on estimates and assumptions. The Company’s assessments are based on estimates and assumptions that have been deemed reasonable by management. Management believes that the aggregate provisions recorded for these matters are adequate based upon currently available information. However, given the inherent uncertainties related to these cases and in estimating contingent liabilities, the Company could, in the future, incur judgments that have a material adverse effect on its results of operations in any particular period.
In addition, in the normal course of business, the Company and its operating subsidiaries may be subject to audits by the tax authorities in the countries in which they operate. Those audits could result in additional tax liabilities and payments, including penalties for late payment and interest.
The Company is party to various environmental liabilities, labor disputes, tax and other claims, the most significant are described in Note 23 to the consolidated financial statements as of and for the year ended December 31, 2015. Changes in contingencies since December 31, 2015 are described below:
51

Interim Financial Report 2016
Tax Claims in Brazil
On July 1, 2016, Aperam South America received an unfavorable decision at first administrative level for the tax assessment initiated by Federal Revenue in 2013 in relation to the tax benefit from the goodwill generated in 2010 and 2011 in the acquisition of its shares to minority shareholders for a total amount of R$211 million(1) (U.S.$66 million).The Company is preparing its appeal.
On June 24, 2016, Aperam South America received an unfavorable decision at first administrative level in the tax case initiated by Federal Revenue for its sales made to Madeira island and the goodwill that Aperam South America generated from the demerger from AAEB (Acesita) in August 2008 for a total amount of R$360 million(1) (U.S.$112 million). The Company appealed the decision on July 26, 2016.
On June 15, 2016, Aperam South America filed a petition against the appeal launched by the Federal Union to challenge the favorable decision the Company obtained from the Special Chamber in 2014 for a total amount of R$66 million(1) (U.S.$21 million) related to social contributions on incentive program.
On May 16, 2016, Aperam South America presented its defense against the appeal initiated by the State of Minas Gerais to challenge the favorable decision the Company obtained at first instance for a total amount of R$23 million(1) (U.S.$7 million) related to the use of ICMS (VAT) credit in 2007 arisen from goods acquired for use and consumption.
At the end of March 2016, Aperam Services & Solutions Brazil was notified of the approval by the State of Sao Paulo with regards to a debt waiver with reversal of R$13m (U.S.$4 million) and closure of the administrative case which they had launched against the Company in December 2011 related to ICMS (VAT) paid to Espirito Santo state in 20062009 for a total amount of R$28m (U.S.$9 million).
Civil Claims in Brazil
On June 3, 2016, Aperam South America filed a petition to request a suspension of payment of the total amount of R$45 million(1) (U.S.$14 million) until a final decision is given by the Court of Appeal in the litigation raised by the Central bank of Brazil against the use of Treasury bills in 2007.
On January 22, 2016, an appeal was launched by the State of Minas Gerais in July 2015 to challenge the favorable decision granted to Aperam South America in February 2015 in relation to the settlement agreement concluded in 2008 for Rio Corrente park for a total amount of R$22 million(1) (U.S.$7 million).
(1) Amounts in Brazilian Real are converted into U.S. dollars using the closing exchange rate of 1U.S.$=3,2098R$
NOTE 12 – SUBSEQUENT EVENTS
There were no subsequent events after June 30, 2016 except for those already mentioned in the notes.
52

Interim Financial Report 2016
To the Shareholders of Aperam, Société Anonyme (« Aperam ») 12C, Rue Guillaume Kroll L1882 Luxembourg
Report on Review of Interim Financial Statements
Introduction
We have reviewed the accompanying condensed consolidated statement of financial position of Aperam as of June 30, 2016 and the related condensed consolidated statements of operations, comprehensive income, changes in equity and cash flows for the six month period then ended and the other explanatory notes, (collectively, the “interim financial statements”) . The Board of Directors is responsible for the preparation and fair presentation of the interim financial statements in accordance with International Accounting Standard 34, Interim Financial Reporting, as adopted in the European Union. Our responsibility is to express a conclusion on these interim financial statements based on our review.
Scope of Review
We conducted our review in accordance with International Standard on Review Engagements 2410, Review of Interim Financial Information Performed by the Independent Auditor of the entity. A review of interim financial information consists of making inquiries, primarily of persons responsible for financial and accounting matters, and applying analytical and other review procedures. A review is substantially less in scope than an audit conducted in accordance with International Standards on Auditing and consequently does not enable us to obtain assurance that we would become aware of all significant matters that might be identified in an audit. Accordingly, we do not express an audit opinion.
Conclusion
Based on our review, nothing has come to our attention that causes us to believe that the accompanying interim financial statements are not prepared, in all material respects, in accordance with International Accounting Standard 34, Interim Financial Reporting, as adopted in the European Union.
For Deloitte Audit, Cabinet de révision agréé
John Psaila, Réviseur d’entreprises agréé Partner
July 27, 2016
53

12C, rue Guillaume J. Kroll
L-1882 Luxembourg
Grand Duchy of Luxembourg
For more information, please visit:
www.aperam.com