interim consolidated financial statements€¦ · balance at december 31, ... metalurgicos e...
TRANSCRIPT
Suite 1805, 925 West Georgia Street, Vancouver, B.C. Canada V6C 3L2 Phone: 604.688.3033 | Fax: 604.639.8873 | Toll Free: 1.866.529.2807 | Email: [email protected]
www.firstmajestic.com
INTERIM CONSOLIDATED FINANCIAL STATEMENTS
FOR THE SIX MONTHS ENDED
June 30, 2010 (UNAUDITED)
MANAGEMENT’S COMMENTS ON UNAUDITED INTERIM CONSOLIDATED FINANCIAL STATEMENTS
The accompanying unaudited interim financial statements of the Company have been prepared by and are the
responsibility of the Company’s management.

The accompanying notes are an integral part of these consolidated financial statements
FIRST MAJESTIC SILVER CORP. INTERIM CONSOLIDATED BALANCE SHEETS AS AT JUNE 30, 2010 AND DECEMBER 31, 2009 (Unaudited, expressed in Canadian dollars)
June 30, 2010 December 31, 2009$ $
ASSETSCURRENT ASSETSCash and cash equivalents 15,850,386 5,889,793 Accounts receivable 2,396,683 2,174,848 Other receivables (Note 4) 6,755,514 6,624,200 Inventories (Note 5) 5,801,058 3,812,460 Prepaid expenses and other (Note 6) 2,250,495 1,467,759
33,054,136 19,969,060 MINING INTERESTS (Note 7) Producing properties 62,032,205 57,144,477 Exploration properties 112,052,069 109,255,696 Plant and equipment 67,783,258 60,388,530
241,867,532 226,788,703 CORPORATE OFFICE EQUIPMENT (Note 7) 521,173 409,281 DEPOSITS ON LONG-TERM ASSETS (Note 10) 1,971,597 4,306,419 277,414,438 251,473,463
LIABILITIESCURRENT LIABILITIESAccounts payable and accrued liabilities 14,917,025 11,202,381 Unearned revenue on silver bullion sales 22,857 158,147 Current portion of debt facilities (Note 9) 2,045,440 1,546,612 Current portion of capital lease obligations (Note 14) 1,372,510 2,139,352 Income and other taxes payable 264,457 117,844
18,622,289 15,164,336
FUTURE INCOME TAXES 31,968,744 28,417,011 CAPITAL LEASE OBLIGATIONS (Note 14) 368,761 668,284 LONG-TERM PORTION OF DEBT FACILITIES (Note 9) 2,881,015 3,213,487 OTHER LONG TERM LIABILITIES (Note 16) 774,970 753,657 ASSET RETIREMENT OBLIGATIONS (Note 15) 4,660,588 4,336,088
59,276,367 52,552,863
SHAREHOLDERS' EQUITYSHARE CAPITAL (Note 11(a)) 245,178,244 244,241,006 SHARE CAPITAL TO BE ISSUED (Note 11(d)) 276,495 276,495 CONTRIBUTED SURPLUS 28,931,617 27,808,671 ACCUMULATED OTHER COMPREHENSIVE LOSS (34,984,538) (40,238,914) DEFICIT (21,263,747) (33,166,658)
218,138,071 198,920,600 277,414,438 251,473,463
CONTINUING OPERATIONS (Note 1)CONTINGENT LIABILITIES (Note 17)COMMITMENTS (Note 18)SUBSEQUENT EVENTS (Note 21)
APPROVED BY THE BOARD OF DIRECTORS
Keith Neumeyer (signed) Director Douglas Penrose (signed) Director
The accompanying notes are an integral part of these consolidated financial statements
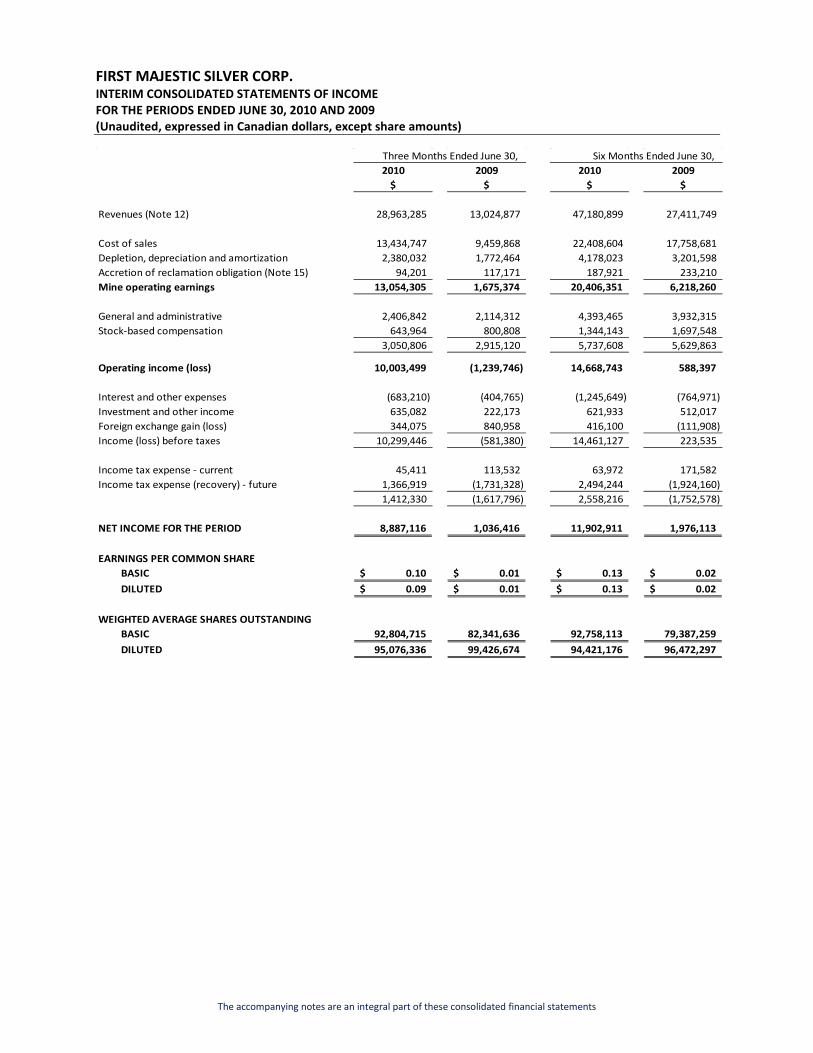
FIRST MAJESTIC SILVER CORP. INTERIM CONSOLIDATED STATEMENTS OF INCOME FOR THE PERIODS ENDED JUNE 30, 2010 AND 2009 (Unaudited, expressed in Canadian dollars, except share amounts)
Three Months Ended June 30, Six Months Ended June 30, 2010 2009 2010 2009
$ $ $ $
Revenues (Note 12) 28,963,285 13,024,877 47,180,899 27,411,749
Cost of sales 13,434,747 9,459,868 22,408,604 17,758,681 Depletion, depreciation and amortization 2,380,032 1,772,464 4,178,023 3,201,598 Accretion of reclamation obligation (Note 15) 94,201 117,171 187,921 233,210 Mine operating earnings 13,054,305 1,675,374 20,406,351 6,218,260
General and administrative 2,406,842 2,114,312 4,393,465 3,932,315 Stock-based compensation 643,964 800,808 1,344,143 1,697,548
3,050,806 2,915,120 5,737,608 5,629,863
Operating income (loss) 10,003,499 (1,239,746) 14,668,743 588,397
Interest and other expenses (683,210) (404,765) (1,245,649) (764,971) Investment and other income 635,082 222,173 621,933 512,017 Foreign exchange gain (loss) 344,075 840,958 416,100 (111,908) Income (loss) before taxes 10,299,446 (581,380) 14,461,127 223,535
Income tax expense - current 45,411 113,532 63,972 171,582 Income tax expense (recovery) - future 1,366,919 (1,731,328) 2,494,244 (1,924,160)
1,412,330 (1,617,796) 2,558,216 (1,752,578)
NET INCOME FOR THE PERIOD 8,887,116 1,036,416 11,902,911 1,976,113
EARNINGS PER COMMON SHARE BASIC 0.10$ 0.01$ 0.13$ 0.02$ DILUTED 0.09$ 0.01$ 0.13$ 0.02$
WEIGHTED AVERAGE SHARES OUTSTANDING BASIC 92,804,715 82,341,636 92,758,113 79,387,259 DILUTED 95,076,336 99,426,674 94,421,176 96,472,297
The accompanying notes are an integral part of these consolidated financial statements
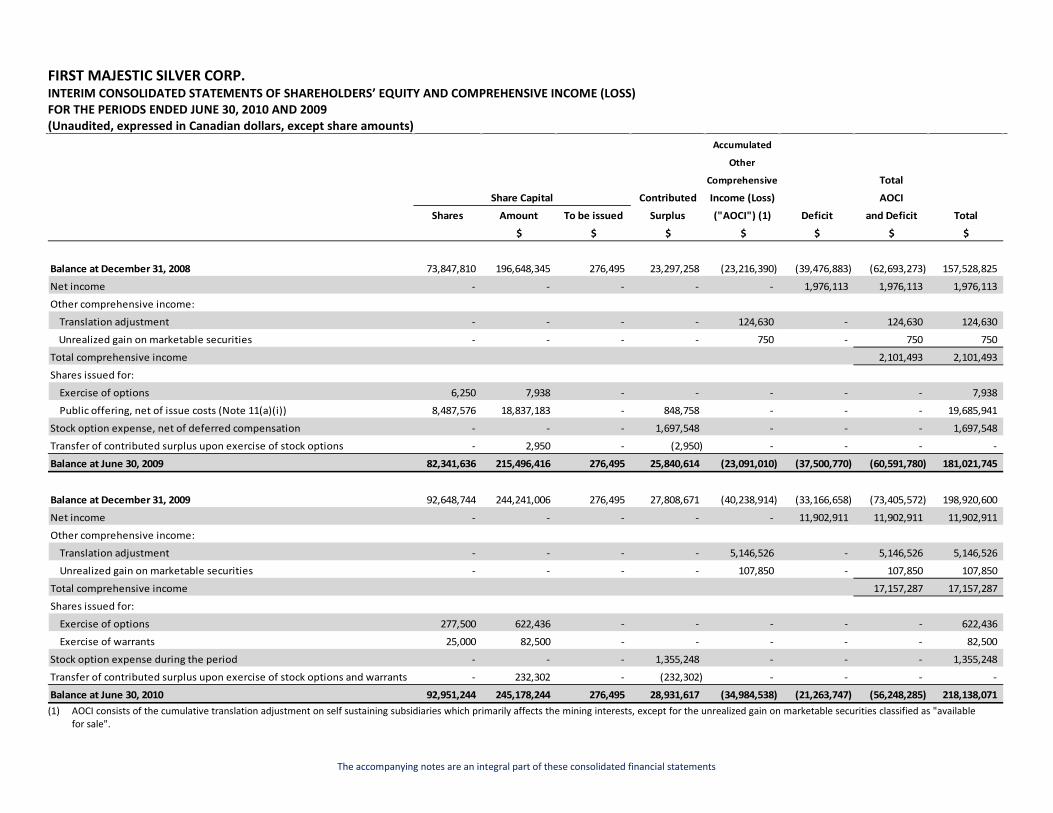
FIRST MAJESTIC SILVER CORP. INTERIM CONSOLIDATED STATEMENTS OF SHAREHOLDERS’ EQUITY AND COMPREHENSIVE INCOME (LOSS) FOR THE PERIODS ENDED JUNE 30, 2010 AND 2009 (Unaudited, expressed in Canadian dollars, except share amounts)
Accumulated
Other
Comprehensive Total
Contributed Income (Loss) AOCI
Shares Amount To be issued Surplus ("AOCI") (1) Deficit and Deficit Total
$ $ $ $ $ $ $
Balance at December 31, 2008 73,847,810 196,648,345 276,495 23,297,258 (23,216,390) (39,476,883) (62,693,273) 157,528,825
Net income - - - - - 1,976,113 1,976,113 1,976,113
Other comprehensive income:
Translation adjustment - - - - 124,630 - 124,630 124,630
Unrealized gain on marketable securities - - - - 750 - 750 750
Total comprehensive income 2,101,493 2,101,493
Shares issued for:
Exercise of options 6,250 7,938 - - - - - 7,938
Public offering, net of issue costs (Note 11(a)(i)) 8,487,576 18,837,183 - 848,758 - - - 19,685,941
Stock option expense, net of deferred compensation - - - 1,697,548 - - - 1,697,548
Transfer of contributed surplus upon exercise of stock options - 2,950 - (2,950) - - - -
Balance at June 30, 2009 82,341,636 215,496,416 276,495 25,840,614 (23,091,010) (37,500,770) (60,591,780) 181,021,745
Balance at December 31, 2009 92,648,744 244,241,006 276,495 27,808,671 (40,238,914) (33,166,658) (73,405,572) 198,920,600
Net income - - - - - 11,902,911 11,902,911 11,902,911
Other comprehensive income:
Translation adjustment - - - - 5,146,526 - 5,146,526 5,146,526
Unrealized gain on marketable securities - - - - 107,850 - 107,850 107,850
Total comprehensive income 17,157,287 17,157,287
Shares issued for:
Exercise of options 277,500 622,436 - - - - - 622,436
Exercise of warrants 25,000 82,500 - - - - - 82,500
Stock option expense during the period - - - 1,355,248 - - - 1,355,248
Transfer of contributed surplus upon exercise of stock options and warrants - 232,302 - (232,302) - - - -
Balance at June 30, 2010 92,951,244 245,178,244 276,495 28,931,617 (34,984,538) (21,263,747) (56,248,285) 218,138,071
Share Capital
(1) AOCI consists of the cumulative translation adjustment on self sustaining subsidiaries which primarily affects the mining interests, except for the unrealized gain on marketable securities classified as "available
for sale".
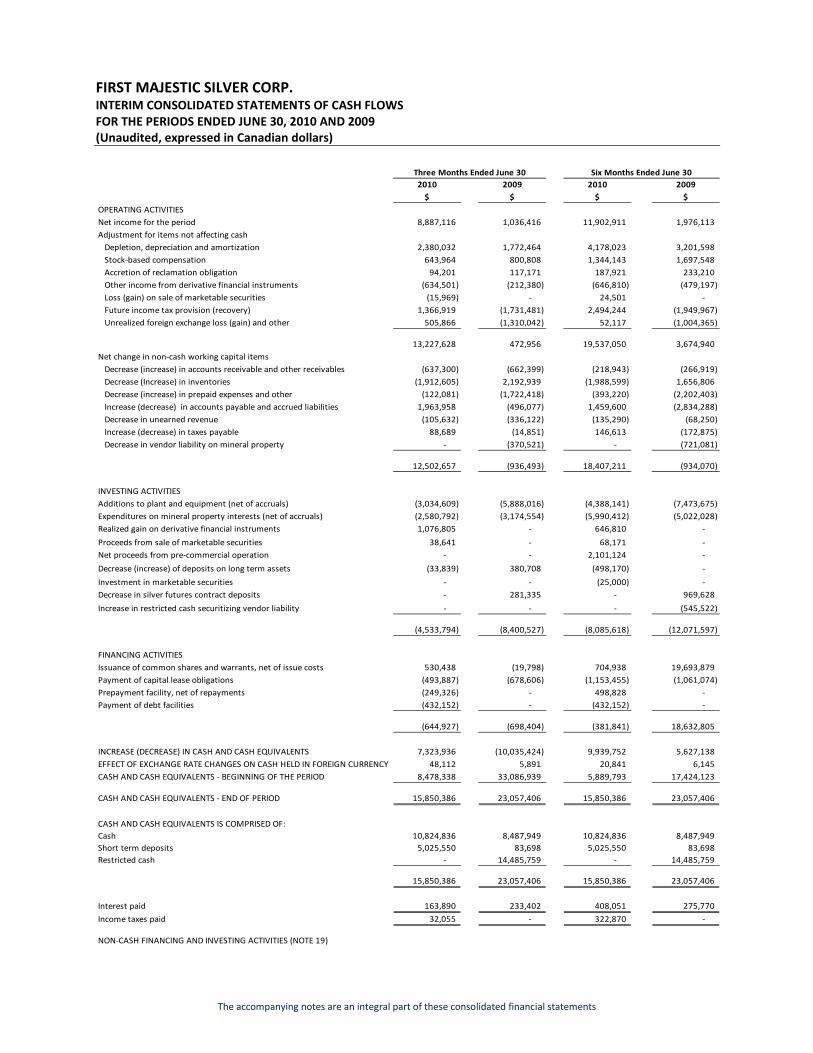
FIRST MAJESTIC SILVER CORP. INTERIM CONSOLIDATED STATEMENTS OF CASH FLOWS FOR THE PERIODS ENDED JUNE 30, 2010 AND 2009 (Unaudited, expressed in Canadian dollars)
The accompanying notes are an integral part of these consolidated financial statements
Three Months Ended June 30 Six Months Ended June 302010 2009 2010 2009
$ $ $ $OPERATING ACTIVITIES
Net income for the period 8,887,116 1,036,416 11,902,911 1,976,113 Adjustment for items not affecting cash
Depletion, depreciation and amortization 2,380,032 1,772,464 4,178,023 3,201,598 Stock-based compensation 643,964 800,808 1,344,143 1,697,548 Accretion of reclamation obligation 94,201 117,171 187,921 233,210 Other income from derivative financial instruments (634,501) (212,380) (646,810) (479,197) Loss (gain) on sale of marketable securities (15,969) - 24,501 - Future income tax provision (recovery) 1,366,919 (1,731,481) 2,494,244 (1,949,967) Unrealized foreign exchange loss (gain) and other 505,866 (1,310,042) 52,117 (1,004,365)
13,227,628 472,956 19,537,050 3,674,940 Net change in non-cash working capital items
Decrease (increase) in accounts receivable and other receivables (637,300) (662,399) (218,943) (266,919) Decrease (Increase) in inventories (1,912,605) 2,192,939 (1,988,599) 1,656,806 Decrease (increase) in prepaid expenses and other (122,081) (1,722,418) (393,220) (2,202,403) Increase (decrease) in accounts payable and accrued liabilities 1,963,958 (496,077) 1,459,600 (2,834,288) Decrease in unearned revenue (105,632) (336,122) (135,290) (68,250) Increase (decrease) in taxes payable 88,689 (14,851) 146,613 (172,875) Decrease in vendor liability on mineral property - (370,521) - (721,081)
12,502,657 (936,493) 18,407,211 (934,070)
INVESTING ACTIVITIESAdditions to plant and equipment (net of accruals) (3,034,609) (5,888,016) (4,388,141) (7,473,675) Expenditures on mineral property interests (net of accruals) (2,580,792) (3,174,554) (5,990,412) (5,022,028) Realized gain on derivative financial instruments 1,076,805 - 646,810 - Proceeds from sale of marketable securities 38,641 - 68,171 - Net proceeds from pre-commercial operation - - 2,101,124 - Decrease (increase) of deposits on long term assets (33,839) 380,708 (498,170) - Investment in marketable securities - - (25,000) - Decrease in silver futures contract deposits - 281,335 - 969,628 Increase in restricted cash securitizing vendor liability - - - (545,522)
(4,533,794) (8,400,527) (8,085,618) (12,071,597)
FINANCING ACTIVITIESIssuance of common shares and warrants, net of issue costs 530,438 (19,798) 704,938 19,693,879 Payment of capital lease obligations (493,887) (678,606) (1,153,455) (1,061,074) Prepayment facility, net of repayments (249,326) - 498,828 - Payment of debt facilities (432,152) - (432,152) -
(644,927) (698,404) (381,841) 18,632,805
INCREASE (DECREASE) IN CASH AND CASH EQUIVALENTS 7,323,936 (10,035,424) 9,939,752 5,627,138 EFFECT OF EXCHANGE RATE CHANGES ON CASH HELD IN FOREIGN CURRENCY 48,112 5,891 20,841 6,145 CASH AND CASH EQUIVALENTS - BEGINNING OF THE PERIOD 8,478,338 33,086,939 5,889,793 17,424,123
CASH AND CASH EQUIVALENTS - END OF PERIOD 15,850,386 23,057,406 15,850,386 23,057,406
CASH AND CASH EQUIVALENTS IS COMPRISED OF: Cash 10,824,836 8,487,949 10,824,836 8,487,949 Short term deposits 5,025,550 83,698 5,025,550 83,698 Restricted cash - 14,485,759 - 14,485,759
15,850,386 23,057,406 15,850,386 23,057,406
Interest paid 163,890 233,402 408,051 275,770 Income taxes paid 32,055 - 322,870 -
NON-CASH FINANCING AND INVESTING ACTIVITIES (NOTE 19)
FIRST MAJESTIC SILVER CORP. NOTES TO THE INTERIM CONSOLIDATED FINANCIAL STATEMENTS FOR THE PERIODS ENDED JUNE 30, 2010 AND 2009 (Unaudited)
Notes Page 1
1. DESCRIPTION OF BUSINESS AND CONTINUING OPERATIONS First Majestic Silver Corp. (the “Company” or “First Majestic”) is in the business of production, development, exploration, and acquisition of mineral properties with a focus on silver in Mexico. The Company’s shares and warrants trade on the Toronto Stock Exchange under the symbols “FR” and “FR.WT.B”, respectively. These consolidated financial statements have been prepared on the going concern basis which contemplates the realization of assets and satisfaction of liabilities in the normal course of business. The Company’s ability to continue as a going concern is dependent on the price of silver in global commodity markets, and on maintaining profitable operations or obtaining sufficient funds from alternative sources as required to augment operations and for ongoing capital developments. If the Company were unable to continue as a going concern, material adjustments may be required to the carrying value of assets and liabilities and the balance sheet classifications used. 2. BASIS OF PRESENTATION The consolidated financial statements of the Company have been prepared by management in accordance with Canadian generally accepted accounting principles (“GAAP”). These interim financial statements do not contain all the information required by GAAP for annual financial statements and should be read in conjunction with the Company’s latest audited consolidated financial statements for the year ended December 31, 2009. The consolidated financial statements include the accounts of the Company and its direct wholly-owned subsidiaries: Corporación First Majestic, S.A. de C.V. (“CFM”), First Silver Reserve Inc. (“First Silver”) and Normabec Mining Resources Ltd. (“Normabec”) as well as its indirect wholly-owned subsidiaries: First Majestic Plata, S.A. de C.V. (“First Majestic Plata”), Minera El Pilon, S.A. de C.V. (“El Pilon”), Minera La Encantada, S.A. de C.V. (“La Encantada”), Majestic Services S.A. de C.V. (“Majestic Services”), Minera Real Bonanza, S.A. de C.V. (“MRB”) and Servicios Minero-Metalurgicos e Industriales, S.A. de C.V. (“Servicios”). First Silver underwent a wind up and distribution of its assets and liabilities to the Company in December 2007 but First Silver has not been dissolved for legal purposes pending the outcome of litigation described in Note 8. Intercompany balances and transactions are eliminated on consolidation. 3. SIGNIFICANT CHANGES IN ACCOUNTING POLICIES
Change in Accounting Policy and Future Accounting Pronouncements Business Combinations, Consolidations and Non-controlling interests The CICA has approved new Handbook Section 1582, “Business Combinations”, Section 1601 “Consolidations” and Section 1602 “Non-controlling Interests” to harmonize with International Financial Reporting Standards (“IFRS”). These new sections will be effective for years beginning on or after January 1, 2011, with early adoption permitted. Section 1582 specifies a number of changes including: an expanded definition of a business, a requirement to measure all business acquisitions at fair value, a requirement to measure non-controlling interests at fair value, and a requirement to recognize acquisition related costs as expenses. Section 1601 establishes the standards for preparing consolidated financial statements. Section 1602 specifies that non-controlling interests be treated as a separate component of equity, not as a liability or other item outside of equity. The Company has adopted these new standards for the period ended June 30, 2010 and it has not had a material impact on the Company.
International Financial Reporting Standards (“IFRS”) In 2006, the Canadian Accounting Standards Board (“AcSB”) published a strategic plan that will significantly affect financial reporting requirements for Canadian companies. The AcSB strategic plan outlines convergence of Canadian GAAP with IFRS over an expected five-year transitional period. In February 2008, the AcSB announced that 2011 is the changeover date for public companies to commence using IFRS, replacing Canada’s own GAAP. The transition date is January 1, 2011, and relates to interim and annual financial statements on or after January 1, 2011. The transition will require the restatement for comparative purposes of amounts reported by the Company for all reporting periods beginning after January 1, 2010.
FIRST MAJESTIC SILVER CORP. NOTES TO THE INTERIM CONSOLIDATED FINANCIAL STATEMENTS FOR THE PERIODS ENDED JUNE 30, 2010 AND 2009 (Unaudited)
Notes Page 2
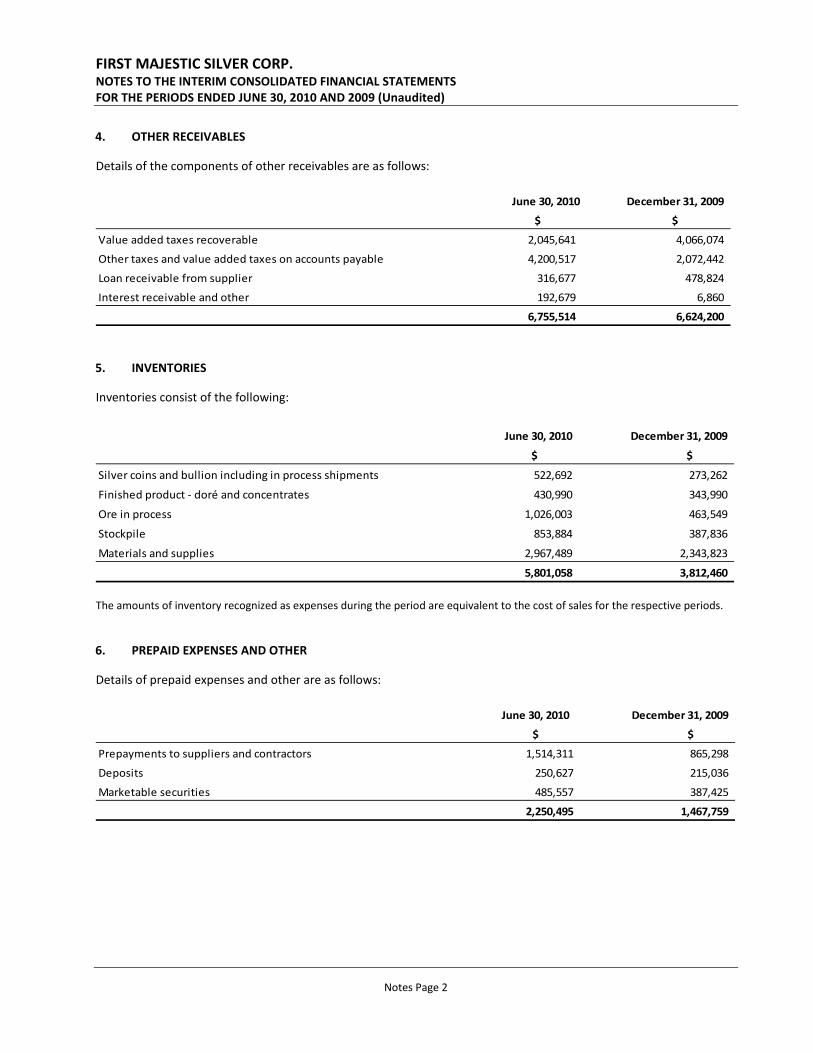
4. OTHER RECEIVABLES
Details of the components of other receivables are as follows:
June 30, 2010 December 31, 2009
$ $
Value added taxes recoverable 2,045,641 4,066,074
Other taxes and value added taxes on accounts payable 4,200,517 2,072,442
Loan receivable from supplier 316,677 478,824
Interest receivable and other 192,679 6,860
6,755,514 6,624,200 5. INVENTORIES
Inventories consist of the following:
June 30, 2010 December 31, 2009
$ $
Silver coins and bullion including in process shipments 522,692 273,262
Finished product - doré and concentrates 430,990 343,990
Ore in process 1,026,003 463,549
Stockpile 853,884 387,836
Materials and supplies 2,967,489 2,343,823
5,801,058 3,812,460 The amounts of inventory recognized as expenses during the period are equivalent to the cost of sales for the respective periods. 6. PREPAID EXPENSES AND OTHER
Details of prepaid expenses and other are as follows:
June 30, 2010 December 31, 2009
$ $
Prepayments to suppliers and contractors 1,514,311 865,298
Deposits 250,627 215,036
Marketable securities 485,557 387,425
2,250,495 1,467,759

FIRST MAJESTIC SILVER CORP. NOTES TO THE INTERIM CONSOLIDATED FINANCIAL STATEMENTS FOR THE PERIODS ENDED JUNE 30, 2010 AND 2009 (Unaudited)
Notes Page 3
7. MINING INTERESTS AND PLANT AND EQUIPMENT
Mining interests and plant and equipment, net of accumulated depreciation, depletion and amortization, are as follows:
Accumulated Accumulated
Depreciation, Depreciation,
Depletion and Depletion and
Cost Amortization Cost Amortization
$ $ $ $ $ $
Mining properties 192,959,326 18,875,052 174,084,274 183,585,673 17,185,500 166,400,173
Plant and equipment 78,886,829 11,103,571 67,783,258 69,026,387 8,637,857 60,388,530
271,846,155 29,978,623 241,867,532 252,612,060 25,823,357 226,788,703
June 30, 2010 December 31, 2009
Net Book Value
Net Book Value
A summary of the net book value of mining properties is as follows:
Accumulated Depletion
Accumulated Depletion
Cost and
Amortization Net Book
Value Cost and
Amortization Net Book
Value
MEXICO $ $ $ $ $ $
Producing propertiesLa Encantada (a) 15,148,790 3,040,538 12,108,252 13,055,900 2,886,830 10,169,070
La Parrilla (b) 25,232,160 3,480,989 21,751,171 22,371,850 3,009,041 19,362,809 San Martin (c) 40,526,307 12,353,525 28,172,782 38,902,227 11,289,629 27,612,598
80,907,257 18,875,052 62,032,205 74,329,977 17,185,500 57,144,477 Exploration properties
La Encantada (a) 2,679,019 - 2,679,019 2,467,451 - 2,467,451 La Parrilla (b) 7,886,775 - 7,886,775 7,625,168 - 7,625,168
San Martin (c) 68,705,647 - 68,705,647 65,931,244 - 65,931,244
Del Toro (d) 12,290,066 - 12,290,066 11,855,627 - 11,855,627
Real de Catorce (e) 20,490,562 - 20,490,562 21,376,206 - 21,376,206
112,052,069 - 112,052,069 109,255,696 - 109,255,696
192,959,326 18,875,052 174,084,274 183,585,673 17,185,500 166,400,173
December 31, 2009 June 30, 2010
FIRST MAJESTIC SILVER CORP. NOTES TO THE INTERIM CONSOLIDATED FINANCIAL STATEMENTS FOR THE PERIODS ENDED JUNE 30, 2010 AND 2009 (Unaudited)
Notes Page 4
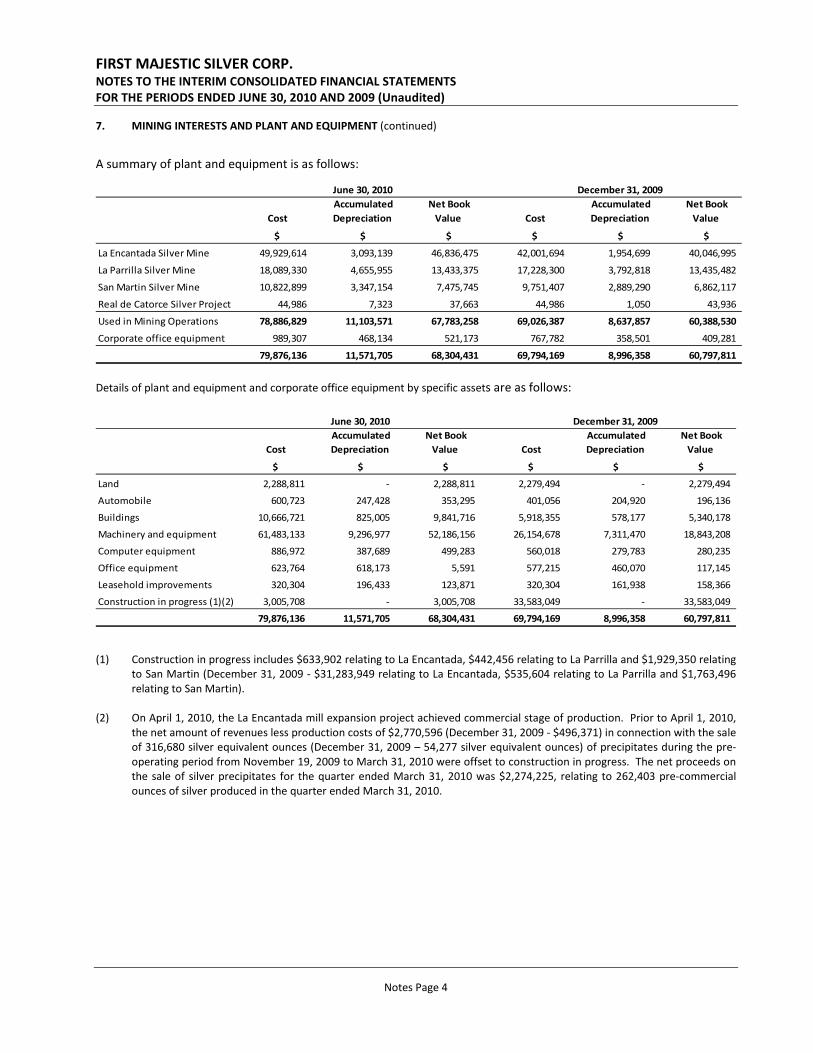
7. MINING INTERESTS AND PLANT AND EQUIPMENT (continued)
A summary of plant and equipment is as follows:
Cost Accumulated Depreciation
Net Book Value Cost
Accumulated Depreciation
Net Book Value
$ $ $ $ $ $
La Encantada Silver Mine 49,929,614 3,093,139 46,836,475 42,001,694 1,954,699 40,046,995
La Parrilla Silver Mine 18,089,330 4,655,955 13,433,375 17,228,300 3,792,818 13,435,482
San Martin Silver Mine 10,822,899 3,347,154 7,475,745 9,751,407 2,889,290 6,862,117
Real de Catorce Silver Project 44,986 7,323 37,663 44,986 1,050 43,936
Used in Mining Operations 78,886,829 11,103,571 67,783,258 69,026,387 8,637,857 60,388,530
Corporate office equipment 989,307 468,134 521,173 767,782 358,501 409,281
79,876,136 11,571,705 68,304,431 69,794,169 8,996,358 60,797,811
June 30, 2010 December 31, 2009
Details of plant and equipment and corporate office equipment by specific assets are as follows:
Cost Accumulated Depreciation
Net Book Value Cost
Accumulated Depreciation
Net Book Value
$ $ $ $ $ $
Land 2,288,811 - 2,288,811 2,279,494 - 2,279,494
Automobile 600,723 247,428 353,295 401,056 204,920 196,136
Buildings 10,666,721 825,005 9,841,716 5,918,355 578,177 5,340,178
Machinery and equipment 61,483,133 9,296,977 52,186,156 26,154,678 7,311,470 18,843,208
Computer equipment 886,972 387,689 499,283 560,018 279,783 280,235
Office equipment 623,764 618,173 5,591 577,215 460,070 117,145
Leasehold improvements 320,304 196,433 123,871 320,304 161,938 158,366
Construction in progress (1)(2) 3,005,708 - 3,005,708 33,583,049 - 33,583,049
79,876,136 11,571,705 68,304,431 69,794,169 8,996,358 60,797,811
June 30, 2010 December 31, 2009
(1) Construction in progress includes $633,902 relating to La Encantada, $442,456 relating to La Parrilla and $1,929,350 relating
to San Martin (December 31, 2009 - $31,283,949 relating to La Encantada, $535,604 relating to La Parrilla and $1,763,496 relating to San Martin).
(2) On April 1, 2010, the La Encantada mill expansion project achieved commercial stage of production. Prior to April 1, 2010,
the net amount of revenues less production costs of $2,770,596 (December 31, 2009 - $496,371) in connection with the sale of 316,680 silver equivalent ounces (December 31, 2009 – 54,277 silver equivalent ounces) of precipitates during the pre-operating period from November 19, 2009 to March 31, 2010 were offset to construction in progress. The net proceeds on the sale of silver precipitates for the quarter ended March 31, 2010 was $2,274,225, relating to 262,403 pre-commercial ounces of silver produced in the quarter ended March 31, 2010.
FIRST MAJESTIC SILVER CORP. NOTES TO THE INTERIM CONSOLIDATED FINANCIAL STATEMENTS FOR THE PERIODS ENDED JUNE 30, 2010 AND 2009 (Unaudited)
Notes Page 5
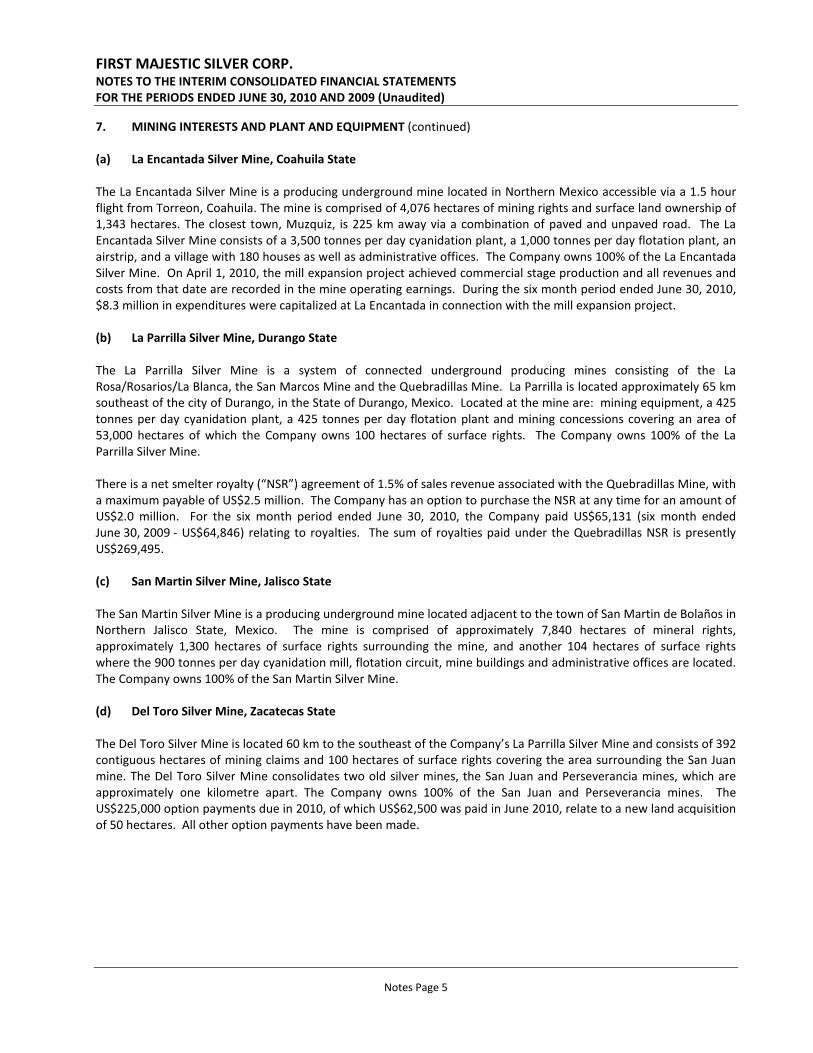
7. MINING INTERESTS AND PLANT AND EQUIPMENT (continued) (a) La Encantada Silver Mine, Coahuila State The La Encantada Silver Mine is a producing underground mine located in Northern Mexico accessible via a 1.5 hour flight from Torreon, Coahuila. The mine is comprised of 4,076 hectares of mining rights and surface land ownership of 1,343 hectares. The closest town, Muzquiz, is 225 km away via a combination of paved and unpaved road. The La Encantada Silver Mine consists of a 3,500 tonnes per day cyanidation plant, a 1,000 tonnes per day flotation plant, an airstrip, and a village with 180 houses as well as administrative offices. The Company owns 100% of the La Encantada Silver Mine. On April 1, 2010, the mill expansion project achieved commercial stage production and all revenues and costs from that date are recorded in the mine operating earnings. During the six month period ended June 30, 2010, $8.3 million in expenditures were capitalized at La Encantada in connection with the mill expansion project. (b) La Parrilla Silver Mine, Durango State The La Parrilla Silver Mine is a system of connected underground producing mines consisting of the La Rosa/Rosarios/La Blanca, the San Marcos Mine and the Quebradillas Mine. La Parrilla is located approximately 65 km southeast of the city of Durango, in the State of Durango, Mexico. Located at the mine are: mining equipment, a 425 tonnes per day cyanidation plant, a 425 tonnes per day flotation plant and mining concessions covering an area of 53,000 hectares of which the Company owns 100 hectares of surface rights. The Company owns 100% of the La Parrilla Silver Mine. There is a net smelter royalty (“NSR”) agreement of 1.5% of sales revenue associated with the Quebradillas Mine, with a maximum payable of US$2.5 million. The Company has an option to purchase the NSR at any time for an amount of US$2.0 million. For the six month period ended June 30, 2010, the Company paid US$65,131 (six month ended June 30, 2009 - US$64,846) relating to royalties. The sum of royalties paid under the Quebradillas NSR is presently US$269,495. (c) San Martin Silver Mine, Jalisco State The San Martin Silver Mine is a producing underground mine located adjacent to the town of San Martin de Bolaños in Northern Jalisco State, Mexico. The mine is comprised of approximately 7,840 hectares of mineral rights, approximately 1,300 hectares of surface rights surrounding the mine, and another 104 hectares of surface rights where the 900 tonnes per day cyanidation mill, flotation circuit, mine buildings and administrative offices are located. The Company owns 100% of the San Martin Silver Mine. (d) Del Toro Silver Mine, Zacatecas State The Del Toro Silver Mine is located 60 km to the southeast of the Company’s La Parrilla Silver Mine and consists of 392 contiguous hectares of mining claims and 100 hectares of surface rights covering the area surrounding the San Juan mine. The Del Toro Silver Mine consolidates two old silver mines, the San Juan and Perseverancia mines, which are approximately one kilometre apart. The Company owns 100% of the San Juan and Perseverancia mines. The US$225,000 option payments due in 2010, of which US$62,500 was paid in June 2010, relate to a new land acquisition of 50 hectares. All other option payments have been made.
FIRST MAJESTIC SILVER CORP. NOTES TO THE INTERIM CONSOLIDATED FINANCIAL STATEMENTS FOR THE PERIODS ENDED JUNE 30, 2010 AND 2009 (Unaudited)
Notes Page 6
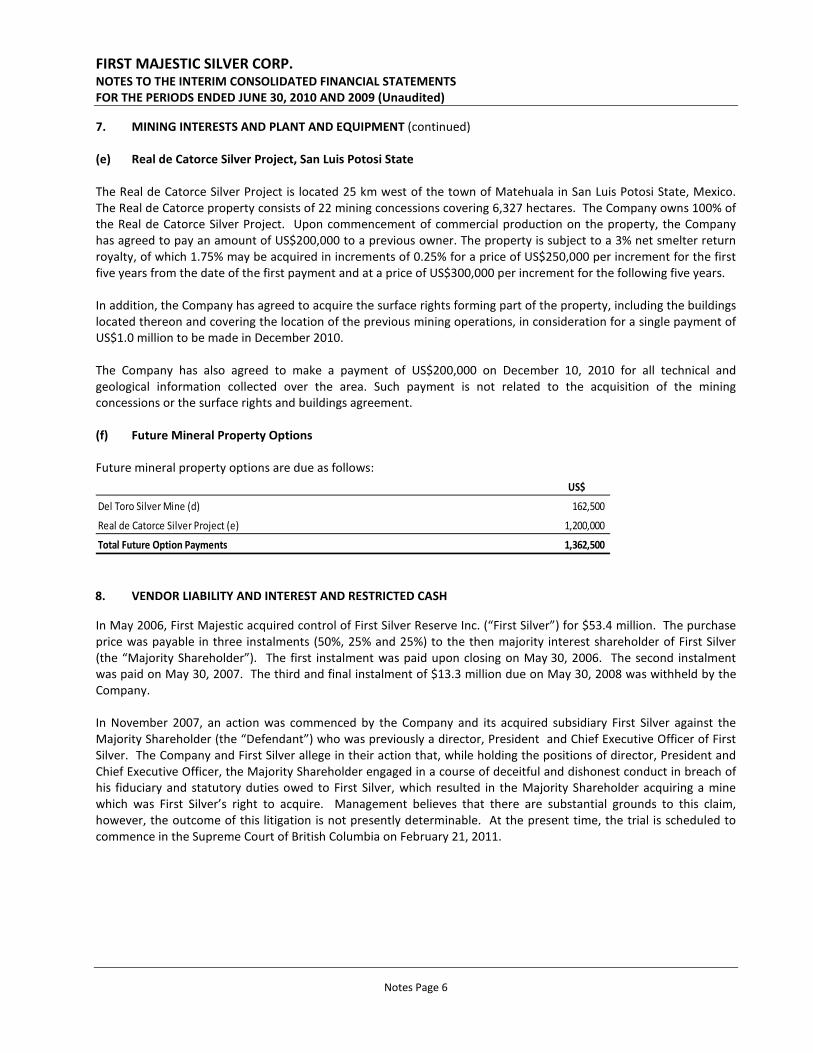
7. MINING INTERESTS AND PLANT AND EQUIPMENT (continued) (e) Real de Catorce Silver Project, San Luis Potosi State The Real de Catorce Silver Project is located 25 km west of the town of Matehuala in San Luis Potosi State, Mexico. The Real de Catorce property consists of 22 mining concessions covering 6,327 hectares. The Company owns 100% of the Real de Catorce Silver Project. Upon commencement of commercial production on the property, the Company has agreed to pay an amount of US$200,000 to a previous owner. The property is subject to a 3% net smelter return royalty, of which 1.75% may be acquired in increments of 0.25% for a price of US$250,000 per increment for the first five years from the date of the first payment and at a price of US$300,000 per increment for the following five years. In addition, the Company has agreed to acquire the surface rights forming part of the property, including the buildings located thereon and covering the location of the previous mining operations, in consideration for a single payment of US$1.0 million to be made in December 2010. The Company has also agreed to make a payment of US$200,000 on December 10, 2010 for all technical and geological information collected over the area. Such payment is not related to the acquisition of the mining concessions or the surface rights and buildings agreement. (f) Future Mineral Property Options Future mineral property options are due as follows:
US$
Del Toro Silver Mine (d) 162,500
Real de Catorce Silver Project (e) 1,200,000
Total Future Option Payments 1,362,500 8. VENDOR LIABILITY AND INTEREST AND RESTRICTED CASH
In May 2006, First Majestic acquired control of First Silver Reserve Inc. (“First Silver”) for $53.4 million. The purchase price was payable in three instalments (50%, 25% and 25%) to the then majority interest shareholder of First Silver (the “Majority Shareholder”). The first instalment was paid upon closing on May 30, 2006. The second instalment was paid on May 30, 2007. The third and final instalment of $13.3 million due on May 30, 2008 was withheld by the Company. In November 2007, an action was commenced by the Company and its acquired subsidiary First Silver against the Majority Shareholder (the “Defendant”) who was previously a director, President and Chief Executive Officer of First Silver. The Company and First Silver allege in their action that, while holding the positions of director, President and Chief Executive Officer, the Majority Shareholder engaged in a course of deceitful and dishonest conduct in breach of his fiduciary and statutory duties owed to First Silver, which resulted in the Majority Shareholder acquiring a mine which was First Silver’s right to acquire. Management believes that there are substantial grounds to this claim, however, the outcome of this litigation is not presently determinable. At the present time, the trial is scheduled to commence in the Supreme Court of British Columbia on February 21, 2011.

FIRST MAJESTIC SILVER CORP. NOTES TO THE INTERIM CONSOLIDATED FINANCIAL STATEMENTS FOR THE PERIODS ENDED JUNE 30, 2010 AND 2009 (Unaudited)
Notes Page 7
8. VENDOR LIABILITY AND INTEREST AND RESTRICTED CASH (continued) In March 2008, the Defendant filed a Counterclaim against the Company for unpaid amounts and interest of $14.9 million, and this action was secured by a $14.5 million Letter of Credit posted in Court by First Majestic. The Company recorded these amounts as Restricted Cash as at March 31, 2009. In July 2009, an Order was granted by the Court, with the consent of all parties, under which the Defendant obtained a judgment in the amount of $14.9 million. The Company agreed to pay out $14.3 million from the posted Letter of Credit to the Defendant’s lawyer’s trust account (the “Trust Funds”) in partial payment of the Judgment. The remaining funds from the Letter of Credit were paid out to the Company. The Consent Order requires that the Trust Funds be held in trust pending the outcome of the Company’s action. If the trial has not commenced by June 30, 2011, the Trust Funds can be released to the Defendant, unless otherwise ordered by the court. These funds would be accessible to the Company in the event of a favourable outcome to the litigation. 9. DEBT FACILITIES
(a) Pre-Payment Facility
In August 2009, a subsidiary of the parent company entered into an agreement for a six-month pre-payment facility for advances on the sale of lead in its concentrate production. Under the terms of the agreement, $1.6 million (US$1.5 million) was advanced against the Company’s lead concentrate production from the La Parrilla Silver Mine for a period of six months. Interest accrues at an annualized floating rate of one-month LIBOR plus 5%. Interest is payable monthly and the principal amount is repayable based on the volume of lead concentrate shipped with minimum monthly instalments of US$250,000 required. The repayment of the credit facility is guaranteed by the parent company. On February 28, 2010, this agreement was amended to provide an additional six-month pre-payment facility of up to $1.6 million (US$1.5 million). A total of $1.6 million (US$1.5 million) was drawn on this pre-payment facility. As at June 30, 2010, after delivering monthly quotas of lead concentrates and payments of interest charges, the Company had a remaining balance payable on the pre-payment facility of $627,681 (US$591,817).
(b) FIFOMI Loan Facilities
In October 2009, the Company entered into an agreement with the Mexican Mining Development Trust - Fideicomiso de Fomento Minero (FIFOMI) for two loan facilities, a capital asset loan and a working capital loan, totalling 53.8 million Mexican pesos (CAD$4.3 million). Funds from these loans were used for the completion of the 3,500 tonnes per day cyanidation plant at the La Encantada Silver Mine and for working capital purposes. The capital asset loan, for up to 47.1 million Mexican pesos (CAD$3.7 million), bears interest at the Mexican interbank rate plus 7.51% per annum and is repayable over a 60-month period. The working capital loan, for up to 6.7 million Mexican pesos (CAD$0.6 million), bears interest at the Mexican interbank rate plus 7.31% per annum and is a 90-day revolving loan. The loans are secured against real property, land, buildings, facilities, machinery and equipment at the La Encantada Silver Mine. At June 30, 2010, the balance owing was 52.0 million Mexican pesos (CAD$4.3 million) of which 17.2 million Mexican pesos (CAD$2.0 million) was classified as current. The following is a summary of the debt facilities as at June 30, 2010:
$CAD
Pre-payment Facility 627,681
FIFOMI Loan Facilities 4,298,774
4,926,455
Less: current portion (2,045,440)
Long-term Portion of Debt Facilities 2,881,015
FIRST MAJESTIC SILVER CORP. NOTES TO THE INTERIM CONSOLIDATED FINANCIAL STATEMENTS FOR THE PERIODS ENDED JUNE 30, 2010 AND 2009 (Unaudited)
Notes Page 8
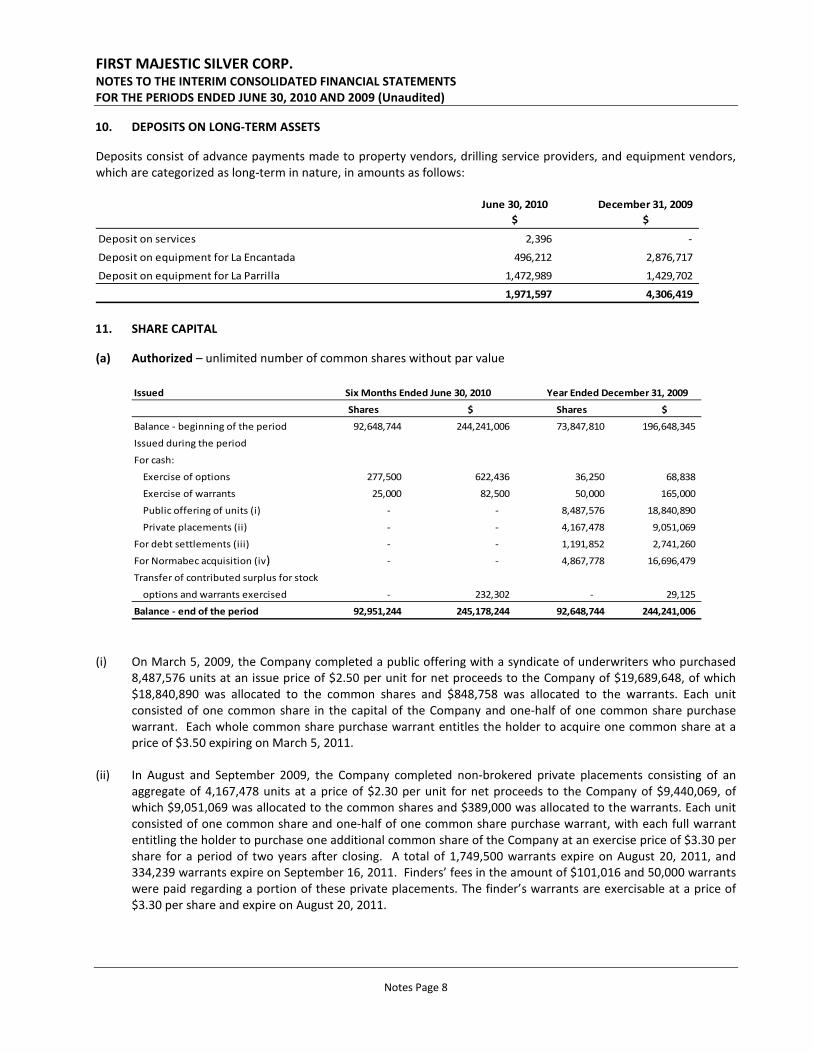
10. DEPOSITS ON LONG-TERM ASSETS
Deposits consist of advance payments made to property vendors, drilling service providers, and equipment vendors, which are categorized as long-term in nature, in amounts as follows:
June 30, 2010$
December 31, 2009$
Deposit on services 2,396 -
Deposit on equipment for La Encantada 496,212 2,876,717
Deposit on equipment for La Parrilla 1,472,989 1,429,702
1,971,597 4,306,419 11. SHARE CAPITAL
(a) Authorized – unlimited number of common shares without par value
Issued
Shares $ Shares $
Balance - beginning of the period 92,648,744 244,241,006 73,847,810 196,648,345
Issued during the period
For cash:
Exercise of options 277,500 622,436 36,250 68,838
Exercise of warrants 25,000 82,500 50,000 165,000
Public offering of units (i) - - 8,487,576 18,840,890
Private placements (ii) - - 4,167,478 9,051,069
For debt settlements (iii) - - 1,191,852 2,741,260
For Normabec acquisition (iv) - - 4,867,778 16,696,479
Transfer of contributed surplus for stock
options and warrants exercised - 232,302 - 29,125
Balance - end of the period 92,951,244 245,178,244 92,648,744 244,241,006
Six Months Ended June 30, 2010 Year Ended December 31, 2009
(i) On March 5, 2009, the Company completed a public offering with a syndicate of underwriters who purchased
8,487,576 units at an issue price of $2.50 per unit for net proceeds to the Company of $19,689,648, of which $18,840,890 was allocated to the common shares and $848,758 was allocated to the warrants. Each unit consisted of one common share in the capital of the Company and one-half of one common share purchase warrant. Each whole common share purchase warrant entitles the holder to acquire one common share at a price of $3.50 expiring on March 5, 2011.
(ii) In August and September 2009, the Company completed non-brokered private placements consisting of an aggregate of 4,167,478 units at a price of $2.30 per unit for net proceeds to the Company of $9,440,069, of which $9,051,069 was allocated to the common shares and $389,000 was allocated to the warrants. Each unit consisted of one common share and one-half of one common share purchase warrant, with each full warrant entitling the holder to purchase one additional common share of the Company at an exercise price of $3.30 per share for a period of two years after closing. A total of 1,749,500 warrants expire on August 20, 2011, and 334,239 warrants expire on September 16, 2011. Finders’ fees in the amount of $101,016 and 50,000 warrants were paid regarding a portion of these private placements. The finder’s warrants are exercisable at a price of $3.30 per share and expire on August 20, 2011.

FIRST MAJESTIC SILVER CORP. NOTES TO THE INTERIM CONSOLIDATED FINANCIAL STATEMENTS FOR THE PERIODS ENDED JUNE 30, 2010 AND 2009 (Unaudited)
Notes Page 9
11. SHARE CAPITAL (continued) (iii) In August and September 2009, the Company settled certain current liabilities amounting to $2,741,260 by the
issuance of 1,191,852 common shares of the Company at a value of $2.30 per share.
(iv) On November 13, 2009, the Company issued 4,867,778 common shares at a value of $3.43 per share in connection with the acquisition of Normabec.
(b) Stock Options Under the terms of the Company’s Stock Option Plan, the maximum number of shares reserved for issuance under the Plan is 10% of the issued shares on a rolling basis. Options may be exercisable over periods of up to five years as determined by the board of directors of the Company and the exercise price shall not be less than the closing price of the shares on the day preceding the award date, subject to regulatory approval. All stock options are subject to vesting with 25% vesting upon issuance and 25% vesting each six months thereafter.
The changes in stock options outstanding for the periods ended June 30, 2010 and December 31, 2009 are as follows:
Number of Shares
Weighted Average
Exercise Price ($)
Weighted Average
Remaining Life Number of
Shares
Weighted Average
Exercise Price ($)
Weighted Average
Remaining Life
Balance, beginning of the period 8,603,750 3.50 2.4 years 6,862,500 3.84 2.8 yearsGranted 460,000 3.77 3.0 years 2,842,500 2.88 3.6 yearsExercised (277,500) 2.24 1.6 years (36,250) 1.90 2.5 yearsForfeited or expired (428,750) 4.80 0.5 years (1,065,000) 4.11 0.7 years
Balance, end of the period 8,357,500 3.23 2.1 years 8,603,750 3.50 2.4 years
Six Months Ended June 30, 2010 Year Ended December 31, 2009

FIRST MAJESTIC SILVER CORP. NOTES TO THE INTERIM CONSOLIDATED FINANCIAL STATEMENTS FOR THE PERIODS ENDED JUNE 30, 2010 AND 2009 (Unaudited)
Notes Page 10
11. SHARE CAPITAL (continued) (b) Stock Options (continued) The following table summarizes both the stock options outstanding and those that are exercisable at June 30, 2010:
Price Options Options$ Outstanding Exercisable Expiry Dates
4.17 100,000 100,000 August 8, 20103.72 30,000 30,000 September 24, 20103.98 20,000 20,000 October 17, 20104.45 495,000 495,000 October 30, 20104.34 25,000 25,000 November 1, 20104.34 200,000 200,000 December 5, 20104.42 50,000 50,000 February 20, 20114.65 100,000 100,000 March 25, 20114.19 20,000 20,000 April 26, 20114.02 100,000 100,000 May 15, 20114.30 450,000 450,000 June 19, 20114.67 90,000 90,000 July 4, 20114.15 275,000 275,000 July 28, 20113.62 495,000 495,000 August 28, 20111.60 100,000 100,000 October 8, 20111.27 100,000 100,000 October 17, 20114.32 245,000 245,000 December 6, 20114.41 400,000 400,000 December 22, 20115.00 155,000 155,000 February 7, 20122.03 635,000 476,250 May 7, 20124.65 25,000 25,000 June 20, 20122.62 60,000 30,000 September 16, 20122.96 25,000 12,500 October 28, 20124.34 925,000 925,000 December 5, 20123.52 540,000 270,000 December 7, 20123.70 522,500 261,250 December 15, 20123.56 200,000 50,000 February 2, 20133.15 25,000 6,250 March 19, 20133.98 100,000 25,000 May 13, 20134.64 75,000 18,750 June 2, 20133.94 10,000 2,500 June 3, 20134.47 50,000 12,500 June 28, 20133.62 100,000 100,000 August 28, 20131.44 240,000 240,000 November 10, 20131.56 550,000 550,000 December 17, 20132.03 462,500 346,875 May 7, 20142.32 12,500 9,375 June 15, 20143.70 350,000 175,000 December 15, 2014
8,357,500 6,986,250
During the six months ended June 30, 2010, the Company granted stock options to an officer and several employees to purchase 460,000 shares (six months ended June 30, 2009 – 1,275,000 shares) of the Company. Pursuant to the Company’s policy of accounting for the fair value of stock-based compensation over the applicable vesting period, the fair value of stock options granted during the six month period was $680,000 of which $252,486 was expensed in the current period and $427,514 was deferred and will be amortized over the remaining vesting period of the stock options.
FIRST MAJESTIC SILVER CORP. NOTES TO THE INTERIM CONSOLIDATED FINANCIAL STATEMENTS FOR THE PERIODS ENDED JUNE 30, 2010 AND 2009 (Unaudited)
Notes Page 11
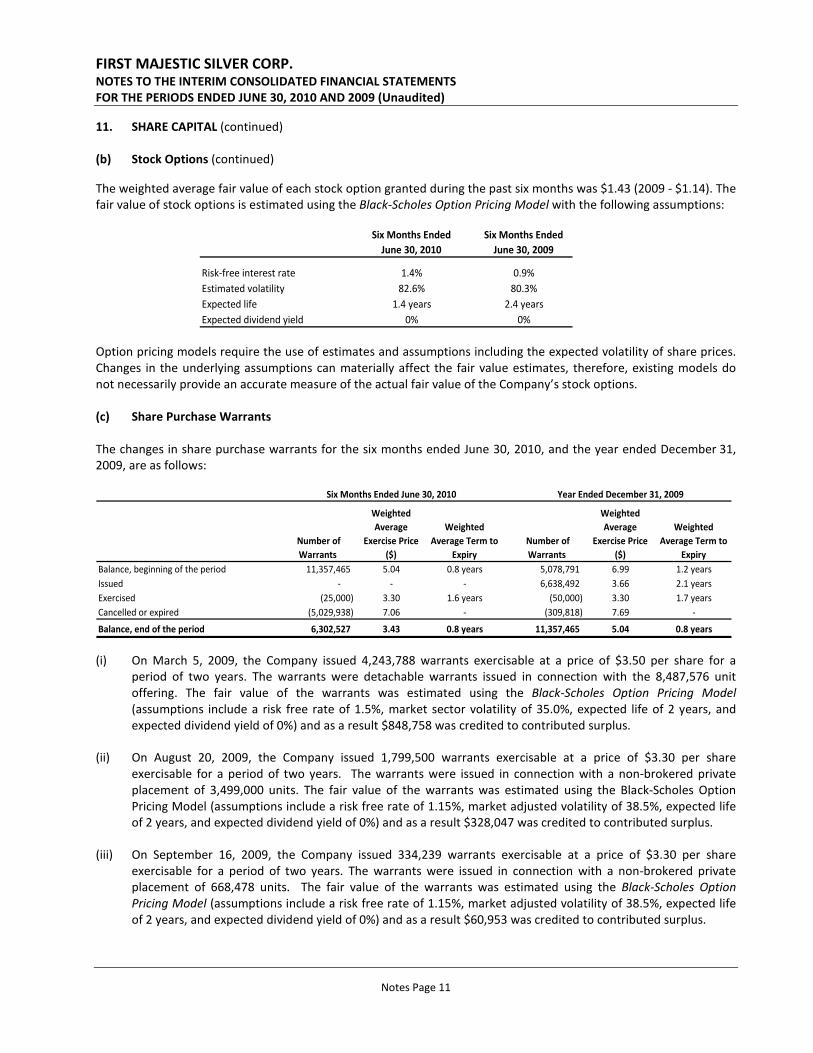
11. SHARE CAPITAL (continued) (b) Stock Options (continued) The weighted average fair value of each stock option granted during the past six months was $1.43 (2009 - $1.14). The fair value of stock options is estimated using the Black-Scholes Option Pricing Model with the following assumptions:
Six Months Ended June 30, 2010
Six Months Ended June 30, 2009
Risk-free interest rate 1.4% 0.9%Estimated volatility 82.6% 80.3%Expected life 1.4 years 2.4 yearsExpected dividend yield 0% 0%
Option pricing models require the use of estimates and assumptions including the expected volatility of share prices. Changes in the underlying assumptions can materially affect the fair value estimates, therefore, existing models do not necessarily provide an accurate measure of the actual fair value of the Company’s stock options. (c) Share Purchase Warrants The changes in share purchase warrants for the six months ended June 30, 2010, and the year ended December 31, 2009, are as follows:
Number of Warrants
Weighted Average
Exercise Price ($)
Weighted Average Term to
Expiry Number of Warrants
Weighted Average
Exercise Price ($)
Weighted Average Term to
ExpiryBalance, beginning of the period 11,357,465 5.04 0.8 years 5,078,791 6.99 1.2 yearsIssued - - - 6,638,492 3.66 2.1 yearsExercised (25,000) 3.30 1.6 years (50,000) 3.30 1.7 yearsCancelled or expired (5,029,938) 7.06 - (309,818) 7.69 -
Balance, end of the period 6,302,527 3.43 0.8 years 11,357,465 5.04 0.8 years
Six Months Ended June 30, 2010 Year Ended December 31, 2009
(i) On March 5, 2009, the Company issued 4,243,788 warrants exercisable at a price of $3.50 per share for a period of two years. The warrants were detachable warrants issued in connection with the 8,487,576 unit offering. The fair value of the warrants was estimated using the Black-Scholes Option Pricing Model (assumptions include a risk free rate of 1.5%, market sector volatility of 35.0%, expected life of 2 years, and expected dividend yield of 0%) and as a result $848,758 was credited to contributed surplus.
(ii) On August 20, 2009, the Company issued 1,799,500 warrants exercisable at a price of $3.30 per share exercisable for a period of two years. The warrants were issued in connection with a non-brokered private placement of 3,499,000 units. The fair value of the warrants was estimated using the Black-Scholes Option Pricing Model (assumptions include a risk free rate of 1.15%, market adjusted volatility of 38.5%, expected life of 2 years, and expected dividend yield of 0%) and as a result $328,047 was credited to contributed surplus.
(iii) On September 16, 2009, the Company issued 334,239 warrants exercisable at a price of $3.30 per share exercisable for a period of two years. The warrants were issued in connection with a non-brokered private placement of 668,478 units. The fair value of the warrants was estimated using the Black-Scholes Option Pricing Model (assumptions include a risk free rate of 1.15%, market adjusted volatility of 38.5%, expected life of 2 years, and expected dividend yield of 0%) and as a result $60,953 was credited to contributed surplus.

FIRST MAJESTIC SILVER CORP. NOTES TO THE INTERIM CONSOLIDATED FINANCIAL STATEMENTS FOR THE PERIODS ENDED JUNE 30, 2010 AND 2009 (Unaudited)
Notes Page 12
11. SHARE CAPITAL (continued) (c) Share Purchase Warrants (continued) (iv) On November 13, 2009, in connection with the acquisition of Normabec, the Company issued 118,527 warrants
exercisable at a price of $9.11 per share expiring on December 13, 2009, and 142,438 warrants exercisable at a price of $9.11 per share expiring on January 2, 2010. The fair value of the warrants was estimated using the Black-Scholes Option Pricing Model (assumptions include a risk free rate of 1.26%, volatility of 67%, expected life of 0.1 year, and expected dividend yield of 0%). No value was credited to contributed surplus. These warrants expired unexercised.
The following table summarizes the share purchase warrants outstanding at June 30, 2010:
Exercise Price Warrants $ Outstanding Expiry Dates
3.50 4,243,788 March 5, 20113.30 1,724,500 August 20, 20113.30 334,239 September 16, 2011
6,302,527 (d) Share Capital to be Issued On June 5, 2006, pursuant to the acquisition of First Silver Reserve Inc., First Majestic and First Silver entered into a business combination agreement whereby First Majestic agreed to acquire the remaining 36.25% minority interest in First Silver. At June 30, 2010, prior shareholders of First Silver had not yet exchanged 114,254 shares of First Silver, exchangeable for 57,127 shares of First Majestic, resulting in a remaining value of shares to be issued of $276,495.
Any certificate formerly representing First Silver shares not duly surrendered on or prior to September 14, 2012 shall cease to represent a claim or interest of any kind or nature, including a claim for dividends or other distributions against First Majestic or First Silver by any former First Silver shareholder. After such date, all First Majestic shares to which the former First Silver shareholder was entitled shall be deemed to have been cancelled. 12. REVENUES
Details of the components of net revenue are as follows:
Three Months Ended June 30, Six Months Ended June 30,
2009 2009
$ $
Combined revenue - silver doré bars, concentrates, coins and ingots 32,841,120 18,003,518 57,012,365 35,467,655
Less: intercompany eliminations (1,041,738) (2,223,922) (3,277,271) (2,223,922)
Consolidated gross revenue 31,799,382 15,779,596 53,735,094 33,243,733
Less: refining, smelting, net of intercompany eliminations (1,887,793) (2,165,720) (4,624,310) (4,706,462)
Less: metal deductions, net of intercompany eliminations (948,304) (588,999) (1,929,885) (1,125,522)
Net revenue 28,963,285 13,024,877 47,180,899 27,411,749
2010 2010
$ $
The La Encantada mill expansion project achieved commercial stage of production on April 1, 2010. Sales incurred during the pre-operating period were recorded as a reduction of capital costs and are excluded from sales revenue. As a result, sales of $4,718,618 (2009 - $nil) in connection with the sale of 262,403 silver equivalent ounces of precipitates during the quarter ended March 31, 2010 were excluded from the above table.

FIRST MAJESTIC SILVER CORP. NOTES TO THE INTERIM CONSOLIDATED FINANCIAL STATEMENTS FOR THE PERIODS ENDED JUNE 30, 2010 AND 2009 (Unaudited)
Notes Page 13
13. SEGMENTED INFORMATION
The Company has three operating segments located in Mexico, one retail market segment in Canada and one corporate segment with locations in Canada and Mexico. The San Martin operations consist of the San Martin Silver Mine, the San Martin property and the Jalisco Group of Properties. The La Parrilla operations consist of the La Parrilla Silver Mine, the Del Toro Silver Mine, the La Parrilla properties and the Del Toro properties. The La Encantada operations consist of the La Encantada Silver Mine and the La Encantada property. These reportable operating segments are summarized in the table below:
San Martin operations
La Parrillaoperations
La Encantada operations Coin Sales
Corporate and Other
Eliminations Total $ $ $ $ $ $
Revenue 5,511,981 7,100,001 15,633,775 1,648,899 (931,371) 28,963,285 Cost of sales 3,201,270 3,010,188 6,529,912 1,322,626 (629,249) 13,434,747 Depletion, depreciation and amortization, and accretion of ARO 623,700 596,002 1,254,531 - - 2,474,233 Mine operating earnings (loss) 1,687,011 3,493,811 7,849,332 326,273 (302,122) 13,054,305 General and administrative - - - - 2,406,842 2,406,842 Stock-based compensation - - - - 643,964 643,964 Interest expense (income) 274,906 2,536,640 1,349,205 - (3,187,114) 973,637 Other expense (income) and foreign - exchange (127,735) (276,609) 438,660 - (1,303,900) (1,269,584) Income tax expense (recovery) 268,181 116,836 779,191 - 248,122 1,412,330 Net income (loss) 1,271,659 1,116,944 5,282,276 326,273 889,964 8,887,116 Capital expenditures 774,169 1,134,124 4,092,667 - 211,851 6,212,811 Total assets 109,125,407 64,068,493 72,640,351 - 31,580,187 277,414,438
Three Months Ended June 30, 2010
San Martin operations
La Parrilla operations
La Encantada operations Coin Sales
Corporate and Other Eliminations Total
$ $ $ $ $ $ Revenue 5,128,241 5,206,431 2,678,133 1,807,629 (1,795,557) 13,024,877 Cost of sales 3,326,950 3,436,485 2,588,633 1,779,193 (1,671,393) 9,459,868 Depletion, depreciation and amortization, and accretion of ARO 701,235 775,918 412,482 - - 1,889,635 Mine operating earnings (loss) 1,100,056 994,028 (322,982) 28,436 (124,164) 1,675,374 General and administrative - - - - 2,114,312 2,114,312 Stock-based compensation - - - - 800,808 800,808 Interest expense (income) 45,143 66,600 52,526 - 178,537 342,806 Other expense (income) and foreign exchange (118,373) (670,022) (470,142) - 257,365 (1,001,172) Income tax (recovery) expense 121,398 (58,486) (599,696) - (1,081,012) (1,617,796) Net income (loss) 1,051,888 1,655,936 694,330 28,436 (2,394,174) 1,036,416 Capital expenditures 874,235 1,903,461 6,419,379 - 131,485 9,328,560 Total assets 118,788,430 62,249,122 49,559,957 - 22,489,594 253,087,103
Three Months Ended June 30, 2009
FIRST MAJESTIC SILVER CORP. NOTES TO THE INTERIM CONSOLIDATED FINANCIAL STATEMENTS FOR THE PERIODS ENDED JUNE 30, 2010 AND 2009 (Unaudited)
Notes Page 14
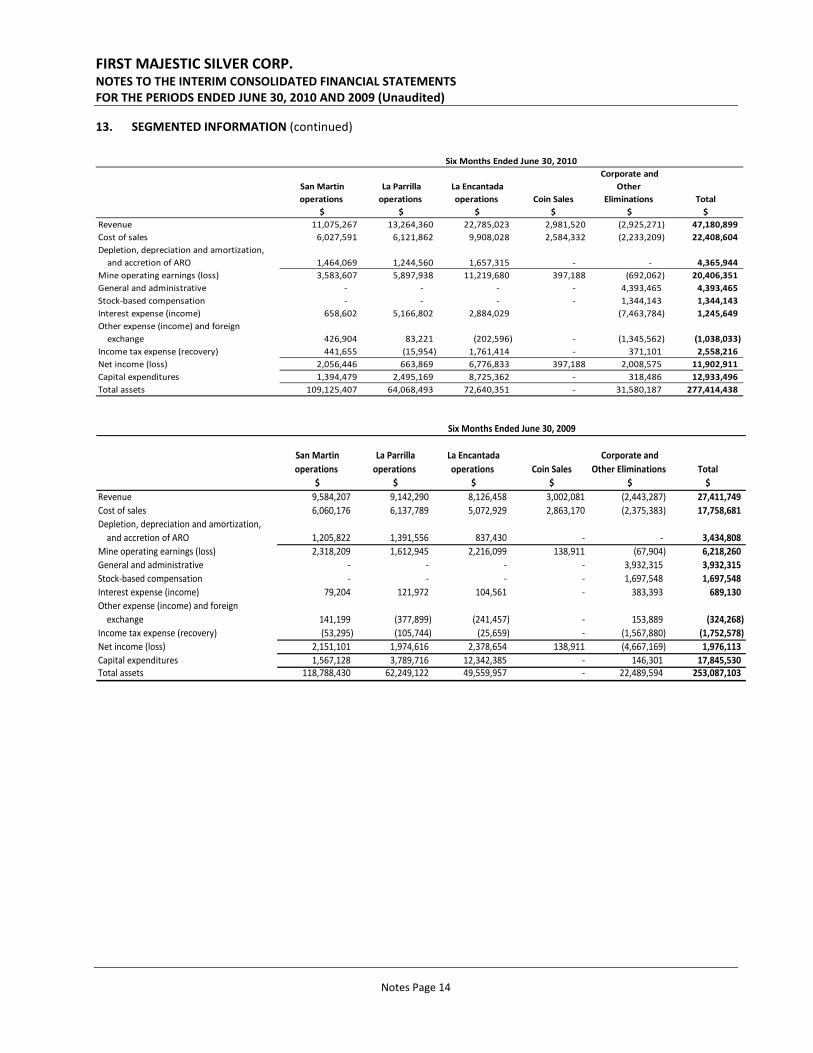
13. SEGMENTED INFORMATION (continued)
San Martin operations
La Parrillaoperations
La Encantada operations Coin Sales
Corporate and Other
Eliminations Total $ $ $ $ $ $
Revenue 11,075,267 13,264,360 22,785,023 2,981,520 (2,925,271) 47,180,899 Cost of sales 6,027,591 6,121,862 9,908,028 2,584,332 (2,233,209) 22,408,604 Depletion, depreciation and amortization, and accretion of ARO 1,464,069 1,244,560 1,657,315 - - 4,365,944 Mine operating earnings (loss) 3,583,607 5,897,938 11,219,680 397,188 (692,062) 20,406,351 General and administrative - - - - 4,393,465 4,393,465 Stock-based compensation - - - - 1,344,143 1,344,143 Interest expense (income) 658,602 5,166,802 2,884,029 (7,463,784) 1,245,649 Other expense (income) and foreign exchange 426,904 83,221 (202,596) - (1,345,562) (1,038,033) Income tax expense (recovery) 441,655 (15,954) 1,761,414 - 371,101 2,558,216 Net income (loss) 2,056,446 663,869 6,776,833 397,188 2,008,575 11,902,911 Capital expenditures 1,394,479 2,495,169 8,725,362 - 318,486 12,933,496 Total assets 109,125,407 64,068,493 72,640,351 - 31,580,187 277,414,438
Six Months Ended June 30, 2010
San Martin operations
La Parrillaoperations
La Encantada operations Coin Sales
Corporate and Other Eliminations Total
$ $ $ $ $ $ Revenue 9,584,207 9,142,290 8,126,458 3,002,081 (2,443,287) 27,411,749 Cost of sales 6,060,176 6,137,789 5,072,929 2,863,170 (2,375,383) 17,758,681 Depletion, depreciation and amortization, and accretion of ARO 1,205,822 1,391,556 837,430 - - 3,434,808 Mine operating earnings (loss) 2,318,209 1,612,945 2,216,099 138,911 (67,904) 6,218,260 General and administrative - - - - 3,932,315 3,932,315 Stock-based compensation - - - - 1,697,548 1,697,548 Interest expense (income) 79,204 121,972 104,561 - 383,393 689,130 Other expense (income) and foreign exchange 141,199 (377,899) (241,457) - 153,889 (324,268) Income tax expense (recovery) (53,295) (105,744) (25,659) - (1,567,880) (1,752,578) Net income (loss) 2,151,101 1,974,616 2,378,654 138,911 (4,667,169) 1,976,113 Capital expenditures 1,567,128 3,789,716 12,342,385 - 146,301 17,845,530 Total assets 118,788,430 62,249,122 49,559,957 - 22,489,594 253,087,103
Six Months Ended June 30, 2009

FIRST MAJESTIC SILVER CORP. NOTES TO THE INTERIM CONSOLIDATED FINANCIAL STATEMENTS FOR THE PERIODS ENDED JUNE 30, 2010 AND 2009 (Unaudited)
Notes Page 15
14. CAPITAL LEASE OBLIGATIONS
In 2007 and 2008, the Company completed lease financings for $14.1 million (US$11.2 million) of mining equipment. The Company paid 50% prior to the arrival of the equipment, and financed the remaining 50% in quarterly payments over a period of 24 months at 9% interest over the term of the lease. In March 2009, the Company refinanced the balance of $3.6 million (US$2.9 million) to be paid over 24 monthly payments commencing in February 2009 with interest payable at 9% on the outstanding principal balance, secured by a guarantee from the parent company. In January 2009, the Company completed additional lease financing arrangements with an equipment vendor, committing the Company to payments of $2.6 million (US$2.0 million) over a period of 36 months with monthly payments of $48,460 (US$38,420) consisting of principal plus 12.5% interest on outstanding balances, plus an additional 12 monthly lease payments of $43,640 (US$34,600) consisting of principal only. The following is a schedule of future minimum lease payments under the capital leases as at June 30, 2010:
June 30, 2010 December 31, 2009
$ $
2010 Gross lease payments 1,031,969 2,235,960
2011 Gross lease payments 690,615 684,364
2012 Gross lease payments 140,581 139,309
1,863,165 3,059,633
Less: interest (121,894) (251,997)
Total payments, net of interest 1,741,271 2,807,636
Less: current portion (1,372,510) (2,139,352)
Capital Lease Obligation - long term portion 368,761 668,284 15. ASSET RETIREMENT OBLIGATIONS
Six Months Ended Year Ended
June 30, 2010 December 31, 2009
$ $
Balance, beginning of the period 4,336,088 5,304,369
Effect of change in estimates - (877,834)
Interest accretion 187,921 445,090
Effect of translation of foreign currencies 136,579 (535,537)
Balance, end of the period 4,660,588 4,336,088 Asset retirement obligations allocated by mineral properties are as follows:
Anticipated June 30, 2010 December 31, 2009
Date $ $
La Encantada Silver Mine 2020 1,951,506 1,815,518
La Parrilla Silver Mine 2025 1,073,070 998,293
San Martin Silver Mine 2019 1,636,012 1,522,277
Balance, end of the period 4,660,588 4,336,088
FIRST MAJESTIC SILVER CORP. NOTES TO THE INTERIM CONSOLIDATED FINANCIAL STATEMENTS FOR THE PERIODS ENDED JUNE 30, 2010 AND 2009 (Unaudited)
Notes Page 16
15. ASSET RETIREMENT OBLIGATIONS (continued) During the year ended December 31, 2009, the Company reassessed its reclamation obligations at each of its mines based on updated mine life estimates, rehabilitation and closure plans. The total undiscounted amount of estimated cash flows required to settle the Company’s estimated obligations is $6.1 million, which has been discounted using a credit adjusted risk free rate of 8.5%, of which $1.7 million of the reclamation obligation relates to the La Parrilla Silver Mine, $2.0 million of the obligation relates to the San Martin Silver Mine, and $2.5 million relates to the La Encantada Silver Mine. The present value of the reclamation liabilities may be subject to change based on management’s current estimates, changes in the remediation technology or changes to the applicable laws and regulations. Such changes will be recorded in the accounts of the Company as they occur. 16. OTHER LONG TERM LIABILITIES
In 1992, El Pilon entered into a contract with a Mexican bank, whereby the bank committed to advance cash to El Pilon in exchange for silver to be delivered in future instalments. The bank failed to advance the fully agreed amount, and El Pilon therefore refused to deliver the silver. El Pilon sued the bank for breach of contract. The Company believes it will retain the advance received from the bank, but the ultimate outcome is uncertain. The aggregate potential liability including interest and penalties amounts to $774,970 (December 31, 2009 - $753,657). 17. CONTINGENT LIABILITIES
Due to the size, complexity and nature of the Company’s operations, various legal and tax matters arise in the ordinary course of business. The Company accrues for such items when a liability is both probable and the amount can be reasonably estimated. In the opinion of management, these matters will not have a material effect on the consolidated financial statements of the Company. 18. COMMITMENTS
The Company is obligated to make certain mining property option payments as described in Note 7, in connection with the acquisition of its mineral property interests. The Company has office lease commitments of $116,880 per annum in 2010 through 2011 and $29,220 in 2012. Additional annual operating costs are estimated at $101,110 per year ($8,426 per month) over the term of the lease. The Company provided a deposit of one month of rent equaling $20,151. As at June 30, 2010, the Company is committed to construction contracts of approximately $0.1 million (US$0.1 million) (December 31, 2009 - $2.1 million or US$2.0 million) relating to the completion of the smelting furnaces installation project at La Encantada, which is expected to be completed in the third quarter of 2010. As a result of the acquisition of Normabec, the Company is committed to make a US$1.0 million payment in December 2010 to acquire surface rights forming part of the Real de Catorce Project. It is also committed to make a payment of US$200,000 in December 2010 for technical and geological information collected over the Real de Catorce area. The Company is committed to making severance payments in the amount of approximately $2.0 million, (December 31, 2009 - $1.9 million), subject to certain adjustments, to four officers in the event of a change of control of the Company.
FIRST MAJESTIC SILVER CORP. NOTES TO THE INTERIM CONSOLIDATED FINANCIAL STATEMENTS FOR THE PERIODS ENDED JUNE 30, 2010 AND 2009 (Unaudited)
Notes Page 17
19. NON-CASH FINANCING AND INVESTING ACTIVITIES
2010 2009 2010 2009$ $ $ $
NON-CASH FINANCING AND INVESTING ACTIVITIES:Fair value of warrants upon completion of public offering - - - 848,758 Transfer of contributed surplus upon exercise of stock options and warrants 189,126 - 232,302 2,950 Assets acquired by capital lease - - - 2,259,380
Three Months Ended June 30, Six Months Ended June 30,
20. COMPARATIVE FIGURES
Certain comparative figures have been reclassified to conform to the classifications used in the current year’s presentation. 21. SUBSEQUENT EVENTS
Subsequent to June 30, 2010: (a) A total of 37,500 options with exercise prices ranging from $3.62 to $4.67 were cancelled;
(b) A total of 100,000 options with an exercise price of $4.17 expired unexercised;
(c) A total of 100,000 options were granted with an exercise price of $4.04 and an expiry date of August 9, 2013.

Suite 1805, 925 West Georgia Street, Vancouver, B.C., Canada V6C 3L2 Phone: 604.688.3033 | Fax: 604.639.8873| Toll Free: 1.866.529.2807 | Email: [email protected]
www.firstmajestic.com
MANAGEMENT’S DISCUSSION AND ANALYSIS
FOR THE QUARTER ENDED JUNE 30, 2010
Forward-Looking Statements Certain information contained herein constitutes forward-looking statements. Forward-looking statements are frequently characterized by words such as “plan”, “expect”, “forecast”, “project”, ”intend”, ”believe”, ”anticipate”, “outlook” and other similar words, or statements that certain events or conditions “may” or “will” occur. Forward-looking statements are based on the opinions and estimates of management at the dates the statements are made, and are subject to a variety of risks and uncertainties and other factors that could cause actual events or results to differ materially from those projected in the forward-looking statements. These factors include the inherent risks involved in the mining, exploration and development of mineral properties, the uncertainties involved in interpreting drilling results and other geological data, fluctuating metal prices, the possibility of project cost overruns or unanticipated costs and expenses, uncertainties related to the availability of and costs of financing needed in the future and other factors described in the Company’s Annual Information Form under the heading “Risk Factors”. The Company undertakes no obligation to update forward-looking statements if circumstances or management’s estimates or opinions should change. The reader is cautioned not to place undue reliance on forward-looking statements.
PRELIMINARY INFORMATION
First Majestic Silver Corp. (“First Majestic” or “the Company”) is in the business of producing, developing, exploring and acquiring mineral properties with a focus on silver in Mexico. The Company’s shares and warrants trade on the Toronto Stock Exchange under the symbols “FR” and “FR.WT.B”, respectively. The common shares are also quoted on the OTCQX in the U.S. under the symbol “FRMSF” and on the Frankfurt, Berlin, Munich and Stuttgart Stock Exchanges under the symbol “FMV”. Silver producing operations of the Company are carried out through three operating mines: the La Encantada, La Parrilla, and San Martin Silver Mines.
The following Management’s Discussion and Analysis (“MD&A”) should be read in conjunction with the audited consolidated financial statements of the Company for the year ended December 31, 2009. Additional information on the Company, including the Company’s Annual Information Form, is also available on SEDAR at www.sedar.com.
This MD&A relates to the consolidated operations of the Company and its wholly owned direct subsidiaries: Corporación First Majestic, S.A. de C.V. (“CFM”), First Silver Reserve Inc. (“First Silver”) and Normabec Mining Resources Ltd. (“Normabec”) as well as its indirect wholly-owned subsidiaries: First Majestic Plata, S.A. de C.V. (“First Majestic Plata”), Minera El Pilon, S.A. de C.V. (“El Pilon”), Minera La Encantada, S.A. de C.V. (“La Encantada”), Majestic Services S.A. de C.V. (“Majestic Services”), Minera Real Bonanza, S.A. de C.V. (“MRB”) and Servicios Minero-Metalurgicos e Industriales, S.A. de C.V. (“Servicios”). First Silver underwent a wind up and distribution of its assets and liabilities to the Company in December 2007 but First Silver has not been dissolved for legal purposes pending the outcome of litigation in which it is involved as the plaintiff, described herein in the Liquidity section.
QUALIFIED PERSONS Leonel Lopez, C.P.G., P.G. of Pincock Allen & Holt is the independent Qualified Person for the Company, and Ramon Davila, the Company’s Chief Operating Officer was recently certified as a Qualified Person. Leonel Lopez has reviewed the technical information reported in the National Instrument 43-101 technical reports regarding the La Parrilla Silver Mine, the La Encantada Silver Mine, the San Martin Silver Mine and the Del Toro Silver Mine. Ramon Davila has reviewed this MD&A for QP technical disclosures. All National Instrument 43-101 technical reports can be found on the Company’s website at www.firstmajestic.com or on SEDAR at www.sedar.com.
-2-
FIRST MAJESTIC SILVER CORP. MANAGEMENT’S DISCUSSION & ANALYSIS
All financial information in this MD&A is prepared in accordance with Canadian GAAP, and all dollar amounts are expressed in Canadian dollars unless otherwise indicated. All information contained in this MD&A is current as of August 13, 2010, unless otherwise stated.
SECOND QUARTER 2010 HIGHLIGHTS • Generated Gross Revenue of $31,799,382, a 102% increase over the second quarter of 2009.
• Generated Net Revenue of $28,963,285, a 122% increase over the second quarter of 2009.
• Recognized Mine Operating Earnings of $13,054,305, a 679% increase over the second quarter of 2009.
• Net Income after taxes was $8,887,116, a 757% increase over the second quarter of 2009.
• Basic Earnings per Share were $0.10, a 900% increase over the corresponding period in 2009.
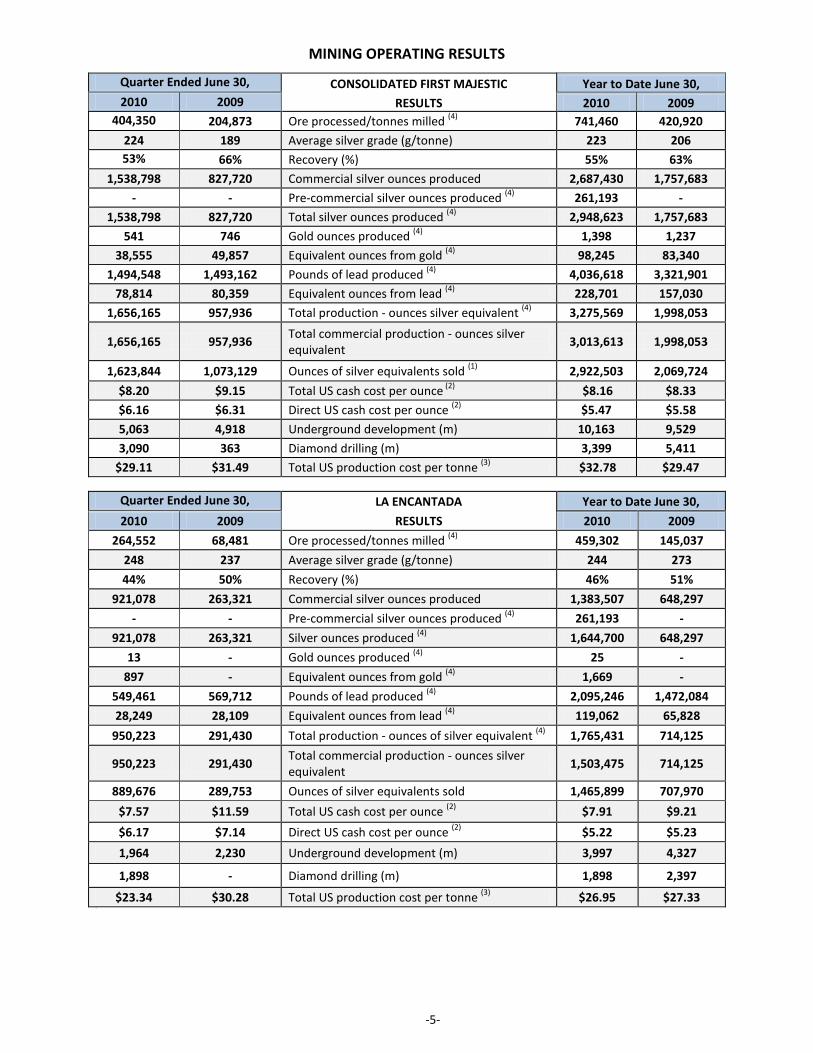
• Increased production by 73% to 1,656,165 silver equivalent ounces.
• Increased sales by 51% to 1,623,844 silver equivalent ounces.
• Realized an average selling price of US$18.68 per ounce of silver, which is 48% higher than the second quarter of 2009.
• Reduced Total Cash Costs per ounce by 10% from Q2-2009 to US$8.20 for Q2-2010.
• Reduced Direct Cash Costs per ounce by 2% from Q2-2009 to US$6.16 for Q2-2010.
Results of Operations Consolidated gross revenue (prior to smelting and refining charges and metal deductions) for the quarter ended June 30, 2010 was $31.8 million (US$30.3 million) compared to $15.8 million (US$13.5 million) for the quarter ended June 30, 2009 for an increase of $16.0 million or 102%. Compared to the first quarter ended March 31, 2010, consolidated gross revenue increased by $9.9 million or 45%. The increase in revenues in the second quarter of 2010 is primarily attributable to a 25% increase in silver ounces sold compared to the first quarter ended March 31, 2010. The increase in ounces sold is due to the launch of the new cyanidation plant at the La Encantada Silver Mine and improving operating levels at the La Parrilla Silver Mine which combined to contribute a 86% increase in silver production when compared to the second quarter of 2009.
In the second quarter of 2010, the Company sold 1,623,844 ounces of silver equivalent at an average price of $19.58 per ounce (US$18.68) compared to 1,073,129 ounces in the second quarter of 2009 at an average price of $14.70 per ounce (US$12.60), representing an increase of 51% in shipments over the same quarter in 2009 and a 25% increase over the first quarter of 2010. In the first quarter of 2010, the Company sold 1,298,659 ounces of silver equivalents at an average price of $16.89 (US$16.23) per ounce.
Production of silver, excluding any equivalents from gold or lead, increased by 9% over the prior quarter and 86% compared to the second quarter of 2009. The Company produced 1,538,798 ounces of silver in the current quarter, 1,409,825 ounces of silver in the first quarter of 2010 (commercial and non-commercial production), and 827,720 ounces in the second quarter of 2009. In the second quarter of 2010, 93% of First Majestic’s revenue resulted from the sale of pure silver making it the purest silver producer relative to its peers.
The new plant at La Encantada achieved commercial production on April 1, 2010. The design of the new plant allows for the production of silver doré bars which are generally 93-97% silver with small amounts of lead, gold and other metals making up the balance of the contents of these bars. During the second quarter, smelting furnaces were installed, allowing for the discontinuation of concentrate production. The economic differences are significant and are beginning to reflect in the financial numbers. Management completed a review of the

-3-
economics of lead production and concluded that, due to the relatively small amount of lead produced historically and current lead prices, ore was more valuable if processed directly through cyanidation rather than being floated, and thus the flotation circuit was shut down in June 2010. As a result of the discontinuation of flotation, concentrate production decreased in the second quarter and lead as a byproduct decreased by 41% to 1,494,548 pounds. The economics of switching from concentrate production to doré production resulted in a savings of smelting and refining costs at La Encantada of approximately US$2.61 per ounce of silver in the second quarter of 2010, and a savings of US$1.10 per silver ounce for consolidated operations in the second quarter of 2010. The new La Encantada cyanidation plant achieved average throughput of approximately 2,900 tonnes per day in the second quarter. This average throughput is expected to increase in the third quarter.
Total commercial production for the second quarter of 2010 increased by 22% compared to the first quarter of 2010. Total production (commercial and non-commercial) for the second quarter of 2010 increased 2% from the prior quarter and 73% from the same quarter of the prior year to 1,656,165 ounces of silver equivalents consisting of 1,538,798 ounces of silver, 541 ounces of gold and 1,494,548 pounds of lead. This compares to the 957,936 ounces of silver equivalents produced in the second quarter of 2009, which consisted of 827,720 ounces of silver, 746 ounces of gold, 1,493,162 pounds of lead, and compares with production in the first quarter of 1,619,403 ounces of silver equivalents consisting of 1,409,825 ounces of silver, 857 ounces of gold and 2,542,071 pounds of lead.
Net sales revenue (after smelting and refining charges and metals deductions) for the quarter ended June 30, 2010 was $29.0 million, an increase of 122% compared to $13.0 million for the second quarter of 2009. Net sales revenue for the quarter ended June 30, 2010 increased by 59% compared to $18.2 million in the first quarter of 2010. Smelting and refining charges and metal deductions decreased to 9% of gross revenue in the second quarter of 2010 compared to 17% of gross revenue in the second quarter of 2009, due to a shift in the production mix toward silver doré which is a benefit from the new cyanidation plant at La Encantada. Average smelting charges for doré in the second quarter of 2010 were US$0.60 per silver ounce as compared to US$4.79 per silver ounce for concentrates.
The Company generated net income of $8.9 million in the second quarter of 2010, or earnings per common share (“EPS”) of $0.10 compared to a net income in the second quarter of 2009 of $1.0 million or EPS of $0.01. Net income for the second quarter of 2010 included non-cash stock-based compensation expense of $0.6 million and an income tax provision of $1.4 million. In the first quarter of 2010, net income was $3.0 million resulting in EPS of $0.03. If the revenues and expenses of the new plant were deemed commercial in the first quarter (recorded as income rather than capital), an additional $2.3 million of capitalized profits would have increased EPS in the first quarter upwards to $0.06.
Direct cash costs per ounce of silver (a non-GAAP measure) for the second quarter of 2010 were US$6.16, compared to US$6.31 per ounce of silver in the second quarter of 2009 and US$4.94 per ounce of silver in the first quarter of 2010. The cost increase was attributed to an increase in the peso relative to the US dollar, as well as an increase in electricity and diesel costs compared to previous quarters.
Total cash costs per ounce (including smelting, refining, metal deductions, transportation and other selling costs, and byproduct credits, which is a non-GAAP measure) for the second quarter of 2010 was US$8.20 per ounce of silver compared to US$9.15 per ounce of silver in the second quarter of 2009 and US$8.11 per ounce in the first quarter of 2010.
Mine operating earnings for the second quarter of 2010 increased by 679% to $13.1 million, compared to mine operating earnings of $1.7 million for the second quarter of 2009, and are associated with an increase in net revenue during the second quarter of 2010. When compared to the first quarter of 2010, mine operating earnings increased by 78% from $7.4 million to $13.1 million.
Operating income increased by 907%, or $11.2 million, to $10.0 million for the quarter ended June 30, 2010, from an operating loss of $1.2 million for the quarter ended June 30, 2009, due to the 51% increase in ounces sold and the 51% increase in average US$ revenue per ounce of silver sold. When compared to the first quarter of 2010, operating income increased by 114% from $4.7 million to $10.0 million.
During the quarter ended June 30, 2010, the Company invested $2.6 million in its mineral properties and a further $3.0 million in additions to plant and equipment on a cash basis. This compares to $3.2 million invested in its
-4-
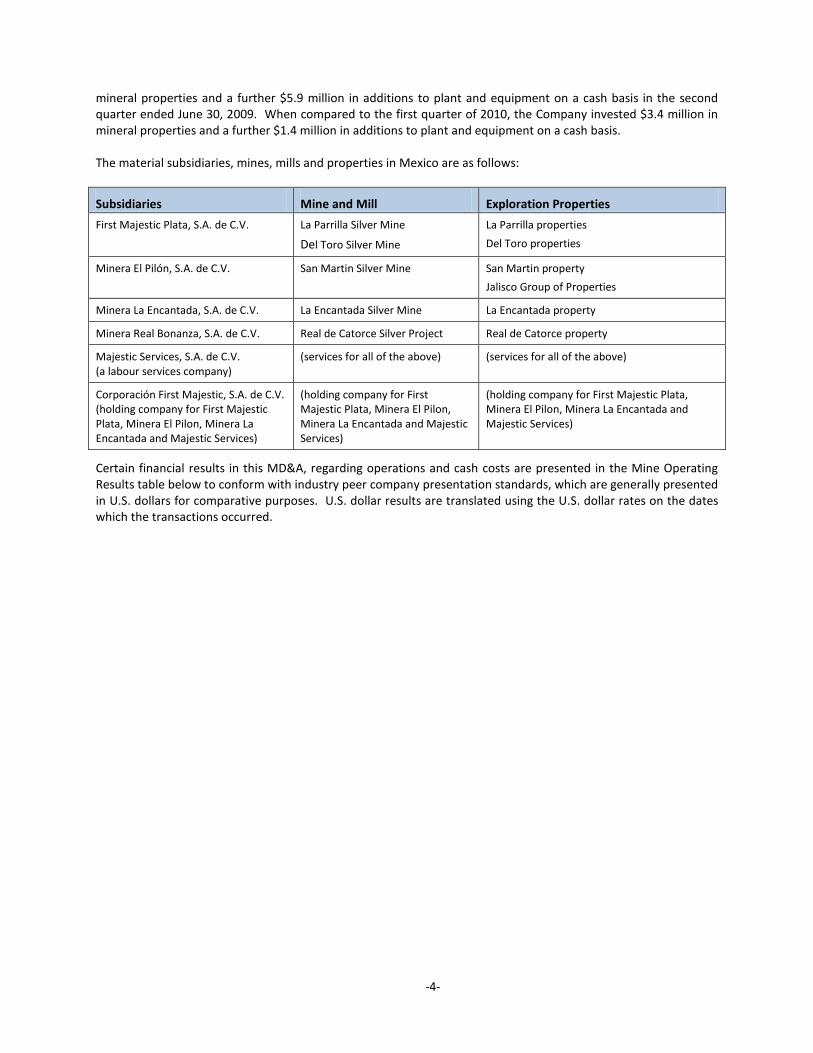
mineral properties and a further $5.9 million in additions to plant and equipment on a cash basis in the second quarter ended June 30, 2009. When compared to the first quarter of 2010, the Company invested $3.4 million in mineral properties and a further $1.4 million in additions to plant and equipment on a cash basis. The material subsidiaries, mines, mills and properties in Mexico are as follows:
Subsidiaries Mine and Mill Exploration Properties First Majestic Plata, S.A. de C.V. La Parrilla Silver Mine
Del Toro Silver Mine
La Parrilla properties Del Toro properties
Minera El Pilón, S.A. de C.V. San Martin Silver Mine San Martin property Jalisco Group of Properties
Minera La Encantada, S.A. de C.V. La Encantada Silver Mine La Encantada property
Minera Real Bonanza, S.A. de C.V. Real de Catorce Silver Project Real de Catorce property
Majestic Services, S.A. de C.V. (a labour services company)
(services for all of the above) (services for all of the above)
Corporación First Majestic, S.A. de C.V. (holding company for First Majestic Plata, Minera El Pilon, Minera La Encantada and Majestic Services)
(holding company for First Majestic Plata, Minera El Pilon, Minera La Encantada and Majestic Services)
(holding company for First Majestic Plata, Minera El Pilon, Minera La Encantada and Majestic Services)
Certain financial results in this MD&A, regarding operations and cash costs are presented in the Mine Operating Results table below to conform with industry peer company presentation standards, which are generally presented in U.S. dollars for comparative purposes. U.S. dollar results are translated using the U.S. dollar rates on the dates which the transactions occurred.
-5-
MINING OPERATING RESULTS
Quarter Ended June 30, CONSOLIDATED FIRST MAJESTIC Year to Date June 30, 2010 2009 RESULTS 2010 2009
404,350
204,873 Ore processed/tonnes milled (4) 741,460 420,920 224 189 Average silver grade (g/tonne) 223 206 53%
66% Recovery (%) 55% 63%
1,538,798 827,720 Commercial silver ounces produced 2,687,430 1,757,683 - - Pre-commercial silver ounces produced (4) 261,193 -
1,538,798 827,720 Total silver ounces produced (4) 2,948,623 1,757,683 541 746 Gold ounces produced (4) 1,398 1,237
38,555 49,857 Equivalent ounces from gold (4) 98,245 83,340 1,494,548 1,493,162 Pounds of lead produced (4) 4,036,618 3,321,901
78,814 80,359 Equivalent ounces from lead (4) 228,701 157,030 1,656,165 957,936 Total production - ounces silver equivalent (4) 3,275,569 1,998,053
1,656,165 957,936 Total commercial production - ounces silver equivalent 3,013,613 1,998,053
1,623,844 1,073,129 Ounces of silver equivalents sold (1) 2,922,503 2,069,724 $8.20 $9.15 Total US cash cost per ounce (2) $8.16 $8.33 $6.16 $6.31 Direct US cash cost per ounce (2) $5.47 $5.58 5,063 4,918 Underground development (m) 10,163 9,529 3,090 363 Diamond drilling (m) 3,399 5,411
$29.11 $31.49 Total US production cost per tonne (3) $32.78 $29.47
Quarter Ended June 30, LA ENCANTADA Year to Date June 30, 2010 2009 RESULTS 2010 2009
264,552 68,481 Ore processed/tonnes milled (4) 459,302 145,037 248 237 Average silver grade (g/tonne) 244 273 44% 50% Recovery (%) 46% 51%
921,078 263,321 Commercial silver ounces produced 1,383,507 648,297 - - Pre-commercial silver ounces produced (4) 261,193 -
921,078 263,321 Silver ounces produced (4) 1,644,700 648,297 13 - Gold ounces produced (4) 25 -
897 - Equivalent ounces from gold (4) 1,669 - 549,461 569,712 Pounds of lead produced (4) 2,095,246 1,472,084 28,249 28,109 Equivalent ounces from lead (4) 119,062 65,828
950,223 291,430 Total production - ounces of silver equivalent (4) 1,765,431 714,125
950,223 291,430 Total commercial production - ounces silver equivalent 1,503,475 714,125
889,676 289,753 Ounces of silver equivalents sold 1,465,899 707,970 $7.57 $11.59 Total US cash cost per ounce (2) $7.91 $9.21 $6.17 $7.14 Direct US cash cost per ounce (2) $5.22 $5.23 1,964 2,230 Underground development (m) 3,997 4,327
1,898 - Diamond drilling (m) 1,898 2,397
$23.34 $30.28 Total US production cost per tonne (3) $26.95 $27.33 (1)
-6-
Quarter Ended June 30, LA PARRILLA Year to Date June 30, 2010 2009 RESULTS 2010 2009
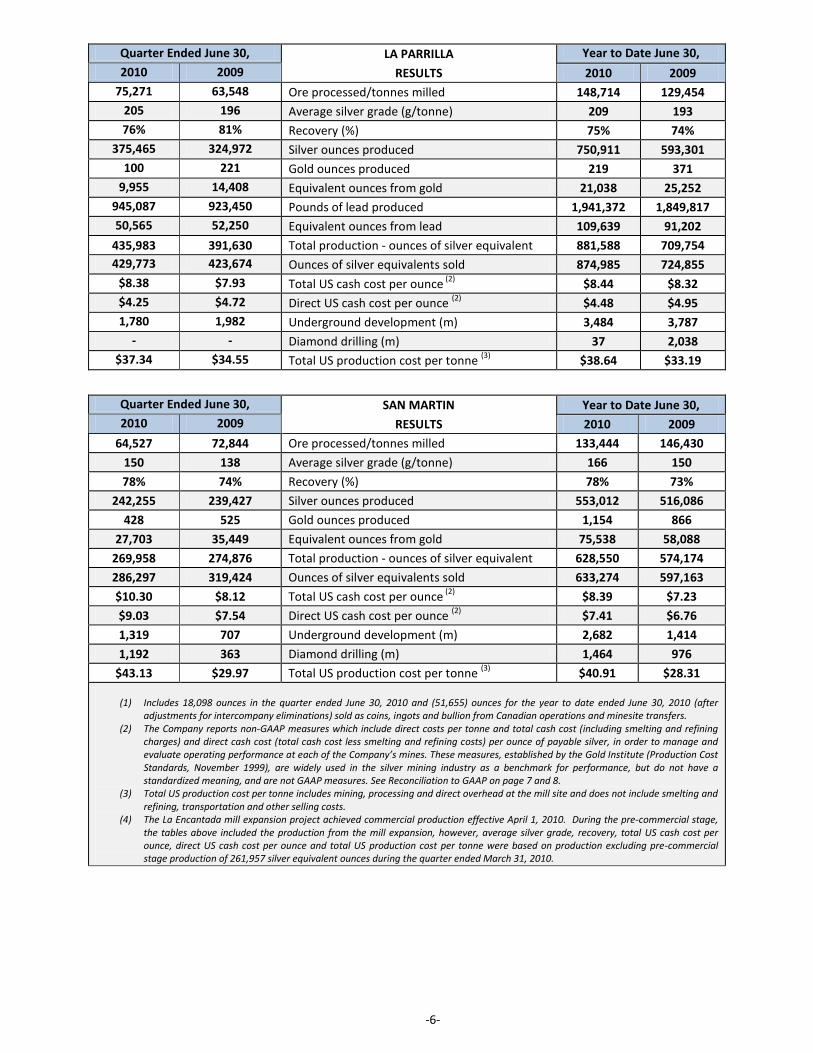
75,271 63,548 Ore processed/tonnes milled 148,714 129,454 205 196 Average silver grade (g/tonne) 209 193 76% 81% Recovery (%) 75% 74%
375,465 324,972 Silver ounces produced 750,911 593,301 100 221 Gold ounces produced 219 371
9,955 14,408 Equivalent ounces from gold 21,038 25,252 945,087 923,450 Pounds of lead produced 1,941,372 1,849,817 50,565 52,250 Equivalent ounces from lead 109,639 91,202
435,983 391,630 Total production - ounces of silver equivalent 881,588 709,754 429,773 423,674 Ounces of silver equivalents sold 874,985 724,855
$8.38 $7.93 Total US cash cost per ounce (2) $8.44 $8.32 $4.25 $4.72 Direct US cash cost per ounce (2) $4.48 $4.95 1,780 1,982 Underground development (m) 3,484 3,787
- - Diamond drilling (m) 37 2,038 $37.34 $34.55 Total US production cost per tonne (3) $38.64 $33.19
Quarter Ended June 30, SAN MARTIN Year to Date June 30, 2010 2009 RESULTS 2010 2009
64,527 72,844 Ore processed/tonnes milled 133,444 146,430 150 138 Average silver grade (g/tonne) 166 150 78% 74% Recovery (%) 78% 73%
242,255 239,427 Silver ounces produced 553,012 516,086 428 525 Gold ounces produced 1,154 866
27,703 35,449 Equivalent ounces from gold 75,538 58,088 269,958 274,876 Total production - ounces of silver equivalent 628,550 574,174 286,297 319,424 Ounces of silver equivalents sold 633,274 597,163 $10.30 $8.12 Total US cash cost per ounce (2) $8.39 $7.23 $9.03 $7.54 Direct US cash cost per ounce (2) $7.41 $6.76 1,319 707 Underground development (m) 2,682 1,414 1,192 363 Diamond drilling (m) 1,464 976
$43.13 $29.97 Total US production cost per tonne (3) $40.91 $28.31
(1) Includes 18,098 ounces in the quarter ended June 30, 2010 and (51,655) ounces for the year to date ended June 30, 2010 (after adjustments for intercompany eliminations) sold as coins, ingots and bullion from Canadian operations and minesite transfers.
(2) The Company reports non-GAAP measures which include direct costs per tonne and total cash cost (including smelting and refining charges) and direct cash cost (total cash cost less smelting and refining costs) per ounce of payable silver, in order to manage and evaluate operating performance at each of the Company’s mines. These measures, established by the Gold Institute (Production Cost Standards, November 1999), are widely used in the silver mining industry as a benchmark for performance, but do not have a standardized meaning, and are not GAAP measures. See Reconciliation to GAAP on page 7 and 8.
(3) Total US production cost per tonne includes mining, processing and direct overhead at the mill site and does not include smelting and refining, transportation and other selling costs.
(4) The La Encantada mill expansion project achieved commercial production effective April 1, 2010. During the pre-commercial stage, the tables above included the production from the mill expansion, however, average silver grade, recovery, total US cash cost per ounce, direct US cash cost per ounce and total US production cost per tonne were based on production excluding pre-commercial stage production of 261,957 silver equivalent ounces during the quarter ended March 31, 2010.

-7-
RECONCILIATION OF COST OF SALES TO CASH COSTS
FOR THE QUARTER AND YEAR ENDED JUNE 30, 2010 AND 2009
“Cash cost per ounce” is a measure developed by precious metals companies in an effort to provide a comparable standard; however, there can be no assurance that our reporting of this non-GAAP measure is similar to that reported by other mining companies. Cash costs per ounce is a measure used by the Company to manage and evaluate operating performance at each of the Company’s operating mining units, and is widely reported in the silver mining industry as a benchmark for performance, but does not have a standardized meaning. To facilitate a better understanding of these measures as calculated by the Company, we have provided a detailed reconciliation of these measures to our cost of sales, as reported in our Consolidated Statements of Income. Direct cash costs consist of total cash costs less smelting, refining, transportation and other selling costs.
San Martin La Parrilla La Encantada Total San Martin La Parrilla La Encantada TotalCOST OF SALES US$ 3,119,311 2,935,918 6,348,578 12,403,807 2,361,989 2,326,204 2,275,641 6,963,834 ADD: THIRD PARTY SMELTING AND REFINING US$ 176,149 1,418,320 1,100,507 2,694,976 139,277 1,045,512 1,170,930 2,355,719 DEDUCT: BY-PRODUCT CREDITS US$ (594,543) (1,214,600) (491,995) (2,301,138) (555,958) (793,202) (394,725) (1,743,885) DEDUCT: ROYALTIES US$ - (15,654) - (15,654) - - - - ADD (DEDUCT): PROFIT SHARING US$ (156,815) - (720,703) (877,518) - - - - INVENTORY CHANGES US$ (47,970) 18,740 738,950 709,720 - - - - OTHER NON-CASH COSTS US$ 310 1,851 (2,151) 10 - - - - TOTAL CASH COST (A) US$ 2,496,442 3,144,575 6,973,186 12,614,203 1,945,308 2,578,514 3,051,846 7,575,668 DEDUCT: THIRD PARTY SMELTING, REFINING, TRANSPORT & OTHER SELLING COSTS US$ (307,950) (1,548,830) (1,289,344) (3,146,124) (318,450) (1,176,269) (1,372,716) (2,867,435) DIRECT CASH COST (B) US$ 2,188,492 1,595,745 5,683,842 9,468,079 1,626,858 1,402,245 1,679,130 4,708,233
TONNES PRODUCED TONNES 64,527 75,271 264,552 404,350 72,844 63,548 68,481 204,873 OUNCES OF SILVER PRODUCED (C) OZ 242,255 375,465 921,078 1,538,798 239,427 324,972 263,321 827,720 OUNCES OF SILVER EQ PRODUCED OZ EQ 27,702 60,518 29,146 117,366 35,449 66,658 28,109 130,216 TOTAL OZ OF SILVER EQ PRODUCED OZ EQ 269,957 435,983 950,224 1,656,164 274,876 391,630 291,430 957,936
TOTAL CASH COST PER OUNCE (A/C) US$/OZ 10.30 8.38 7.57 8.20 8.12 7.93 11.59 9.15
TOTAL CASH COST PER OUNCE US$/OZ 10.30 8.38 7.57 8.20 8.12 7.93 11.59 9.15 THIRD PARTY SMELTING, REFINING, TRANSPORT & OTHER SELLING COSTS PER OUNCE US$/OZ (1.27) (4.13) (1.40) (2.04) (0.58) (3.22) (4.45) (2.85) DIRECT CASH COST PER OUNCE (B/C) US$/OZ 9.03 4.25 6.17 6.16 7.54 4.72 7.14 6.31
MINING US$/Tonne 17.48 15.15 4.61 8.63 11.80 12.68 14.06 12.83MILLING US$/Tonne 16.95 16.18 15.60 15.93 12.96 16.61 9.82 13.04INDIRECT US$/Tonne 8.70 6.01 3.13 4.55 5.21 5.26 6.40 5.62TOTAL PRODUCTION COST US$/Tonne 43.13 37.34 23.34 29.11 29.97 34.55 30.28 31.49
MINING US$/Oz. 4.66 3.04 1.32 2.27 3.59 2.48 3.66 3.17MILLING US$/Oz. 4.50 3.24 4.48 4.19 3.94 3.25 2.56 3.23INDIRECT US$/Oz. 2.32 1.20 0.90 1.20 1.59 1.03 1.67 1.39TRANSPORT AND OTHER SELLING COSTS US$/Oz. 0.54 0.35 0.21 0.29 0.75 0.40 0.77 0.62SMELTING AND REFINING COSTS US$/Oz. 0.73 3.78 1.19 1.75 0.58 3.22 4.45 2.85BY-PRODUCT CREDITS US$/Oz. (2.45) (3.23) (0.53) (1.50) (2.32) (2.44) (1.50) (2.11)TOTAL CASH COST PER OUNCE US$/Oz. 10.30 8.38 7.57 8.20 8.12 7.93 11.59 9.15TRANSPORT AND OTHER SELLING COSTS US$/Oz. (0.54) (0.35) (0.21) (0.29) - - - - SMELTING AND REFINING COSTS US$/Oz. (1.27) (3.78) (1.41) (2.04) (1.33) (3.62) (5.21) (3.47)DIRECT CASH COST US$/Oz. 8.49 4.25 5.96 5.87 6.79 4.32 6.38 5.69
Three Months Ended June 30, 2010 Three Months Ended June 30, 2009

-8-
Note 1 – The table above does not include 261,957 silver ounces of pre-commercial production from the La Encantada mill expansion project during the quarter ended March 31, 2010, which were produced at a cost of $2,444,393 (US$2,348,346).
San Martin La Parrilla La Encantada Total San Martin La Parrilla La Encantada TotalCOST OF SALES US$ 5,830,520 5,921,708 9,584,086 21,336,314 4,350,961 4,484,480 4,191,829 13,027,270 ADD: THIRD PARTY SMELTING & REFINING US$ 287,166 2,730,225 3,315,277 6,332,668 245,293 2,002,611 2,583,496 4,831,400 DEDUCT: BY-PRODUCT CREDITS US$ (1,357,760) (2,372,972) (1,793,350) (5,524,082) (862,605) (1,549,946) (801,516) (3,214,067) DEDUCT: ROYALTIES US$ - (40,974) - (40,974) - - - - ADD (DEDUCT): PROFIT SHARING US$ (156,815) - (720,703) (877,518) - - - - INVENTORY CHANGES US$ 39,076 101,951 563,025 704,052 - - - - OTHER NON-CASH COSTS US$ 181 (12) (3,986) (3,817) - - - - TOTAL CASH COST (A) US$ 4,642,368 6,339,926 10,944,349 21,926,643 3,733,649 4,937,145 5,973,809 14,644,603 DEDUCT: THIRD PARTY SMELTING, REFINING, TRANSPORT & OTHER SELLING COSTS US$ (541,778) (2,966,874) (3,715,450) (7,224,102) (450,737) (2,191,036) (2,811,620) (5,453,393) DIRECT CASH COST (B) US$ 4,100,590 3,373,052 7,228,899 14,702,541 3,282,912 2,746,109 3,162,189 9,191,210
TONNES PRODUCED (Note 1) TONNES 133,444 148,714 334,794 616,952 146,430 129,453 145,037 420,920 OUNCES OF SILVER PRODUCED (C) (Note 1) OZ 553,013 750,911 1,383,506 2,687,430 516,086 593,300 648,297 1,757,683 OUNCES OF SILVER EQ PRODUCED (Note 1) OZ EQ 75,266 130,675 119,969 325,910 58,088 116,454 65,828 240,370 TOTAL OZ OF SILVER EQ PRODUCED (Note 1) OZ EQ 628,279 881,586 1,503,475 3,013,340 574,174 709,754 714,125 1,998,053
TOTAL CASH COST PER OUNCE (A/C) US$/OZ 8.39 8.44 7.91 8.16 7.23 8.32 9.21 8.33
TOTAL CASH COST PER OUNCE US$/OZ 8.39 8.44 7.91 8.16 7.23 8.32 9.21 8.33 THIRD PARTY SMELTING, REFINING, TRANSPORT AND OTHER SELLING COST PER OUNCE US$/OZ (0.98) (3.96) (2.69) (2.69) (0.48) (3.38) (3.99) (2.75) DIRECT CASH COST (B/C) US$/OZ 7.41 4.48 5.22 5.47 6.76 4.95 5.23 5.58
MINING US$/Tonne 16.90 16.75 7.55 11.79 10.38 12.36 12.75 11.81MILLING US$/Tonne 15.62 15.94 15.10 15.41 12.60 16.05 8.96 12.41INDIRECT US$/Tonne 8.39 5.95 4.30 5.58 5.32 4.77 5.62 5.26TOTAL PRODUCTION COST US$/Tonne 40.91 38.64 26.95 32.78 28.31 33.19 27.33 29.47
MINING US$/Oz. 4.08 3.32 1.83 2.71 2.95 2.70 2.85 2.83MILLING US$/Oz. 3.77 3.16 3.65 3.54 3.58 3.50 2.00 2.97INDIRECT US$/Oz. 2.02 1.18 1.04 1.28 1.51 1.04 1.26 1.26TRANSPORT AND OTHER SELLING COSTS US$/Oz. 0.46 0.32 0.29 0.33 0.40 0.32 0.35 0.35SMELTING AND REFINING COSTS US$/Oz. 0.52 3.64 2.40 2.36 0.48 3.38 3.99 2.75BY-PRODUCT CREDITS US$/Oz. (2.45) (3.16) (1.30) (2.06) (1.67) (2.61) (1.24) (1.83)TOTAL CASH COST PER OUNCE US$/Oz. 8.39 8.44 7.91 8.16 7.23 8.32 9.22 8.33TRANSPORT AND OTHER SELLING COSTS US$/Oz. (0.46) (0.32) (0.29) (0.33) - - - - SMELTING AND REFINING COSTS US$/Oz. (0.52) (3.64) (2.40) (2.36) (0.48) (3.38) (3.99) (2.75)DIRECT CASH COST US$/Oz. 7.41 4.48 5.22 5.47 6.76 4.95 5.23 5.58
Year to Date June 30, 2009 d Year to Date June 30, 2010
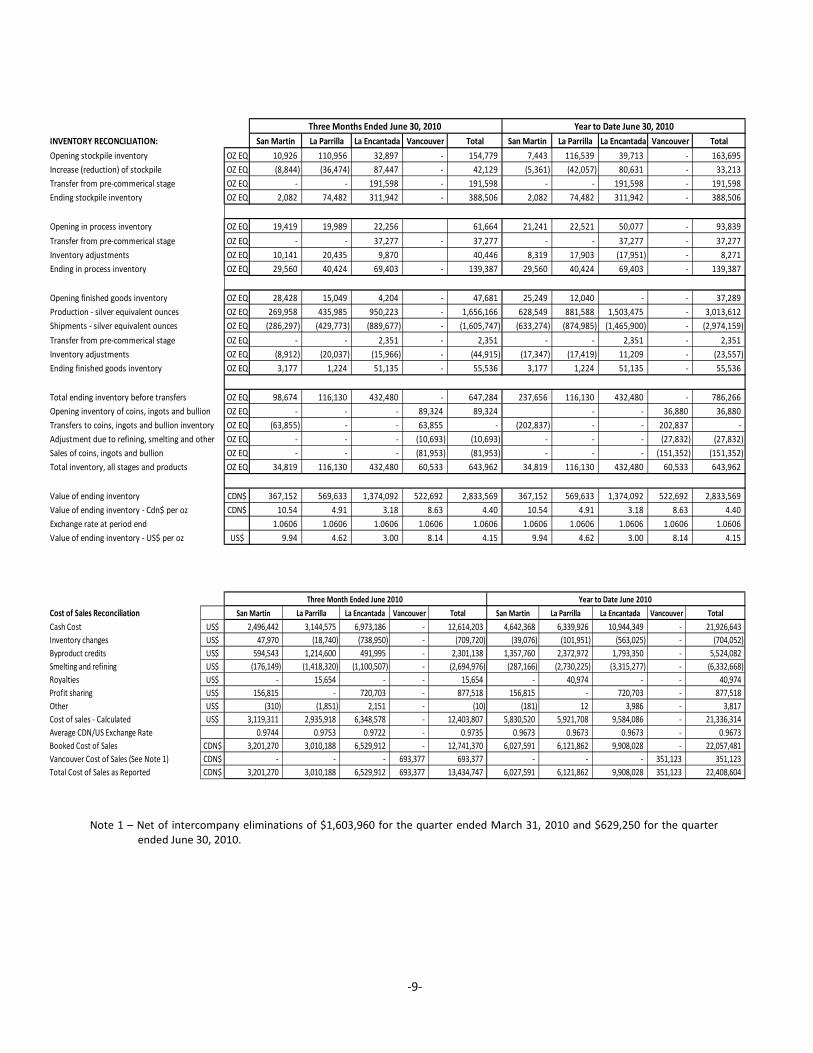
-9-
INVENTORY RECONCILIATION: San Martin La Parrilla La Encantada Vancouver Total San Martin La Parrilla La Encantada Vancouver TotalOpening stockpile inventory OZ EQ 10,926 110,956 32,897 - 154,779 7,443 116,539 39,713 - 163,695 Increase (reduction) of stockpile OZ EQ (8,844) (36,474) 87,447 - 42,129 (5,361) (42,057) 80,631 - 33,213 Transfer from pre-commerical stage OZ EQ - - 191,598 - 191,598 - - 191,598 - 191,598 Ending stockpile inventory OZ EQ 2,082 74,482 311,942 - 388,506 2,082 74,482 311,942 - 388,506
Opening in process inventory OZ EQ 19,419 19,989 22,256 61,664 21,241 22,521 50,077 - 93,839 Transfer from pre-commerical stage OZ EQ - - 37,277 - 37,277 - - 37,277 - 37,277 Inventory adjustments OZ EQ 10,141 20,435 9,870 40,446 8,319 17,903 (17,951) - 8,271 Ending in process inventory OZ EQ 29,560 40,424 69,403 - 139,387 29,560 40,424 69,403 - 139,387
Opening finished goods inventory OZ EQ 28,428 15,049 4,204 - 47,681 25,249 12,040 - - 37,289 Production - silver equivalent ounces OZ EQ 269,958 435,985 950,223 - 1,656,166 628,549 881,588 1,503,475 - 3,013,612 Shipments - silver equivalent ounces OZ EQ (286,297) (429,773) (889,677) - (1,605,747) (633,274) (874,985) (1,465,900) - (2,974,159) Transfer from pre-commerical stage OZ EQ - - 2,351 - 2,351 - - 2,351 - 2,351 Inventory adjustments OZ EQ (8,912) (20,037) (15,966) - (44,915) (17,347) (17,419) 11,209 - (23,557) Ending finished goods inventory OZ EQ 3,177 1,224 51,135 - 55,536 3,177 1,224 51,135 - 55,536
Total ending inventory before transfers OZ EQ 98,674 116,130 432,480 - 647,284 237,656 116,130 432,480 - 786,266 Opening inventory of coins, ingots and bullion OZ EQ - - - 89,324 89,324 - - 36,880 36,880 Transfers to coins, ingots and bullion inventory OZ EQ (63,855) - - 63,855 - (202,837) - - 202,837 - Adjustment due to refining, smelting and other OZ EQ - - - (10,693) (10,693) - - - (27,832) (27,832) Sales of coins, ingots and bullion OZ EQ - - - (81,953) (81,953) - - - (151,352) (151,352) Total inventory, all stages and products OZ EQ 34,819 116,130 432,480 60,533 643,962 34,819 116,130 432,480 60,533 643,962
Value of ending inventory CDN$ 367,152 569,633 1,374,092 522,692 2,833,569 367,152 569,633 1,374,092 522,692 2,833,569 Value of ending inventory - Cdn$ per oz CDN$ 10.54 4.91 3.18 8.63 4.40 10.54 4.91 3.18 8.63 4.40 Exchange rate at period end 1.0606 1.0606 1.0606 1.0606 1.0606 1.0606 1.0606 1.0606 1.0606 1.0606 Value of ending inventory - US$ per oz US$ 9.94 4.62 3.00 8.14 4.15 9.94 4.62 3.00 8.14 4.15
Year to Date June 30, 2010Three Months Ended June 30, 2010
Cost of Sales Reconciliation San Martin La Parrilla La Encantada Vancouver Total San Martin La Parrilla La Encantada Vancouver TotalCash Cost US$ 2,496,442 3,144,575 6,973,186 - 12,614,203 4,642,368 6,339,926 10,944,349 - 21,926,643 Inventory changes US$ 47,970 (18,740) (738,950) - (709,720) (39,076) (101,951) (563,025) - (704,052) Byproduct credits US$ 594,543 1,214,600 491,995 - 2,301,138 1,357,760 2,372,972 1,793,350 - 5,524,082 Smelting and refining US$ (176,149) (1,418,320) (1,100,507) - (2,694,976) (287,166) (2,730,225) (3,315,277) - (6,332,668) Royalties US$ - 15,654 - - 15,654 - 40,974 - - 40,974 Profit sharing US$ 156,815 - 720,703 - 877,518 156,815 - 720,703 - 877,518 Other US$ (310) (1,851) 2,151 - (10) (181) 12 3,986 - 3,817 Cost of sales - Calculated US$ 3,119,311 2,935,918 6,348,578 - 12,403,807 5,830,520 5,921,708 9,584,086 - 21,336,314 Average CDN/US Exchange Rate 0.9744 0.9753 0.9722 - 0.9735 0.9673 0.9673 0.9673 - 0.9673 Booked Cost of Sales CDN$ 3,201,270 3,010,188 6,529,912 - 12,741,370 6,027,591 6,121,862 9,908,028 - 22,057,481 Vancouver Cost of Sales (See Note 1) CDN$ - - - 693,377 693,377 - - - 351,123 351,123 Total Cost of Sales as Reported CDN$ 3,201,270 3,010,188 6,529,912 693,377 13,434,747 6,027,591 6,121,862 9,908,028 351,123 22,408,604
Year to Date June 2010 Three Month Ended June 2010
Note 1 – Net of intercompany eliminations of $1,603,960 for the quarter ended March 31, 2010 and $629,250 for the quarter
ended June 30, 2010.
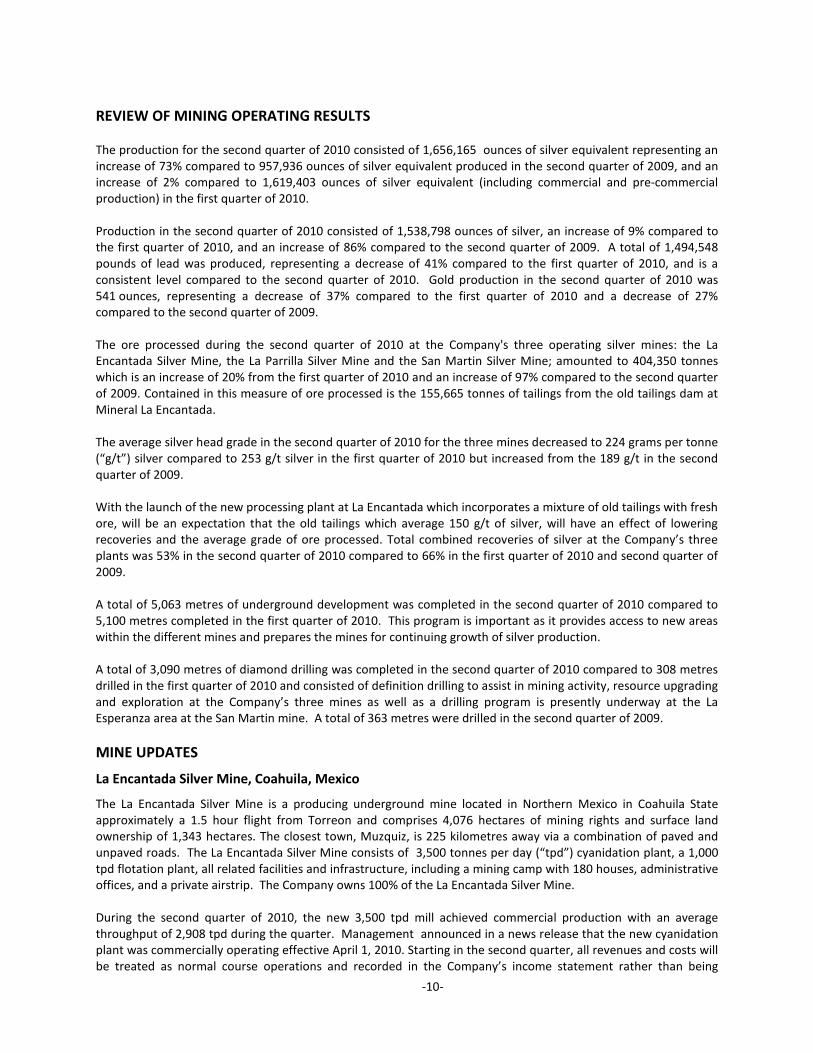
-10-
REVIEW OF MINING OPERATING RESULTS The production for the second quarter of 2010 consisted of 1,656,165 ounces of silver equivalent representing an increase of 73% compared to 957,936 ounces of silver equivalent produced in the second quarter of 2009, and an increase of 2% compared to 1,619,403 ounces of silver equivalent (including commercial and pre-commercial production) in the first quarter of 2010. Production in the second quarter of 2010 consisted of 1,538,798 ounces of silver, an increase of 9% compared to the first quarter of 2010, and an increase of 86% compared to the second quarter of 2009. A total of 1,494,548 pounds of lead was produced, representing a decrease of 41% compared to the first quarter of 2010, and is a consistent level compared to the second quarter of 2010. Gold production in the second quarter of 2010 was 541 ounces, representing a decrease of 37% compared to the first quarter of 2010 and a decrease of 27% compared to the second quarter of 2009. The ore processed during the second quarter of 2010 at the Company's three operating silver mines: the La Encantada Silver Mine, the La Parrilla Silver Mine and the San Martin Silver Mine; amounted to 404,350 tonnes which is an increase of 20% from the first quarter of 2010 and an increase of 97% compared to the second quarter of 2009. Contained in this measure of ore processed is the 155,665 tonnes of tailings from the old tailings dam at Mineral La Encantada. The average silver head grade in the second quarter of 2010 for the three mines decreased to 224 grams per tonne (“g/t”) silver compared to 253 g/t silver in the first quarter of 2010 but increased from the 189 g/t in the second quarter of 2009. With the launch of the new processing plant at La Encantada which incorporates a mixture of old tailings with fresh ore, will be an expectation that the old tailings which average 150 g/t of silver, will have an effect of lowering recoveries and the average grade of ore processed. Total combined recoveries of silver at the Company’s three plants was 53% in the second quarter of 2010 compared to 66% in the first quarter of 2010 and second quarter of 2009. A total of 5,063 metres of underground development was completed in the second quarter of 2010 compared to 5,100 metres completed in the first quarter of 2010. This program is important as it provides access to new areas within the different mines and prepares the mines for continuing growth of silver production. A total of 3,090 metres of diamond drilling was completed in the second quarter of 2010 compared to 308 metres drilled in the first quarter of 2010 and consisted of definition drilling to assist in mining activity, resource upgrading and exploration at the Company’s three mines as well as a drilling program is presently underway at the La Esperanza area at the San Martin mine. A total of 363 metres were drilled in the second quarter of 2009. MINE UPDATES
La Encantada Silver Mine, Coahuila, Mexico
The La Encantada Silver Mine is a producing underground mine located in Northern Mexico in Coahuila State approximately a 1.5 hour flight from Torreon and comprises 4,076 hectares of mining rights and surface land ownership of 1,343 hectares. The closest town, Muzquiz, is 225 kilometres away via a combination of paved and unpaved roads. The La Encantada Silver Mine consists of 3,500 tonnes per day (“tpd”) cyanidation plant, a 1,000 tpd flotation plant, all related facilities and infrastructure, including a mining camp with 180 houses, administrative offices, and a private airstrip. The Company owns 100% of the La Encantada Silver Mine. During the second quarter of 2010, the new 3,500 tpd mill achieved commercial production with an average throughput of 2,908 tpd during the quarter. Management announced in a news release that the new cyanidation plant was commercially operating effective April 1, 2010. Starting in the second quarter, all revenues and costs will be treated as normal course operations and recorded in the Company’s income statement rather than being
-11-
capitalized as pre-production as was required in accordance with GAAP in the first quarter of 2010. The plant has been operating at full production levels since July 1, 2010, producing silver at a rate of over four million ounces of silver doré annually. To date, the Company has spent approximately $41.4 million (US$40.1 million) on the new cyanidation plant. Commencing with commercial operation of the new plant, the Company must begin to depreciate this asset over the remaining life of the asset. The depreciation expense associated with the new plant in the quarter ended June 30, 2010 was $669,452. The new plant is now virtually complete with the only task remaining being the installation of the ‘Induction Furnaces’. The Company has fabricated its own gas furnaces to smelt the precipitated silver into doré bars until the new furnaces arrive and are installed along with a screw conveyor system. This plant is currently producing silver doré which are being shipped regularly to the refinery and as a result third party smelting and refining charges have decreased from US$3.63 per ounce in the second quarter of 2009 to their current level of US$0.90 per ounce. With the cyanidation plant operating at close to full capacity and lead prices at relatively low levels, management decided to suspend production of lead concentrate at the flotation circuit and to pass the fresh ore directly to the new cyanidation plant after grinding the ore. Mineral economics were reviewed and it was concluded that the additional fresh ore was more valuable being processed directly through cyanidation rather than being processed through flotation prior to cyanidation. With the sole focus on silver doré production, we expect continued dramatically reduced smelting and refining costs at the La Encantada mine. The flotation circuit will be maintained in operating condition, in the event that lead prices increase in the future, so that lead concentrate production could be resumed. Tonnes milled in the second quarter of 2010 increased to 264,552 tonnes compared to 194,750 tonnes in the first quarter of 2010, an increase of 36%. The average head grade was 248 g/t in the second quarter of 2010, representing a decrease of 32% when compared to 366 g/t in the first quarter of 2010 and an increase of 5% compared to the 237 g/t in the second quarter of 2009. Silver recovery in the second quarter of 2010 was 44% which is lower than the 56% achieved in the first quarter of 2010 and 50% in the second quarter of 2009. Recoveries decreased due to the start up process and fine tunning of the cyanidation mill associated with the halting of production through the flotation circuit and the direct feed of all material through the cyanidation plant. A total of 950,223 equivalent ounces of silver were produced during the second quarter of 2010, which represents an increase of 17% compared to 815,209 equivalent ounces of silver (commericial and pre-commercial production) produced in first quarter of 2010 and an increase of 226% compared to the 291,430 equivalent ounces of silver produced in the second quarter of 2009. Silver production consisted of 921,078 ounces of silver, representing an increase of 27% compared with the 723,622 ounces (commercial and pre-commercial) produced in the first quarter of 2010 and an increase of 250% compared with the 263,321 ounces produced in the second quarter of 2009. Lead production for the second quarter of 2010 was 549,461 pounds which was decrease of 996,324 pounds or 64% compared to the first quarter of 2010 and a decrease of 20,251 or 4% compared to the second quarter of 2009. Underground mine development consisted of 1,964 metres completed in the second quarter of 2010 compared to 2,033 metres of development completed in the first quarter of 2010, representing a decrease of 3%. This program focused on improving haulage and logistics for ore and waste that is transported by trucks from the mine, from several targets including the San Javier/Milagros Breccias, Azul y Oro including the new Buenos Aires areas and a new developed area between the 660 and the Ojuelas ore bodies. The purpose of the ongoing underground development program is to prepare for increased production in 2010 and to confirm additional Reserves and Resources. A total of 1,898 metres of diamond drilling was completed in the second quarter of 2010 compared to no drilling in the first quarter of 2010.
-12-
La Parrilla Silver Mine, Durango, Mexico
The La Parrilla Silver Mine is a connected group of producing underground operations consisting of the La Rosa/Rosarios/La Blanca mines which are connected through underground workings including the San Marcos and the Quebradillas mines, located approximately 65 kilometres southeast of the city of Durango, Mexico. La Parrilla includes an 850 tpd mill consisting of two parallel 425 tpd cyanidation and flotation circuits, buildings, offices and infrastructure and mining concessions covering an area of 53,000 hectares of which the Company leases 100 hectares of surface rights. The Company owns 100% of the La Parrilla Silver Mine. Tonnes milled at La Parrilla were 75,271 tonnes in the second quarter of 2010, representing an increase of 2% when compared with the 73,443 tonnes milled in the first quarter of 2010, but an increase of 18% when compared with the 63,548 tonnes milled in the second quarter of 2009. The average head grade for the second quarter of 2010 was 205 g/t and was 8 g/t lower than the first quarter of 2010 and 9 g/t higher than the second quarter of 2010. Recoveries of silver in the second quarter was 76% and was consistent with the first quarter of 2010 and a 5% decrease from the 81% recovery in the second quarter of 2009. Total silver production was 435,983 equivalent ounces of silver in the second quarter of 2010. This was a decrease of 9,619 equivalent ounces of silver or 2% compared to the first quarter of 2010 but an increase of 44,354 equivalent ounces of silver or 11% compared to the second quarter of 2009. The composition of the silver equivalent production in the second quarter of 2010 included 375,465 ounces of silver, 100 ounces of gold and 945,087 pounds of lead. This compares with 375,446 ounces of silver, 119 ounces of gold, 996,286 pounds of lead produced in the first quarter of 2010 and 324,972 ounces of silver, 221 ounces of gold, 923,450 pounds of lead in the second quarter of 2009. A total of 1,780 metres of underground development was completed in the second quarter of 2010, compared to 1,704 metres in the first quarter of 2010. No diamond drilling was completed in the second quarter of 2010 compared to 37 metres in first quarter of 2010. Development in the lower levels 8 and 9 of the Rosarios and La Rosa vein continued during the quarter providing access to Reserves and Resources that are going to be produced in the second half of the year. Also, access to level 10 was reached through a ramp which is providing further reserves and upgrading the indicated and inferred resources of the lower part of the Rosarios/La Rosa vein. At the Quebradillas area, development was focused on the Q25 ore body which was indicated from a previous program of diamond drilling, having developed at strike and the upper part of the ore body for more than 80 metres. The access to this ore body will provide ore for the future production of zinc concentrates at the La Parrilla flotation plant. In July 2010 a modification was made to the flotation circuit to convert from bulk to selective concentrate production, and the circuit is now producing zinc and lead concentrates. San Martin Silver Mine, Jalisco, Mexico The San Martin Silver Mine is a producing underground mine located adjacent to the town of San Martin de Bolaños, in Northern Jalisco State, Mexico. The mine comprises approximately 7,840 hectares of mineral rights, approximately 1,300 hectares of surface land rights surrounding the mine and another 104 hectares of surface land rights where the 900 tpd cyanidation mill and 500 tpd flotation circuit, mine buildings, infrastructure and offices are located. The Company owns 100% of the San Martin Silver Mine. The mill has historically produced 100% of its production in the form of doré. In early 2008, a 500 tpd flotation circuit was assembled to take advantage of the large sulphide resource at this mine, however, due to low base metal prices and high costs of smelting concentrates, the circuit was placed in care and maintenance pending further capital investment to complete it when the economics improve. Tonnes milled at the San Martin mine were 64,527 tonnes in the second quarter of 2010, representing a decrease of 6% when compared to the 68,917 tonnes milled in the first quarter of 2010 and decrease of 11% when compared to the 72,844 tonnes milled in the second quarter of 2010. The average head grade was 150 g/t in the
-13-
second quarter of 2010, representing a decrease of 17% when compared to the 181 g/t in the first quarter of 2010 and an increase of 9% when compared to the 138 g/t in the second quarter of 2009. Recoveries of silver in the second quarter of 2010 were consistent with the 78% achieved in the first quarter of 2010 and increased from the 74% achieved in the second quarter of 2009. Total production of 269,958 ounces of silver equivalent in the second quarter of 2010 was 25% lower than the 358,591 equivalent ounces of silver produced in the first quarter of 2010 and 2% lower than the 274,876 equivalent ounces of silver produced in the second quarter of 2009. The equivalent ounces of silver in the second quarter of 2010 consisted of 242,255 ounces of silver and 428 ounces of gold. This compares to 310,757 ounces of silver and 726 ounces of gold produced in the first quarter of 2010 and 239,427 ounces of silver and 525 ounces of gold in the second quarter of 2009. During the second quarter of 2010, a total of 1,319 metres of underground development was completed compared to 1,363 metres in the first quarter of 2010. In addition, 1,192 metres of diamond drilling was completed in the second quarter of 2010 compared to 272 metres in the first quarter of 2010. Exploration via short hole drilling into the footwall and hanging wall has shown success with the discovery of the new San Pedro area in 2009. This underground drilling program is continuing and is anticipated to result in structures similar to the San Pedro area and to continually provide additional oxide resources. The 2009 surface exploration program defined the new La Esperanza vein which runs parallel to the Zuloaga vein and has high anomalous samples from 100 to 250 grams per tonne of Ag on surface. The access road to this newly discovered vein began in the first quarter and is expected to be completed before summer. The diamond drilling program in the La Esperanza area is a high priority target, with drilling in progress through July and August and into the second half of 2010. Del Toro Silver Mine, Zacatecas, Mexico
The Del Toro Silver Mine is located 60 km to the southeast of the Company’s La Parrilla Silver Mine and consists of 392 contiguous hectares of mining claims plus an additional 100 hectares of surface rights covering the area surrounding the San Juan mine. The Del Toro operation represents the consolidation of two old silver mines, the Perseverancia and San Juan mines, which are approximately one kilometre apart. The Del Toro Silver Mine is an advanced stage development project that has undergone an aggressive drilling program since 2005 to explore the various areas of interest within the Del Toro property holdings. In January 2010 the “Change of Use of Land Permit” for a new Flotation Plant was approved by the SEMARNAT. This permit was the last permit required to commence construction of a new operation expected later this year. All necessary permits for the construction of a 1,000 tpd flotation mill were granted by the Mexican authorities in Q4 2009 and Q1 2010. No immediate plans are in place to commence construction, however the Company anticipates a decision later in 2010. The Company is proceeding with developing a 1,250 metres ramp into the lower levels of the Del Toro to assist its planning process for this mine. Real de Catorce Silver Project, San Luis Potosi, Mexico
The Real de Catorce Silver Project was acquired on November 13, 2009, through the acquisition of Normabec. As a result of the acquisition of Normabec, the Company owns 100% of the Real de Catorce Silver Project. The Real de Catorce mine is located 25 km west of the town of Matehuala in San Luis Potosi State, Mexico. The Real de Catorce property consists of 22 mining concessions covering 6,327 hectares, with historical production of 230 million ounces between 1773 and 1990. After the acquisition on November 13, 2009 of the historically famous Real de Catorce silver mine, the Company completed all of the transfer of ownership of the mining claims and the Mexican subsidiary Minera Real Bonanza. The Company is now preparing a plan to reconfirm the geologic information and to map out the future development activities in this very large silver mining district.

-14-
EXPLORATION PROPERTY UPDATES
Jalisco Group of Properties, Jalisco, Mexico
The Company acquired a group of mining claims totalling 5,131 hectares located in various mining districts located in Jalisco State, Mexico. During 2008, surface geology and mapping began with the purpose of defining future drill targets; however, exploration has been discontinued as the Company focuses its capital investment on other higher priority projects, namely the Del Toro Silver Mine and Real de Catorce Silver Project. RESULTS OF OPERATIONS Three Months ended June 30, 2010 compared to Three Months ended June 30, 2009.
June 30, 2010 June 30, 2009$ $
Gross revenue 31,799,382 15,779,596 (1) Net revenue 28,963,285 13,024,877 (2) Cost of sales 13,434,747 9,459,868 (3) Depreciation, depletion and amortization 2,380,032 1,772,464 (4)Accretion of reclamation obligation 94,201 117,171 Mine operating earnings 13,054,305 1,675,374 (5) General and administrative 2,406,842 2,114,312 (6) Stock-based compensation 643,964 800,808 (7)
3,050,806 2,915,120 Operating income 10,003,499 (1,239,746) (8) Interest and other expenses (683,210) (404,765) (9) Investment and other income 635,082 222,173 (10) Foreign exchange gain (loss) 344,075 840,958 (11) Income before taxes 10,299,446 (581,380) Income tax expense - current 45,411 113,532 Income tax (recovery) - future 1,366,919 (1,731,328) Income tax expense (recovery) 1,412,330 (1,617,796) (12) Net income for the quarter 8,887,116 1,036,416 (13)
Earnings per share - basic 0.10 0.01
For the Quarter Ended
Notes: 1. Consolidated gross revenue (prior to smelting and refining and metal deductions) for the quarter ended
June 30, 2010 was $31,799,382 or $19.58 (US$18.68) per ounce compared to $15,779,596 or $14.70 (US$12.60) per ounce for the quarter ended June 30, 2009 for an increase of $16,019,786 or 102%. The increase in the second quarter of 2010 is attributable to a 51% increase in equivalent silver ounces as the new La Encantada processing plant began commercial sales on April 1, 2010; as well, a 48% increase in US$ silver prices in the current quarter compared to the second quarter of 2009. In addition, there were foreign exchange effects due to the strength of the Canadian dollar compared to the U.S. dollar during the period compared to the same period in 2009 which had a negative effect on revenue of 14% as the shipments are valued in U.S. dollars.
2. Net revenue for the three months ended June 30, 2010 increased by $15,938,408 or 122% to $28,963,285 from $13,024,877 in the second quarter of 2009, due to the same increases that affected consolidated gross revenue in the second quarter of 2010. In addition, lower smelting and refining charges per ounce (9% of gross revenue compared to 17% in the second quarter of 2009) contributed to the increase in net revenue in the second quarter of 2010.
3. Cost of sales increased by $3,974,879 or 42%, to $13,434,747 in the second quarter of 2010 from $9,459,868 in the same quarter of 2009. This increase in cost of sales was accomplished while increasing the equivalent
-15-
silver ounces sold by 51% from the quarter ended June 30, 2009. In the second quarter of 2010, the Company processed higher grade ore than the comparative period in 2009.
4. Depreciation, depletion and amortization has increased by $607,568 or 34% to $2,380,032 in the second quarter of 2010 from $1,772,464 in the same quarter of 2009, due primarily to the additional $669,452 of depreciation and amortization related to the new La Encantada mill that shifted into commercial stage effective April 1, 2010, starting the depreciation and amortization expenses in this period.
5. Mine operating earnings increased by $11,378,931 or 679% to $13,054,305 for the quarter ended June 30, 2010 compared to $1,675,374 for the same quarter in the prior year. This is primarily due to the $15,938,408 increase in net revenue and offset by the higher cost of sales and depreciation, depletion and amortization expenses during the second quarter of 2010.
6. General and administrative expenses increased by $292,530 or 14% compared to the prior year primarily due to an aggressive investor relations compaign and a small increase in salaries and benefits.
7. Stock-based compensation decreased by $156,844 or 20% due to fewer options vesting in the second quarter of 2010.
8. Operating income increased by $11,243,245 or 907% to $10,003,499 for the quarter ended June 30, 2010 compared to an operating loss of $1,239,746 for the quarter ended June 30, 2009, due to the increase in mine operating earnings associated with higher production levels and higher silver prices.
9. During the quarter ended June 30, 2010, interest and other expenses increased by $278,445 or 69% to $683,210 compared to $404,765 for the quarter ended June 30, 2009 and is primarily due to interest charges relating to the debt facilities with FIFOMI for the completion of the MLE cyanidation plant and the pre-payment facility associated with the advances for the sale of lead concentrates. Also, the current quarter includes an assessment of $230,308 by the Mexican tax authorities relating to import duties from the years 1996 to 2004.
10. Investment and other income increased by $412,909 or 186% compared to the same quarter in the prior year. The increase is primarily attributed to the realized gain of $634,501 recorded on the silver futures and a gain of $15,499 on disposal of marketable securities during the second quarter of 2010.
11. The Company experienced a foreign exchange gain of $344,075 in the quarter ended June 30, 2010 compared to a foreign exchange gain of $840,958 in the quarter ended June 30, 2009 due to the devaluation of net monetary assets denominated in U.S. dollars related to a weakening of the U.S. dollar compared to the Canadian dollar.
12. During the quarter ended June 30, 2010, the Company recorded an income tax expense of $1,412,330 compared to a recovery of $1,617,796 in the quarter ended June 30, 2009, and this is reflective of earnings and would consist primarily of non-cash future income taxes arising from temporary timing differences and utilization of tax loss carryforwards. The Company has sufficient tax loss carryforwards to offset the current taxable earnings in the period.
13. As a result of the foregoing, net income for the quarter ended June 30, 2010 was $8,887,116 or basic earnings per share of $0.10 compared to a net income of $1,036,416 or $0.01 per common share in the quarter ended June 30, 2009, for an increase of $7,850,700 or 757% compared to the same period in the prior year.
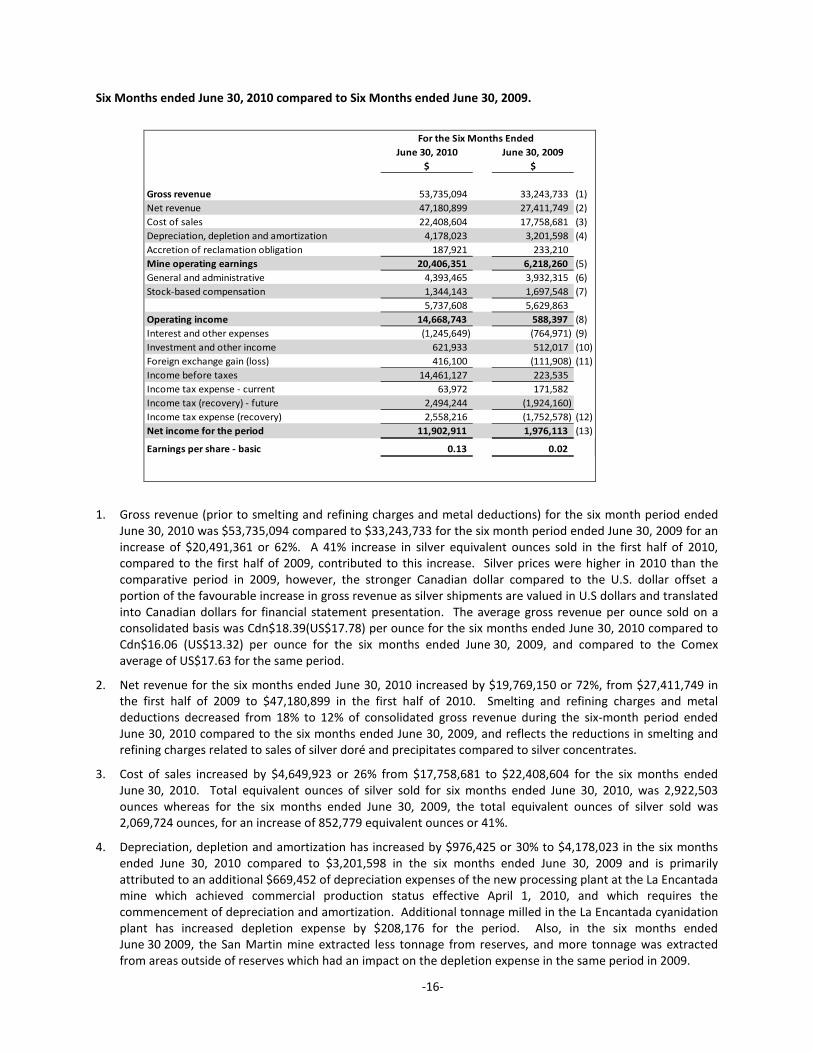
-16-
Six Months ended June 30, 2010 compared to Six Months ended June 30, 2009.
June 30, 2010 June 30, 2009$ $
Gross revenue 53,735,094 33,243,733 (1) Net revenue 47,180,899 27,411,749 (2) Cost of sales 22,408,604 17,758,681 (3) Depreciation, depletion and amortization 4,178,023 3,201,598 (4) Accretion of reclamation obligation 187,921 233,210 Mine operating earnings 20,406,351 6,218,260 (5) General and administrative 4,393,465 3,932,315 (6) Stock-based compensation 1,344,143 1,697,548 (7)
5,737,608 5,629,863 Operating income 14,668,743 588,397 (8) Interest and other expenses (1,245,649) (764,971) (9) Investment and other income 621,933 512,017 (10) Foreign exchange gain (loss) 416,100 (111,908) (11) Income before taxes 14,461,127 223,535 Income tax expense - current 63,972 171,582 Income tax (recovery) - future 2,494,244 (1,924,160) Income tax expense (recovery) 2,558,216 (1,752,578) (12) Net income for the period 11,902,911 1,976,113 (13)
Earnings per share - basic 0.13 0.02
For the Six Months Ended
1. Gross revenue (prior to smelting and refining charges and metal deductions) for the six month period ended June 30, 2010 was $53,735,094 compared to $33,243,733 for the six month period ended June 30, 2009 for an increase of $20,491,361 or 62%. A 41% increase in silver equivalent ounces sold in the first half of 2010, compared to the first half of 2009, contributed to this increase. Silver prices were higher in 2010 than the comparative period in 2009, however, the stronger Canadian dollar compared to the U.S. dollar offset a portion of the favourable increase in gross revenue as silver shipments are valued in U.S dollars and translated into Canadian dollars for financial statement presentation. The average gross revenue per ounce sold on a consolidated basis was Cdn$18.39(US$17.78) per ounce for the six months ended June 30, 2010 compared to Cdn$16.06 (US$13.32) per ounce for the six months ended June 30, 2009, and compared to the Comex average of US$17.63 for the same period.
2. Net revenue for the six months ended June 30, 2010 increased by $19,769,150 or 72%, from $27,411,749 in the first half of 2009 to $47,180,899 in the first half of 2010. Smelting and refining charges and metal deductions decreased from 18% to 12% of consolidated gross revenue during the six-month period ended June 30, 2010 compared to the six months ended June 30, 2009, and reflects the reductions in smelting and refining charges related to sales of silver doré and precipitates compared to silver concentrates.
3. Cost of sales increased by $4,649,923 or 26% from $17,758,681 to $22,408,604 for the six months ended June 30, 2010. Total equivalent ounces of silver sold for six months ended June 30, 2010, was 2,922,503 ounces whereas for the six months ended June 30, 2009, the total equivalent ounces of silver sold was 2,069,724 ounces, for an increase of 852,779 equivalent ounces or 41%.
4. Depreciation, depletion and amortization has increased by $976,425 or 30% to $4,178,023 in the six months ended June 30, 2010 compared to $3,201,598 in the six months ended June 30, 2009 and is primarily attributed to an additional $669,452 of depreciation expenses of the new processing plant at the La Encantada mine which achieved commercial production status effective April 1, 2010, and which requires the commencement of depreciation and amortization. Additional tonnage milled in the La Encantada cyanidation plant has increased depletion expense by $208,176 for the period. Also, in the six months ended June 30 2009, the San Martin mine extracted less tonnage from reserves, and more tonnage was extracted from areas outside of reserves which had an impact on the depletion expense in the same period in 2009.
-17-
5. Mine operating earnings increased by $14,188,091 or 228% to $20,406,351 for the six month period ended June 30, 2010 compared to $6,218,260 for the same period in prior year. This is primarily due to the $19,769,150 increase in net revenue and offset by the higher cost of sales and depreciation, depletion and amortization expense during the six months ended June 30, 2010.
6. General and administrative expenses increased by $461,150 or 12% in the six months ended June 30, 2010 compared to the same period in the prior year and is primarily due to the small increase in salaries and benefits and an aggressive program of investor relations.
7. Stock-based compensation decreased by $353,405 or 21% due to fewer stock options vesting in the six months ended June 30, 2010 compared to the prior year.
8. Operating income increased by $14,080,346 or 2,393%, from $588,397 for the period ended June 30, 2009 to $14,668,743 for the period ended June 30, 2010. The increase is attributable to the $14,188,091 increase of mine operating earnings, and $353,405 reduction in stock-based compensation but it was partially offset by an increase of $461,150 in general and administration expenses.
9. Interest and other expenses increased by $480,678 or 63% in the six month period ended June 30, 2010 compared to the prior year and is primarily attributed to additional interest on capital leases and financing cost relating to advance payments on silver shipments.
10. Investment and other income increased by $109,916 or 21% and is primarily attributed to an increase in realized gains on silver futures.
11. There was a foreign exchange gain of $416,100 for the six month period ended June 30, 2010, compared to a loss of $111,908 in the six month period ended June 30, 2009, due to the effect of a weakening U.S. dollar on outstanding U.S. dollar denominated liabilities.
12. During the six months ended June 30, 2010, the Company recorded an income tax expense of $2,558,216 compared to a tax recovery of $1,752,578 in the six months ended June 30, 2009 and is reflective of earnings and would consist primarily of non-cash future income taxes arising from temporary timing differences and utilization of tax loss carryforwards. In 2009, the recovery was also attributed to a Canadian dollar equivalent of $542,906 for the adjusted tax deductibility of energy expenses which increased the tax loss carryforwards.
13. Net income for the six months ended June 30, 2010 was $11,902,911 or $0.13 per common share (basic) compared to net income of $1,976,113 or $0.01 per common share in 2009, for an increase of $9,926,798 or 502%.

-18-
SUMMARY OF QUARTERLY RESULTS The following table presents selected financial information for each of the most recent eight quarters.
Net sales revenues
Net income (loss) after
taxes
Basic and diluted net
income (loss) per common
shareStock-based
compensation (8)Quarter $ $ $ $ Note
Q2 28,963,285 8,887,116 0.10 643,964 1Q1 18,217,614 3,015,795 0.03 700,179 2Q4 18,374,117 2,492,488 0.03 1,099,386 3Q3 13,724,803 1,841,623 0.02 505,847 4Q2 13,024,877 1,036,416 0.01 800,808 5Q1 14,386,872 939,698 0.01 896,739 6Q4 9,106,605 (5,538,906) (0.08) 865,415 7Q3 10,817,211 (374,245) (0.01) 1,035,864Year ended December 31, 2008
Year ended December 31, 2009
Year ended December 31, 2010
Notes:
1. In the quarter ended June 30, 2010, net sales increased by $10,745,671 compared to the quarter ended March 31, 2010 and was primarily due to an increase of 325,185 equivalent ounces of silver sold (after intercompany eliminations) in the second quarter of 2010 compared to the first quarter of 2010. In the first quarter of 2010, pre-commercial sales were not included as equivalent ounces sold but instead were credited to the capitalization of the La Encantada mill expansion project. The net sales and net income was positively affected by an increase of the average gross revenue per ounce realized of $19.58 (US$18.68) in the quarter ended June 30, 2010 compared to $16.89(US$16.23) in the quarter ended March 31, 2010.
2. In the quarter ended March 31, 2010, net sales revenue was comparable to the quarter ended December 31, 2009. The Company sold an additional 153,097 equivalent ounces of silver (after intercompany eliminations) in the first quarter of 2010 compared to the fourth quarter of 2009; however, the average gross revenue per ounce realized was $16.89 (US$16.23) in the quarter ended March 31, 2010 compared to $18.71 (US$17.72) in the quarter ended December 31, 2009; an average effect of $1.82 per ounce or 10% (not including the $2.3 million profit from pre-commercial sales).
3. In the quarter ended December 31, 2009, net sales revenue increased due to increasing silver prices. The average gross revenue per ounce of silver realized increased to US$17.72 in the quarter ended December 31, 2009, compared to US$15.07 in the prior quarter ended September 30, 2009.
4. In the quarter ended September 30, 2009, net sales revenue increased due to rising prices. The average gross revenue per ounce of silver realized was US$15.07 in the quarter ended September 30, 2009, increasing from US$12.60 in the prior quarter ended June 30, 2009.
5. In the quarter ended June 30, 2009, net sales revenue decreased due to losses on final settlements for which provisional payments had already been received in the prior quarter.
6. In the quarter ended March 31, 2009, a stronger U.S. dollar compared to the Canadian dollar accounted for the increase of revenue. Although silver prices were lower in the first quarter of 2009, the average gross revenue per ounce sold was Cdn$17.52 (US$14.07) per ounce on a consolidated basis for the three-month period ended March 31, 2009. Also contributing to an increase in net sales is $1,194,452 from the sale of coins, ingots and bullion in the three months ended March 31, 2009.
7. In the quarter ended December 31, 2008, net sales revenue was negatively affected by declining silver prices and losses on final metal settlements, for which provisional payments had already been received. While the average gross revenue per ounce was US$14.66 for the year ended December 31, 2008, the average gross revenue per ounce for the fourth quarter of 2008 was US$11.67 per ounce. In addition, the strengthening U.S.
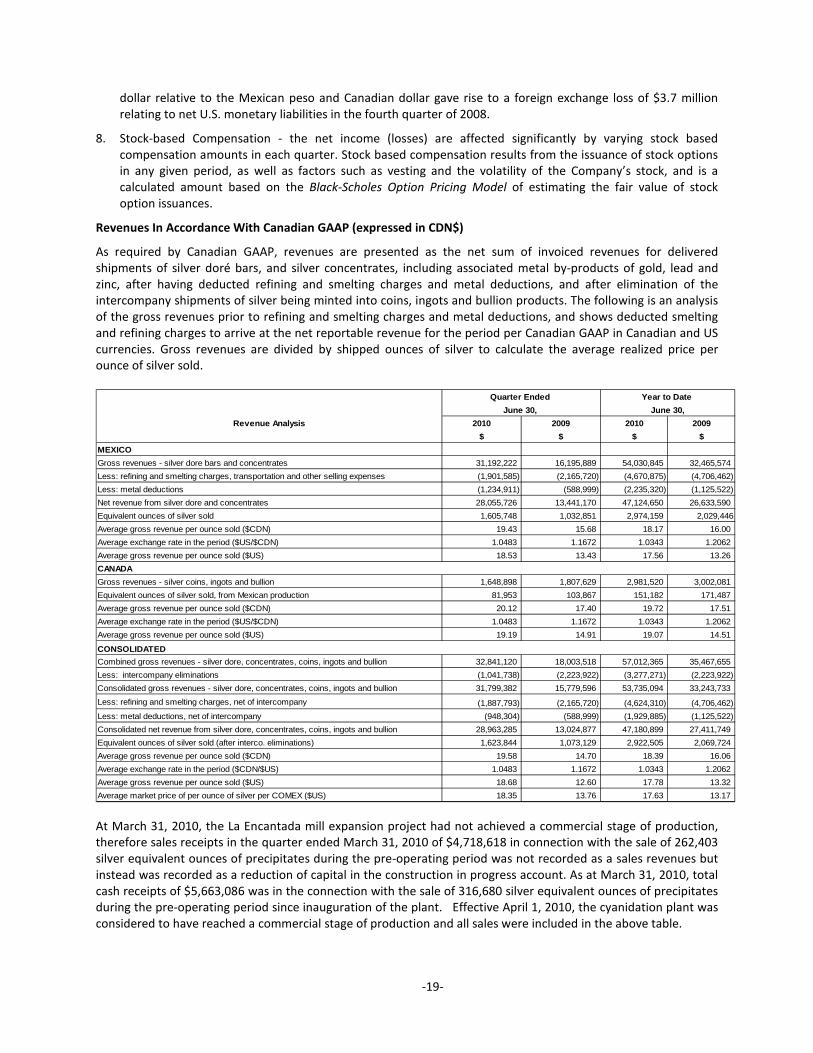
-19-
dollar relative to the Mexican peso and Canadian dollar gave rise to a foreign exchange loss of $3.7 million relating to net U.S. monetary liabilities in the fourth quarter of 2008.
8. Stock-based Compensation - the net income (losses) are affected significantly by varying stock based compensation amounts in each quarter. Stock based compensation results from the issuance of stock options in any given period, as well as factors such as vesting and the volatility of the Company’s stock, and is a calculated amount based on the Black-Scholes Option Pricing Model of estimating the fair value of stock option issuances.
Revenues In Accordance With Canadian GAAP (expressed in CDN$)
As required by Canadian GAAP, revenues are presented as the net sum of invoiced revenues for delivered shipments of silver doré bars, and silver concentrates, including associated metal by-products of gold, lead and zinc, after having deducted refining and smelting charges and metal deductions, and after elimination of the intercompany shipments of silver being minted into coins, ingots and bullion products. The following is an analysis of the gross revenues prior to refining and smelting charges and metal deductions, and shows deducted smelting and refining charges to arrive at the net reportable revenue for the period per Canadian GAAP in Canadian and US currencies. Gross revenues are divided by shipped ounces of silver to calculate the average realized price per ounce of silver sold.
Revenue Analysis 2010 2009 2010 2009$ $ $ $
MEXICOGross revenues - silver dore bars and concentrates 31,192,222 16,195,889 54,030,845 32,465,574 Less: refining and smelting charges, transportation and other selling expenses (1,901,585) (2,165,720) (4,670,875) (4,706,462) Less: metal deductions (1,234,911) (588,999) (2,235,320) (1,125,522) Net revenue from silver dore and concentrates 28,055,726 13,441,170 47,124,650 26,633,590 Equivalent ounces of silver sold 1,605,748 1,032,851 2,974,159 2,029,446Average gross revenue per ounce sold ($CDN) 19.43 15.68 18.17 16.00 Average exchange rate in the period ($US/$CDN) 1.0483 1.1672 1.0343 1.2062 Average gross revenue per ounce sold ($US) 18.53 13.43 17.56 13.26
Gross revenues - silver coins, ingots and bullion 1,648,898 1,807,629 2,981,520 3,002,081 Equivalent ounces of silver sold, from Mexican production 81,953 103,867 151,182 171,487 Average gross revenue per ounce sold ($CDN) 20.12 17.40 19.72 17.51 Average exchange rate in the period ($US/$CDN) 1.0483 1.1672 1.0343 1.2062 Average gross revenue per ounce sold ($US) 19.19 14.91 19.07 14.51
CONSOLIDATEDCombined gross revenues - silver dore, concentrates, coins, ingots and bullion 32,841,120 18,003,518 57,012,365 35,467,655 Less: intercompany eliminations (1,041,738) (2,223,922) (3,277,271) (2,223,922) Consolidated gross revenues - silver dore, concentrates, coins, ingots and bullion 31,799,382 15,779,596 53,735,094 33,243,733
Less: refining and smelting charges, net of intercompany (1,887,793) (2,165,720) (4,624,310) (4,706,462) Less: metal deductions, net of intercompany (948,304) (588,999) (1,929,885) (1,125,522) Consolidated net revenue from silver dore, concentrates, coins, ingots and bullion 28,963,285 13,024,877 47,180,899 27,411,749 Equivalent ounces of silver sold (after interco. eliminations) 1,623,844 1,073,129 2,922,505 2,069,724 Average gross revenue per ounce sold ($CDN) 19.58 14.70 18.39 16.06 Average exchange rate in the period ($CDN/$US) 1.0483 1.1672 1.0343 1.2062 Average gross revenue per ounce sold ($US) 18.68 12.60 17.78 13.32 Average market price of per ounce of silver per COMEX ($US) 18.35 13.76 17.63 13.17
CANADA
Year to Date June 30,
Quarter Ended June 30,
At March 31, 2010, the La Encantada mill expansion project had not achieved a commercial stage of production, therefore sales receipts in the quarter ended March 31, 2010 of $4,718,618 in connection with the sale of 262,403 silver equivalent ounces of precipitates during the pre-operating period was not recorded as a sales revenues but instead was recorded as a reduction of capital in the construction in progress account. As at March 31, 2010, total cash receipts of $5,663,086 was in the connection with the sale of 316,680 silver equivalent ounces of precipitates during the pre-operating period since inauguration of the plant. Effective April 1, 2010, the cyanidation plant was considered to have reached a commercial stage of production and all sales were included in the above table.
-20-
LIQUIDITY At June 30, 2010, the Company had working capital of $14.4 million and cash and cash equivalents of $15.9 million compared to working capital of $4.8 million and cash and cash equivalents of $5.9 million at December 31, 2009. Working capital increased by $9.6 million as a result of $12.5 million generated from operating activities, consisting of an increase in inventory by $2.0 million primarily attributed to the La Encantada cyanidation plant for various stages of mineral inventory and the warehouse inventory, and an increase of $0.8 million in prepaid expenses and other relating to advances to suppliers and contractors. Accounts payable and accrued liabilities increased by $3.7 million due to timing of payments to vendors and accrual of the employee profit sharing plan as per Mexican government legislation . The current portion of debt facilities increased by $0.5 million, relating to the increase in the pre-payment facility the Company has drawn relating to the lead concentrates compared to as at December 31, 2009. Also, the current portion of capital leases decreased by $0.8 million due to payments during the period. During the quarter ended June 30, 2010 the Company invested $2.6 million into the acquisition, exploration and development of its mineral properties and a further $3.0 million in additions to plant and equipment The Company is accumulating cash in treasury to restore funds which were consumed during the completion of the La Encantada processing plant project. Funds surplus to the Company’s short-term operating needs are invested in highly liquid short-term investments with maturities of three months or less. The funds are not exposed to liquidity risk and there are no restrictions on the ability of the Company to use these funds to meet its obligations. The Company has no exposure to and has not invested in any asset backed commercial paper securities.
The Company is assessing its continuing expansion plans and the associated funds requirements but is deferring any new financings until its plans have reached a definitive stage. 2010 OUTLOOK This section of the MD&A provides management’s production and costs forecasts for 2010. These are forward-looking estimates and subject to the cautionary note regarding the risks associated with forward looking statements at the beginning of this MD&A. The Company recently completed a revision of its budget expectations for the second half of 2010. Based on this detailed review of costs and production, it is believed that the Company is likely to achieve its production target of 6.3 million silver ounces (6.9 million ounces of silver equivalents) in 2010. The Company is also continuing to review opportunities to maximize its profit per ounce of silver while continuing to find efficiencies which will lower its costs and compensate for higher fuel and energy costs and a stronger Mexican currency relative to the US dollar. These efforts are being made with an attempt to reduce total US$ cash costs per ounce, maximizing average US$ gross revenue per ounce in order to continue to improve operating income through the second half of 2010. OFF-BALANCE SHEET ARRANGEMENTS At June 30, 2010, the Company had no material off-balance sheet arrangements such as guarantee contracts, contingent interest in assets transferred to an entity, derivative instruments obligations or any obligations that generate financing, liquidity, market or credit risk to the Company, other than those disclosed in this MD&A and the consolidated financial statements and the related notes. Derivative instruments are carried at fair value.

-21-
RELATED PARTY TRANSACTIONS
Amounts paid to related parties were incurred in the normal course of business and measured at the exchange amount, which is the amount agreed upon by the transacting parties and on terms and conditions similar to non-related parties. During the quarter ended June 30, 2010, there were no significant transactions with related parties. PROPOSED TRANSACTIONS Other than as disclosed herein, the board of directors of the Company is not aware of any proposed transactions involving any proposed assets, businesses, business acquisitions or dispositions which may have an effect on the financial condition, results of operations and cash flows. CONTRACTUAL OBLIGATIONS The Company’s liabilities have contractual maturities which are summarized below:
Total Less than 1 to 3 4 to 5 After 5
1 year years years years
Capital Lease Obligations 1,741,271$ 1,372,510$ 368,761$ -$ -$
FIFOMI Loan Facilities 4,298,774 1,417,759 1,728,598 1,152,417 -
Trafigura Prepayment Facility 627,681 627,681 - - - Real de Catorce Payments (1) 1,272,720 1,272,720 - - - Purchase Obligations (2) 95,000 95,000 - - -
Asset Retirement Obligations 4,660,588 - - - 4,660,588
Accounts Payable and Accrued Liabilities 14,917,025 14,917,025 - - -
Total Contractual Obligations 27,613,059$ 19,702,695$ 2,097,359$ 1,152,417$ 4,660,588$
(1) Contract commitments to acquire surface rights and geological information relating to the Real de Catorce Project.
(2) Contract commitments for construction materials and equipment for the La Encantada mill expansion project.
Payments Due By Period
CRITICAL ACCOUNTING ESTIMATES The preparation of financial statements in conformity with generally accepted accounting principles in Canada requires companies to establish accounting policies and to make estimates that affect both the amount and timing of the recording of assets, liabilities, revenues and expenses. Some of these estimates require judgments about matters that are inherently uncertain. All of the Company’s significant accounting policies and the estimates are included in Note 2 in the annual consolidated financial statements for the year ended December 31, 2009. While all of the significant accounting policies are important to the Company’s consolidated financial statements, the following accounting policies and the estimates have been identified as being critical:
• Carrying Values of Property, Plant and Equipment and Other Mineral Property Interests; • Depletion and Depreciation of Property, Plant and Equipment; • Asset Retirement Obligations and Reclamation Costs; • Income Taxes; and • Stock Based Compensation.
-22-
Carrying Values of Property, Plant and Equipment and Other Mineral Property Interests The Company reviews and evaluates its mineral properties for impairment at least annually or when events and changes in circumstances indicate that the related carrying amounts may not be recoverable. Impairment is considered to exist if the total estimated future undiscounted cash flows are less than the carrying amount of the assets. Estimated undiscounted future net cash flows for properties in which a mineral resource has been identified are calculated using estimated future production, commodity prices, operating and capital costs and reclamation and closure costs. Undiscounted future cash flows for exploration stage mineral properties are estimated by reference to the timing of exploration and/or development work, work programs proposed, the exploration results achieved to date and the likely proceeds receivable if the Company sold specific properties to third parties. If it is determined that the future net cash flows from a property are less than the carrying value, then an impairment loss is recorded to write down the property to fair value. The Company completed an impairment review of its properties at December 31, 2009. The estimates used by management were subject to various risks and uncertainties. It is reasonably possible that changes in estimates could occur which may affect the expected recoverability of the Company’s investments in mining projects and other mineral property interests. Depletion and Depreciation of Property, Plant and Equipment Property, plant and equipment comprise one of the largest components of the Company’s assets and, as such, the amortization of these assets has a significant effect on the Company’s financial statements. On the commencement of commercial production, depletion of each mining property is provided on the unit-of-production basis using estimated reserves and resources expected to be converted to reserves as the depletion basis. The mining plant and equipment and other capital assets are depreciated, following the commencement of commercial production, over their expected economic lives using the unit-of-production method. Capital projects in progress are not depreciated until the capital asset has been put into operation. The reserves are determined based on a professional evaluation using accepted international standards for the assessment of mineral reserves. The assessment involves the study of geological, geophysical and economic data and the reliance on a number of assumptions. The estimates of the reserves may change, based on additional knowledge gained subsequent to the initial assessment. This may include additional data available from continuing exploration, results from the reconciliation of actual mining production data against the original reserve estimates, or the impact of economic factors such as changes in the price of commodities or the cost of components of production. A change in the original estimate of reserves would result in a change in the rate of depletion and depreciation of the related mining assets or could result in impairment resulting in a write-down of the assets. Asset Retirement Obligations and Reclamation Costs The Company has obligations for site restoration and decommissioning related to its mining properties. The Company, using mine closure plans or other similar studies that outline the requirements planned to be carried out, estimates the future obligations from mine closure activities. Since the obligations are dependent on the laws and regulations of the country in which the mines operate, the requirements could change resulting from amendments in those laws and regulations relating to environmental protection and other legislation affecting resource companies. The Company recognizes liabilities for statutory, contractual or legal obligations associated with the retirement of mining property, plant and equipment, when those obligations result from the acquisition, construction, development or normal operation of the assets. Initially, a liability for an asset retirement obligation is recognized at its fair value in the period in which it is incurred. Upon initial recognition of the liability, the corresponding asset retirement cost is added to the carrying amount of the related asset and the cost is amortized as an expense over the economic life of the asset using either the unit-of-production method or the straight-line method, as appropriate. Following the initial recognition of the asset retirement obligation, the carrying amount of the
-23-
liability is increased for the passage of time and adjusted for changes to the amount or timing of the underlying cash flows needed to settle the obligation. As the estimate of obligations is based on future expectations, in the determination of closure provisions, management makes a number of assumptions and judgments. The liability is accreted over time to the amount ultimately payable through periodic charges to earnings. The undiscounted amount of estimated cash flows required to settle the Company’s estimated obligations is discounted using a credit adjusted risk free rate of 8.5%. The closure provisions are more uncertain the further into the future the mine closure activities are to be carried out. Actual costs incurred in future periods related to the disruption to date could differ materially from the discounted future value estimated by the Company at June 30, 2010. Income Taxes Future income tax assets and liabilities are computed based on differences between the carrying amounts of assets and liabilities on the balance sheet and their corresponding tax values, using the enacted or substantially enacted, as applicable, income tax rates at each balance sheet date. Future income tax assets also result from unused loss carry-forwards and other deductions. The valuation of future income tax assets is reviewed quarterly and adjusted, if necessary, by use of a valuation allowance to reflect the estimated realizable amount. The determination of the ability of the Company to utilize tax loss carry-forwards to offset future income tax payable requires management to exercise judgment and make assumptions about the future performance of the Company. Management executed a corporate restructuring for tax purposes that became effective January 1, 2008, enabling it on a limited basis to consolidate its tax losses of certain subsidiaries against the taxable incomes of other subsidiaries. Co-incident with the tax consolidation, Mexico introduced an alternative minimum tax known as the IETU, effective January 1, 2008, to attempt to limit certain companies from avoiding paying taxes on their cash earnings in Mexico. Management has reviewed its IETU obligations and its consolidated tax position at June 30, 2010, and management assessed whether the Company is “more likely than not” to benefit from these tax losses prior to recording a benefit from the tax losses. In December 2009, Mexico introduced tax consolidation reform tax rules which, effective January 2010, would require companies to begin the recapture of the benefits of tax consolidation within five years of receiving the benefit, and phased in over a five year period. First Majestic’s first tax deferral benefit from consolidation was realized in 2008, and as such the benefit of tax consolidation would be recaptured from 2013 to 2018. Numerous companies in Mexico are challenging the legality of these regressive tax reforms. It is unlikely that the outcome of these challenges will be determinable for several years. Other changes in economic conditions, metal prices and other factors could result in revisions to the estimates of the benefits to be realized or the timing of utilizing the losses. Stock-Based Compensation The Company uses the Black-Scholes Option Pricing Model. Option pricing models require the input of subjective assumptions including the expected price volatility. Changes in the input assumptions can materially affect the fair value estimate, and therefore the existing models do not necessarily provide an accurate single measure of the actual fair value of the Company’s stock options granted during the year.
-24-
FUTURE ACCOUNTING CHANGES
Business Combinations, Consolidations and Non-controlling interests The CICA has approved new Handbook Section 1582, “Business Combinations”, Section 1601 “Consolidations” and Section 1602 “Non-controlling Interests” to harmonize with International Financial Reporting Standards (“IFRS”). These new sections will be effective for years beginning on or after January 1, 2011, with early adoption permitted. Section 1582 specifies a number of changes including: an expanded definition of a business, a requirement to measure all business acquisitions at fair value, a requirement to measure non-controlling interests at fair value, and a requirement to recognize acquisition related costs as expenses. Section 1601 establishes the standards for preparing consolidated financial statements. Section 1602 specifies that non-controlling interests be treated as a separate component of equity, not as a liability or other item outside of equity. The Company has adopted these new standards for the period ended June 30, 2010.
INTERNATIONAL FINANCIAL REPORTING STANDARDS (“IFRS”)
In February 2008, the CICA announced that Canadian GAAP for publicly accountable enterprises will be replaced by International Financial Reporting Standards (“IFRS”) for fiscal years beginning on or after January 1, 2011. The Company will be required to begin reporting under IFRS for the quarter ending March 31, 2011, and will be required to prepare a revised opening balance sheet as at January 1, 2010, and provide information that conforms to IFRS for comparative periods presented. The Company has developed an IFRS changeover plan which addresses the key areas such as accounting policies, financial reporting, disclosure controls and procedures, information systems, education and training and other business activities. The Company commenced its IFRS conversion project during the second quarter of 2009 and has established a conversion plan and an IFRS project team. The IFRS conversion project is comprised of three phases: i) project planning, scoping and preliminary impact analysis; ii) detailed diagnostics and evaluation of financial impacts, selection of accounting policies, and design of operational and business processes; and iii) implementation and review. The Company is in the second phase of its conversion plan and has completed a detailed analysis of the standards, including the evaluation of policy choices for those standards that may have an impact on its financial statements, business processes and systems. Management is in the process of quantifying the expected material differences between lFRS and the current accounting treatment under Canadian GAAP. Differences with respect to recognition, measurement, presentation and disclosure of financial information are expected in key accounting areas. The Company cannot reasonably determine the full impact that adopting IFRS would have on its financial statements at this time. As a result, it is unable to quantify the impact of adopting IFRS on the financial statements as at June 30, 2010. The Company is continuing to monitor developments in standards and interpretations of standards and industry practices. Due to anticipated changes to IFRS and International Accounting Standards prior to the adoption of IFRS, management’s plan is subject to change based on new facts and circumstances that arise. The following list, though not exhaustive, identifies some of the changes in key accounting policies due to the adoption of IFRS: Standards Difference from GAAP Potential Impact Presentation and disclosure IFRS requires significantly more disclosure than
Canadian GAAP for certain standards. In addition, classification and presentation may be different for some balance sheet items.
The increased disclosure requirements will cause the Company to change financial reporting processes to ensure the appropriate data is collected. The Company is analyzing the impact of classification and presentation changes.
-25-
Standards Difference from GAAP Potential Impact First time Adoption of IFRS (IFRS 1) IFRS 1 provides entities adopting IFRS for the first time
with a number of optional exemptions and mandatory exceptions in certain areas to the general requirement for full retrospective application of IFRS. With regards to the IFRS transition, the Company continues to analyze the optional exemptions available under IFRS 1.
The adoption of certain exemptions will impact the January 1, 2010 opening balance sheet adjustments. The Company continues to assess the appropriateness of the accounting policies applied under IFRS both at the time of transition and following transition.
Property, Plant and Equipment (IAS 16)
IFRS requires all significant components of property, plant and equipment (“PPE”) to be amortized according to their individual useful lives as determined in accordance with IFRS. IAS 16 permits the revaluation of PPE to fair value.
Potentially material components within processing plants will have shorter useful lives than the entire plant, requiring increased amortization expenses.
Impairment of Long-lived Assets (IAS 36)
IFRS requires the assessment of asset impairment to be based on comparing the carrying amount to the recoverable amount using discounted cashflows while GAAP only requires discounting if the carrying value of assets exceeds the undiscounted cash flows. IFRS also requires the reversal of any previous asset impairments, excluding goodwill, where circumstances have changed. GAAP prohibits the reversal of impairment losses.
The differences in methodology may result in asset impairments upon transition to IFRS. The Company is currently assessing the potential impact on long-lived assets which may require further writedowns relating to impairments.
Asset Retirement Obligations (IAS 37) Differences include the basis of estimation for undiscounted cashflows, the discount rate used, the frequency of liability remeasurement, and recognition of a liability when a constructive obligation exists.
IFRS 1 provides an exemption which allows the Company to recognize reclamation and closure costs obligations, estimate costs of the related mining properties using risk free rates, and recalculating depreciation and depletion of assets at fair value as at January 1, 2010.
Income Taxes (subject to adoption at transition of a revised IAS 12 standard)
Recognition and measurement criteria for deferred tax assets and liabilities may differ.
Deferred tax assets may be derecognized at transition. This standard is in-transition since IAS 12 was withdrawn in November 2009 and the AcSB will adopt the converged standard at changeover to IFRS. The Company is assessing the changes but the changes are not likely significant.
Functional Currency (IAS 21)
IAS 21 requires the Company to determine the translation differences in accordance with IFRS from the date on which a subsidiary was formed or acquired.
IFRS 1 provides an exemption that allows a Company to reset its cumulative translation account to zero at the date of transition, with the balance being transferred to opening retained earnings.
Business Combinations (IFRS 3)
Under GAAP, the new HB section 1582 is effective January 1, 2011 to converge with IFRS and early adoption is permitted.
Early adoption of HB section 1582 is permitted, and the Company plans to early adopt this section for the year ended December 31, 2010. IFRS 1 will allow IFRS rules for business combinations on a prospective basis rather than re-stating all business combinations.
Leases (IAS 17) IFRS classifies leases as either financing or operating leases and classification depends on whether substantially all of the risks and rewards incidental to ownership of a leased asset have been transferred from the lessor to the lessee, and is made at the inception of the lease. There are no quantitative thresholds similar to GAAP.
The Company is developing internal indicators to assist in lease classification under IFRS.
Borrowing Costs (IAS 23) IAS 23 does not allow the expensing of borrowing costs, to the extent they are directly attributable to acquisition, production and construction of a qualifying asset.
IFRS 1 allows companies to capitalize borrowing costs relating to all qualifying assets prospectively on adoption.
Stock-based Compensation (IFRS 2) Under Canadian GAAP, obligations for cash payments under stock-based compensation plans are accrued using the intrinsic method, compared to the fair value method under IFRS.
While the carrying value of each reporting period will be different under IFRS, the cumulative expense recognized over the life of the instrument will be the same. The Company will adopt this change prospectively using the IFRS 1 exemption for share units that vest prior to January 1, 2010.
-26-
Other important considerations during the IFRS transition are the following: Internal control over financial reporting (“ICFR”) – for all accounting policy changes identified, the Company will assess the impact on the ICFR design and effectiveness implications and will ensure that all changes in accounting policies include the appropriate additional controls and procedures for future IFRS reporting requirements. Disclosure controls and procedures (“DC&P”) – for all accounting policy changes identified an assessment of DC&P design and effectiveness implication will be analyzed to address any issues with respect to DC&P during IFRS transition. INTERNAL CONTROL OVER FINANCIAL REPORTING AND DISCLOSURE CONTROLS AND PROCEDURES The Company’s management is responsible for establishing and maintaining adequate internal control over financial reporting. Any system of control over financial reporting, no matter how well designed, has inherent limitations. Therefore, even those systems determined to be effective can provide only reasonable assurance with respect to financial statement preparation and presentation. The Company’s officers and management are also responsible for establishing and maintaining disclosure controls and procedures for the Company. These disclosure controls and procedures are designed to provide reasonable assurance that any information required to be disclosed by the Company under securities legislation is recorded, processed, summarized and reported within the applicable time periods and to ensure that required information is gathered and communicated to the Company’s management so that decisions can be made about timely disclosure of that information. Management has been remediating internal controls since 2009, and is proceeding on a course of strengthening internal controls in accounting systems in Mexico and Canada. The risk of material error is mitigated by extensive management reviews of financial and operating reports, account reconciliations and analyses in both Mexico and Canada, as well as monthly audit committee reviews. Significant progress on management’s remediation plan has been achieved, and management expects the remainder of its current plan to be completed by the end of 2010. Based upon the recent assessment of the effectiveness of the internal control over financial reporting and disclosure controls and procedures, including consideration of detailed analyses by supervisory personnel to mitigate any exposure or weaknesses, the Company’s Chief Executive Officer and Chief Financial Officer have concluded that there are weaknesses in Mexico, however these are compensated by head office supervisory controls and as a result management has concluded that there are no material unmitigated weaknesses, and the design and implementation of internal control over financial reporting and disclosure controls and procedures were effective as at June 30, 2010. OTHER MD&A REQUIREMENTS Additional information relating to the Company may be found on or in:
• SEDAR at www.sedar.com, • the Company’s Annual Information Form, • the Company’s audited consolidated financial statements for the year ended December 31, 2009.