interferometric extraction of ssp from passive seismic data yanwei xue feb. 7, 2008
Post on 21-Dec-2015
215 views
TRANSCRIPT

Interferometric Extraction Interferometric Extraction ofof
SSP from Passive Seismic SSP from Passive Seismic Data Data
Yanwei XueYanwei Xue
Feb. 7, 2008Feb. 7, 2008

OUTLINEOUTLINE
MotivationMotivationTheoryTheoryField data testField data testConclusions and the way aheadConclusions and the way ahead

MotivationMotivation
No individual experiment requiredCan get Green’s function between
two randomly selected receivers
Why?Why?
How?How?
Interferometric Transform

OUTLINEOUTLINE
MotivationMotivationTheoryTheoryField data testField data testConclusions and the way aheadConclusions and the way ahead

Random Sources
<N(x)*N(x’)> =δ(x-<N(x)*N(x’)> =δ(x-x’)S(ω)x’)S(ω)
P(B) =P(B) =∫ G(B|x)N(x)d x 22
SSsrcsrc
ImIm[G(A|B)] = k<p(A)*p(B)>[G(A|B)] = k<p(A)*p(B)>
= k= k∫ G(B|x)G(A|x)*d x22
SSsrcsrc
AA BB.. ..
SS00
SSsrcsrc
xx
x’x’zz

Random Scatterers

Workflow
Input data dInput data d Truncate d in time into Truncate d in time into several data panelsseveral data panels
Crosscorrelate each Crosscorrelate each trace with a given trace trace with a given trace
at xat x
Sum and average the Sum and average the crosscorrelation panelscrosscorrelation panels
Output Output

OUTLINEOUTLINE
MotivationMotivationTheoryTheoryField data testField data testConclusion and the way aheadConclusion and the way ahead
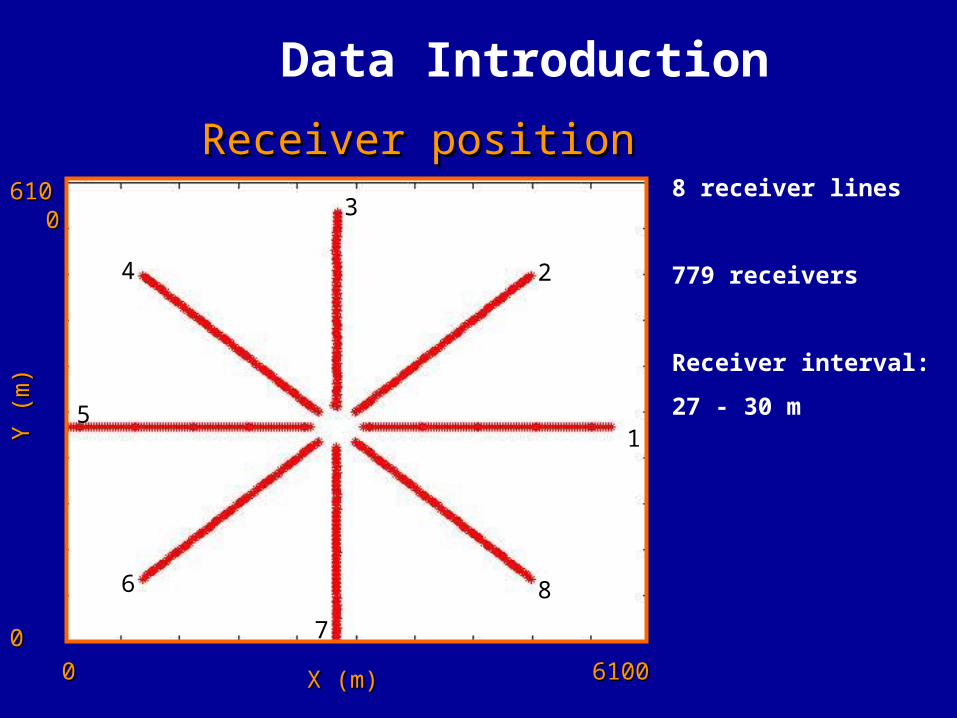
Data Introduction
8 receiver lines
779 receivers
Receiver interval:
27 - 30 m1
2
3
4
5
6
7
8
61061000
0000 61006100X (m)X (m)
Y (
m)
Y (
m)
Receiver positionReceiver position

Am
plit
ude
Time (s)0 960
Trace ExampleTrace Example

Virtual Shot Virtual Shot GatherGather
Receiver line 6
90 receivers
Frequency used to do the interferometry is 1 - 11.5 Hz
Event velocity 1450 m/s
0.0
2.40 250
0
Tim
e (
s)
X (m)

0.0
2.40 250
0
Tim
e (
s)
X (m)
Receiver line 6
90 receivers
Frequency used: 1 – 9 Hz
Event velocity 1450 m/s
Virtual Shot Virtual Shot GatherGather

Virtual Shot Virtual Shot GatherGather
0.0
2.40 250
0
Tim
e (
s)
X (m)
Receiver line 8
95 receivers
Frequency used: 1 - 9 Hz
Event velocity 1455 m/s

0.0
2.40 250
0
Tim
e (
s)
X (m)
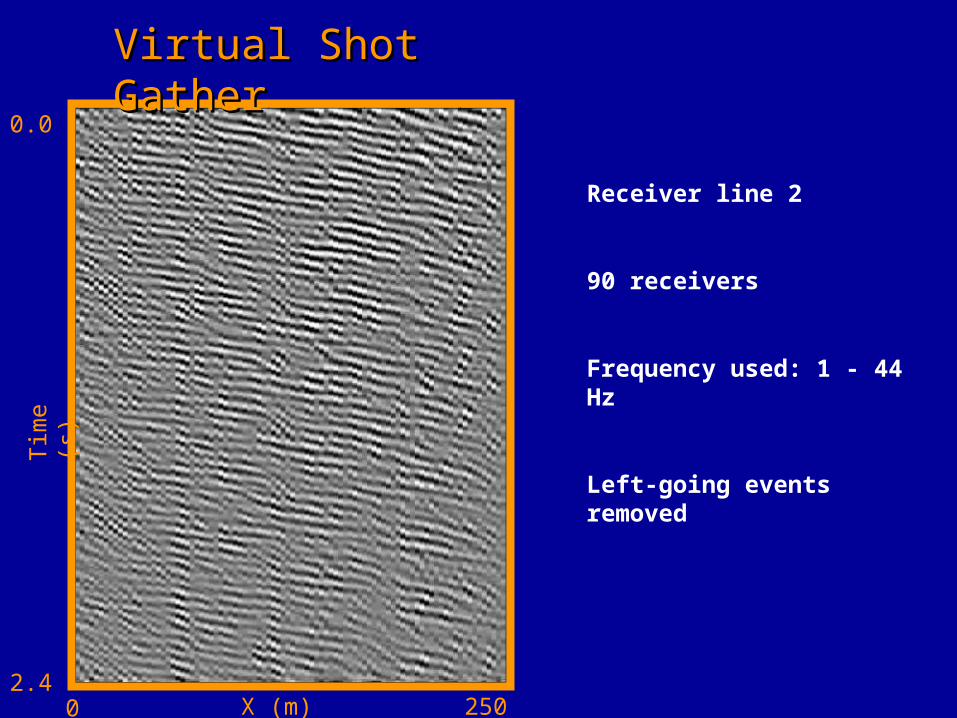
Virtual Shot Virtual Shot GatherGather
Receiver line 2
90 receivers
Frequency used: 1 - 5 Hz
Receiver line 2
90 receivers
Frequency used: 1 - 44 Hz
Left-going events removed
0.0
2.40 250
0
Tim
e (
s)
X (m)
Virtual Shot Virtual Shot GatherGather

OUTLINEOUTLINE
IntroductionIntroductionTheoryTheoryField data testField data testConclusions and the way aheadConclusions and the way ahead

ConclusionsConclusionsField data test gives Field data test gives
continuous eventscontinuous eventsLow frequency results have Low frequency results have a velocity of 1450 m/sa velocity of 1450 m/sHigh frequency (1 - 44 Hz) High frequency (1 - 44 Hz) results look like reflectionsresults look like reflections
We need records with longer We need records with longer time to get better resultstime to get better results

Road AheadRoad Ahead
Test the data with longer time Test the data with longer time recordsrecords
Velocity analysis of the virtual Velocity analysis of the virtual gathersgathers
Migrate the virtual dataMigrate the virtual data

Thanks!Thanks!