interface horizontal shear strength in composite ... - pci horizontal shear strength in composite...
TRANSCRIPT

DANIEL P. JENNY FELLOWSHIP
Interface Horizontal Shear Strength in Composite Decks With Precast Concrete Panels
Nukala V. V. Phani Kumar Graduate Student School of Civil Engineering Purdue University West Lafayette, Indiana
Julio A. Ramirez, Ph.D. Associate Professor School of Civil Engineering Purdue University West Lafayette, Indiana
42
Six stay-in-place precast, prestressed deck panels were tested to evaluate the horizontal shear strength between the precast panel and the cast-in-place portion of the bridge deck. Presently, the Indiana Department of Transportation requires a minimum of 20 shear connectors regardless of panel dimensions. The shear connectors are placed across a broom finished deck panel surface. Broom finish with approximately 0.05 to 0.075 in. (1 .27 to 1.91 mm) total amplitude deformations is specified instead of a raked finish with 0.25 in. (6.35 mm) total amplitude because of the reduced 2.5 in. (63.5 mm) thickness of the panels used in Indiana. In this study, composite behavior at ultimate, including horizontal shear and interface slip characteristics, was evaluated. It is concluded that stay-in-place precast, prestressed deck panels with a broom finished surface do not require horizontal shear connectors if the nominal average horizontal shear stress at the interface is less than 116 psi (0.8 MPa).
0 ne method of bridge construction consists of using precast, prestressed concrete deck
panels as stay-in-place forms in conjunction with a cast-in-place concrete topping, replacing the traditional monolithic roadway deck slabs. The use of precast concrete for new bridge construction and for the rehabilitation of deteriorated bridges is economically and structurally attractive. 1•
2
Durability, ease and speed of construction,3 together with reduced need
for maintenance, are all advantages in using precast concrete.•
Composite construction is an economical way of combining precast and cast-in-place concrete and at the same time retaining the continuity and efficiency of monolithic construction. This method is more economical than the conventional monolithic deck construction due to the considerable field labor savings involved.'·• These panels span the opening between the longitudinal bridge girders and serve as per-
PCI JOURNAL

Table 1. Concrete strengths and prestress losses of various specimens.
28-day concrete strength
Specimen Description of specimen Precast (psi) !-------· ----'-"- -
I Specimen with 18 strands and no shear connectors '""'
7850
2 Specimen wi th 18 strands and four shear connectors '
7850
3 Specimen with 18 strands and four shear connectors ~J 5647
4 Specimen with lubricated interface, 18 strands,
5647 and four shear connectors -
5 Specimen with 12 strands and no shear connectors 6857
6 Specimen with 12 strands and fo ur shear connectors 6857
Note: I in . = 25.4 mm; l psi = 0.00689 MPa.
RC slab with
#5 @ 6in. c/c #5 @ 9 in. de
6.75i{
WWF3x15 D7 xW4 Precast 8.0 ft ~I
Section AA
Fig. 1. Geometrical characteristics of deck slab.
manent forms for the cast-in-place concrete topping that completes the bridge deck.
The assumed performance of a composite element depends on the premise that precast and cast-in-place elements behave as a single unit. This monolithic behavior is possible only if the horizontal shear resulting from bending of the deck is effectively transferred at the interface between the pre-
March-Apri l 1996
cast and cast-in-place elements . Because panels and cast-in-place topping are cast at different times, there is a potential weak plane at the interface.
In general, horizontal shear stresses are transmitted across the interface due to chemical and mechanical bond between the precast panel and cast-inplace concrete acting in conjunction with any horizontal shear connectors provided across the interface. These
Cast-in-place Total prestress (psi) loss (percent)
,.,---
~ 6932 14.8
6932 14.9
5747 12.3
5747 13 -
5657 14.9
5657 15
shear connectors act as a combination of dowel and shear-friction reinforcement once the slip occurs at the interface. Currently, the Indiana Department of Transportation (INDOT) requires a minimum of 20 shear connectors across a broom finished interface of the deck panel. Broom finish is specified instead of raked finish with full-amplitude deformations of 0 .25 in. (6.35 mm) due to the 2.5 in. (63.5 mm) thick panels [thinner than the normal 3.0 in. (76.2 mm)] used in Indiana.
This paper presents the results of an experimental investigation7 to evaluate the horizontal shear strength in broom finished surfaces and examines the need for shear connectors at service and ultimate load levels to obtain adequate composite action . This evaluation includes the performance of this type of bridge deck section under static and repeated loading.
This study addresses the specific concerns raised by INDOT dealing with the number of horizontal shear connectors required in precast deck panels with a broom finished top surface. The issues of potential horizontal slip at the interface, as well as the adequate development of positive moment and shear capacities of the composite bridge section, were examined experimentally.
LITERATURE REVIEW Barker showed that specimens with
and without the shear connectors developed adequate bond to ensure composite action. There was no indication that the shear reinforcement increased the bond performance under normal service load conditions . However ,
43

8.0 ft
=
.. I 18 strands (specimens 1 - 4)
1 .. 2.0 ft .. ~-~
= ~ r·o ft
-- A
------------------------ -:_j - 12 strands _ (specimens 5 and 6)
~
L___=_=_____,\t_ a) Plan 318 in. dia ,
270 lo-lax Strand
Shear connector books
2.5 ini 51 ,....., --+0-+-------t-6-t----, ~ ~~~d 12.!f·
b) Section AA
Note: 1 in. = 25.4 mm
Fig. 2. Typical details of a panel with four stirrups.
Fig. 3. Cross section details of bridge deck.
44
318 in. dia, Lo - Lax (270) ~-t----"'Pr:.:::e:::::stressing Strands
Longitudinal Bridge Girders
there was some indication that the panels with shear reinforcement were tougher under cyclic loading and appeared to be stiffer under higher static loads.
Barnoff et aJ.9 examined the behavior of a full-scale prestressed bridge with precast deck panels. This study concluded that full-composite behavior was observed at both service loads and overloads. Mechanical shear connectors are not required if the panel surface is given a scored finish. In this reference, the amount of roughness of the surface was not mentioned. Cyclic loading was not shown to have any detrimental effect on the performance of panels and the plane section hypothesis seemed to be valid even under loads 3.5 times the design load.
Hanson'" correlated push-off test results with those of girder tests. With this correlation he considered that the maximum horizontal shear strength of the beams tested was reached at slips of about 0.005 in. (0 . 13 mm). He pointed out that larger shear strengths would be recorded if larger slips were permitted . The girder and push-off tests reported a maximum sheari ng stress of 500 psi (3.45 MPa) to ensure composite action in the case of a rough interface e/s in . = 9.53 mm amplitude) and 300 psi (2.07 MPa) for a smooth interface (contact surface trowelled to a relatively smooth condition).
Shear connectors were effective only after the interface slip occurred. Girder tests indicated that when bond is absent at the connection, interface roughness can contribute up to 150 psi ( 1.04 MPa) towards shear strength. In addition to these values, approximately 175 psi (1.2 1 MPa) shear capacity can be added for each percent shear reinforcement crossing the interface . Finally, this study'" concluded that shear reinforcement across the interface was effective only at relative displacements of more than 0.005 in. (0. 13 mm) at the interface.
Paulay et al. ' ' conducted a comprehensive test series on horizontal construction joints in cast-in-place reinforced concrete with inter-layer reinforcement. They concluded that, for design purposes, contribution from the dowel action of the reinforcement should be ignored as significant dowel
PCI JOURNAL

forces can be generated only at excessive slip along a joint.
Seible and Latham '2· '3 concluded
that the horizontal load transfer behavior of overlaid reinforced concrete slabs used frequently in bridge deck rehabilitation depends large ly on the interface surface preparation. They also noted that horizontal shear reinforcement provided across a rough and clean horizontal construction joint interface cannot be effective unless delamination and interface slip occur.
Furthermore, the amount of minimum dowel reinforcement [0.083 percent for !y = 60 ksi (413 MPa)] currently required by AASHT0'4 is not sufficient to control the horizontal slip after the onset of delamination. They also concluded that small topological changes in the interface of about 0.125 in. (3.18 mrn) deep at 1 in . (25.4 mm) spacing suffice to provide monolithic behavior up to critical flexural yield limit states, which make dowels virtually ineffective.
In the state of Indiana, a broom finish [approximately 0.05 to 0.075 in. (1.27 to 1.91 mm)] is given at the interface. The decrease in roughness and the irregular pattern of deformations associated with this finish justify the evaluation of the bond across the interface.
TEST PROGRAM An experimental program involving
six full-scale composite stay-in-place deck slabs was conducted. These specimens had different interface properties including different amounts of horizontal shear reinforcement across the interface. The first four specimens had 18 prestressing strands representing an upper limit for the amount of flexural reinforcement in this type of member. This allowed performance evaluation under the potential maximum horizontal shear demand.
The last two specimens had 12 prestressing strands . These specimens were used to evaluate the effect of repeated loading by causing an increase in mean shear stress at the interface. The shear stress corresponded to the level that needs to be transferred in deck panels designed according to AASHT0 '4 for HS20 loading on an
March-April 1996
-
.]..0 It 4.0 11 2.0 (1
Spreader Beam
-
15.0 It
CIP
S~F~================~
·.·.·.·.·.·.·.·.·.·.·.·.·.·.·.·.·.·.·.·.·.·.·.·.·.·.·.·.:.;,:-·.·. - Precast . . .... .. ..... - ~-~-~· . .... .... ~
panel
12.011
-Supported along
the edges
a) Elevation
Simply supported
along the edge s ,2.0 111 4.0 It
12.011 I .. .... ......
'l& - -------------
L l.J b- l..J >If'• ·~ =t
r --, r --,
--------------, .. 8.011 .. ,
12.0 11 .. , b) Plan
Note: 1 in. = 25.4 rom
Fig. 4. Loading frame details.
8 ft (2.44 m) long simple span. All six composite specimens con
sisted of a 2.5 in. (6 .35 mm) thick precast, prestressed panel with an additional 5.5 in. (13 .97 em) thick castin-place reinforced concrete topping slab. Thus, an 8 in . (203.2 mrn) standard total deck thickness, as commonly used in Indiana, is provided . The details of the various specimens are given in Table I. Fig. 1 shows the geometrical characteristics of the composite specimens. Deck panel plan and elevation details are shown in Fig. 2. Locations of shear connectors are also indicated in Fig. 2.
In this study, four panels had four shear connectors as horizontal shear reinforcement. These four shear connectors represent a minimum practical limit for handling. Two panels , Specimens 1 and 5, had no shear connectors. In Specimen 4 with four shear connectors , bond was broken by applying a coating of form oil in order to assess the contribution of the shear connectors under conditions of bond deterioration.
A typical transverse section of a bridge superstructure is shown in Fig. 3. The precast panels rest on top of longitudinal bridge girders with some
45
Strain Gauge
Precast panel CIP Slab
6.75 in. J=.oin.
3.0 ft 3.0 ft
8.0 ft
Note: 1 in. = 25.4 mrn
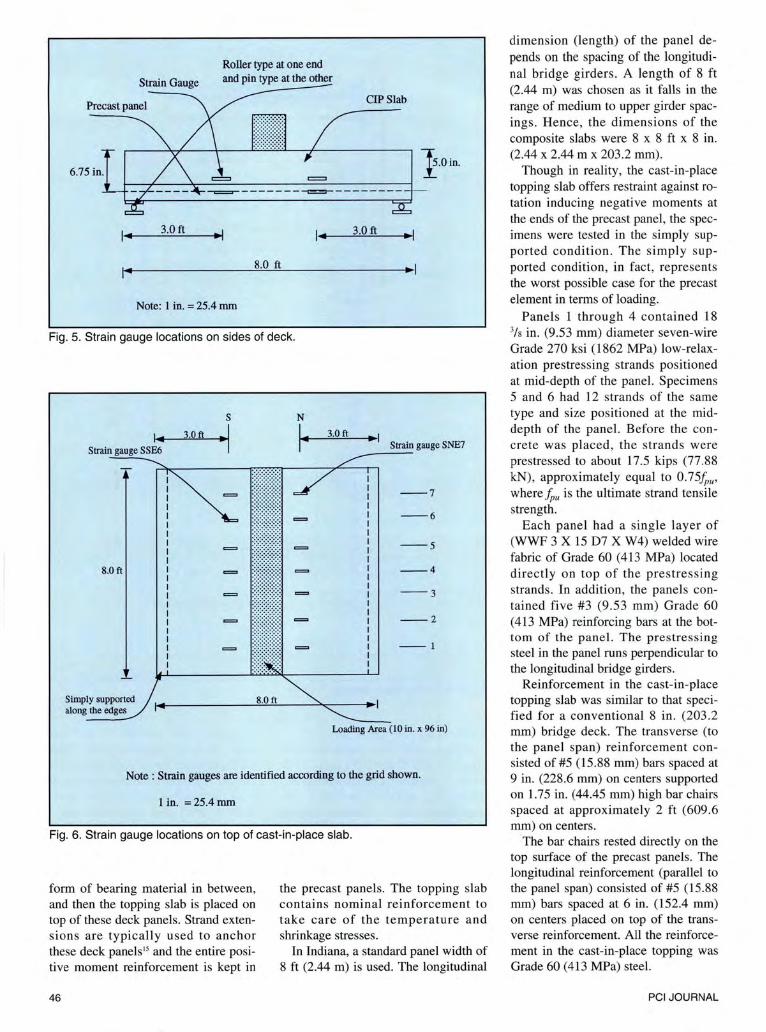
Fig. 5. Strain gauge locations on sides of deck.
Strain gauge SSE6
8.0 ft
Simply supported along the edges
s 3.0ft .. ,
8.0 ft
3.0 ft .,.I Strain gauge SNE7
--7
--6
--5
--4
--3
--2
--1
Loading Area (10 in. x 96 in)
Note : Strain gauges are identified according to the grid shown.
1 in. = 25.4 mrn
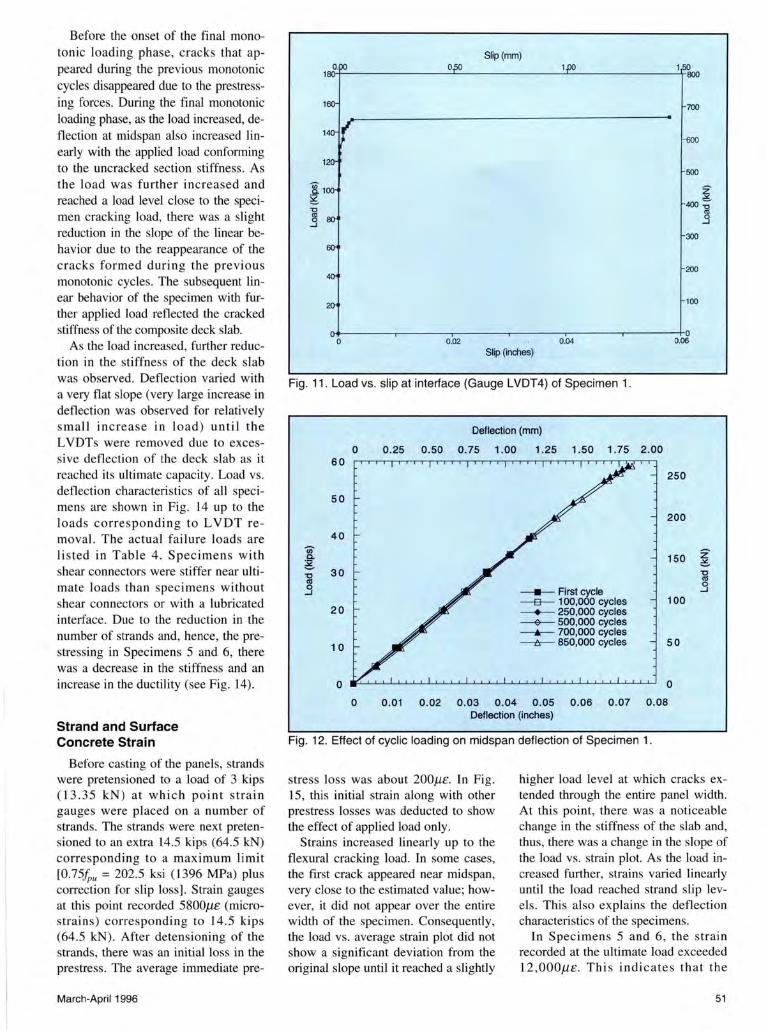
Fig. 6. Strain gauge locations on top of cast-in-place slab.
form of bearing material in between, and then the topping slab is placed on top of these deck panels. Strand extensions are typically used to anchor these deck panels'5 and the entire positive moment reinforcement is kept in
46
the precast panels. The topping slab contains nominal reinforcement to take care of the temperature and shrinkage stresses.
In Indiana, a standard panel width of 8 ft (2.44 m) is used. The longitudinal
dimension (length) of the panel depends on the spacing of the longitudinal bridge girders. A length of 8 ft (2.44 m) was chosen as it falls in the range of medium to upper girder spacings. Hence, the dimensions of the composite slabs were 8 x 8 ft x 8 in. (2.44 x 2.44 m x 203.2 mm).
Though in reality, the cast-in-place topping slab offers restraint against rotation inducing negative moments at the ends of the precast panel, the specimens were tested in the simply supported condition. The simply supported condition, in fact, represents the worst possible case for the precast element in terms of loading.
Panels 1 through 4 contained 18 3/s in. (9.53 mm) diameter seven-wire Grade 270 ksi (1862 MPa) low-relaxation prestressing strands positioned at mid-depth of the panel. Specimens 5 and 6 had 12 strands of the same type and size positioned at the middepth of the panel. Before the concrete was placed, the strands were prestressed to about 17.5 kips (77 .88 kN) , approximately equal to 0.75/pu, where /pu is the ultimate strand tensile strength.
Each panel had a single layer of (WWF 3 X 15 D7 X W4) welded wire fabric of Grade 60 (413 MPa) located directly on top of the prestressing strands. In addition, the panels contained five #3 (9.53 mm) Grade 60 (413 MPa) reinforcing bars at the bottom of the panel. The prestressing steel in the panel runs perpendicular to the longitudinal bridge girders.
Reinforcement in the cast-in-place topping slab was similar to that specified for a conventional 8 in. (203 .2 mm) bridge deck. The transverse (to the panel span) reinforcement consisted of #5 (15.88 mm) bars spaced at 9 in. (228.6 mm) on centers supported on 1.75 in. (44.45 mm) high bar chairs spaced at approximately 2 ft (609.6 mm) on centers.
The bar chairs rested directly on the top surface of the precast panels. The longitudinal reinforcement (parallel to the panel span) consisted of #5 (15.88 mm) bars spaced at 6 in. (152.4 mm) on centers placed on top of the transverse reinforcement. All the reinforcement in the cast-in-place topping was Grade 60 ( 413 MPa) steel.
PCI JOURNAL

Test Setup
The test setup is shown in Fig. 4. The two columns are 12ft (3.66 m) apart and support a cross beam. The cross beam in turn supports two hydraulic actuators. The load is distributed to the specimen by means of a spreader beam, which distributes the load as a uniform load applied over the entire width of the panel. The load was distributed over an area of 10 x 96 in. ( 254 mm x 2.44 m).
As the vehicle moves on a bridge deck, it exerts pressure on the composite section of the bridge deck. Abendroth et al.' 6 concluded that punching shear usually governs the ultimate strength of the slab in a monotonic loading situation when the load is distributed over the wheel footprint. In these cases, the full flexural capacity of the panels is usually not achieved due to the short span lengths and concentrated load area and, thus, the panels are not loaded to have maximum uniform horizontal shear stress at the interface across the width of the panel. Thus, the loading area was extended over the entire width of the panel. In this study, the composite behavior is examined in terms of flexural and oneway beam shear capacities.
Instrumentation
Instrumentation was placed to monitor strains and deflections at various locations. To obtain the vertical deflections of the panel, three linear variable differential transducers (LVDTs) were placed on the sides of the panel at distances of 2.5, 4, and 5.5 ft (0.76, 1.22, and 1.68 m) from either of the supported edges.
Strain gauges were used to measure strains on the sides of the specimen (EA-06-20CBW-120) (see Fig. 5) and also to measure strains in the prestressing strands (EA-06-062DN-350). Strain gauges (EA-06-20CBW-120) were also placed on top of the cast-inplace slab, as shown in Fig. 6. On the prestressing strands , gauges were placed at the mid-section of the deck panel, as shown in Figs. 7 and 8.
Strain gauges were also placed on the reinforcing bars, located in the cast-in-place topping slab, at a distance of 3 ft (914.4 mm) from both
March-April 1996
Dial gauge S 17 Strain Gauge E17 B C D
I I I
South North
Note : A and E are 6 in. away from edges B and D are 3.5 ft. away from edges C is 4.0 ft away from edges
1 in. = 25.4 mm
Fig. 7. Strain gauge and dial gauge locations on prestressing strands of Specimens 1 and 2.
supports. These strain gauges were in line with the gauges placed on the sides of panels and also on top of the deck slab. Interface strain gauges were placed at the mid-section of the top surface of precast panel. The interface gauges were placed to estimate the immediate loss in prestress after detensioning as well as subsequent losses up to the casting of the topping slab.
To determine the amount of strand slip, dial gauges were placed on selected strand extensions, as shown in Figs. 7 and 8. To determine the slip between the cast-in-place concrete slab and the prestressed panel, L VDTs were used as slip gauges. Slip between the cast-in-place slab and the prestressed panel is usually associated with diminishing composite behavior between the cast-in-place slab and the precast panel.
Along with horizontal slip, vertical separation also occurs between the cast-in -place slab and the precast panel as the deck loses composite action. This separation usually does not occur at the supports and the loading
point due to the compressive stress flow . Hence, the separation and thereby slip would only take place in between the points which are d effective depth of the slab, away from the loading point and the support reactions. To measure this slip, slip gauges were placed, as shown in Fig. 9.
In the case of panels with shear connectors, strain gauges were placed on the shear connectors as well in order to determine their contribution when slip occurs between the cast-in-place concrete and the precast panel. These shear connectors act as a combination of dowel and shear-friction reinforcement once the slip or separation occurs at the interface.
Test Procedure
All loads were applied by hydraulic actuators . Static load tests were performed at regular intervals between repeated loading applications. The repeated loading consisted of two phases. The load range for the first phase of repeated loading in the four
47

Dial gauge Sl7 c I
18
----------~----------- 17 ----------------------- ~ ------------------------15 ----------~----------- 14
----------~----------- 13
12 11
----------~----------- 10
----------~-----------North
----------~----------- 6
---------~-----------4
----------~----------- . 2
a) Details of Specimens 3 and 4
Dial gauge S 11 C7
12
North ----------~-----------
----------~------------ 5 ----------------- - ----- . 4
----------~----------
----------~----------
b) Details of Specimens 5 and 6
Fig . 8. Strain gauge and dial gauge locations on the prestressing strands.
Table 2. Estimated capacities of specimens based on AASHTO Specifications.
I Horizontal
Cracking Strand slip Flexural shear Beam shear load capacity* capacityt capacity capacity
Specimen (kips) (kips) . (~p•J + ~·> - (kips)
- - - -
I to4 j
60 99 158 98 158 - - - ---
5 and 6 40 62 128 98 158
Note : I kip = 4.46 kN . * Strand slip capacity based on the development length criteri on of AASHTO. t Flexura l capac ity including the contri buti on from the cast-in-place reinforcing bars and the wire mesh.
panels with 18 strands was from 26.4 to 38.2 kips (117 .5 to 170 kN).
The 26.4 kips (117.5 kN) load corresponds to an equi valent load producing the same positive midspan mo-
48
ment as that of HS20 wheel load with an impact factor of 30 percent, that is:
M = [(S + 2)/32](PHs20)(width)
= PeqL/ 4
where L = S = 7.5 ft (2.3 m). The 38.2 kips (170 kN) load corre
sponds to a tensile stress of 6fj! at the bottom fiber of the precast panel. The above loading range was chosen to allow for possible overloading of the deck in the early stages of its life.
At the end of the first stage, the specimen was monotonically loaded until first flexural cracking was observed. In the second stage of repeated loading , the specimen was cycled from 2.4 kips (10.7 kN) (corresponding to all superimposed dead loads) to 28.8 kips ( 128.2 kN) (corresponding to a tensile stress of 3fj! at the bottom fiber of the precast panel) keeping the load range equa l to 26.4 kips (117 .5 kN). This load range is equal to an equivalent HS20 wheel load with an impact factor of 1.3.
Intermediate static loadings were performed at regular intervals in both the uncracked and cracked stages of the specimen. In Specimens 1 through 4, Stage I of repeated loading was applied for the first 600,000 cycles and Stage 2 continued thereafter until one million cycles. After one million cycles, all specimens were tested monotonically to failure .
Specimens 5 and 6 were first loaded monotonically to their cracking load prior to the beginning of the cyclic loading. Repeated loading was applied thereafter up to one million cycles using the same loading as in Stage 2 of the first four specimens. This loading sequence was selected to observe the effect of cyclic loading on a cracked panel , which would occur due to overloading of the bridge deck during the early stages of its ljfe. The upper cyclic load level corresponded to a stress limit of 7.5 fj! at the bottom fiber of the precast panel. This addresses the effect of lower prestressing and, hence, higher stress level at the interface on the fatigue life of specimens.
TEST RESULTS AND ANALYSIS
The major experimental results are presented and discussed in this section. Only typical diagrams are shown in order to illustrate the behavior of the specimens. A complete summary of all test resu lts is given in Ref. 7.
PCJ JOURNAL

Strand Slip Results
The determination of anchorage lengths necessary to reach full development of strands was not the objective of this study. But a qualitative evaluation of the strand development lengths was carried out by monitoring the ends of selected strands for their slip relative to the panel ends. This slippage occurs when the actual bond stresses between the strand and the surrounding concrete exceed the bond strength along some portion of the strand anchorage length. Strand slip load was determined by a slip of 0.01 in. (0.254 mm) in the monitored strands.
Estimated capacities of specimens based on AASHTO Specifications are given in Table. 2. The cracking load is calculated using the average modulus of rupture of the concrete. Because the available anchorage length of the strands was less than the required development length based on the AASHTO Specifications for a 3/s in. (9.53 mm) strand, the available maximum stress in the strand was calculated based on the avai lable anchorage length according to AASHTO Specifications. Ultimate flexural capacity of the panel included the contributions from the cast-in-place reinforcing bars , '7 wire mesh placed in precast panel, and using the ultimate tensile strength of strands. Horizontal shear capacity was assumed to be 80bvd even though four shear connectors were provided across the interface in some of the specimens.
Similarly, beam shear capacity was
Precast Panel
CIP Slab
, .. 1.5 ft .. , , .. 1.5 ft .. ,
a) Slip gauge locations on the sides of the Deck
CIP Slab
Metal Bracket with a hole to hold L VDT
b) Slip gauge
Fig. 9. Slip gauge details.
Table 3. Load capacities of various specimens.
Test values
Cracking load
(kips) Specimen (a)
60 j_____
2 65
3 75 -- 1 4 65
5 r-----;;.5 ~ T
6 50
ote: I kip = 4.46 kN. * Taking strand slip load as ultimate load. t Taking failure mode capacity.
March-April 1996
Strand slip load
(kips) (b)
11 5
110
155
140
95
100
r-~-.-
Failure load Cracking
~St'~' ratio
1.00
170 1.08 --+--
200 1.25
180 1.08
130 t- 1.18
140 1.25
Test/Predicted values
Strand slip load ratio
Failure load
ratio*
-r Test loads ratio I
Failure load (c) (c)
1.01 1.39 1.1 6
1.11
1.56
ratiot t (b_)---t_ (a)
+----+--1.07 1.54
1.26
Type of fai lu re mode
Shear
Shear
Shear +----+---
1.4 1 1. 82 1.14 Shear
1.53 I 2.1 0 1.0 I 1. 37 2.74 Flexure
1.6 1 2.26 1.09 ~40----+--2.-80-r---Fi ex ure
49

Table 4. Actual ultimate capacities vs. service load and factored load.
Test values
Strand I (a) (b) (c)
Cracking slip Failure divided by
load load load equivalent (kips) (kips) (kips) service load
Specimen (a) (b) (c) (26.4 kips) -
I
-- ---,-----I 60 115 160 1 2.27 4.36 6.06
t--2 65 I 11 0 170
I 2.46 4. 17 6.44
-- --
3 75 155
I 200
I 2.84 5.87 7.57
1- -I
---2.46 -r -
4 65 140 180 5.30 6.82 1- --
I I - - -
5 47.5 95 130 1.80 3.60 4.92 - f--- ;
6 50 100 140 1.89 3.79 5.30
Note: I kip= 4.46 kN.
Slip (mm)
_.---------------------------------------}700
600
500
300
200
100
0 0.1 0.2 0.3 0.4 0.5 0.6 0.7 0.8 0.9
Slip (inches)
Fig. 10. Load vs. strand slip at #813 of Specimen 1.
calculated based on a nominal shear stress of 2fj; over the cross section. In all the specimens, the dead load effects were subtracted from the predicted capacities to represent the amount of live load that can be taken by the specimen prior to failure. Observed load capacity of all the specimens and the respective ratio of test to predicted values based on AASHT0' 4
and ACI' 8 are listed in Table 3. A comparison of test capacities of all specimens with estimated service and factored loads is given in Table 4.
After one mmion cycles of repeated loading, the strands did not slip by a significant amount in any of the specimens tested. After the repeated load-
50
ing phase, the panels were subjected to monotonic loading. Strand slip readings were also monitored during the final monotonic loading phase. Slips did not occur at the flexural cracking load or at the factored loads. The slippage that occurred in various strands had different characteristics. In some cases, there was a gradual slip at loads below the failure load (see Fig. 10), whereas in other cases slip occurred suddenly at the failure load. From dial and strain gauge readings, the side on which failure occurred is easily detected. There was a considerable amount of strength remaining in the slab beyond the first strand slip (see Table 3).
(a) (b) (c)
divided by equivalent
factored load (57.3 kips)
'"Ff_ ~ -:1' -
1.1 3 1.92 2.97
1.31 2.70 I 3.49
1.1 3 2.44 3.14 ~- -----
0.83 1.66
0.87 ---r 1.75
Composite Behavior of Deck Slabs
2.27
I 2.44
For composite action, transfer of horizontal shear stress across the interface without significant interface slip must take place. Hence, the interface slip is a good indicator of the composite deck behavior under the applied loading.
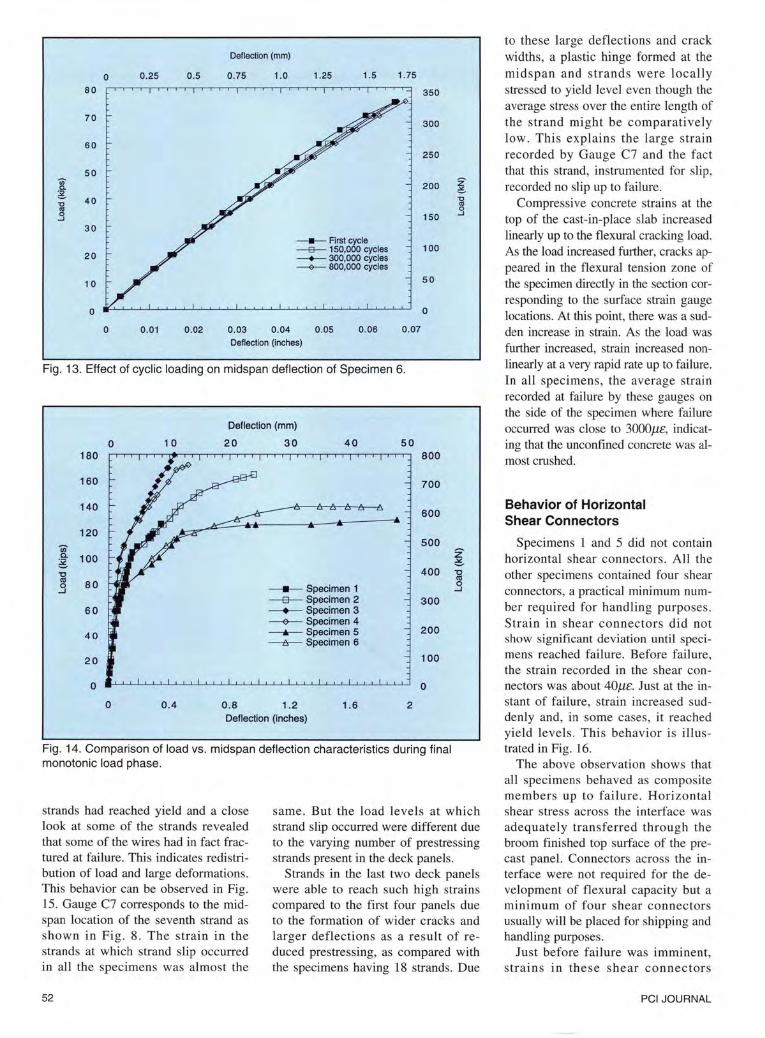
Interface slip was not observed until the loads approached failure levels in the first four specimens. In Specimens 5 and 6, significant interface slip was not observed even at failure levels. In the first four specimens, at the ultimate loads, interface slip occurred in the critical region mentioned earlier. This typical behavior is illustrated in Fig. 11 for Specimen 1.
Deflection Characteristics
During the cyclic loading phase, intermediate static tests were performed at regular intervals. The behavior during these intermediate static tests was used to judge the effect of repeated loading on the panel performance. A typical load-deflection behavior during the intermediate tests for Specimen 1 is shown in Fig. 12. Clearly, cyclic loading had a negligible effect on the stiffness of Specimen 1 in the first one million cycles. The attempt to make cyclic loading more critical by decreasing the number of strands in Specimens 5 and 6 also did not have any appreciable effect on the loaddeflection behavior of the specimen during the cyclic loading phase (see Fig. 13). This conclusion is in agreement with Buckner et al.' 9
PCJ JOURNAL
Before the onset of the final monotonic loading phase, cracks that appeared during the previous monotonic cycles disappeared due to the prestressing forces. During the final monotonic loading phase, as the load increased, deflection at midspan also increased linearly with the applied load conforming to the uncracked section stiffness. As the load was further increased and reached a load level close to the specimen cracking load, there was a slight reduction in the slope of the linear behavior due to the reappearance of the cracks formed during the previous monotonic cycles. The subsequent linear behavior of the specimen with further applied load reflected the cracked stiffness of the composite deck slab.
As the load increased, further reduction in the stiffness of the deck slab was observed. Deflection varied with a very flat slope (very large increase in deflection was observed for relatively small increase in load) until the L VDTs were removed due to excessive deflection of the deck slab as it reached its ultimate capacity. Load vs. deflection characteristics of all specimens are shown in Fig. 14 up to the loads corresponding to L VDT removal. The actual failure loads are listed in Table 4 . Specimens with shear connectors were stiffer near ultimate loads than specimens without shear connectors or with a lubricated interface. Due to the reduction in the number of strands and, hence, the prestressing in Specimens 5 and 6, there was a decrease in the stiffness and an increase in the ductility (see Fig. 14).
Strand and Surface Concrete Strain
Before casting of the panels, strands were pretensioned to a load of 3 kips (13 .35 kN) at which point strain gauges were placed on a number of strands. The strands were next pretensioned to an extra 14.5 kips (64.5 kN) corresponding to a maximum limit [0.75.[p" = 202.5 ksi (1396 MPa) plus correction for slip loss]. Strain gauges at this point recorded 5800jl£ (microstrains) corresponding to 14.5 kips (64.5 kN) . After detensioning of the strands, there was an initial loss in the prestress. The average immediate pre-
March-April 1996
Fig. 11 . Load vs. slip at interface (Gauge LVDT4) of Specimen 1.
Deflection (mm)
0 0 .25 0.50 0.75 1.00 1.25 1.50 1.75 2 .00 60
250
50
200
40 Ui" z c. 150 g c. "0 30 "0
"' "' 0 0 ---- First c~cle ...J ...J
--a-- 100,0 0 cycles 100 20 --+-- 250,000 cycles
~ 500,000 cycles ___._.... 700,000 cycles
10 -----e.- 850,000 cycles 50
0 0
0 0.01 0 .02 0 .03 0.04 0.05 0.06 0 .07 0.08 Deflection (inches)
Fig. 12. Effect of cyclic loading on midspan deflection of Specimen 1.
stress loss was about 200f..l£. In Fig. 15 , this initial strain along with other prestress losses was deducted to show the effect of applied load only.
Strains increased linearly up to the flexural cracking load. In some cases, the first crack appeared near midspan, very close to the estimated value; however, it did not appear over the entire width of the specimen . Consequently, the load vs. average strain plot did not show a significant deviation from the original slope until it reached a slightly
higher load level at which cracks extended through the entire panel width. At this point, there was a noticeable change in the stiffness of the slab and, thus, there was a change in the slope of the load vs. strain plot. As the load increased further, strains varied linearly until the load reached strand slip levels . This al so explai ns the deflection characteristics of the specimens.
In Specimens 5 and 6, the strain recorded at the ultimate load exceeded 12,000f..l £. This indicates that the
51
Deflection (mm)
0 0.25 0 .5 0.75 1.0 1.25 1.5 1.75
80 350
7 0 300
6 0 250
50 2 00
4 0
150 30
100 2 0
- First cycle --a-- 150,000 cycles -+-- 300,000 cycles ~ 800,000 cycles
1 0 50
0 0
0 0.01 0.02 0.03 0.04 0 .05 0.06 0.07 Deflection (inches)
Fig. 13. Effect of cyclic loading on midspan deflection of Specimen 6.
Deflection (mm)
0 1 0 20 180
160
140
120
Ul ;§: 100
80
60
40
20
0
0 0.4 0.8
30 40
--.-- Specimen 1 -e-- Specimen 2 -+---- Specimen 3 --+-- Specimen 4 ___.....__ Specimen 5 -tr- Specimen 6
1.2 1. 6
50
2
800
700
600
500
400
300
200
100
0
Deflection (inches)
Fig. 14. Comparison of load vs. midspan deflection characte ristics during fi nal monotonic load phase.
strands had reached yield and a close look at some of the strands revealed that some of the wires had in fact fractured at failure. This indicates redistribution of load and large deformations. This behavior can be observed in Fig. 15. Gauge C7 corresponds to the midspan location of the seventh strand as shown in Fig. 8. The strain in the strands at which strand slip occurred in all the specimens was almost the
52
same. But the load levels at which strand slip occurred were different due to the varying number of prestressing strands present in the deck panels.
Strands in the last two deck panels were able to reach such high strains compared to the first four panels due to the formation of wider cracks and larger deflections as a result of reduced prestressing, as compared with the specimens having 18 strands. Due
to these large deflections and crack widths, a plastic hinge formed at the midspan and strands were locally stressed to yield level even though the average stress over the entire length of the strand might be comparatively low. This explains the large strain recorded by Gauge C7 and the fact that this strand, instrumented for slip, recorded no slip up to failure .
Compressive concrete strains at the top of the cast-in-place slab increased linearly up to the flexural cracking load. As the load increased further, cracks appeared in the flexural tension zone of the specimen directly in the section corresponding to the surface strain gauge locations. At this point, there was a sudden increase in strain. As the load was further increased, strain increased nonlinearly at a very rapid rate up to failure. In all specimens, the average strain recorded at failure by these gauges on the side of the specimen where failure occurred was close to 3000)1E, indicating that the unconfmed concrete was almost crushed.
Behavior of Horizontal Shear Connectors
Specimens 1 and 5 did not contain horizontal shear connectors. All the other specimens contained four shear connectors, a practical minimum number required for handling purposes. Strain in shear connectors did not show significant deviation until specimens reached failure . Before failure , the strain recorded in the shear connectors was about 40,uc. Just at the instant of failure , strain increased suddenly and, in some cases, it reached yield levels. This behavior is illustrated in Fig. 16.
The above observation shows that all specimens behaved as composite members up to failure. Horizontal shear stress across the interface was adequately transferred through the broom finished top surface of the precast panel. Connectors across the interface were not required for the development of flexural capacity but a minimum of four shear connectors usually will be placed for shipping and handling purposes.
Just before failure was imminent, strains in these shear connectors
PCI JOURNAL

reached their yield capacity in the specimens with 18 strands. These specimens failed in beam shear, as can be seen in Fig. 17. In Specimens 5 and 6 with 12 strands, there was not a significant change in the strain from its initial value. Specimens 5 and 6 failed in flexure without significant diagonal cracking.
This suggests that specimens designed with flexure as the controlling capacity using a broom finished type surface and the current 80 psi (0.55 MPa) 14 maximum horizonta l shear stress will not require horizontal shear reinforcement across the interface.
CONCLUSIONS The primary objective of this study
was to evaluate the performance of thin precast, prestressed concrete panels with a broom finish surface and to determine if horizontal shear-friction reinforcement is needed to ensure adequate composite behavior between the panel and the cast-in-place portion of the bridge deck.
The following conclusions can be stated based on the observations from this study:
1. Slippage of prestressing strands was recorded during the final monotonic cycle to failure. However, an excessive c~pacity of at least 29 percent at failure above that of the strand slip loads observed and at least 11 percent at strand slip loads above the strand slip loads predicted by current AASHTO procedures were observed in al l the specimens.
2. All the specimens showed composite behavior up to failure. Interface slip was observed neither at the equivalent service load of 26.4 kips (117.5 kN) nor at the equivalent factored wheel load of 57.3 kips (255 kN). Interface slip in the first four specimens with 18 strands occurred only at failure loads at least 54 percent above the predicted AASHTO capacity controlled by development length. No interface slips were recorded in Specimens 5 and 6 with 12 strands.
3. Specimens with shear connectors were stiffer near ultimate loads than those without shear connectors (Specimens 1 and 5) but having the same number of strands. Specimens 3 and 4
March-April 1996
100~----------------------------------------------, 000
700
600
500
~ 400..,
"' 0 __J
300
200
100
01+-------~------~------.-------.--------.-------r 0 0 2000 4000 6000
Micro strain 10000 12000
Fig. 15. Load vs. strain in strand at #C7 of Specimen 6.
~5;,---------~-----------------------------------r 1000
- 900 ?
175 800
700 150-
600 z 6
500 "0
.3 400
75 300
50-200
25 100
0 500 1000 1500 2000
0+-------~~-------r--------~------~~------~ -500 0
Micro strain
Fig. 16. Load vs. strain in horizontal shear connector (STIR #2) of Specimen 3.
were stiffer than Specimens 1 and 2 due to less prestress loss. Specimens 1 to 4 failed in beam shear whereas Specimens 5 and 6 failed in a ductile flexural mode.
4. Shear connectors were not strained prior to ultimate load. At failure loads in excess of predicted flexural capacity, interface slip occurred suddenly and an increase in strain of shear connectors was observed in
these specimens. No increases in shear connector strains were recorded in Specimens 5 and 6 with 12 strands. This indicates that horizontal shear connectors across the interface are not required but a minimum of four shear connectors can be placed for shipping and handling purposes.
5. The lowest load at which interface slip was recorded in these specimens was 150 kips (668 kN), as seen
53

~f{"( · .,.,~-. ~
~ ll\ ... " ... "'.
Fig. 17. Failure mode of Specimen 3.
in Fig. 11. Based on this minimum load , an upper limit for the average horizontal shear stress of 116 psi (0.8 MPa) is recommended in deck panels with a broom finished surface and
54
without horizontal shear connectors. 6. The first one million cycles of
cyclic loading did not have any appreciable effect on the stiffness of the deck slabs.
RECOMMENDATION
Based on the test results, stay-inplace precast, prestressed deck panels with a broom finished surface do not require horizontal shear connectors if the nominal average horizontal shear stress at the interface is less than 116 psi (0.8 MPa).
ACKNOWLEDGMENT
This research was conducted with the support of the Indiana Department of Transportation , the Federal Highway Administration , the Precast/Prestressed Concrete Institute through a Daniel P. Jenny Fellowship, and the Hydro Conduit Corporation , Lafayette, Indiana. Any opinions, findings, or conclusions expressed in this paper are those of the authors and do not necessarily represent the views of the sponsors.
PCI JOURNAL

I. Biswas, M., "Precast Bridge Deck Design Systems," PCI JOURNAL, V. 31, No. 2, March-April I 986, pp. 40-94.
2. PCI Committee on Bridges , "Precast Prestressed Concrete Bridge Deck Panels," PCI JOURNAL, V. 32, No. 2, March-April 1987, pp. 27-45.
3. Biswas, M., Iffland, J. S. B., Schofield, R. E., and Gregory , Anthony E ., "Bridge Replacements With Precast Concrete Panels," TRB Special Report 148, Innovations in Construction and Maintenance of Transportation Facilities, Transportation Research Board, Wahington, D.C., 1974, pp. 136-148.
4. Gustaferro, Armand, Hillier, M. A., and Janney, J. R., "Performance of Prestressed Concrete on the Illinois Tollway After 25 Years of Service," PCI JOURNAL, V. 28, No . 1, JanuaryFebruary 1983, pp. 51-67.
5. PCI Bridge Producers Committee, "Recommended Practice for Precast Concrete Composite Bridge Deck Panels," PCI JOURNAL, V. 33, No. 2, March-April 1988, pp. 67-109.
6. Kluge, R. W. , and Sawyer, H. A., "Interacting Pretensioned Concrete Form Panels for Bridge Decks," PCI JOURNAL, V. 20, No. 3, May-June 1975, pp. 35-67.
7. Phani Kumar, N. V. V., "A Study on Horizontal Shear Strength Characteristics of Stay-in-Place Precast Prestressed Deck Panels," Master's Thesis, School of Civil Engineering, Purdue Univer-
March-April 1996
REFERENCES sity, West Lafayette, IN, May 1994.
8. Barker, J. M., "Research, Application and Experience With Precast Prestressed Bridge Deck Panels ," PCI JOURNAL, V. 20, No.6, NovemberDecember 1975, pp. 66-85.
9. Sarnoff, R . M., Orndorff, J. A., Jr., Harbaugh, R. B., Jr., and Rainey, D. E., "Full Scale Test of a Prestressed Bridge With Precast Deck Planks," PCI JOURNAL, V. 22, No. 5, SeptemberOctober 1977, pp. 67-83.
I 0. Hanson, N. W ., "Precast Prestressed Concrete Bridges, 2 - Horizontal Shear Connections," PCA Research and Development Laboratories, Portland Cement Association, Skokie, IL, May 1960, pp. 38-58.
11. Paulay, T ., Park, R., and Phillips, M. H., "Horizontal Construction Joints in Cast-in-Place Reinforced Concrete," ACI Special Publication SP-42: Shear in Reinforced Concrete, V. 2, American Concrete Institute, Detroit, MI, pp. 599-611.
12. Seible, F., and Latham, C. T., "Horizontal Load Transfer in Structural Concrete Bridge Deck Overlays," Journal of Structural Engineering, ASCE, V. 116, No. 10, October 1990, pp. 2691-2710.
13. Seible, F., and Latham, C. T., "Analysis and Design Models for Structural Concrete Bridge Deck Overlays," Journal of Structural Engineering, ASCE, V. 116, No. 10, October 1990,
pp. 27 I I -2728.
14. AASHTO, Standard Specifications for Highway Bridges, 13th Edition, American Association of State Highway and Transportation Officials, Washington, D.C., 1983, and Interim Specifications Bridges (Second Supplement), 1992.
15. Klingner, R. E., and Bieschke, L. A., "Effects of Transverse Panel Strand Extensions on the Behavior of Precast Prestressed Panel Bridges," PCI JOURNAL, V. 33, No. I, JanuaryFebruary 1988, pp. 69-88.
16. Abendroth, R. E., Pratanata, H. , and Singh, B. A., "Composite Precast Prestressed Concrete Bridge Slabs," Iowa Department of Transportation Research Report HR-31 0, College of Engineering, Iowa State University, August 1991.
17. Krefeld, W. J., and Thurston, C. W., "Contribution of Longitudinal Steel to Shear Resistance of Reinforced Concrete Beams," ACI Journal, V. 63, No. 3, March 1966, pp. 325-343.
18. ACI Committee 318, "Building Code Requirements for Reinforced Concrete (ACI 318-89) (Revised 1992)," American Concrete Institute, Detroit, Ml, 1992.
19. Buckner, C. D., and Turner, H. T., "Performance of Full-Span PanelForm Bridges Under Repetitive Loading," Transportation Research Record 903, Transportation Research Board, National Research Council, Washington. D.C., 1983, pp. 45- 52.
55