intercontinental multi-domain monitoring for lhc with perfsonar
TRANSCRIPT

Journal of Physics Conference Series
OPEN ACCESS
Intercontinental Multi-Domain Monitoring for LHCwith perfSONARTo cite this article D Vicinanza 2012 J Phys Conf Ser 396 042060
View the article online for updates and enhancements
You may also likeEffect of vacancy disorder in phase-change materialsYoung-Sun Song and Seung-Hoon Jhi
-
Acceleration of wound healing with use ofsecretory leukocyte protease inhibitorcould be seen by osteopontin expressionin Rattus norvegicus post tooth extractionD Fitriani M Cahyati N Prasetyaningrumet al
-
Cell migration of preosteoblast cells on aclinical gelatin sponge for 3D bone tissueengineeringChi-Yun Wang Zong-Keng Kuo Ming-KaiHsieh et al
-
Recent citationsScientific Data Lake for High LuminosityLHC project and other data-intensiveparticle and astro-particle physicsexperimentsA Alekseev et al
-
This content was downloaded from IP address 12513523081 on 17012022 at 0545
Intercontinental Multi-Domain Monitoring for LHC with
perfSONAR
D Vicinanza1
Product Manager
DANTE City House 126-130 Hills Road Cambridge CB2 1PQ UK
E-mail domenicovicinanzadantenet
Abstract The Large Hadron Collider (LHC) is currently running at CERN in Geneva
Switzerland Physicists are using LHC to recreate the conditions just after the Big Bang by
colliding two beams of particles and heavy ions head-on at very high energy The project is
generating more than 15 TB of raw data per year plus 10 TB of event summary data This
data is sent out from CERN to eleven Tier 1 research centres in Europe Asia and North
America using a multi-gigabits Optical Private Network (OPN) the LHCOPN Tier 1 sites are
then connected to 100+ academic and research institutions in the world (the Tier 2s) through a
Multipoint to Multipoint network the LHC Open Network Environment (LHCONE) Network
monitoring on such complex network architecture to ensure robust and reliable operation is of
crucial importance The chosen approach for monitoring the OPN and ONE is based on the
perfSONAR framework which is designed for multi-domain monitoring environments
perfSONAR (wwwperfsonarnet) is an infrastructure for performance monitoring data
exchange between networks making it easier to solve performance problems occurring
between network measurement points interconnected through several network domains
1 Introduction
CERN (European Organization for Nuclear Research) operates the Large Hadron Collider (LHC) in
Geneva Switzerland LHC is a particle accelerator used by physicists to study the smallest known
particles ndash the fundamental building blocks of matter Physicists will use the LHC to recreate the
conditions just after the Big Bang by colliding two beams of subatomic particles head-on at very high
energy Teams of physicists from around the world will analyse the particles created in the collisions
using sophisticated detectors in 4 major experiments These experiments will generate large amounts
of data which will be sent to data processing and storage centres around the world More than 15
petabytes of data (equivalent to over 17 million dual-layer DVDs) is expected to be generated on a
yearly basis [1]
Given the requirements in terms of amount of data generated to support this experimental challenge
firstly an Optical Private Network (OPN) and then an Open Network Environment (ONE) were
designed for LHC by a collaboration of organisations including CERN the network providers and the
research community [2]
The OPN network is structured on different levels known as Tiers Each Tier is responsible for
generating andor processing data and returning the results to the upper Tier eventually arriving at
1 To whom any correspondence should be addressed
International Conference on Computing in High Energy and Nuclear Physics 2012 (CHEP2012) IOP PublishingJournal of Physics Conference Series 396 (2012) 042060 doi1010881742-65963964042060
Published under licence by IOP Publishing Ltd 1
CERN (Tier 0) The Tier 0 at CERN and other 11 Tier 1 centres spread around Europe North
America and Asia are connected by the OPN [2] Subsequent Tiers mainly composed of universities
andor research centres are active part of the data processing andor result analysis of the experiments
and they are in the process of being connected through the ONE [3] a L3VPN-based multipoint to
multipoint network architecture
The reliability of the different layers of this complex network structure is of a crucial important for the
robustness and reliability of the operations In particular the monitoring requirements were
Scalability
Interoperability at international level
Easy to deploy and manage
Easy to use for network engineers
The solution chosen is based on perfSONAR for both LHCOPN and LHCONE perfSONAR [3]
(Performance focused Service Oriented Network monitoring ARchitecture) is a monitoring framework
designed for multi-domain monitoring environments Its development is based on an international
collaboration for network monitoring and its contributors are GEacuteANT Internet2 ESnet and RNP
There are currently two main implementations committed to interoperate
perfSONAR MDM within GEacuteANT httpperfsonargeantnet
perfSONAR PS within I2ESnet httppspsperfsonarnet
They both use an open OGF protocol to exchange data they are web-service based and they share the
same design goals
Flexibility
Extensibility
Openness
Decentralization
Their differences are mainly in the software development process product life cycles interaction with
the users implementation and deployment models
2 Dedicated networks for the Large Hadron Collider
The Large Hadron Collider (LHC) data distribution model is based on the same multi-tiered structure
with a main data source called Tier 0 (T0) some first-level processing and storage sites called Tier 1
(T1) and many second-level analysing sites (mainly universities and smaller research centres) called
Tier 2 (T2) Each site is expected to handle and store about one Petabyte of raw data per month There
are 120+ T2 sites mainly involved in physics analysis [7] There is a continuous exchange of high
volumes of data between various T0 and T1 between T1 and T2 and among T2
Figure 2 LHCOPN aggregated traffic (source cernch)
International Conference on Computing in High Energy and Nuclear Physics 2012 (CHEP2012) IOP PublishingJournal of Physics Conference Series 396 (2012) 042060 doi1010881742-65963964042060
2
Since the wide area data rates into and out of the T1 sites is of the order of many Gigabits per second
(Gbps) [2] as visible in Figure 2 this traffic is segregated from the general Internet whenever
possible using an Optical Private Network (LHCOPN) The LHCOPN is a dedicated optical network
designed to connect CERN as T0 with all eleven T1 The high-level network design is shown in
Figure 2
Figure 2 The LHC-OPN network diagram
The twelve T01s are listed in Table1
Table 1 List of Tier 01s
T1 name T1 location
CA-TRIUMF Vancouver BC Canada
CH-CERN Geneva Switzerland
DE-KIT Karlsruhe Germany
ES-PIC Barcelona Spain
FR-CCIN2P3 Lyon France
IT-CNAF Bologna Italy
NDGF Stockholm Sweden
NL-T1 Amsterdam The Netherlands
TW-ASGC Taipei Taiwan
UK-T1-RAL Didcot United Kingdom
US-FNAL Batavia IL USA
US-T1-BNL Upton NY USA
The LHC-OPNrsquos agreed networking strategy is to use at least one dedicated 10 Gigabitseconds light
path between the T0 and each T1 This 10 Gigabitseconds light path terminates at a networking
International Conference on Computing in High Energy and Nuclear Physics 2012 (CHEP2012) IOP PublishingJournal of Physics Conference Series 396 (2012) 042060 doi1010881742-65963964042060
3
equipment at the T0 and inside or as close as possible to the T1 IPv4 has been chosen as the network
protocol to provide communications among the upper layer applications during the first stage other
network protocols such as IPv6 may be considered in the future Each Tier is encouraged to support a
Maximum Transmission Unit (MTU) size of at least 9000 bytes on the entire path between T0 and T1
From an architectural perspective the T0-T1 links should handle only production LHC data (LHC
Network Traffic) The routing among the T0 and T1s sites will be achieved using BGP (Border
Gateway Protocol) T1-T1 traffic via the T0 will also be allowed although T1s are encouraged to
provision adequate alternative connectivity for example using direct light path tunnel over IPMPLS
networks transit over IP backbones or any other suitable technology Some of the Tier 1s are
interconnected using cross-border fibres to provide a reliable backup as well as direct T1ndashT1
connectivity
Most of the analysis will be done in Tier2 research centres and labs and reliable networking started to
be needed to connect Tier2s among themselves and provide the right Tier2 to Tier1 connectivity
Having that in mind since beginning 2011 a new network started to be designed From the new
requirements
(httpindicocernchgetFilepyaccesscontribId=5ampresId=4ampmaterialId=0ampconfId=102716) ldquoData
should be able to be pulled [hellip] from any Tier-2 or even if possible from several Tier-2s
simultaneously in order to minimize the time to have the data locally to run the analysis taskrdquo
The answer was then the LHC Open Network Environment [2] an L3VPN based multipoint network
architecture whose design and implementation is still on-going at the time of writing
3 perfSONAR
31 The perfSONAR Framework
Performance Service-Oriented Network Monitoring Architecture (perfSONAR) is a framework
developed by a consortium of organisations (GEacuteANT ESnet Internet 2 and RNP) that enables
network performance information to be gathered and exchanged in a multi-domain federated
environment [4] The primary goals of perfSONAR are to enable ubiquitous gathering and sharing of
performance information simplify management of advanced networks facilitate cross-domain
troubleshooting and allow next-generation applications to tailor their execution to the state of the
network (as depicted in Figure 2)
From the userrsquos point of view perfSONAR can be considered as a set of distributed services which
offer a range of functionalities required by any well-defined and complete multi-domain monitoring
system Examples of functionalities implemented are storage of network information and
measurement results passive tests active tests authentication authorisation directory service and
visualisation The distributed services can run in multiple domains and communicate using a single
standard protocol ensuring that information is shared effectively and securely
International Conference on Computing in High Energy and Nuclear Physics 2012 (CHEP2012) IOP PublishingJournal of Physics Conference Series 396 (2012) 042060 doi1010881742-65963964042060
4
Authorized users can have access to network
performance for diagnosis
and troubleshooting
Figure 1 The perfSONAR objective cross-domain Network Information Availability
One of main advantages of the perfSONAR-based approach is that the network operators do not have
to abandon their existing monitoring tools Instead perfSONAR can be considered as an extension that
provides new features as well as uniform and standardised access to already deployed tools
The perfSONAR framework is built as a set of network performance middleware and visualisation
tools which meet a number of key requirements [6]
Standardised access to multi-domain network information
Increased efficiency through on-demand troubleshooting tools
Easy identification of information sources
Network performance validation
Optimised network usage through regular TCP (Transmission Control Protocol) throughput tests
Faster problem identification through consistent end-to-end service monitoring
Monitoring of virtual networks
Secure access
32 perfSONAR Main Components
The modular design and open-source nature of the perfSONAR services (and related code) allows
domain administrators to implement combine and customise tools according to their individual
requirements Domains can thus create ad-hoc distributed network monitoring systems with maximum
flexibility perfSONAR integrates all measurement tools by providing common services and
visualisation tools The complex set of perfSONAR services supports access to measurement data and
network information across multiple administrative domains Each individual service is in charge of a
specific functionality The following types of perfSONAR components are available
321 Measurement Points
Measurement Points (MPs) collect and publish data obtained (usually locally) using measurement
tools The measurement is carried out either on client demand or automatically at scheduled time
intervals The MP also provides an interface between the perfSONAR data format and the application
proprietary data structure
322 Measurement Archives
Measurement Archives (MAs) store measurement results in databases (for example SQL) or in file
systems (for example RRD files) This data can later be read by clients and further processed or
visualised MAs can also support data aggregation
International Conference on Computing in High Energy and Nuclear Physics 2012 (CHEP2012) IOP PublishingJournal of Physics Conference Series 396 (2012) 042060 doi1010881742-65963964042060
5
323 Lookup Services
Each network domain that joins the perfSONAR infrastructure should have a Lookup Service (LS)
All services in this domain can then register with the Lookup Service One of the interesting features
of this system is that Lookup Services of multiple network domains can communicate with each other
to share information about the registered services In this way any interested user only needs to know
the URL of one Lookup Service to be able to find out which other services are available in local and
external domains
324 Visualisation Tools
The perfSONAR MDM visualisation tools are user interfaces for querying perfSONAR services and
presenting the collected data to the user in front-end applications (eg perfSONAR UI) The open-
source nature of the visualisation tools means that the presentation of performance data can be adapted
to the needs of specific user groups
33 GEacuteANT perfSONAR MDM (Multi Domain Monitoring Service)
There are currently two main implementations used by the LHCONE and LHCOPN communities
perfSONAR MDM within GEacuteANT httpperfsonargeantnet
perfSONAR PS within I2ESnet httppspsperfsonarnet
LHC sites are typically free to choose the perfSONAR flavour they prefer according to factors like
geographical location availability of local support experience and expertise
perfSONAR MDM is designed to provide a service with federated deployment centrally monitored
and coordinated and full support perfSONAR PS has a distributed support model with the goal of
proliferating the number of performance nodes deployed across the community
The two deployments are committed to interoperate accepting each-other measurement requests
displaying results and storing metrics into archives available for all the sites part of the LHC
computing project This section will analyse in detail the GEacuteANT perfSONAR MDM structure and
measurement strategy
331 GEacuteANT MDM Service Strategy
The GEacuteANT Multi-Domain Monitoring (MDM) Service [5] offers a unified view of the network
status and information across all sites The GEacuteANT MDM infrastructure is usually deployed close to
the border routers (administrative boundaries) this sets clear demarcation points and creates a
distinction between issues affecting the managed network and issues affecting the sitesrsquo network
The GEacuteANT MDM service uses perfSONAR as it base service The main objective of the service is to
correctly efficiently and quickly identify network problems occurring on any part of a network
operated in a multi-domain environment The service aims to provide fast reliable and uninterrupted
network communication tracking issues across multiple domains [5]
The strategy adopted is to perform network monitoring activities in different network domains
making the information available using a common protocol and cross-domain monitoring This
common infrastructure enables access to network performance metrics from across multiple domains
enabling network problems and performance bottlenecks to be traced and quickly eliminated Finally
whenever possible the GEacuteANT MDM service can be used to proactively identify and prevent
problems before service disruption occurs
34 perfSONAR Tools
perfSONAR MDM and PS currently include a set of tools that cover the most important areas of
network monitoring and measurements at the IP layer or above In particular it includes throughput
delay and passive measurement tools which are described in the following sections
International Conference on Computing in High Energy and Nuclear Physics 2012 (CHEP2012) IOP PublishingJournal of Physics Conference Series 396 (2012) 042060 doi1010881742-65963964042060
6
341 Throughput Measurement Tools
Throughput measurement is performed using the perfSONAR BWCTL MP a measurement point
based on the Internet2rsquos Bandwidth Controller (BWCTL) software The client can specify
measurement and data flow parameters for the actual bandwidth determination (such as the window
size for TCP or the socket buffer for UDP) and the protocol (IPv4 or IPv6) allowing exhaustive
checks and effective troubleshooting for different network end-point setups
342 Delay Measurement Tools
Delay measurements are based on the Hades Active Delay Evaluation System (HADES) and the One-
Way Active Measurement Protocol (OWAMP) infrastructures HADES devices were initially
developed by WiN-Labor at RRZE (Regional Computing Centre Erlangen) They provide Quality of
Service (QoS) measurements in DFNs G-WiN infrastructure based on the metrics developed by the
IETF IPPM WG and later extended to numerous GEacuteANT Points of Presence (PoPs) This system
enables the network operators and systems administrators to obtain parameters derived from a
timestamped flow of probing packets This includes one-way delay [RFC2679] delay jitter
[RFC3393] packet loss rate [RFC2680] and alternative path routes
OWAMP (httpwwwinternet2eduperformanceowamp) is a command line client application and a
policy daemon used to determine one way latencies between hosts It is an implementation of the
OWAMP protocol as defined by httpwwwrfc-editororgrfcrfc4656txt OWAMP session control
uses traditional client-server communication between a control-client and a server using the
OWAMP-Control protocol The owampd server is implemented using the conventional acceptfork
model The two sides negotiate one-way test parameters using the OWAMP-Control protocol This
OWAMP implementation then forks additional processes to actually send and receive the OWAMP-
Test formatted packets that implement the session endpoints for the Sender and Receiver roles
343 Passive Measurement Tools
perfSONAR tools based on passive monitoring have recently been developed (eg PacketLoss) or are
under development (eg ABW2) Many network parameters and characteristics can only be obtained
using passive measurement which does not influence the network traffic This includes classification
of flows link load measurements and exact packet loss of real data flows
344 GEacuteANT MDM Service Operations
Once a GEacuteANT MDM service is deployed the service is in operational status and is monitored using
the operational components and processes described below to monitor service availability
GEacuteANT MDM service applications are composed of three layers a service layer an underlying layer
and a hardware layer The service layer is represented by the software implementing the application
interface (typically a web service API) and support software for this layer The second layer is the
resource layer containing software components such as daemons measurement tool clients (Net-
SNMP client as an example) data files andor databases and configuration files The third layer is
related to hardware resources such as CPU Load Average Memory Network Interfaces and
Partitions This service structure is illustrated in Figure 4
International Conference on Computing in High Energy and Nuclear Physics 2012 (CHEP2012) IOP PublishingJournal of Physics Conference Series 396 (2012) 042060 doi1010881742-65963964042060
7
Hardware Layer
CPULoad
AverageMemory
Network
InterfacePartitions
Resource Layer
Configuration
FilesData Files
Measurement
Daemons
Measurement
Tools Clients
Service Layer
Web-ServicesApplication
service interface
Application
APIs
Figure 4 GEacuteANT MDM Service General Application Structure
The monitoring of the health of the overall application reflects the status of the components in the
three layers Effective monitoring performed at different hierarchical levels allows operators to
correctly identify problems proactively notify parties responsible and take remedial actions
Service Layer
The service layer is the application layer directly accessible by the end user It is typically
implemented through a web service so monitoring is focused on checking the availability and
performance of this interface
At this layer using only some web-service messages on the application side allows the verification of
web-service availability and its performance (eg loss delays and uptime) Such an implementation
also enables the verification of service downtime which could trigger any service recovery procedure
Resource Layer
Monitoring availability and performance at the service layer as described in the previous section is
not sufficient to ensure that a web service correctly delivers the required functionality to users In
general terms the resource layer grants the upper layer access to the resources it needs to correctly
provide a service to the user Any problems relating to database access Round Robin Data (RRD) file
existence or measurement tool daemons functionality is monitored at this level This layer is
monitored using an internal special message sent to the service which verifies the health of the
components used by the service
Hardware Layer
Hardware layer monitoring has a primary role in the correct diagnosis of problems Correct monitoring
of the hardware availability and performance enables a pro-active response preventing service
disruption to the user It also permits an understanding of the causes of issues detected at higher levels
such as problems reported by the resource andor service layers
Hardware resources are monitored using existing Simple Network Management Protocol (SNMP)
[RFC 1157] infrastructure The SNMP agent installed on each server is queried on a regular basis by a
central SNMP manager to gather relevant information from the server SNMP was chosen because it is
a common standard for monitoring and once running as a separate application on the server it is not
influenced by specific service failures Also SNMP agents already have hardware variables present
345 Monitoring the perfSONAR service the GEacuteANT Monitoring Infrastructure
This infrastructure consists of a fault and capacity monitoring tool which enables service engineers to
pro-actively deal with events before these become incidents which interrupt the service
International Conference on Computing in High Energy and Nuclear Physics 2012 (CHEP2012) IOP PublishingJournal of Physics Conference Series 396 (2012) 042060 doi1010881742-65963964042060
8
Nagios [8] was chosen as the event management tool since it includes features such as host and
service monitoring and alerting on different sets of events based on their criticality It enables the
support team to react to the current status of the infrastructure provides reports of the performance of
the service monitored for trend analysis allows the flagging of scheduled maintenances and finally is
a good dashboard tool that enables the supporting team to plan any kind of upgrade andor
modification on the monitored infrastructure Nagios is a flexible and customizable framework which
allows monitoring extensions to be created for any type of service A screenshot of Nagios is shown in
Figure 5
Figure 5 Event Management Infrastructure developed for LHCOPN in Nagios
Since Nagios only supports event management Cacti [9] was selected for capacity management Cacti
offers a complete network graphing solution has a fast poller advanced graph templating multiple
data acquisition methods and standard user management features [10] Cacti was integrated with
Nagios via the Nagios plug-in for Cacti enabling regular data imports which provide a historical view
of service performance metrics A screenshot of Cacti is shown in Figure 6
International Conference on Computing in High Energy and Nuclear Physics 2012 (CHEP2012) IOP PublishingJournal of Physics Conference Series 396 (2012) 042060 doi1010881742-65963964042060
9
Figure 6 Capacity Management Infrastructure in Cacti
4 GEacuteANT visualization tools for LHCOPN and LHCONE
In the past two years GEacuteANT developed a series of visualization tools for the LHC project aiming at
collecting data from both perfSONAR MDM and perfSONAR PS sites and show them in a coherent
way This section contains some screenshots taken from the user interfaces currently developed for the
T0 and T1 sites
41 perfSONAR web user interface
Since 2011 perfSONAR MDM has a new web interface [11] and a special version of this tool has been
made available for the LHC community [12]
The interface offers a comprehensive access to the following metrics
Link utilisation with possibility to compare two links
One-way delay
One-way delay variation
Packet loss
Hopcount (traceroute monitoring) with route comparison
Regularly scheduled bandwidth measurement
On-demand bandwidth measurement
from a single URL The interface has been designed in collaboration with a panel of real users and it is
currently used by GEacuteANT Network Operation Centre (NOC) engineers and gradually adopted by
European NOCs Its design has been professionally reviewed by a usability expert and it is
customisable in terms of security and access rights It is easy to manage and Debian and Redhat
packages have been made available A live virtual machine is also available for download from the
perfSONAR MDM website [11]
Figures 7-10 show how different metrics can be successfully accessed and visualised coherently using
the web interface
International Conference on Computing in High Energy and Nuclear Physics 2012 (CHEP2012) IOP PublishingJournal of Physics Conference Series 396 (2012) 042060 doi1010881742-65963964042060
10
Figure 7 Link utilisation on the perfSONAR MDM user interface
Figure 8 One-Way Delay Jitter Packet Loss and Traceroute on the perfSONAR MDM user interface
Figure 9 Accessing BWCTL Historic Measurements on the perfSONAR MDM user interface
International Conference on Computing in High Energy and Nuclear Physics 2012 (CHEP2012) IOP PublishingJournal of Physics Conference Series 396 (2012) 042060 doi1010881742-65963964042060
11
Figure 10 Making an on-demand BWCTL measurement on the perfSONAR MDM user interface
42 perfSONAR MDM weathermap for LHCOPN
At the end of 2011 a weather map reading live perfSONAR MDM data was prepared for the LHCOPN
community (and one is currently under design for the LHCONE) The map gives access to 19 different
metrics offering a colour-coding view according to the metric chosen The available metrics include
OWD
Jitter
Packet Loss
Bandwidth
Link Utilisation Input errors Discarded packets
Figures 11 shows how it is possible to select one of metrics and Figure 12 shows the final result a
coloured live customised LHCOPN map
Figure 11 Choosing metric on the weathermap
International Conference on Computing in High Energy and Nuclear Physics 2012 (CHEP2012) IOP PublishingJournal of Physics Conference Series 396 (2012) 042060 doi1010881742-65963964042060
12
Figure 12 The weathermap coloured according the One-Way Delay
5 Conclusions
Supporting the monitoring of the LHCOPN and LHCONE infrastructure is an extremely challenging
task particularly exciting as the LHC went into its data taking era The new web interfaces designed
and customised for the LHC community are creating a big difference in the way monitoring
information is gathered visualised and correlated across three continents
The authors of this paper would like to thank all the perfSONAR community for their support
including the GEacuteANT partners who were involved on the service deployment for the LHC-OPN We
are grateful for the support of DANTE in providing the infrastructure to accomplish the work required
and to the perfSONAR development team who provided the required tools to build up the service
Finally thanks to CERN and its partners for deploying the service
References
[1] CERN - The Large Hadron Collider Website httppublicwebcernchpublicenLHC
[2] LHCOPN - Large Hadron Collider Optical Private Network Website
httpstwikicernchtwikibinviewLHCOPNWebHome LHCONE - Large Hadron Collider Open
Network Environment Website httplhconenet
[3] perfSONAR - Performance focused Service Oriented Network monitoring Architecture Website
httpwwwperfsonarnet
[4] perfSONAR datasheet
httpwwwgeantnetMedia_CentreMedia_LibraryMedia20LibraryPUB20122005320perfso
nar20datasheet200512pdf
[5] perfSONAR MDM Website httpperfsonargeantnet
[6] Dijkstra F Fried A et al GEacuteANT Deliverable DJ231 ldquoSpecification of Advanced Features for
a Multi-Domain Monitoring Infrastructurerdquo
[7] Tierney B Metzger J et al ldquoperfSONAR Instantiating a Global Network Measurement
Frameworkrdquo
[8] Nagios Website httpwwwnagiosorg
[9] CACTI Website httpwwwcactinet
[10] Nagios Plugin for Cacti (NPC) Website httptrac2assemblacomnpc
[11] perfSONAR MDM web interface httppsuigeantnet
[12] perfSONAR MDM web interface for the LHC community httppsui-lhcgridaaudkperfsonar-
ui
International Conference on Computing in High Energy and Nuclear Physics 2012 (CHEP2012) IOP PublishingJournal of Physics Conference Series 396 (2012) 042060 doi1010881742-65963964042060
13

Hardware Layer
CPULoad
AverageMemory
Network
InterfacePartitions
Resource Layer
Configuration
FilesData Files
Measurement
Daemons
Measurement
Tools Clients
Service Layer
Web-ServicesApplication
service interface
Application
APIs
Figure 4 GEacuteANT MDM Service General Application Structure
The monitoring of the health of the overall application reflects the status of the components in the
three layers Effective monitoring performed at different hierarchical levels allows operators to
correctly identify problems proactively notify parties responsible and take remedial actions
Service Layer
The service layer is the application layer directly accessible by the end user It is typically
implemented through a web service so monitoring is focused on checking the availability and
performance of this interface
At this layer using only some web-service messages on the application side allows the verification of
web-service availability and its performance (eg loss delays and uptime) Such an implementation
also enables the verification of service downtime which could trigger any service recovery procedure
Resource Layer
Monitoring availability and performance at the service layer as described in the previous section is
not sufficient to ensure that a web service correctly delivers the required functionality to users In
general terms the resource layer grants the upper layer access to the resources it needs to correctly
provide a service to the user Any problems relating to database access Round Robin Data (RRD) file
existence or measurement tool daemons functionality is monitored at this level This layer is
monitored using an internal special message sent to the service which verifies the health of the
components used by the service
Hardware Layer
Hardware layer monitoring has a primary role in the correct diagnosis of problems Correct monitoring
of the hardware availability and performance enables a pro-active response preventing service
disruption to the user It also permits an understanding of the causes of issues detected at higher levels
such as problems reported by the resource andor service layers
Hardware resources are monitored using existing Simple Network Management Protocol (SNMP)
[RFC 1157] infrastructure The SNMP agent installed on each server is queried on a regular basis by a
central SNMP manager to gather relevant information from the server SNMP was chosen because it is
a common standard for monitoring and once running as a separate application on the server it is not
influenced by specific service failures Also SNMP agents already have hardware variables present
345 Monitoring the perfSONAR service the GEacuteANT Monitoring Infrastructure
This infrastructure consists of a fault and capacity monitoring tool which enables service engineers to
pro-actively deal with events before these become incidents which interrupt the service
International Conference on Computing in High Energy and Nuclear Physics 2012 (CHEP2012) IOP PublishingJournal of Physics Conference Series 396 (2012) 042060 doi1010881742-65963964042060
8
Nagios [8] was chosen as the event management tool since it includes features such as host and
service monitoring and alerting on different sets of events based on their criticality It enables the
support team to react to the current status of the infrastructure provides reports of the performance of
the service monitored for trend analysis allows the flagging of scheduled maintenances and finally is
a good dashboard tool that enables the supporting team to plan any kind of upgrade andor
modification on the monitored infrastructure Nagios is a flexible and customizable framework which
allows monitoring extensions to be created for any type of service A screenshot of Nagios is shown in
Figure 5
Figure 5 Event Management Infrastructure developed for LHCOPN in Nagios
Since Nagios only supports event management Cacti [9] was selected for capacity management Cacti
offers a complete network graphing solution has a fast poller advanced graph templating multiple
data acquisition methods and standard user management features [10] Cacti was integrated with
Nagios via the Nagios plug-in for Cacti enabling regular data imports which provide a historical view
of service performance metrics A screenshot of Cacti is shown in Figure 6
International Conference on Computing in High Energy and Nuclear Physics 2012 (CHEP2012) IOP PublishingJournal of Physics Conference Series 396 (2012) 042060 doi1010881742-65963964042060
9
Figure 6 Capacity Management Infrastructure in Cacti
4 GEacuteANT visualization tools for LHCOPN and LHCONE
In the past two years GEacuteANT developed a series of visualization tools for the LHC project aiming at
collecting data from both perfSONAR MDM and perfSONAR PS sites and show them in a coherent
way This section contains some screenshots taken from the user interfaces currently developed for the
T0 and T1 sites
41 perfSONAR web user interface
Since 2011 perfSONAR MDM has a new web interface [11] and a special version of this tool has been
made available for the LHC community [12]
The interface offers a comprehensive access to the following metrics
Link utilisation with possibility to compare two links
One-way delay
One-way delay variation
Packet loss
Hopcount (traceroute monitoring) with route comparison
Regularly scheduled bandwidth measurement
On-demand bandwidth measurement
from a single URL The interface has been designed in collaboration with a panel of real users and it is
currently used by GEacuteANT Network Operation Centre (NOC) engineers and gradually adopted by
European NOCs Its design has been professionally reviewed by a usability expert and it is
customisable in terms of security and access rights It is easy to manage and Debian and Redhat
packages have been made available A live virtual machine is also available for download from the
perfSONAR MDM website [11]
Figures 7-10 show how different metrics can be successfully accessed and visualised coherently using
the web interface
International Conference on Computing in High Energy and Nuclear Physics 2012 (CHEP2012) IOP PublishingJournal of Physics Conference Series 396 (2012) 042060 doi1010881742-65963964042060
10
Figure 7 Link utilisation on the perfSONAR MDM user interface
Figure 8 One-Way Delay Jitter Packet Loss and Traceroute on the perfSONAR MDM user interface
Figure 9 Accessing BWCTL Historic Measurements on the perfSONAR MDM user interface
International Conference on Computing in High Energy and Nuclear Physics 2012 (CHEP2012) IOP PublishingJournal of Physics Conference Series 396 (2012) 042060 doi1010881742-65963964042060
11
Figure 10 Making an on-demand BWCTL measurement on the perfSONAR MDM user interface
42 perfSONAR MDM weathermap for LHCOPN
At the end of 2011 a weather map reading live perfSONAR MDM data was prepared for the LHCOPN
community (and one is currently under design for the LHCONE) The map gives access to 19 different
metrics offering a colour-coding view according to the metric chosen The available metrics include
OWD
Jitter
Packet Loss
Bandwidth
Link Utilisation Input errors Discarded packets
Figures 11 shows how it is possible to select one of metrics and Figure 12 shows the final result a
coloured live customised LHCOPN map
Figure 11 Choosing metric on the weathermap
International Conference on Computing in High Energy and Nuclear Physics 2012 (CHEP2012) IOP PublishingJournal of Physics Conference Series 396 (2012) 042060 doi1010881742-65963964042060
12
Figure 12 The weathermap coloured according the One-Way Delay
5 Conclusions
Supporting the monitoring of the LHCOPN and LHCONE infrastructure is an extremely challenging
task particularly exciting as the LHC went into its data taking era The new web interfaces designed
and customised for the LHC community are creating a big difference in the way monitoring
information is gathered visualised and correlated across three continents
The authors of this paper would like to thank all the perfSONAR community for their support
including the GEacuteANT partners who were involved on the service deployment for the LHC-OPN We
are grateful for the support of DANTE in providing the infrastructure to accomplish the work required
and to the perfSONAR development team who provided the required tools to build up the service
Finally thanks to CERN and its partners for deploying the service
References
[1] CERN - The Large Hadron Collider Website httppublicwebcernchpublicenLHC
[2] LHCOPN - Large Hadron Collider Optical Private Network Website
httpstwikicernchtwikibinviewLHCOPNWebHome LHCONE - Large Hadron Collider Open
Network Environment Website httplhconenet
[3] perfSONAR - Performance focused Service Oriented Network monitoring Architecture Website
httpwwwperfsonarnet
[4] perfSONAR datasheet
httpwwwgeantnetMedia_CentreMedia_LibraryMedia20LibraryPUB20122005320perfso
nar20datasheet200512pdf
[5] perfSONAR MDM Website httpperfsonargeantnet
[6] Dijkstra F Fried A et al GEacuteANT Deliverable DJ231 ldquoSpecification of Advanced Features for
a Multi-Domain Monitoring Infrastructurerdquo
[7] Tierney B Metzger J et al ldquoperfSONAR Instantiating a Global Network Measurement
Frameworkrdquo
[8] Nagios Website httpwwwnagiosorg
[9] CACTI Website httpwwwcactinet
[10] Nagios Plugin for Cacti (NPC) Website httptrac2assemblacomnpc
[11] perfSONAR MDM web interface httppsuigeantnet
[12] perfSONAR MDM web interface for the LHC community httppsui-lhcgridaaudkperfsonar-
ui
International Conference on Computing in High Energy and Nuclear Physics 2012 (CHEP2012) IOP PublishingJournal of Physics Conference Series 396 (2012) 042060 doi1010881742-65963964042060
13
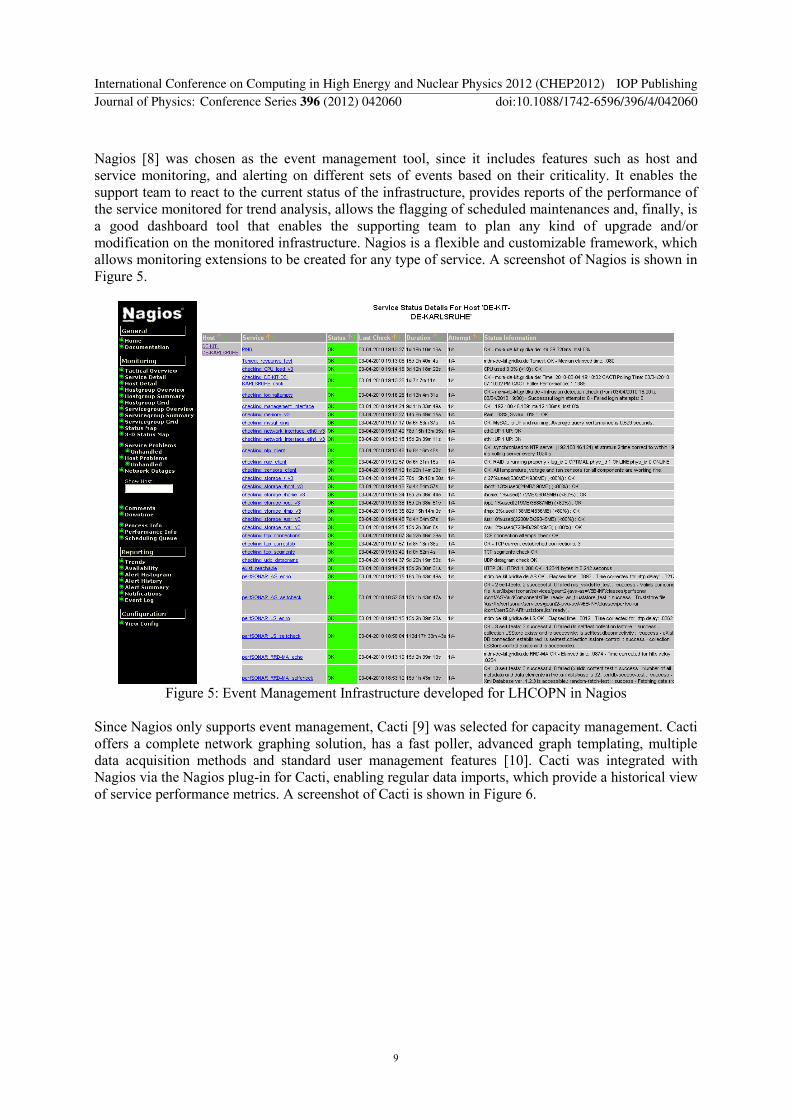